UNITED STATES
SECURITIES AND EXCHANGE COMMISSION
Washington, D.C. 20549
FORM 6-K
REPORT OF FOREIGN PRIVATE ISSUER
PURSUANT TO RULE 13A-16 OR 15D-16 OF
THE SECURITIES EXCHANGE ACT OF 1934
For the month of September 2023
Commission File Number: 001-34244
HUDBAY MINERALS INC.
(Translation of registrant’s name into English)
25 York Street, Suite 800
Toronto, Ontario
M5J 2V5, Canada
(Address of principal executive offices)
Indicate by check mark whether the registrant files or will file annual reports under cover of Form 20-F or Form 40-F.
Form 20-F [ ] Form 40-F [X]
Indicate by check mark if the registrant is submitting the Form 6-K in paper as permitted by Regulation S-T Rule 101(b)(1): [ ]
Indicate by check mark if the registrant is submitting the Form 6-K in paper as permitted by Regulation S-T Rule 101(b)(7): [ ]
Indicate by check mark whether the registrant by furnishing the information contained in this Form is also thereby furnishing the information to the Commission pursuant to Rule 12g3-2(b) under the Securities Exchange Act of 1934.
Yes [ ] No [X]
If “Yes” is marked, indicate below the file number assigned to the registrant in connection with Rule 12g3-2(b): 82- _____________________________
EXPLANATORY NOTE
On September 8, 2023, Hudbay Minerals Inc. (“Hudbay”) filed on the Canadian Securities Administrators’ System for Electronic Document Analysis and Retrieval (SEDAR) website at www.sedarplus.ca the following documents: (1) News Release - September 8, 2023, (2) NI 43-101 Technical Report, Phase I Pre-Feasibility Study and Updated Mineral Resource Estimates, Copper World Project, Pima County, Arizona, USA, (3) Consent of Qualified Person, (4) Certificate of Qualified Person.
Copies of the filings are attached to this Form 6-K and incorporated herein by reference, as follows:
-
Exhibit 99.1 — News Release - September 8, 2023
-
Exhibit 99.2 — NI 43-101 Technical Report, Phase I Pre-Feasibility Study and Updated Mineral Resource Estimates, Copper World Project, Pima County, Arizona, USA
-
Exhibit 99.3 — Consent of Qualified Person
-
Exhibit 99.4 — Certificate of Qualified Person
2
SIGNATURE
Pursuant to the requirements of the Securities Exchange Act of 1934, the registrant has duly caused this report to be signed on its behalf by the undersigned, thereunto duly authorized.
| |
HUDBAY MINERALS INC. |
| |
(registrant) |
| |
|
|
| |
By: |
/s/ Mark Haber |
| |
Name: |
Mark Haber |
| |
Title: |
Executive Director, Legal and Corporate Secretary |
Date: September 11, 2023
3
EXHIBIT INDEX
The following exhibits are furnished as part of this Form 6-K:
4
 |
News Release
TSX, NYSE – HBM
2023 No. 21
|
Hudbay De-risks Copper World Phase I with Enhanced Pre-Feasibility Study
- Phase I, which is a standalone operation requiring only state and local permits for an extended 20-year mine life, has an after-tax net present value (8%) of $1.1 billion and generates a 19% internal rate of return at a copper price of $3.75 per pound.
- Average annual copper production over the first ten years of approximately 92,000 tonnes at cash costs and sustaining cash costs of $1.53 and $1.95 per pound of copperi, respectively.
- Extended Phase I mine life to 20 years, with the potential for further expansion, compared to 16 years in the previous study with an 18% increase to total copper production and higher mill head grades.
- Lowered initial capital cost estimate to approximately $1.3 billion ($1.1 billion net of existing stream agreement), compared to $1.9 billion in the previous preliminary economic assessment, due to the deferral of the construction of a concentrate leach facility to year 4 with the potential to be fully funded from operating cash flows or benefit from future government incentives for critical minerals processing.
- Simplified project flow sheet includes a 60,000 ton per day sulfide concentrator that will produce copper concentrate as a final product until the addition of a concentrate leach facility and a solvent extraction and electrowinning plant in year 5 that will allow the project to produce copper cathodes. The production of copper cathodes will reduce the project's carbon footprint, make Copper World the third largest domestic copper cathode producer in the United Statesii and bolster the country's green energy independence with "Made in America" copper.
- Total GHG emissions are expected to be 14% lower compared to an operation that only produces copper concentrate.
- Significant benefits for the community and local economy in Arizona through payment of more than $850 million in U.S. federal and state taxes and the creation of an estimated 400 direct and 3,000 indirect jobs.
- Copper World is one of the highest-grade open pit copper projects in the Americasiii with proven and probable mineral reserves of 385 million tonnes at 0.54% copper.
- Together with the pre-feasibility study, Hudbay has updated the mineral resource estimates for the project, which increases the global measured and indicated mineral resources (inclusive of mineral reserves) to 1.2 billion tonnes at 0.42% copper, representing a 4% increase in total in-situ copper. This confirms significant upside at Copper World with an intended Phase II expansion of mining activities onto federal land to further enhance the project economics and extend the mine life well beyond 20 years.
Toronto, Ontario, September 8, 2023 - Hudbay Minerals Inc. ("Hudbay" or the "company") (TSX, NYSE: HBM) today announced the results of the enhanced pre-feasibility study ("PFS") for Phase I of its 100%-owned Copper World project in Arizona. All dollar amounts are in US dollars, unless otherwise noted. "Tonnes" refer to metric tonnes and "tons" refer to imperial or U.S. short tons.
"The PFS for Phase I of Copper World significantly enhances the economics and de-risks the project through higher levels of engineering, a simplified project design, lower upfront capex and a longer mine life," said Peter Kukielski, Hudbay's President and Chief Executive Officer. "Copper World is an attractive copper growth project for Hudbay and our stakeholders, generating strong project returns and bringing many benefits to the community and local economy in Arizona. We will continue to be prudent with our financing plans for Copper World as we remain focused on meeting all of the prerequisites for project sanctioning as laid out in our 3-P plan in October 2022."
2023 PFS Summary
The PFS reflects the results of the company's further technical work on the first phase of the Copper World project. Phase I is a standalone operation requiring state and local permits only. Phase I has a mine life of 20 years, which is four years longer than the Phase I mine life that was presented in the preliminary economic assessment published in June 2022 ("2022 PEA") due to an increase in the capacity for tailings and waste deposition as a result of optimizing the site layout. The second phase of the project is expected to involve an expansion onto federal lands with an extended mine life and enhanced project economics. Phase II would be subject to the federal permitting process and has not been included in the PFS results.
Phase I contemplates average annual copper production of 85,000 tonnes over a 20-year mine life, at average cash costs and sustaining cash costs of $1.47 and $1.81 per pound of copperi, respectively. A variable cut-off grade strategy allows for higher mill head grades in the first ten years, which increases annual production to approximately 92,000 tonnes of copper at average cash costs and sustaining cash costs of $1.53 and $1.95 per pound of copperi, respectively.
At a copper price of $3.75 per pound, the after-tax net present value ("NPV") of Phase I using an 8% discount rate is $1.1 billion and the internal rate of return ("IRR") is 19%. The valuation metrics are leveraged to higher copper prices and at a price of $4.25 per pound, the after-tax NPV (8%) of Phase I increases to $1.7 billion, and the IRR increases to 25.5%. In the flotation only scenario, the project has an after-tax NPV (8%) of $863 million, an after-tax IRR of 18.7% and a payback period of 5.3 years at $3.75 per pound copper. At a copper price of $4.25 per pound, the flotation only NPV (8%) increases to $1.5 billion and the IRR increases to 25.7%. These economics demonstrate the project is robust even without the concentrate leach facility, providing Hudbay with flexibility to optimize the project in the future through funding the addition of the concentrate leach facility with operating cash flows or potential government incentives for critical minerals processing.
A summary of key valuation, production and cost details from the PFS can be found below. For further details, including operating and cash flow metrics provided on an annual basis, please refer to Exhibit 1 at the end of this news release.
| Summary of Key Metrics (at $3.75/lb Cu) |
| Valuation Metrics (Unlevered)1 |
Unit |
|
Phase I |
|
| Net present value @ 8% (after-tax) |
$ millions |
|
$1,100 |
|
| Net present value @ 10% (after-tax) |
$ millions |
|
$771 |
|
| Internal rate of return (after-tax) |
% |
|
19.2% |
|
| Payback period |
# years |
|
5.9 |
|
| Project Metrics |
Unit |
|
Phase I |
|
| Growth capital - initial |
$ millions |
|
$1,323 |
|
| Construction length - conc process plant |
# years |
|
2.5 |
|
| Growth capital - conc leach facility (yr 4) |
$ millions |
|
$367 |
|
| Construction length - conc leach facility |
# years |
|
1.0 |
|
| Operating Metrics |
Unit |
Year 1-10 |
Year 11-20 |
Phase I |
| Copper production (annual avg.)2 |
000 tonnes |
92.3 |
77.5 |
85.3 |
| EBITDA (annual avg.)3 |
$ millions |
$404 |
$339 |
$372 |
| Sustaining capital (annual avg.)4 |
$ millions |
$33.9 |
$19.4 |
$27.1 |
| Cash cost5 |
$/lb Cu |
$1.53 |
$1.39 |
$1.47 |
| Sustaining cash cost5 |
$/lb Cu |
$1.95 |
$1.62 |
$1.81 |
1 Calculated assuming the following commodity prices: copper price of $3.75 per pound, copper cathode premium of $0.02 per pound (net of cathode freight charges), gold stream price of $450 per ounce, silver stream price of $3.90 per ounce and molybdenum price of $12.00 per pound. Reflects the terms of the existing Wheaton Precious Metals stream, including an upfront deposit of $230 million in the first year of Phase I construction in exchange for the delivery of 100% of gold and silver produced.
2 Copper production includes copper contained in concentrate sold and copper cathode produced from the concentrate leach facility. Average annual copper production excludes partial year of production in year 20.
3 EBITDA is a non-IFRS financial performance measure with no standardized definition under IFRS. For further information, please refer to the company's Management's Discussion and Analysis for the three and six months ended June 30, 2023.
4 Sustaining capital expenditures include the benefit of capital leasing of mobile equipment.
5 Cash cost and sustaining cash cost exclude the cost of purchasing external concentrate, which may vary in price and or potentially be replaced with additional internal feed. By-product credits calculated using amortization of deferred revenue for gold and silver stream sales as per the company's approach in its quarterly financial reporting. By-product credits also include the revenue from the sale of excess acid produced at a price of $145 per tonne. Sustaining cash cost includes sustaining capital expenditures and royalties. Cash cost and sustaining cash cost are non-IFRS financial performance measures with no standardized definition under IFRS. For further details on why Hudbay believes cash costs are a useful performance indicator, please refer to the company's Management's Discussion and Analysis for the three and six months ended June 30, 2023.
| Sensitivity Analysis |
|
|
|
|
|
|
|
| Copper Price |
Unit |
$3.25/lb |
$3.50/lb |
$3.75/lb |
$4.00/lb |
$4.25/lb |
$4.50/lb |
| Net present value1 @ 8% |
$ millions |
$463 |
$786 |
$1,100 |
$1,409 |
$1,710 |
$2,006 |
| Net present value1 @ 10% |
$ millions |
$227 |
$503 |
$771 |
$1,033 |
$1,289 |
$1,540 |
| Internal rate of return1 |
% |
12.7% |
16.0% |
19.2% |
22.4% |
25.5% |
28.5% |
| Payback period |
# years |
7.9 |
6.7 |
5.9 |
5.4 |
5.0 |
4.4 |
| EBITDA (annual avg.)2 |
$ millions |
288 |
330 |
$372 |
413 |
455 |
497 |
Concentrate Leach
Facility (at $3.75/lb Cu) |
Unit |
No Conc Leach
(Flotation Only) |
50%
Capacity in
Year 5
(Base Case) |
50%
Capacity in
Year 1 |
100%
Capacity in
Year 5 |
100%
Capacity in
Year 1 |
| Net present value1 @ 8% |
$ millions |
$863 |
$1,100 |
$1,222 |
$1,302 |
$1,523 |
| Net present value1 @ 10% |
$ millions |
$605 |
$771 |
$869 |
$922 |
$1,105 |
| Internal rate of return1 |
% |
18.7% |
19.2% |
19.6% |
20.0% |
21.0% |
| Payback period |
# years |
5.3 |
5.9 |
5.1 |
6.0 |
4.8 |
| EBITDA (annual avg.) 2 |
$ millions |
$296 |
$372 |
$389 |
$413 |
$441 |
| Copper production (annual avg.)3 |
000 tonnes |
85.8 |
85.3 |
85.1 |
118.0 |
124.5 |
| Cash cost4 |
$/lb Cu |
$1.81 |
$1.47 |
$1.39 |
$1.43 |
$1.34 |
| Sustaining cash cost4 |
$/lb Cu |
$2.15 |
$1.81 |
$1.73 |
$1.77 |
$1.69 |
| |
|
|
|
|
|
|
|
|
|
|
|
1 Net present value and internal rate of return are shown on an after-tax basis.
2 EBITDA is a non-IFRS financial performance measure with no standardized definition under IFRS. For further information, please refer to the company's Management's Discussion and Analysis for the three and six months ended June 30, 2023.
3 Copper production includes copper contained in concentrate sold and copper cathode produced from the concentrate leach facility. In the 100% Albion scenarios, the production facilities are assumed to have an increased annual capacity of 140,000 tonnes of copper cathode, providing the opportunity to purchase third party concentrate to maximize the utilization of the SX/EW facility. Average annual copper production excludes partial year of production in year 20.
4 Cash cost and sustaining cash cost exclude the cost of purchasing external concentrate, which may vary in price and or potentially be replaced with additional internal feed. By-product credits calculated using amortization of deferred revenue for gold and silver stream sales as per the company's approach in its quarterly financial reporting. By-product credits also include the revenue from the sale of excess acid produced at a price of $145 per tonne. Sustaining cash cost includes sustaining capital expenditures and royalties. Cash cost and sustaining cash cost are non-IFRS financial performance measures with no standardized definition under IFRS. For further details on why Hudbay believes cash costs are a useful performance indicator, please refer to the company's Management's Discussion and Analysis for the three and six months ended June 30, 2023.
Simplified Project Design
Copper World is planned to be a traditional open pit shovel and truck operation with a conventional flotation concentrator producing copper concentrate and molybdenum concentrate, with an expansion of the processing facility to include a copper concentrate leach facility in year 5, producing copper cathode and silver/gold doré.
The overall mining operation is expected to consist of four open pits in Phase I, as shown in Figure 1, with similar processing infrastructure as contemplated in the 2022 PEA. The mine plan for Phase I is now optimized solely on the flotation of both copper sulfides and oxides.
The concentrator during Phase I will have an installed capacity of 60,000 tons per day with conventional crushing, grinding, flotation, molybdenum separation, concentrate dewatering and tailings thickening. For the first 4 years, the final product is a copper concentrate sold to market. The processing plant is expected to be expanded by year 5 with the construction of a concentrate leach facility in year 4, which will produce copper cathodes and silver/gold doré. The concentrate leach facility will also include sulfur flotation, an acid plant, an SX/EW plant and a Merrill Crowe circuit for precious metals. Please refer to Figure 2 for an overview of the plant layout. The concentrate leach facility will also produce sulfur which will be processed into sulfuric acid at the acid plant. When sulfur production from the concentrate leach process is insufficient to fill the sulfuric acid plant capacity, sulfur will be purchased at local market price. When sulfuric acid production exceeds the concentrate leach requirements, the excess will be sold.
As part of the PFS, detailed test work was completed on the different concentrate leach technologies, including Glencore Technology's Albion Process ("Albion") as well as low and high temperature pressure oxidation. The tests indicate Albion and high temperature pressure oxidation yield the highest copper extraction rates in the range of 97% to 99% for all samples. Albion was selected as the preferred concentrate leach technology because it is simpler to operate, is modular and offers flexibility to scale the plant and has significantly lower acid neutralization requirements when compared to high temperature pressure oxidation.
The concentrate leach facility is sized at 70,000 tonnes of copper cathode during Phase I, which represents 50% of the maximum 140,000-tonne design capacity. In the PFS, there remains the opportunity to process third party feed during the last two years of the mine life to maximize the utilization of the SX/EW facility. Given the modular nature of the Albion technology, there also remains the opportunity to increase the scale of the concentrate leach facility up to the maximum design capacity, which will allow for the processing of additional internal concentrates or third party feed and further increase the NPV and IRR as shown in the sensitivity analysis table on the previous page.
The PFS contemplates the construction of three tailings storage facilities for Phase I and provides storage for 385 million tonnes, sufficient for 20 years of mine life on land requiring state and local permits only. Please refer to Figure 3 for a layout of the tailings storage facilities.
Total initial capital costs are estimated to be $1.3 billion for Phase I ($1.1 billion net of existing stream agreement), including all costs associated with the construction of the concentrator and associated infrastructure. The construction of the concentrate leach facility in year 4 is estimated at $367 million and includes the cost for the SX/EW plant, acid plant, sulfur burner and precious metals plant. Contingency costs have been applied to direct capital costs at 20% and the PFS assumes capital leasing of mobile equipment. For further details on the capital cost estimates, please refer to Exhibit 1.
Significant Social & Environmental Benefits
Global copper market fundamentals are expected to be strong with a structural deficit emerging in the medium term. Global mine production and available smelter capacity are expected to struggle to keep pace with metal demand boosted by the green energy revolution. The U.S. is expected to remain a net copper importer during this period, and domestic supply will be required to help secure growing U.S. metal demand related to increased manufacturing capacity, infrastructure development, bolstering the country's energy independence and domestic EV battery supply chain and production needs.
The "Made in America" copper cathode produced at Copper World is expected to be sold entirely to domestic U.S. customers and would make Copper World the third largest domestic cathode producer in the United Statesii. Producing copper cathode would reduce the operation's total energy requirements, and greenhouse gas ("GHG") and sulfur (SO2) emissions by eliminating overseas shipping, smelting and refining activities relating to copper concentrate. The company estimates that the project will reduce total energy consumption by more than 10%, including a more than 30% decline in energy consumption relating to downstream processing, when compared to a project design that produces copper concentrates for overseas smelting and refining. The PFS base case is expected to result in an approximate 14% reduction in scope 1, 2 and 3 GHG emissions compared to the flotation only scenario, as highlighted in Figure 4. Hudbay is targeting further reductions in the project's GHG emissions as part of the company's specific emissions reduction targets for its existing operations to align with the global 50% by 2030 climate change goal, which are discussed in the section titled "Project Optimization and Upside Opportunities" below.
The Copper World project is expected to generate significant benefits for the community and local economy in Arizona. Over the anticipated 20-year life of the operation, the company expects to contribute more than $850 million in U.S. taxes, including approximately $170 million in taxes to the state of Arizona. Hudbay also expects Copper World to create more than 400 direct jobs and up to 3,000 indirect jobs in Arizona. Copper World will offer competitive wages and benefits and the company intends to engage in partnerships with local apprenticeship readiness programs and community-based workforce training programs across the skilled and technical levels to fill and maintain all positions. The project is also expected to generate approximately $250 million in property taxes over the 20-year mine life.
In July 2023, the U.S. Department of Energy announced the designation of copper as a critical material for energy. Hudbay has applied for tax credits under the Inflation Reduction Act that are being awarded by the U.S. Department of Energy in conjunction with the Internal Revenue Agency for qualifying projects that construct processing facilities for Critical Material for Sustainable Energy Initiatives. The copper cathode produced at Copper World, together with the significant social benefits for the community and local economy, position the project as a strong candidate for government tax incentives. The financial analysis in the PFS does not incorporate any potential benefits from these tax incentives.
Simplified Permitting Process
The permitting process for Copper World is expected to only require state and local permits for Phase I. In July 2022, Hudbay received approval from the Arizona State Mine Inspector for its amended Mined Land Reclamation Plan ("MLRP"), the first key state permit required for Copper World. The MLRP was initially approved in October 2021 and was subsequently amended to reflect a larger private land project footprint. This approval by the Arizona State Mine Inspector was challenged in state court but the challenge was dismissed in May 2023 as having no basis. In late 2022, Hudbay submitted the applications for an Aquifer Protection Permit and an Air Quality Permit to the Arizona Department of Environmental Quality. The company expects to receive these two outstanding state permits in mid-2024.
In May 2023, the U.S. Supreme Court issued a favourable decision in the case of Sackett v EPA that clarified the definition of "Waters of the U.S." and rejected the "significant nexus" test that the agencies had previously used to assert jurisdiction over relatively remote dry washes like those at the Copper World site. This decision strengthens Hudbay's position that no 404 Permit or other Clean Water Act approvals are required for the Copper World project.
Also, in May 2023, Hudbay received a favourable ruling from the U.S. Court of Appeals for the Ninth Circuit that reversed the U.S. Fish and Wildlife Service's designation of the Copper World area as jaguar critical habitat. While this ruling does not impact the state permitting process for Phase I of Copper World, it is expected to simplify the federal permitting process for Phase II.
Mineral Reserve and Resource Estimates
The PFS and mine plan are based on updated mineral resource estimates for the Copper World deposits, which include the Peach-Elgin, West, Broadtop Butte and East deposits, as shown in Figure 5. Based on the new model, contained copper in measured and indicated mineral resources, inclusive of mineral reserves, has increased by 4% as compared to the mineral resources in the 2022 PEA. In addition, contained copper in mill feed increased by 41% in the PFS compared to the contained copper in milled resources in Phase I of the PEA mine plan due to higher grades and the flotation of both copper sulfides and oxides.
The mineral reserves milled is lower than the mineral resources mined in the PFS due to limitations on tailings capacity beyond 20 years in Phase I. There are approximately 40 million tonnes of resources that are economic to mine in the PFS but are excluded from the reserves and cash flow analysis. This additional material provides upside potential that could be included in the mine plan if additional land is accessed for tailings capacity.
The current mineral reserve and resource estimates for Copper World (effective as of July 1, 2023) are summarized below and replace the prior mineral resource estimates set forth in the 2022 PEA.
Copper World Project
Mineral Reserve and Resource
Estimates1,2,3,4 |
Tonnes
(millions) |
Cu Grade
(%) |
Soluble Cu
Grade (%) |
Mo Grade
(g/t) |
Au Grade
(g/t) |
Ag Grade
(g/t) |
| Proven reserves |
319 |
0.54 |
0.11 |
110 |
0.03 |
5.68 |
| Probable reserves |
66 |
0.52 |
0.14 |
96 |
0.02 |
4.31 |
| Total Proven and Probable Reserves |
385 |
0.54 |
0.12 |
108 |
0.02 |
5.44 |
| Measured resources |
888 |
0.43 |
0.10 |
121 |
0.02 |
4.46 |
| Indicated resources |
317 |
0.38 |
0.10 |
108 |
0.02 |
3.52 |
| Total Measured and Indicated |
1,205 |
0.42 |
0.10 |
117 |
0.02 |
4.22 |
| Inferred resources |
275 |
0.32 |
0.10 |
106 |
0.01 |
2.82 |
Note: totals may not add up correctly due to rounding.
1 Mineral resource estimates are inclusive of mineral reserves and have been calculated using assumed long-term metal prices of $3.75 per pound copper, $12.00 per pound molybdenum, $1,650 per ounce gold and $22.00 per ounce silver.
2 Mineral resource estimates that are not mineral reserves do not have demonstrated economic viability. Mineral resource estimates are based on resource pit design and do not include factors for mining recovery or dilution.
3 Mineral resource estimates are constrained to a Lerch Grossman pit shell with a revenue factor of 1.0 or inside the reserve pit.
4 Mineral resource estimates are using a 0.1% soluble copper cut-off grade and an oxidation ratio higher than 50% for leach material.
| Copper World Comparison of Mineral Resource Estimates1,2 |
| |
2022 |
2023 |
% Change |
| |
Tonnes
(millions) |
Cu
(%) |
Cu (000
tonnes) |
Tonnes
(millions) |
Cu
(%) |
Cu (000
tonnes) |
Cu (000
tonnes) |
| Measured and Indicated |
1,173 |
0.41 |
4,829 |
1,205 |
0.42 |
5,020 |
4% |
| Inferred |
262 |
0.37 |
957 |
275 |
0.32 |
893 |
-7% |
Note: totals may not add up correctly due to rounding.
1 2023 mineral resource estimates are inclusive of mineral reserve estimates.
2 2022 mineral resource estimates include both flotation and leach material and were based on metals prices and other assumptions set forth in the 2022 PEA.
| Copper World Comparison of Phase I Mill Feed |
| |
2022 PEA |
2023 PFS |
% Change |
| |
Tonnes
(millions) |
Cu
(%) |
Cu (000
tonnes) |
Tonnes
(millions) |
Cu
(%) |
Cu (000
tonnes) |
Cu (000
tonnes) |
| Mill Feed |
316 |
0.47 |
1,473 |
385 |
0.54 |
2,082 |
41% |
Note: totals may not add up correctly due to rounding.
Project Optimization and Upside Opportunities
The company has identified many opportunities that may further enhance project economics, reduce environmental impacts, increase annual production and extend mine life, which have not been considered in the Phase I PFS.
- Mine Life Extension Potential - There remains approximately 60% of the total copper contained in measured and indicated mineral resources excluding the PFS reserves, providing significant potential for the Phase II expansion and mine life extension. In addition, the inferred mineral resources estimates are at a comparable copper grade and also provide significant upside potential.
- Increased Concentrate Leach Capacity - The selected concentrate leach technology allows the facility to be scalable in the future to be large enough to process all of the internally produced copper concentrates, further enhancing project economics and IRR. Operating the Albion plant at 100% capacity is estimated to reduce total GHG emissions by 25% compared to an operation that only produces copper concentrate.
- Access to Federal Green Funding Incentives - Hudbay is exploring options for government incentives to help fund the future development of the concentrate leach facility, which may offer attractive financing terms and allow the construction of the concentrate leach facility to occur earlier and potentially at a larger capacity with improved project economics.
- Earlier Receipt of Federal Permits for Phase II Expansion - Hudbay is optimistic that it will be able to secure federal permits well before the end of the life of Phase I, which could allow the mining of more high-value tonnes earlier in the mine life and significantly increase annual copper production, the project economics and IRR.
- Green Opportunities - There are several emission reduction opportunities the company will evaluate with future studies, including the potential to source renewable energy from local providers at a nominal cost, the use of autonomous or electric haul trucks at the operation and various post-reclamation land uses such as domestic renewable energy production. Also, if Hudbay is able to secure additional private land to improve the tailings configuration, there is the potential to accelerate dry stack tailings deposition into Phase I, which would reduce water consumption.
Prudent Financing Plan and Disciplined Capital Allocation
As part of Hudbay's disciplined financial planning approach to Copper World, the company has introduced a three prerequisites plan ("3-P"), including specific leverage targets that it would need to achieve prior to making an investment decision in the project:
1. Permits - receipt of all state level permits required for Phase I
2. Plan - completion of a definitive feasibility study with an internal rate of return of greater than 15%
3. Prudent Financing Strategy - multi-faceted financing strategy including
• a committed minority joint venture partner;
• a renegotiated precious metals stream agreement optimized for the current project;
• net debt to EBITDA ratio of less than 1.2 times;
• a minimum cash balance of $600 million; and,
• limited non-recourse project level debt of up to $500 million.
Under the existing precious metals stream agreement with Wheaton Precious Metals, Hudbay is entitled to receive a deposit payment of $230 million for delivery of gold and silver production from Copper World. The estimated total initial funding requirement for Phase I of Copper World, net of the stream agreement, amounts to approximately $1.1 billion.
Hudbay intends to complete a minority joint venture partner process after receiving permits and prior to commencing a definitive feasibility study, which will allow the potential joint venture partner to participate in the funding of definitive feasibility study activities in 2024 as well as in the final project design for Copper World. The opportunity to sanction Copper World is not expected until 2025 based on current estimated timelines. The decision to sanction Copper World will ultimately be evaluated against other competing investment opportunities as part of Hudbay's capital allocation process.
Conference Call and Webcast
| Date: |
Friday, September 8, 2023 |
| |
|
| Time: |
8:30 a.m. ET |
| |
|
| Webcast: |
www.hudbay.com |
| |
|
| Dial in: |
1-416-915-3239 or 1-800-319-4610 |
Non-IFRS Financial Performance Measures
Cash cost and sustaining cash cost per pound of copper produced are shown because the company believes they help investors and management assess the performance of its operations, including the margin generated by the operations and the company. Unit operating costs are shown because these measures are used by the company as a key performance indicator to assess the performance of its mining and processing operations. EBITDA is shown to provide additional information about the cash generating potential in order to assess the company's capacity to service and repay debt, carry out investments and cover working capital needs. These measures do not have a meaning prescribed by IFRS and are therefore unlikely to be comparable to similar measures presented by other issuers. These measures should not be considered in isolation or as a substitute for measures prepared in accordance with IFRS and are not necessarily indicative of operating profit or cash flow from operations as determined under IFRS. Other companies may calculate these measures differently. For further details on these measures, please refer to page 42 of Hudbay's management's discussion and analysis for the three and six months ended June 30, 2023 available on SEDAR+ at www.sedarplus.ca and EDGAR at www.sec.gov.
Qualified Person and NI 43-101
The scientific and technical information contained in this news release has been approved by Olivier Tavchandjian, P. Geo, Hudbay's Senior Vice-President, Exploration and Technical Services. Mr. Tavchandjian is a qualified person pursuant to Canadian Securities Administrators' National Instrument 43-101 - Standards of Disclosure for Mineral Projects ("NI 43-101").
A copy of the NI 43-101 technical report for the PFS will be made available on Hudbay's SEDAR+ profile at www.sedarplus.ca and on Hudbay's EDGAR profile at www.sec.gov. The new technical report supports the disclosure in this news release and will be the current technical report in respect of all the mineral properties that form part of the Copper World project and shall supersede and replace the 2022 PEA in its entirety.
Cautionary Note to United States Investors
This news release has been prepared in accordance with the requirements of the securities laws in effect in Canada, which differ from the requirements of United States securities laws. Canadian reporting requirements for disclosure of mineral properties are governed NI 43-101.
For this reason, information contained in this news release in respect of the Copper World project may not be comparable to similar information made public by United States companies subject to the reporting and disclosure requirements under the United States federal securities laws and the rules and regulations thereunder. For further information on the differences between the disclosure requirements for mineral properties under the United States federal securities laws and NI 43-101, please refer to the company's annual information form, a copy of which has been filed under Hudbay's profile on SEDAR+ at www.sedarplus.ca and the company's Form 40-F, a copy of which has been filed under Hudbay's profile on EDGAR at www.sec.gov.
Cautionary Note Regarding Forward-Looking Information
This news release contains forward-looking information within the meaning of applicable Canadian and United States securities legislation. All information contained in this news release, other than statements of current and historical fact, is forward-looking information. Often, but not always, forward-looking information can be identified by the use of words such as "plans", "expects", "budget", "guidance", "scheduled", "estimates", "forecasts", "strategy", "target", "intends", "objective", "goal", "understands", "anticipates" and "believes" (and variations of these or similar words) and statements that certain actions, events or results "may", "could", "would", "should", "might" "occur" or "be achieved" or "will be taken" (and variations of these or similar expressions). All of the forward-looking information in this news release is qualified by this cautionary note.
Forward-looking information includes, but is not limited to, the results and findings of the PFS, including the production, operating cost, capital cost and cash cost estimates, the projected valuation metrics and rates of return, the cash flow and EBITDA projections, statements regarding the anticipated permitting requirements and project design, including processing and tailings facilities, metal recoveries, mine life and production rates for the Copper World project, the expected funding requirements for the Copper World project, the potential to further enhance the economics of the Copper World project and optimize the design in the future, the possibility of extending the life of the mine, plans for future feasibility studies and a potential joint venture partner, the expected social and environmental benefits of the Copper World project, as well as potential timelines for obtaining the required permits and financing and sanctioning the Copper World project. Forward-looking information is not, and cannot be, a guarantee of future results or events. Forward-looking information is based on, among other things, opinions, assumptions, estimates and analyses that, while considered reasonable by us at the date the forward-looking information is provided, inherently are subject to significant risks, uncertainties, contingencies and other factors that may cause actual results and events to be materially different from those expressed or implied by the forward-looking information.
The material factors or assumptions that Hudbay identified and were applied by the company in drawing conclusions or making forecasts or projections set out in the forward-looking information include, but are not limited to:
• obtaining all required permits to develop the Copper World project on anticipated timelines;
• no delays or disruption due to litigation challenging the permitting requirements for the Copper World project and no significant unanticipated litigation;
• the implementation of the concentrate leach facility in year 5 of the mine plan;
• the success of exploration and development activities at Copper World;
• the accuracy of geological, mining and metallurgical estimates;
• anticipated metals prices and the costs of production;
• the supply and demand for metals Hudbay produces;
• the supply and availability of all forms of energy, fuels and molten sulfur at reasonable prices;
• no significant unanticipated operational or technical difficulties;
• the availability of additional financing, if needed;
• the ability to complete project targets on time and on budget;
• the availability of personnel for the company's exploration, development and operational projects and ongoing employee relations;
• maintaining good relations with the communities in which the company operates, including the neighbouring communities and local governments in Arizona;
• no significant unanticipated challenges with stakeholders at Copper World;
• no significant unanticipated events or changes relating to regulatory, environmental, health and safety matters;
• no contests over title to Hudbay's properties, including as a result of rights or claimed rights of Indigenous peoples or challenges to the validity of its unpatented mining claims;
• an upfront stream deposit of $230 million will be paid by Wheaton Precious Metals at the commencement of construction;
• no offtake commitments in respect of production from the Copper World project;
• certain tax matters, including, but not limited to the mining tax regime in Arizona; and
• no significant and continuing adverse changes in general economic conditions or conditions in the financial markets (including commodity prices and foreign exchange rates).
The risks, uncertainties, contingencies and other factors that may cause actual results to differ materially from those expressed or implied by the forward-looking information may include, but are not limited to, risks generally associated with the mining industry and the current geopolitical environment, including future commodity prices, currency and interest rate fluctuations, energy and consumable prices, supply chain constraints and general cost escalation in the current inflationary environment, risks related to project delivery and financing; ongoing and potential litigation processes and other legal challenges that could affect the permitting timeline for the Copper World project, risks related to political or social instability and changes in government and government policy, risks related to changes in law, risks in respect of community relations, risks related to contracts that were entered into in respect of the former Rosemont mine project, uncertainties related to the geology, continuity, grade and estimates of mineral reserves and resources, and the potential for variations in grade and recovery rates, risks related to the timing and implementation of the concentrate leach facility, climate change risks and uncertainties, as well as the risks discussed under the heading "Risk Factors" in the company's annual information form and under the heading "Financial Risk Management" in the company's management's discussion and analysis.
Should one or more risk, uncertainty, contingency or other factor materialize or should any factor or assumption prove incorrect, actual results could vary materially from those expressed or implied in the forward-looking information. Accordingly, you should not place undue reliance on forward-looking information. The company does not assume any obligation to update or revise any forward-looking information after the date of this news release or to explain any material difference between subsequent actual events and any forward-looking information, except as required by applicable law.
About Hudbay
Hudbay (TSX, NYSE: HBM) is a copper-focused mining company with three long-life operations and a world-class pipeline of copper growth projects in tier-one mining-friendly jurisdictions of Canada, Peru and the United States.
Hudbay's operating portfolio includes the Constancia mine in Cusco (Peru), the Snow Lake operations in Manitoba (Canada) and the Copper Mountain mine in British Columbia (Canada). Copper is the primary metal produced by the company, which is complemented by meaningful gold production. Hudbay's growth pipeline includes the Copper World project in Arizona, the Mason project in Nevada (United States), the Llaguen project in La Libertad (Peru) and several expansion and exploration opportunities near its existing operations.
The value Hudbay creates and the impact it has is embodied in its purpose statement: "We care about our people, our communities and our planet. Hudbay provides the metals the world needs. We work sustainably, transform lives and create better futures for communities." Hudbay's mission is to create sustainable value and strong returns by leveraging its core strengths in community relations, focused exploration, mine development and efficient operations.
For further information, please contact:
Candace Brûlé
Vice President, Investor Relations
(416) 814-4387
investor.relations@hudbay.com
Exhibit 1: Detailed Cash Flow Model and Key Assumptions
A detailed cash flow model containing annual production and cost information is shown below. Overall assumptions for commodity prices, marketing parameters, operating costs and capital costs are also provided.
| Phase I: Physicals |
UNIT |
TOTAL |
Y-01 |
Y01 |
Y02 |
Y03 |
Y04 |
Y05 |
Y06 |
Y07 |
Y08 |
Y09 |
Y10 |
Y11 |
Y12 |
Y13 |
Y14 |
Y15 |
Y16 |
Y17 |
Y18 |
Y19 |
Y20 |
| Material Moved |
|
|
Pre-strip |
|
|
|
|
|
|
|
|
|
|
|
|
|
|
|
|
|
|
|
|
| Resources mined |
Mtonne |
426.0 |
18.1 |
27.4 |
33.8 |
42.8 |
25.3 |
25.0 |
20.7 |
21.1 |
22.9 |
23.1 |
21.4 |
19.9 |
19.9 |
19.9 |
17.1 |
15.3 |
15.3 |
12.6 |
14.4 |
9.8 |
- |
| Waste mined |
Mtonne |
776.6 |
36.3 |
43.7 |
51.9 |
46.0 |
61.8 |
62.4 |
65.0 |
67.4 |
63.7 |
66.7 |
54.4 |
43.6 |
43.6 |
39.1 |
17.5 |
10.9 |
2.0 |
0.3 |
0.1 |
0.1 |
- |
| Rehandle |
Mtonne |
62.4 |
- |
1.5 |
0.5 |
1.1 |
2.7 |
2.4 |
4.1 |
1.3 |
3.2 |
- |
1.2 |
- |
0.0 |
- |
2.7 |
4.5 |
4.5 |
7.3 |
5.4 |
10.0 |
9.9 |
| Total material moved |
Mtonne |
1,265.0 |
54.4 |
72.6 |
86.2 |
89.8 |
89.8 |
89.8 |
89.8 |
89.8 |
89.8 |
89.8 |
77.1 |
63.5 |
63.5 |
59.0 |
37.3 |
30.8 |
21.8 |
20.2 |
20.0 |
20.0 |
9.9 |
| |
|
|
|
|
|
|
|
|
|
|
|
|
|
|
|
|
|
|
|
|
|
|
|
| Strip Ratio |
|
|
Pre-strip |
|
|
|
|
|
|
|
|
|
|
|
|
|
|
|
|
|
|
|
|
| Strip ratio |
X:X |
1.82 |
2.01 |
1.59 |
1.54 |
1.08 |
2.44 |
2.49 |
3.15 |
3.19 |
2.78 |
2.89 |
2.54 |
2.20 |
2.20 |
1.97 |
1.02 |
0.71 |
0.13 |
0.02 |
0.01 |
0.01 |
- |
| |
|
|
|
|
|
|
|
|
|
|
|
|
|
|
|
|
|
|
|
|
|
|
|
| Reserves Milled |
|
|
|
|
|
|
|
|
|
|
|
|
|
|
|
|
|
|
|
|
|
|
|
| Reserves milled |
Mtonne |
385.1 |
- |
17.6 |
19.9 |
19.9 |
19.9 |
19.9 |
19.9 |
19.9 |
19.9 |
19.9 |
19.9 |
19.9 |
19.9 |
19.9 |
19.9 |
19.9 |
19.9 |
19.9 |
19.9 |
19.9 |
9.9 |
| Headgrade - Cu |
% |
0.54% |
- |
0.64 |
0.54 |
0.50 |
0.49 |
0.54 |
0.79 |
0.60 |
0.59 |
0.58 |
0.58 |
0.48 |
0.44 |
0.48 |
0.58 |
0.53 |
0.56 |
0.54 |
0.58 |
0.41 |
0.24 |
| Headgrade - Au |
g/tonne |
0.03 |
- |
0.02 |
0.02 |
0.02 |
0.01 |
0.02 |
0.03 |
0.03 |
0.03 |
0.04 |
0.03 |
0.03 |
0.03 |
0.03 |
0.04 |
0.03 |
0.03 |
0.03 |
0.04 |
0.03 |
0.01 |
| Headgrade - Ag |
g/tonne |
6.00 |
- |
3.73 |
4.09 |
4.28 |
4.11 |
8.00 |
8.06 |
8.12 |
5.27 |
7.89 |
7.21 |
6.01 |
6.41 |
6.91 |
7.89 |
4.56 |
4.79 |
5.41 |
7.76 |
5.06 |
2.29 |
| Headgrade - Mo |
% |
0.01% |
- |
0.02 |
0.01 |
0.01 |
0.01 |
0.01 |
0.01 |
0.01 |
0.01 |
0.01 |
0.01 |
0.01 |
0.01 |
0.01 |
0.01 |
0.01 |
0.01 |
0.01 |
0.01 |
0.01 |
0.01 |
| |
|
|
|
|
|
|
|
|
|
|
|
|
|
|
|
|
|
|
|
|
|
|
|
| Recovery to Concentrate |
|
|
|
|
|
|
|
|
|
|
|
|
|
|
|
|
|
|
|
|
|
|
|
| Cu |
% |
79.00% |
- |
82.91 |
81.78 |
83.02 |
83.18 |
82.50 |
70.14 |
82.20 |
82.31 |
84.13 |
84.29% |
83.39% |
83.16% |
83.27% |
69.02% |
68.08% |
82.02% |
71.49% |
82.37 |
67.54 |
63.23 |
| Au |
% |
41.21% |
- |
42.65 |
40.58 |
42.85 |
43.16 |
41.88 |
38.03 |
41.33 |
41.52 |
45.02 |
45.32% |
43.57% |
43.11% |
43.33% |
37.65% |
37.33% |
41.01% |
38.48% |
41.65% |
37.15% |
35.66% |
| Ag |
% |
56.43% |
- |
57.95 |
55.56 |
58.17 |
58.53 |
57.06 |
52.60 |
56.43 |
56.66 |
60.65 |
60.99% |
59.00% |
58.48% |
58.73% |
52.16% |
51.79% |
56.06% |
53.13% |
56.80% |
51.58% |
49.83% |
| Mo |
% |
53.67% |
- |
56.19 |
52.26 |
56.56 |
57.16 |
54.71 |
47.57 |
53.67 |
54.04 |
60.76 |
61.36% |
57.95% |
57.07% |
57.49% |
46.88% |
46.31% |
53.08% |
48.39% |
54.27% |
45.98% |
43.33% |
| |
|
|
|
|
|
|
|
|
|
|
|
|
|
|
|
|
|
|
|
|
|
|
|
| Cu Conc Produced - Sold to Market |
|
|
|
|
|
|
|
|
|
|
|
|
|
|
|
|
|
|
|
|
|
|
| Cu Concentrate |
Ktonne |
2,991 |
- |
401 |
456 |
398 |
319 |
48 |
130 |
130 |
139 |
127 |
82 |
57 |
76 |
99 |
57 |
129 |
150 |
111 |
81 |
- |
- |
| Grade - Cu |
% |
23.16% |
- |
23.22% |
19.36% |
20.51% |
25.21% |
33.21% |
29.12% |
25.26% |
24.58% |
25.34% |
29.73% |
25.44% |
21.92% |
22.29% |
25.28% |
18.64% |
22.33% |
20.84% |
28.61% |
- |
- |
| Grade - Au |
g/tonne |
0.51 |
- |
0.36 |
0.29 |
0.35 |
0.32 |
0.65 |
0.68 |
0.55 |
0.70 |
1.05 |
0.71 |
0.72 |
0.73 |
0.84 |
0.84 |
0.53 |
0.64 |
0.63 |
0.89 |
- |
- |
| Grade - Ag |
g/tonne |
157.86 |
- |
94.61 |
98.86 |
124.25 |
149.86 |
340.27 |
222.62 |
235.48 |
150.38 |
248.45 |
267.41 |
224.95 |
224.42 |
227.22 |
261.56 |
121.93 |
131.63 |
155.86 |
261.78 |
- |
- |
| Cu cont'd in concentrate |
Ktonne |
693 |
- |
93 |
88 |
82 |
80 |
16 |
38 |
33 |
34 |
32 |
25 |
14 |
17 |
22 |
14 |
24 |
33 |
23 |
23 |
- |
- |
| Au cont'd in concentrate |
Koz |
49 |
- |
5 |
4 |
4 |
3 |
1 |
3 |
2 |
3 |
4 |
2 |
1 |
2 |
3 |
2 |
2 |
3 |
2 |
2 |
- |
- |
| Ag cont'd in concentrate |
Koz |
15,181 |
- |
1,219 |
1,451 |
1,591 |
1,535 |
530 |
934 |
986 |
672 |
1,015 |
709 |
410 |
549 |
725 |
480 |
505 |
633 |
556 |
682 |
- |
- |
| |
|
|
|
|
|
|
|
|
|
|
|
|
|
|
|
|
|
|
|
|
|
|
|
| Cu Conc Produced - To Conc Leach Facility |
|
|
|
|
|
|
| Cu Concentrate |
Ktonne |
3,870 |
- |
- |
- |
- |
- |
218 |
248 |
256 |
256 |
256 |
244 |
256 |
256 |
256 |
256 |
256 |
256 |
256 |
253 |
227 |
122 |
| Grade - Cu |
% |
24.61% |
- |
- |
- |
- |
- |
33.21% |
29.12% |
25.26% |
24.58% |
25.34% |
29.73% |
25.44% |
21.92% |
22.29% |
25.28% |
18.64% |
22.33% |
20.84% |
28.61% |
24.02% |
12.24% |
| Grade - Au |
g/tonne |
0.72 |
- |
- |
- |
- |
- |
0.65 |
0.68 |
0.55 |
0.70 |
1.05 |
0.71 |
0.72 |
0.73 |
0.84 |
0.84 |
0.53 |
0.64 |
0.63 |
0.89 |
0.84 |
0.39 |
| Grade - Ag |
g/tonne |
214.74 |
- |
- |
- |
- |
- |
340.27 |
222.62 |
235.48 |
150.38 |
248.45 |
267.41 |
224.95 |
224.42 |
227.22 |
261.56 |
121.93 |
131.63 |
155.86 |
261.78 |
228.70 |
92.69 |
| Cu cont'd in concentrate |
Ktonne |
952 |
- |
- |
- |
- |
- |
72 |
72 |
65 |
63 |
65 |
73 |
65 |
56 |
57 |
65 |
48 |
57 |
53 |
72 |
54 |
15 |
| Au cont'd in concentrate |
Koz |
90 |
- |
- |
- |
- |
- |
5 |
5 |
4 |
6 |
9 |
6 |
6 |
6 |
7 |
7 |
4 |
5 |
5 |
7 |
6 |
2 |
| Ag cont'd in concentrate |
Koz |
26,722 |
- |
- |
- |
- |
- |
2,387 |
1,776 |
1,940 |
1,236 |
2,041 |
2,099 |
1,853 |
1,844 |
1,867 |
2,149 |
1,005 |
1,082 |
1,281 |
2,131 |
1,666 |
364 |
| |
|
|
|
|
|
|
|
|
|
|
|
|
|
|
|
|
|
|
|
|
|
|
|
| Mo Conc Produced |
|
|
|
|
|
|
|
|
|
|
|
|
|
|
|
|
|
|
|
|
|
|
|
| Mo Concentrate |
Ktonne |
44.5 |
- |
3.4 |
3.0 |
2.7 |
2.4 |
2.0 |
2.6 |
1.7 |
2.3 |
3.0 |
2.1 |
2.4 |
2.8 |
1.9 |
1.4 |
1.6 |
2.2 |
2.0 |
2.4 |
2.1 |
0.6 |
| Grade - Mo |
% |
50.00% |
- |
50.00% |
50.00% |
50.00% |
50.00% |
50.00% |
50.00% |
50.00% |
50.00% |
50.00% |
50.00% |
50.00% |
50.00% |
50.00% |
50.00% |
50.00% |
50.00% |
50.00% |
50.00% |
50.00% |
50.00% |
| Mo cont'd in concentrate |
Ktonne |
22.3 |
- |
1.7 |
1.5 |
1.4 |
1.2 |
1.0 |
1.3 |
0.9 |
1.1 |
1.5 |
1.1 |
1.2 |
1.4 |
0.9 |
0.7 |
0.8 |
1.1 |
1.0 |
1.2 |
1.0 |
0.3 |
| |
|
|
|
|
|
|
|
|
|
|
|
|
|
|
|
|
|
|
|
|
|
|
|
| Purchased Cu Conc |
|
|
|
|
|
|
|
|
|
|
|
|
|
|
|
|
|
|
|
|
|
|
|
| Cu Concentrate |
Ktonne |
129.7 |
- |
- |
- |
- |
- |
- |
- |
- |
- |
- |
- |
- |
- |
- |
- |
- |
- |
- |
- |
29.7 |
100.0 |
| Grade - Cu |
% |
28.00% |
- |
- |
- |
- |
- |
28.00% |
28.00% |
28.00% |
28.00% |
28.00% |
28.00% |
28.00% |
28.00% |
28.00% |
28.00% |
28.00% |
28.00% |
28.00% |
28.00% |
28.00% |
28.00% |
| Grade - Au |
g/tonne |
0.30 |
- |
- |
- |
- |
- |
0.30 |
0.30 |
0.30 |
0.30 |
0.30 |
0.30 |
0.30 |
0.30 |
0.30 |
0.30 |
0.30 |
0.30 |
0.30 |
0.30 |
0.30 |
0.30 |
| Grade - Ag |
g/tonne |
110.00 |
- |
- |
- |
- |
- |
110.00 |
110.00 |
110.00 |
110.00 |
110.00 |
110.00 |
110.00 |
110.00 |
110.00 |
110.00 |
110.00 |
110.00 |
110.00 |
110.00 |
110.00 |
110.00 |
| |
|
|
|
|
|
|
|
|
|
|
|
|
|
|
|
|
|
|
|
|
|
|
|
| Recovery to Cu Cathode |
|
|
|
|
|
|
|
|
|
|
|
|
|
|
|
|
|
|
|
|
|
|
|
| From Mill |
% |
98.12% |
- |
- |
- |
- |
- |
98.10% |
98.22% |
98.11% |
98.11% |
98.00% |
97.99% |
98.05% |
98.06% |
98.05% |
98.23% |
98.25% |
98.12% |
98.21% |
98.10% |
98.25% |
98.31% |
| From Purchased |
% |
97.80% |
- |
- |
- |
- |
- |
- |
- |
- |
- |
- |
- |
- |
- |
- |
- |
- |
- |
- |
- |
97.80% |
97.80% |
| |
|
|
|
|
|
|
|
|
|
|
|
|
|
|
|
|
|
|
|
|
|
|
|
| Cu Cathode Produced |
|
|
|
|
|
|
|
|
|
|
|
|
|
|
|
|
|
|
|
|
|
|
|
| From Mill |
Ktonne |
934.5 |
- |
- |
- |
- |
- |
71.1 |
71.0 |
63.5 |
61.6 |
63.5 |
71.1 |
63.9 |
54.9 |
55.8 |
63.5 |
46.9 |
56.0 |
52.3 |
71.1 |
53.5 |
14.7 |
| From Purchased |
Ktonne |
35.5 |
- |
- |
- |
- |
- |
- |
- |
- |
- |
- |
- |
- |
- |
- |
- |
- |
- |
- |
- |
8.1 |
27.4 |
| Total Cu cathode |
Ktonne |
970.0 |
- |
- |
- |
- |
- |
71.1 |
71.0 |
63.5 |
61.6 |
63.5 |
71.1 |
63.9 |
54.9 |
55.8 |
63.5 |
46.9 |
56.0 |
52.3 |
71.1 |
61.6 |
42.1 |
| |
|
|
|
|
|
|
|
|
|
|
|
|
|
|
|
|
|
|
|
|
|
|
|
| Doré Produced |
|
|
|
|
|
|
|
|
|
|
|
|
|
|
|
|
|
|
|
|
|
|
|
| From Mill |
Moz |
27.3 |
- |
- |
- |
- |
- |
2.4 |
1.8 |
2.0 |
1.3 |
2.1 |
2.1 |
1.9 |
1.9 |
1.9 |
2.2 |
1.0 |
1.1 |
1.3 |
2.2 |
1.7 |
0.4 |
| From Purchased |
Moz |
0.4 |
- |
- |
- |
- |
- |
- |
- |
- |
- |
- |
- |
- |
- |
- |
- |
- |
- |
- |
- |
0.1 |
0.3 |
| Total Dore |
Moz |
27.7 |
- |
- |
- |
- |
- |
2.4 |
1.8 |
2.0 |
1.3 |
2.1 |
2.1 |
1.9 |
1.9 |
1.9 |
2.2 |
1.0 |
1.1 |
1.3 |
2.2 |
1.8 |
0.7 |
| Au in Doré |
% |
86 |
- |
- |
- |
- |
- |
4 |
5 |
4 |
5 |
8 |
5 |
6 |
6 |
7 |
7 |
4 |
5 |
5 |
7 |
6 |
2 |
| Ag in Doré |
% |
25,520 |
- |
- |
- |
- |
- |
2,245 |
1,671 |
1,825 |
1,162 |
1,920 |
1,975 |
1,743 |
1,734 |
1,756 |
2,021 |
945 |
1,017 |
1,204 |
2,004 |
1,656 |
642 |
| |
|
|
|
|
|
|
|
|
|
|
|
|
|
|
|
|
|
|
|
|
|
|
|
| Acid Plant |
|
|
|
|
|
|
|
|
|
|
|
|
|
|
|
|
|
|
|
|
|
|
|
| Purchased sulphur |
Ktonne |
1,721.7 |
- |
- |
- |
- |
- |
107.8 |
108.2 |
106.6 |
107.8 |
105.8 |
104.2 |
106.8 |
108.1 |
108.4 |
110.7 |
111.5 |
107.5 |
110.0 |
106.3 |
109.2 |
102.8 |
| Excess acid produced |
Ktonne |
5,994.5 |
- |
- |
- |
- |
- |
374.7 |
374.7 |
374.7 |
374.6 |
374.7 |
374.7 |
374.7 |
374.7 |
374.7 |
374.7 |
374.6 |
374.6 |
374.6 |
374.7 |
374.7 |
374.7 |
| |
|
|
|
|
|
|
|
|
|
|
|
|
|
|
|
|
|
|
|
|
|
|
|
| Total Production |
|
|
|
|
|
|
|
|
|
|
|
|
|
|
|
|
|
|
|
|
|
|
|
| Cu - contained in conc sold |
Ktonne |
693 |
- |
93 |
88 |
82 |
80 |
16 |
38 |
33 |
34 |
32 |
25 |
14 |
17 |
22 |
14 |
24 |
33 |
23 |
23 |
- |
- |
| Cu - cathode from conc leach |
Ktonne |
970 |
- |
- |
- |
- |
- |
71 |
71 |
64 |
62 |
63 |
71 |
64 |
55 |
56 |
63 |
47 |
56 |
52 |
71 |
62 |
42 |
| Cu - total production |
Ktonne |
1,663 |
- |
93 |
88 |
82 |
80 |
87 |
109 |
96 |
96 |
96 |
96 |
78 |
72 |
78 |
78 |
71 |
89 |
75 |
94 |
62 |
42 |
| |
|
|
|
|
|
|
|
|
|
|
|
|
|
|
|
|
|
|
|
|
|
|
|
| Cu Eq Production |
Ktonne |
1,974.3 |
- |
102.7 |
97.9 |
91.2 |
88.9 |
105.3 |
128.3 |
114.5 |
112.5 |
117.3 |
114.2 |
95.8 |
90.2 |
96.0 |
95.0 |
85.2 |
105.5 |
91.4 |
113.6 |
77.1 |
51.7 |
|
Phase I: Unit Costs
|
Unit
|
Phase I
|
Y01
|
Y02
|
Y03
|
Y04
|
Y05
|
Y06
|
Y07
|
Y08
|
Y09
|
Y10
|
Y11
|
Y12
|
Y13
|
Y14
|
Y15
|
Y16
|
Y17
|
Y18
|
Y19
|
Y20
|
|
Mining ($/t material moved excl. Pre-strip)
|
|
Mining
|
$/tonne
|
2.48
|
1.80
|
1.74
|
1.85
|
2.02
|
2.23
|
2.30
|
2.29
|
2.29
|
2.30
|
2.60
|
2.93
|
2.83
|
3.03
|
3.57
|
3.76
|
4.24
|
4.20
|
4.13
|
3.73
|
2.24
|
|
Deferred stripping
|
$/tonne
|
(0.30)
|
(0.00)
|
(0.40)
|
(0.22)
|
(0.62)
|
(0.27)
|
(0.57)
|
(0.61)
|
(0.42)
|
(0.49)
|
(0.34)
|
(0.12)
|
(0.12)
|
-
|
-
|
-
|
-
|
-
|
-
|
-
|
-
|
|
Mining ex def stripping
|
$/tonne
|
2.18
|
1.79
|
1.35
|
1.63
|
1.41
|
1.96
|
1.72
|
1.68
|
1.87
|
1.81
|
2.26
|
2.81
|
2.71
|
3.03
|
3.57
|
3.76
|
4.24
|
4.20
|
4.13
|
3.73
|
2.24
|
|
Processing ($/tonne Ore Milled)
|
|
|
|
|
|
|
|
|
|
|
|
Flotation
|
$/tonne
|
4.07
|
4.11
|
4.11
|
4.09
|
4.06
|
4.04
|
4.08
|
4.09
|
4.09
|
4.08
|
4.06
|
4.06
|
4.06
|
4.07
|
4.06
|
4.09
|
4.09
|
4.08
|
4.06
|
4.03
|
4.03
|
|
Concentrate Leach Facility
|
$/tonne
|
2.04
|
-
|
-
|
-
|
-
|
2.48
|
2.52
|
2.51
|
2.51
|
2.50
|
2.48
|
2.51
|
2.50
|
2.51
|
2.55
|
2.52
|
2.49
|
2.51
|
2.52
|
2.52
|
3.88
|
|
Tailings & water
|
$/tonne
|
0.80
|
0.79
|
0.79
|
0.80
|
0.79
|
0.79
|
0.79
|
0.80
|
0.79
|
0.79
|
0.79
|
0.80
|
0.79
|
0.79
|
0.79
|
0.80
|
0.79
|
0.79
|
0.79
|
0.80
|
0.79
|
|
Labor & other
|
$/tonne
|
0.74
|
0.54
|
0.54
|
0.54
|
0.54
|
0.79
|
0.79
|
0.79
|
0.79
|
0.79
|
0.79
|
0.79
|
0.79
|
0.79
|
0.79
|
0.79
|
0.79
|
0.79
|
0.79
|
0.79
|
0.79
|
|
Total
|
$/tonne
|
7.65
|
5.44
|
5.45
|
5.43
|
5.39
|
8.11
|
8.19
|
8.19
|
8.18
|
8.17
|
8.13
|
8.16
|
8.16
|
8.17
|
8.19
|
8.19
|
8.17
|
8.17
|
8.17
|
8.14
|
9.50
|
|
|
|
|
|
|
|
|
|
|
|
|
|
|
|
|
|
|
|
|
|
|
|
|
|
Other Unit Costs ($/tonne ore milled)
|
|
|
|
|
|
|
|
|
|
|
|
Onsite G&A
|
$/tonne
|
0.90
|
0.91
|
0.80
|
0.80
|
0.80
|
0.80
|
0.85
|
0.85
|
0.85
|
0.85
|
0.85
|
0.90
|
0.90
|
0.90
|
0.90
|
0.90
|
1.05
|
1.05
|
1.05
|
1.05
|
1.05
|
|
|
|
|
|
|
|
|
|
|
|
|
|
|
|
|
|
|
|
|
|
|
|
|
|
Cash Cost ($/lb Cu - ex. purchased conc)
|
|
|
|
|
|
|
|
|
|
|
|
|
|
|
|
|
|
|
|
Cash cost
|
$/lb
|
1.47
|
1.68
|
1.83
|
2.07
|
1.89
|
1.48
|
1.18
|
1.34
|
1.44
|
1.28
|
1.35
|
1.63
|
1.73
|
1.69
|
1.38
|
1.59
|
1.13
|
1.22
|
0.86
|
1.35
|
1.87
|
|
Sustaining cash cost
|
$/lb
|
1.81
|
2.01
|
2.20
|
2.38
|
2.42
|
1.85
|
1.71
|
1.84
|
1.86
|
1.74
|
1.72
|
1.95
|
2.05
|
1.95
|
1.63
|
1.79
|
1.31
|
1.41
|
1.03
|
1.54
|
2.17
|
|
PHASE I: CASH FLOWS
|
Unit
|
TOTAL
|
Y-03
|
Y-02
|
Y-01
|
Y01
|
Y02
|
Y03
|
Y04
|
Y05
|
Y06
|
Y07
|
Y08
|
Y09
|
Y10
|
Y11
|
Y12
|
Y13
|
Y14
|
Y15
|
Y16
|
Y17
|
Y18
|
Y19
|
Y20
|
Y21
|
Y22
|
Y23
|
Y24
|
Y25
|
|
Cash Flows
|
|
|
|
|
|
|
|
|
|
|
|
|
|
|
|
|
|
|
|
|
|
|
|
|
|
|
|
|
|
|
|
Gross revenue - internal
|
$M
|
14,993
|
-
|
-
|
-
|
786
|
738
|
684
|
674
|
817
|
1,000
|
884
|
882
|
899
|
888
|
749
|
697
|
737
|
734
|
667
|
828
|
713
|
882
|
541
|
192
|
-
|
-
|
-
|
-
|
-
|
|
Gross revenue - purchased
|
$M
|
305
|
-
|
-
|
-
|
-
|
-
|
-
|
-
|
-
|
-
|
-
|
-
|
-
|
-
|
-
|
-
|
-
|
-
|
-
|
-
|
-
|
-
|
70
|
236
|
-
|
-
|
-
|
-
|
-
|
|
TC/RC
|
$M
|
(440)
|
-
|
-
|
-
|
(56)
|
(58)
|
(52)
|
(44)
|
(10)
|
(22)
|
(18)
|
(21)
|
(21)
|
(14)
|
(12)
|
(14)
|
(15)
|
(8)
|
(17)
|
(22)
|
(17)
|
(15)
|
(4)
|
(1)
|
-
|
-
|
-
|
-
|
-
|
|
Freight
|
$M
|
(602)
|
-
|
-
|
-
|
(75)
|
(86)
|
(75)
|
(60)
|
(13)
|
(27)
|
(27)
|
(28)
|
(27)
|
(19)
|
(13)
|
(17)
|
(21)
|
(14)
|
(26)
|
(30)
|
(23)
|
(18)
|
(3)
|
(1)
|
-
|
-
|
-
|
-
|
-
|
|
Royalty
|
$M
|
(339)
|
-
|
-
|
-
|
(17)
|
(15)
|
(14)
|
(15)
|
(20)
|
(24)
|
(21)
|
(20)
|
(22)
|
(22)
|
(18)
|
(16)
|
(17)
|
(17)
|
(14)
|
(18)
|
(15)
|
(21)
|
(12)
|
(3)
|
-
|
-
|
-
|
-
|
-
|
|
Opex - Mining
|
$M
|
(2,641)
|
-
|
-
|
-
|
(130)
|
(116)
|
(146)
|
(126)
|
(176)
|
(155)
|
(151)
|
(168)
|
(163)
|
(174)
|
(178)
|
(172)
|
(179)
|
(133)
|
(116)
|
(93)
|
(85)
|
(83)
|
(75)
|
(22)
|
-
|
-
|
-
|
-
|
-
|
|
Opex - Processing
|
$M
|
(2,947)
|
-
|
-
|
-
|
(96)
|
(108)
|
(108)
|
(107)
|
(161)
|
(163)
|
(163)
|
(163)
|
(162)
|
(162)
|
(162)
|
(162)
|
(162)
|
(163)
|
(163)
|
(162)
|
(162)
|
(162)
|
(162)
|
(94)
|
-
|
-
|
-
|
-
|
-
|
|
Opex - Purch Cu Conc
|
$M
|
(272)
|
-
|
-
|
-
|
-
|
-
|
-
|
-
|
-
|
-
|
-
|
-
|
-
|
-
|
-
|
-
|
-
|
-
|
-
|
-
|
-
|
-
|
(62)
|
(210)
|
-
|
-
|
-
|
-
|
-
|
|
Opex - Onsite G&A
|
$M
|
(348)
|
-
|
-
|
-
|
(16)
|
(16)
|
(16)
|
(16)
|
(16)
|
(17)
|
(17)
|
(17)
|
(17)
|
(17)
|
(18)
|
(18)
|
(18)
|
(18)
|
(18)
|
(21)
|
(21)
|
(21)
|
(21)
|
(10)
|
-
|
-
|
-
|
-
|
-
|
|
Opex - Property tax
|
$M
|
(247)
|
-
|
-
|
-
|
(24)
|
(23)
|
(23)
|
(22)
|
(21)
|
(20)
|
(18)
|
(17)
|
(15)
|
(14)
|
(12)
|
(10)
|
(8)
|
(6)
|
(6)
|
(2)
|
(2)
|
(2)
|
(2)
|
(2)
|
-
|
-
|
-
|
-
|
-
|
|
Opex - Surety bond fees
|
$M
|
(27)
|
-
|
-
|
-
|
(1)
|
(1)
|
(1)
|
(1)
|
(1)
|
(1)
|
(1)
|
(1)
|
(1)
|
(1)
|
(1)
|
(1)
|
(1)
|
(1)
|
(1)
|
(1)
|
(1)
|
(1)
|
(1)
|
(1)
|
-
|
-
|
-
|
-
|
-
|
|
Closure Costs1
|
$M
|
(133)
|
-
|
-
|
-
|
-
|
-
|
-
|
-
|
-
|
-
|
-
|
-
|
-
|
-
|
-
|
-
|
-
|
-
|
-
|
-
|
-
|
-
|
-
|
-
|
(36)
|
(36)
|
(2)
|
(2)
|
(20)
|
|
End of life salvage/scrap
|
$M
|
62
|
-
|
-
|
-
|
-
|
-
|
-
|
-
|
-
|
-
|
-
|
-
|
-
|
-
|
-
|
-
|
-
|
-
|
-
|
-
|
-
|
-
|
-
|
-
|
62
|
-
|
-
|
-
|
-
|
|
Pre-operating costs
|
$M
|
-
|
-
|
-
|
-
|
-
|
-
|
-
|
-
|
-
|
-
|
-
|
-
|
-
|
-
|
-
|
-
|
-
|
-
|
-
|
-
|
-
|
-
|
-
|
-
|
-
|
-
|
-
|
-
|
-
|
|
Tax - Federal income
|
$M
|
(441)
|
(3)
|
(3)
|
-
|
-
|
-
|
-
|
-
|
-
|
(3)
|
(1)
|
(3)
|
(7)
|
(26)
|
(22)
|
(24)
|
(31)
|
(43)
|
(34)
|
(67)
|
(53)
|
(83)
|
(31)
|
(6)
|
-
|
-
|
-
|
-
|
-
|
|
Tax - State income
|
$M
|
(113)
|
-
|
(3)
|
-
|
-
|
-
|
-
|
-
|
-
|
-
|
-
|
-
|
(2)
|
(9)
|
(6)
|
(6)
|
(8)
|
(11)
|
(8)
|
(17)
|
(13)
|
(21)
|
(8)
|
(1)
|
-
|
-
|
-
|
-
|
-
|
|
Tax - State severance
|
$M
|
(55)
|
-
|
-
|
-
|
-
|
-
|
-
|
-
|
(1)
|
(3)
|
(2)
|
(3)
|
(4)
|
(4)
|
(3)
|
(3)
|
(3)
|
(4)
|
(3)
|
(6)
|
(5)
|
(7)
|
(3)
|
(1)
|
-
|
-
|
-
|
-
|
-
|
|
Tax - BEAT
|
$M
|
-
|
-
|
-
|
-
|
-
|
-
|
-
|
-
|
-
|
-
|
-
|
-
|
-
|
-
|
-
|
-
|
-
|
-
|
-
|
-
|
-
|
-
|
-
|
-
|
-
|
-
|
-
|
-
|
-
|
|
Cash From Ops before WC
|
$M
|
6,754
|
(3)
|
(6)
|
-
|
371
|
315
|
249
|
282
|
398
|
565
|
465
|
442
|
458
|
427
|
304
|
254
|
274
|
315
|
261
|
390
|
316
|
449
|
227
|
74
|
25
|
(36)
|
(2)
|
(2)
|
(20)
|
|
WC Changes - AR
|
$M
|
(0)
|
-
|
-
|
-
|
(60)
|
4
|
4
|
0
|
(15)
|
(14)
|
9
|
0
|
(1)
|
0
|
11
|
5
|
(3)
|
(0)
|
6
|
(13)
|
9
|
(14)
|
21
|
15
|
35
|
-
|
-
|
-
|
-
|
|
WC Changes - AP
|
$M
|
0
|
27
|
68
|
30
|
(50)
|
(0)
|
0
|
62
|
(55)
|
5
|
(6)
|
0
|
1
|
2
|
(5)
|
(1)
|
2
|
(6)
|
(5)
|
4
|
(6)
|
6
|
(7)
|
(5)
|
(53)
|
-
|
(6)
|
-
|
-
|
|
WC Changes - Stream
|
$M
|
230
|
162
|
68
|
-
|
-
|
-
|
-
|
-
|
-
|
-
|
-
|
-
|
-
|
-
|
-
|
-
|
-
|
-
|
-
|
-
|
-
|
-
|
-
|
-
|
-
|
-
|
-
|
-
|
-
|
|
Cash From Operations
|
$M
|
6,985
|
187
|
130
|
30
|
261
|
319
|
253
|
345
|
329
|
555
|
467
|
442
|
457
|
428
|
309
|
257
|
273
|
309
|
263
|
381
|
319
|
441
|
242
|
84
|
7
|
(36)
|
(8)
|
(2)
|
(20)
|
|
Growth - EPCM
|
$M
|
(1,006)
|
(96)
|
(395)
|
(208)
|
-
|
-
|
-
|
(307)
|
-
|
-
|
-
|
-
|
-
|
-
|
-
|
-
|
-
|
-
|
-
|
-
|
-
|
-
|
-
|
-
|
-
|
-
|
-
|
-
|
-
|
|
Growth - Owners Costs
|
$M
|
(602)
|
(47)
|
(98)
|
(454)
|
-
|
-
|
-
|
(4)
|
-
|
-
|
-
|
-
|
-
|
-
|
-
|
-
|
-
|
-
|
-
|
-
|
-
|
-
|
-
|
-
|
-
|
-
|
-
|
-
|
-
|
|
Growth - Contingency
|
$M
|
(250)
|
(19)
|
(78)
|
(96)
|
-
|
-
|
-
|
(57)
|
-
|
-
|
-
|
-
|
-
|
-
|
-
|
-
|
-
|
-
|
-
|
-
|
-
|
-
|
-
|
-
|
-
|
-
|
-
|
-
|
-
|
|
Sustaining capital
|
$M
|
(701)
|
-
|
-
|
-
|
(95)
|
(52)
|
(51)
|
(62)
|
(64)
|
(61)
|
(30)
|
(30)
|
(30)
|
(30)
|
(30)
|
(28)
|
(28)
|
(27)
|
(18)
|
(17)
|
(15)
|
(14)
|
(10)
|
(7)
|
-
|
-
|
-
|
-
|
-
|
|
Deferred stripping
|
$M
|
(362)
|
-
|
-
|
-
|
(0)
|
(34)
|
(19)
|
(55)
|
(24)
|
(51)
|
(54)
|
(37)
|
(44)
|
(27)
|
(8)
|
(8)
|
-
|
-
|
-
|
-
|
-
|
-
|
-
|
-
|
-
|
-
|
-
|
-
|
-
|
|
Cash From Investing
|
$M
|
(2,920)
|
(162)
|
(571)
|
(757)
|
(95)
|
(87)
|
(70)
|
(484)
|
(88)
|
(112)
|
(85)
|
(68)
|
(74)
|
(57)
|
(38)
|
(36)
|
(28)
|
(27)
|
(18)
|
(17)
|
(15)
|
(14)
|
(10)
|
(7)
|
-
|
-
|
-
|
-
|
-
|
|
Loan - draw
|
$M
|
482
|
-
|
8
|
159
|
37
|
26
|
24
|
32
|
36
|
84
|
18
|
13
|
11
|
15
|
15
|
4
|
-
|
-
|
-
|
-
|
-
|
-
|
-
|
-
|
-
|
-
|
-
|
-
|
-
|
|
Loan - repayment
|
$M
|
(482)
|
-
|
-
|
(1)
|
(29)
|
(38)
|
(45)
|
(52)
|
(59)
|
(31)
|
(39)
|
(38)
|
(37)
|
(34)
|
(30)
|
(15)
|
(12)
|
(10)
|
(8)
|
(4)
|
(1)
|
-
|
-
|
-
|
-
|
-
|
-
|
-
|
-
|
|
Loan - interest
|
$M
|
(106)
|
-
|
-
|
(1)
|
(12)
|
(12)
|
(11)
|
(10)
|
(8)
|
(7)
|
(11)
|
(9)
|
(7)
|
(6)
|
(4)
|
(3)
|
(2)
|
(2)
|
(1)
|
(0)
|
(0)
|
-
|
-
|
-
|
-
|
-
|
-
|
-
|
-
|
|
Cash From Financing
|
$M
|
(106)
|
-
|
8
|
157
|
(4)
|
(23)
|
(32)
|
(30)
|
(32)
|
47
|
(32)
|
(35)
|
(33)
|
(24)
|
(19)
|
(14)
|
(14)
|
(11)
|
(8)
|
(5)
|
(1)
|
-
|
-
|
-
|
-
|
-
|
-
|
-
|
-
|
|
Net cash flow
|
$M
|
3,959
|
25
|
(433)
|
(571)
|
162
|
208
|
150
|
(170)
|
209
|
490
|
351
|
340
|
350
|
347
|
252
|
207
|
231
|
271
|
236
|
359
|
303
|
427
|
232
|
77
|
7
|
(36)
|
(8)
|
(2)
|
(20)
|
|
Discount factors 8%2
|
#
|
|
0.981
|
0.926
|
0.857
|
0.794
|
0.735
|
0.681
|
0.630
|
0.583
|
0.540
|
0.500
|
0.463
|
0.429
|
0.397
|
0.368
|
0.340
|
0.315
|
0.292
|
0.270
|
0.250
|
0.232
|
0.215
|
0.199
|
0.184
|
0.170
|
0.158
|
0.146
|
0.135
|
0.125
|
|
Discount factors 10%2
|
#
|
|
0.976
|
0.909
|
0.826
|
0.751
|
0.683
|
0.621
|
0.564
|
0.513
|
0.467
|
0.424
|
0.386
|
0.350
|
0.319
|
0.290
|
0.263
|
0.239
|
0.218
|
0.198
|
0.180
|
0.164
|
0.149
|
0.135
|
0.123
|
0.112
|
0.102
|
0.092
|
0.084
|
0.076
|
|
NPV @ 8%
|
$M
|
1,100.4 |
|
|
NPV @ 10%
|
$M
|
770.7
|
1 Post closure costs beyond year 25 have been discounted to year 25 at 10% and added to the year 25 closure cost cash flow in the above table. Total column is the undiscounted total $ over the mine life
|
|
IRR
|
%
|
19.21%
|
2 Year -3 is a half year
|
| PRICE DECK |
| PRICE / RATE |
UNIT |
LONG TERM |
| Metals |
|
|
| Copper |
$/lb |
3.75 |
| Copper cathode net premium1 |
$/lb |
0.02 |
| Molybdenum |
$/lb |
12.00 |
| Gold - offtaker |
$/oz |
1,650.00 |
| Silver - offtaker |
$/oz |
22.00 |
| Gold - stream |
$/oz |
450.00 |
| Silver - stream |
$/oz |
3.90 |
| Stream contracted escalator2 |
% per year |
1.00 |
| Other |
|
|
| Molten sulfur - purchases |
$/tonne |
215.00 |
| Acid - sales |
$/tonne |
145.00 |
| Electricity |
$/kWh |
0.071 |
| NSR royalty |
% |
3.00 |
1 Copper cathode premium net of cathode transport charge
2 Annual escalator begins in Year 3
| MARKETING ASSUMPTIONS |
| PRICE / RATE |
UNIT |
LONG TERM |
| Molybdenum Concentrate |
|
|
| Realization % (of contained value) |
% |
88.00 |
| Dore |
|
|
| Refining charge - doré bar |
$/oz |
0.40 |
| Refining charge - Au |
$/oz |
0.55 |
| Payable % - Au |
% |
99.90 |
| Payable % - Ag |
% |
99.90 |
| Freight |
$/oz |
1.40 |
| Cu Concentrate - Sales |
|
|
| Treatment charge |
$/DMT |
75.00 |
| Refining charge - Cu |
$/lb |
0.075 |
| Payable % - Cu |
% |
96.50 |
| Payable % - Au |
% |
90.00 |
| Payable % - Ag |
% |
90.00 |
| Min deduction - Cu |
% |
1.00 |
| Min grade - Au |
g/tonne |
1.00 |
| Min grade - Ag |
g/tonne |
30.00 |
| Freight |
$/WMT |
173.00 |
| Moisture |
% |
8.00 |
| Cu Concentrate - Purchases |
|
|
| Purchase price |
$/tonne |
2,100.97 |
| Cu grade |
% |
28.00 |
| Mo grade |
% |
0.23 |
| Au grade |
g/tonne |
0.30 |
| Ag grade |
g/tonne |
110.00 |
| Zn grade |
% |
0.25 |
| S grade |
% |
34.00 |
| Freight capture |
$/DMT |
80.00 |
| OPERATING COST DETAILS - MINING |
| METRIC |
UNIT |
Total |
| Labor |
$M |
$773 |
| Maintenance |
$M |
$877 |
| Fuel |
$M |
$781 |
| Power |
$M |
$18 |
| Blasting |
$M |
$359 |
| Indirect |
$M |
$196 |
| Subtotal* |
$M |
$3,003 |
| Deferred stripping |
$M |
($362) |
| Total* |
$M |
$2,641 |
*Excludes pre-stripping costs
| OPERATING COST DETAILS - PROCESSING |
| METRIC |
UNIT |
LOM |
| Sulfide flotation |
$M |
$1,456 |
| Molybdenum flotation |
$M |
$71 |
| Concentrate leaching |
$M |
$359 |
| Precious metal plant |
$M |
$86 |
| Acid plant |
$M |
$5 |
| Molten sulfur purchased |
$M |
$370 |
| Tailings & water |
$M |
$313 |
| Labor |
$M |
$272 |
| Other |
$M |
$14 |
| Total |
$M |
$2,947 |
| CAPITAL COST SUMMARY |
| METRIC |
UNIT |
Cu Concentrator |
Cu Leach |
Total |
| Growth - EPCM |
$M |
$833 |
$364 |
$1,197 |
| Growth - owner's costs |
$M |
$490 |
$4 |
$494 |
| Growth - subtotal |
$M |
$1,323 |
$367 |
$1,690 |
| Sustaining |
$M |
$542 |
$0 |
$542 |
| Deferred stripping |
$M |
$362 |
$0 |
$362 |
| Total |
$M |
$2,227 |
$367 |
$2,595 |
| GROWTH CAPITAL DETAILS - EPCM |
| METRIC |
UNIT |
Cu Concentrator |
Cu Leach |
Total |
| Sitewide |
$M |
$22 |
$0 |
$22 |
| Mining |
$M |
$34 |
$0 |
$34 |
| Primary crushing |
$M |
$31 |
$0 |
$31 |
| Sulfide plant |
$M |
$270 |
$0 |
$270 |
| Molybdenum plant |
$M |
$21 |
$0 |
$21 |
| Reagents |
$M |
$10 |
$3 |
$14 |
| Plant services |
$M |
$12 |
$0 |
$12 |
| Acid plant |
$M |
$0 |
$79 |
$79 |
| Concentrate leach SX/EW |
$M |
$0 |
$28 |
$28 |
| Precious metal plant |
$M |
$0 |
$7 |
$7 |
| Leach plant (Albion) |
$M |
$0 |
$140 |
$140 |
| Site services and utilities |
$M |
$4 |
$0 |
$4 |
| Internal infrastructure |
$M |
$52 |
$0 |
$52 |
| External infrastructure |
$M |
$112 |
$0 |
$112 |
| Common construction |
$M |
$33 |
$13 |
$46 |
| Other |
$M |
$98 |
$37 |
$134 |
| Contingency |
$M |
$134 |
$57 |
$191 |
| Total |
$M |
$833 |
$364 |
$1,197 |
| GROWTH CAPITAL DETAILS - OWNER'S COSTS |
| METRIC |
UNIT |
Cu Concentrator |
Cu Leach |
Total |
| Mining fleet and equipment |
$M |
$218 |
$0 |
$218 |
| Less: equipment financing |
$M |
($167) |
$0 |
($167) |
| Pre-stripping |
$M |
$89 |
$0 |
$89 |
| Tailings storage |
$M |
$84 |
$0 |
$84 |
| Earthworks and roads |
$M |
$26 |
$0 |
$26 |
| G&A and other |
$M |
$149 |
$4 |
$153 |
| Indirects and contingency |
$M |
$90 |
$0 |
$90 |
| Total |
$M |
$490 |
$4 |
$494 |
| SUSTAINING CAPITAL DETAILS |
| METRIC |
UNIT |
Total |
| Mining - fleet |
$M |
$186 |
| Less: equipment financing |
$M |
($158) |
| Mining - all other |
$M |
$422 |
| Processing |
$M |
$57 |
| Admin |
$M |
$37 |
| Total |
$M |
$542 |
Figure 1: Copper World Phase I Open Pit Footprint
Phase I is expected to consist of four open pits and all associated infrastructure within a footprint that requires only state and local permits for 20 years of operation.

Figure 2: Copper World General Plant Site Layout
Phase I includes a 60,000 ton per day conventional concentrator with an expansion in year 5 to include a concentrate leach facility to produce copper cathode onsite.

Figure 3: Copper World Phase I Tailings Storage Facilities
The project assumes conventional tailings deposition in three tailings storage facilities located on land requiring only state and local permits for Phase I.

Figure 4: Reduction in GHG Emissions from Concentrate Leach Facility
One of the many benefits of producing copper cathode on site using the concentrate leach facility as presented in the PFS is that the cathode is likely to be sold entirely to the domestic U.S. market, thereby reducing total GHG emissions by an estimated 14% compared to an operation that solely produces copper concentrate (flotation only). Constructing the full 100% capacity concentrate leach facility at inception would reduce total GHG emissions by 25%.


Figure 5: Copper World Mineral Resources
The mineral resource estimates were prepared using a 0.1% copper cut-off and include four deposits: Peach-Elgin, West, Broadtop Butte and East.

________________________________________
i Cash cost and sustaining cash cost exclude the cost of purchasing external concentrate, which may vary in price and or potentially be replaced with additional internal feed. By-product credits calculated using amortization of deferred revenue for gold and silver stream sales as per the company's approach in its quarterly financial reporting. By-product credits also include the revenue from the sale of excess acid produced at a price of $145 per tonne. Sustaining cash cost includes sustaining capital expenditures and royalties. Cash cost and sustaining cash cost are non-IFRS financial performance measures with no standardized definition under IFRS. For further details on why Hudbay believes cash costs are a useful performance indicator, please refer to the company's Management's Discussion and Analysis for the three and six months ended June 30, 2023.
ii Sourced from Wood Mackenzie (Q2 2023 dataset).
iii Sourced from S&P Global, August 2023.
NI 43-101 Technical Report
Phase I Pre-Feasibility Study and
Updated Mineral Resource Estimates
Copper World Project
Pima County, Arizona, USA
Effective Date: July 1, 2023

25 York Street, Suite 800
Toronto, Ontario
Canada M5J 2V5
Prepared by:
Olivier Tavchandjian, P. Geo., Hudbay Minerals Inc.
CAUTIONARY NOTE REGARDING FORWARD-LOOKING INFORMATION
This technical report contains forward-looking information within the meaning of applicable Canadian and United States securities legislation. All information contained in this technical report, other than statements of current and historical fact, is forward-looking information. Often, but not always, forward-looking information can be identified by the use of words such as "plans", "expects", "budget", "guidance", "scheduled", "estimates", "forecasts", "strategy", "target", "intends", "objective", "goal", "understands", "anticipates" and "believes" (and variations of these or similar words) and statements that certain actions, events or results "may", "could", "would", "should", "might" "occur" or "be achieved" or "will be taken" (and variations of these or similar expressions). All of the forward-looking information in this technical report is qualified by this cautionary note.
Forward-looking information includes, but is not limited to, the results and findings of the PFS, including the production, operating cost, capital cost and cash cost estimates, the projected valuation metrics and rates of return, the cash flow and EBITDA projections, statements regarding the anticipated permitting requirements and project design, including processing and tailings facilities, metal recoveries, mine life and production rates for the Copper World project, the expected funding requirements for the Copper World project, the potential to further enhance the economics of the Copper World project and optimize the design in the future, the possibility of extending the life of the mine, plans for future feasibility studies and a joint venture partner, the expected social and environmental benefits of the Copper World project, as well as potential timelines for obtaining the required permits and financing and sanctioning the Copper World project. Forward-looking information is not, and cannot be, a guarantee of future results or events. Forward-looking information is based on, among other things, opinions, assumptions, estimates and analyses that, while considered reasonable by us at the date the forward-looking information is provided, inherently are subject to significant risks, uncertainties, contingencies and other factors that may cause actual results and events to be materially different from those expressed or implied by the forward-looking information.
The material factors or assumptions that Hudbay identified and were applied by the company in drawing conclusions or making forecasts or projections set out in the forward-looking information include, but are not limited to:
• obtaining all required permits to develop the Copper World project on anticipated timelines;
• no delays or disruption due to litigation challenging the permitting requirements for the Copper World project and no significant unanticipated litigation;
• the implementation of the concentrate leach facility in Year 5 of the mine plan;
• the success of exploration and development activities at Copper World;
• the accuracy of geological, mining and metallurgical estimates;
• anticipated metals prices and the costs of production;
• the supply and demand for metals Hudbay produces;
• the supply and availability of all forms of energy, fuels and molten sulfur at reasonable prices;
• no significant unanticipated operational or technical difficulties;
• the availability of additional financing, if needed;
• the ability to complete project targets on time and on budget;
• the availability of personnel for the company's exploration, development and operational projects and ongoing employee relations;
• maintaining good relations with the communities in which the company operates, including the neighbouring communities and local governments in Arizona;
• no significant unanticipated challenges with stakeholders at Copper World;
• no significant unanticipated events or changes relating to regulatory, environmental, health and safety matters;
• no contests over title to Hudbay's properties, including as a result of rights or claimed rights of Indigenous peoples or challenges to the validity of its unpatented mining claims;
• an upfront stream deposit of $230 million will be paid by Wheaton Precious Metals at the commencement of construction;
• no offtake commitments in respect of production from the Copper World project;
• certain tax matters, including, but not limited to the mining tax regime in Arizona; and
• no significant and continuing adverse changes in general economic conditions or conditions in the financial markets (including commodity prices and foreign exchange rates).
The risks, uncertainties, contingencies and other factors that may cause actual results to differ materially from those expressed or implied by the forward-looking information may include, but are not limited to, risks generally associated with the mining industry and the current geopolitical environment, including future commodity prices, currency and interest rate fluctuations, energy and consumable prices, supply chain constraints and general cost escalation in the current inflationary environment, risks related to project delivery and financing; ongoing and potential litigation processes and other legal challenges that could affect the permitting timeline for the Copper World project, risks related to political or social instability and changes in government and government policy, risks related to changes in law, risks in respect of community relations, risks related to contracts that were entered into in respect of the former Rosemont project, uncertainties related to the geology, continuity, grade and estimates of mineral reserves and resources, and the potential for variations in grade and recovery rates, risks related to the timing and implementation of the concentrate leach facility, climate change related risks and uncertainties, as well as the risks discussed under the heading "Risk Factors" in the company's annual information form and under the heading "Financial Risk Management" in the company's management's discussion and analysis.
Should one or more risk, uncertainty, contingency or other factor materialize or should any factor or assumption prove incorrect, actual results could vary materially from those expressed or implied in the forward-looking information. Accordingly, you should not place undue reliance on forward-looking information. The company does not assume any obligation to update or revise any forward-looking information after the date of this technical report or to explain any material difference between subsequent actual events and any forward-looking information, except as required by applicable law.
CAUTIONARY NOTE REGARDING NI 43-101
The scientific and technical information contained in this technical report has been approved by Olivier Tavchandjian, P. Geo, Hudbay's Senior Vice President, Exploration and Technical Services. Mr. Tavchandjian is a qualified person pursuant to Canadian Securities Administrators' National Instrument 43-101 - Standards of Disclosure for Mineral Projects ("NI 43-101").
This pre-feasibility study ("PFS") is the current NI 43-101 technical report in respect of all of the mineral properties that form part of the Copper World project and supersedes and replaces the 2022 PEA (as defined herein) in its entirety.
NON-IFRS FINANCIAL PERFORMANCE MEASURES
Cash cost and sustaining cash cost per pound of copper produced are shown because the company believes they help investors and management assess the performance of its operations, including the margin generated by the operations and the company. Unit operating costs are shown because these measures are used by the company as a key performance indicator to assess the performance of its mining and processing operations. EBITDA is shown to provide additional information about the cash generating potential in order to assess the company's capacity to service and repay debt, carry out investments and cover working capital needs. These measures do not have a meaning prescribed by IFRS and are therefore unlikely to be comparable to similar measures presented by other issuers. These measures should not be considered in isolation or as a substitute for measures prepared in accordance with IFRS and are not necessarily indicative of operating profit or cash flow from operations as determined under IFRS. Other companies may calculate these measures differently. For further details on these measures, please refer to page 42 of Hudbay's management's discussion and analysis for the three and six months ended June 30, 2023 available on SEDAR+ at www.sedarplus.ca and EDGAR at www.sec.gov.
CAUTIONARY NOTE TO UNITED STATES INVESTORS
This Technical Report has been prepared in accordance with the requirements of the securities laws in effect in Canada, which differ from the requirements of United States securities laws. Canadian reporting requirements for disclosure of mineral properties are governed NI 43-101.
For this reason, information contained in this Technical Report in respect of the Copper World Project may not be comparable to similar information made public by United States companies subject to the reporting and disclosure requirements under the United States federal securities laws and the rules and regulations thereunder. For further information on the differences between the disclosure requirements for mineral properties under the United States federal securities laws and NI 43-101, please refer to Hudbay's AIF, a copy of which has been filed under Hudbay's profile on SEDAR+ at www.sedarplus.com and Hudbay's Form 40-F, a copy of which has been filed on EDGAR at www.edgar.com.
SIGNATURE PAGE
This Technical Report titled "NI 43-101 Technical Report, Phase I Pre-Feasibility Study and Updated Mineral Resource Estimates, Copper World Project, Pima County, Arizona, USA", dated September 7, 2023, and effective as of July 1st, 2023, was prepared under the supervision and signed by the following author:
Dated this 7th day of September 2023.
/s/ Olivier Tavchandjian
Signature of Qualified Person
Olivier Tavchandjian, P. Geo.
Senior Vice President, Exploration and Technical Services
Hudbay Minerals Inc.
TABLE OF CONTENTS
| SIGNATURE PAGE |
I |
| |
|
| 1 SUMMARY |
1-1 |
| |
|
| 1.1 Introduction |
1-1 |
| 1.2 Property Description & Location |
1-2 |
| 1.3 Geological Setting & Mineralization |
1-2 |
| 1.4 Deposit Types |
1-3 |
| 1.5 Exploration |
1-3 |
| 1.6 Drilling, Sample Preparation, Analytical Procedures, & Data Validation |
1-4 |
| 1.7 Mineral Processing & Metallurgical Testing |
1-4 |
| 1.8 Mineral Resource Estimates |
1-7 |
| 1.9 Mineral Reserve Estimate |
1-9 |
| 1.10 Mining Methods |
1-10 |
| 1.11 Project Infrastructure |
1-14 |
| 1.12 Marketing |
1-15 |
| 1.13 Environmental Studies, Permitting, & Social or Community |
1-17 |
| 1.13.1 Environmental Studies |
1-17 |
| 1.13.2 Project Permitting |
1-17 |
| 1.13.3 Social & Community Requirements & Plans |
1-17 |
| 1.13.4 Facility Details & Monitoring |
1-18 |
| 1.13.5 Social & Environmental Benefits of the Project |
1-18 |
| 1.13.6 Reclamation & Closure |
1-19 |
| 1.14 Capital & Operating Costs |
1-19 |
| 1.15 Economic Analysis |
1-19 |
| |
|
| 2 INTRODUCTION & TERMS OF REFERENCE |
2-1 |
| |
|
| 2.1 General |
2-1 |
| 2.2 Terms of Reference |
2-2 |
| 2.3 Qualified Persons |
2-3 |
| 2.4 Site Visits & Responsibility |
2-3 |
| 2.5 Unit Abbreviations |
2-3 |
| 2.6 Name Abbreviations |
2-4 |
| |
|
| 3 RELIANCE ON OTHER EXPERTS |
3-1 |
| |
|
| 4 PROPERTY DESCRIPTION & LOCATION |
4-1 |
| |
|
| 4.1 Location |
4-1 |
| 4.2 Tenure |
4-2 |
| |
|
| 5 ACCESSIBILITY, CLIMATE, LOCAL RESOURCES, INFRASTRUCTURE, & PHYSIOGRAPHY |
5-1 |
| |
|
| 5.1 Accessibility |
5-1 |
| 5.2 Climate |
5-1 |
| 5.3 Local Resources |
5-2 |
| 5.4 Infrastructure |
5-2 |
| 5.5 Physiography |
5-2 |
| |
|
| 6 HISTORY |
6-1 |
| |
|
| 6.1 Helvetia-Rosemont Mining District (1875-1973) |
6-1 |
| 6.2 Anamax Mining Company (1973-1985) |
6-2 |
| 6.3 Asarco Incorporated (1988-2004) |
6-3 |
| 6.4 Augusta Resource Corporation (2005-2014) |
6-3 |
| 6.5 Hudbay (2014-Present) |
6-3 |
| |
|
| 7 GEOLOGICAL SETTING & MINERALIZATION |
7-1 |
| |
|
| 7.1 Regional Geology |
7-1 |
| 7.2 District Geology |
7-1 |
| 7.3 Deposit Geology |
7-2 |
| 7.4 Alteration |
7-3 |
| 7.5 Structural Domains |
7-4 |
| 7.6 Mineralization |
7-6 |
| 7.6.1 East Deposit |
7-6 |
| 7.6.2 Bolsa Deposit |
7-6 |
| 7.6.3 Broadtop Butte Deposit |
7-7 |
| 7.6.4 West Deposit |
7-7 |
| 7.6.5 Peach-Elgin Deposit |
7-7 |
| |
|
| 8 DEPOSIT TYPE |
8-1 |
| |
|
| 9 EXPLORATION |
9-1 |
| |
|
| 9.1 Previous Work |
9-1 |
| 9.2 Exploration Potential Between, & Proximal to, Known Deposits |
9-2 |
| 9.3 Additional Regional Potential on Hudbay Tenements |
9-2 |
| |
|
| 10 DRILLING |
10-1 |
| |
|
| 10.1 Lewisohn & Banner Mining Company (1953 - 1963) |
10-1 |
| 10.2 Anaconda Mining Company (1963 - 1986) |
10-1 |
| 10.3 Asarco Mining Company (1988 - 2004) |
10-2 |
| 10.4 Augusta Resource Corporation (2005 - 2012) |
10-3 |
| 10.5 Hudbay (2014 - 2015) |
10-3 |
| 10.6 Hudbay (2020 - 2022) |
10-4 |
| 10.7 Drilling Method & Survey |
10-4 |
| |
|
| 11 SAMPLE PREPARATION, ANALYSES, & SECURITY |
11-1 |
| |
|
| 11.1 Summary of Earlier Work (1956-2016) |
11-1 |
| 11.1.1 Core Logging, Documentation, & Security |
11-1 |
| 11.1.2 Preparation Methods |
11-2 |
| 11.1.3 Assay Methodologies |
11-3 |
| 11.1.4 Density Measurements |
11-3 |
| 11.1.5 Conclusion on the Historical Data |
11-4 |
| 11.2 Summary of Work Done Since 2020 |
11-4 |
| 11.2.1 Core Logging |
11-4 |
| 11.2.2 Sample Selection |
11-4 |
| 11.2.3 Core Photographs |
11-5 |
| 11.2.4 Core Cutting |
11-5 |
| 11.2.5 Sample Dispatching |
11-5 |
| 11.2.6 Sample Preparation |
11-5 |
| 11.2.7 Density Measurements |
11-6 |
| 11.2.8 Assay Methodology |
11-7 |
| 11.2.9 Quality Assurance & Quality Control Programs |
11-9 |
| 11.2.10 External Checks |
11-16 |
| 11.2.11 Conclusion |
11-19 |
| |
|
| 12 DATA VERIFICATION |
12-1 |
| |
|
| 12.1 Summary of Earlier Work (1956 -2017) |
12-1 |
| 12.2 Drill Collar & Drill Pad Setup |
12-2 |
| 12.3 Collar Survey |
12-2 |
| 12.4 Downhole Survey Method |
12-2 |
| 12.5 Procedures for Geologists & Technicians |
12-2 |
| 12.6 Inspection of Laboratories by Hudbay Personnel |
12-2 |
| 12.7 Drill Hole Database |
12-2 |
| 12.8 Data Security |
12-2 |
| 12.9 Assay Results Verification |
12-3 |
| 12.10 Site Visits |
12-3 |
| 12.11 Conclusion |
12-3 |
| |
|
| 13 MINERAL PROCESSING & METALLURGICAL TESTING |
13-1 |
| |
|
| 13.1 Metallurgical Testing Programs |
13-1 |
| 13.2 Samples & Representativity |
13-1 |
| 13.3 Mineralogy |
13-2 |
| 13.4 Comminution |
13-5 |
| 13.5 Flotation |
13-5 |
| 13.5.1 Copper-Molybdenum Separation |
13-9 |
| 13.5.2 Concentrate Quality |
13-10 |
| 13.5.3 Flotation Recovery Estimates |
13-10 |
| 13.6 Concentrate Leaching |
13-12 |
| 13.7 Sulfur Purification & Burning |
13-14 |
| 13.7.1 Sulfur Flotation |
13-14 |
| 13.7.2 Sulfur Melting |
13-15 |
| 13.7.3 Sulfur Burning |
13-15 |
| 13.8 Precious Metals Recovery |
13-15 |
| 13.9 ROM Leaching |
13-15 |
| 13.10 Tailings Dewatering |
13-16 |
| 13.11 Conclusions & Recommendations |
13-16 |
| |
|
| 14 MINERAL RESOURCE ESTIMATES |
14-1 |
| |
|
| 14.1 Drilling Database |
14-1 |
| 14.2 Modeling of the Mineralized Envelopes |
14-1 |
| 14.3 Density for the East Deposit |
14-4 |
| 14.4 Density for the Copper World Deposits |
14-6 |
| 14.5 Compositing |
14-6 |
| 14.6 Exploratory Data Analysis |
14-7 |
| 14.7 Grade Capping |
14-7 |
| 14.8 Variography |
14-7 |
| 14.9 Grade Estimation & Interpolation Methods |
14-9 |
| 14.10 Grade Estimation Validation |
14-10 |
| 14.11 Visual Inspection |
14-10 |
| 14.12 Global Bias Checks |
14-13 |
| 14.13 Smoothing Assessment |
14-14 |
| 14.14 Smoothing Correction |
14-15 |
| 14.15 Classification of Mineral Resource |
14-16 |
| 14.16 Reasonable Prospects for Economics Extraction & Mineral Resource Estimates |
14-18 |
| 14.17 Conclusion |
14-19 |
| |
|
| 15 MINERAL RESERVE ESTIMATES |
15-1 |
| |
|
| 15.1 Pit Optimization |
15-1 |
| 15.2 Block Model |
15-1 |
| 15.2.1 Metallurgical Recoveries |
15-1 |
| 15.2.2 Economic Parameters |
15-2 |
| 15.2.3 Net Smelter Return |
15-3 |
| 15.3 Mineral Reserves |
15-4 |
| 15.3.1 Mineral Reserve Definition Parameters |
15-5 |
| 15.3.2 Material Densities |
15-5 |
| 15.3.3 Dilution |
15-5 |
| 15.3.4 Mineral Reserves Statement |
15-6 |
| 15.3.5 Factors That May Affect the Mineral Reserve Estimate |
15-6 |
| 15.4 Percent Model to Full Block Model |
15-7 |
| 16 MINING METHODS |
16-1 |
| |
|
| 16.1 Mine Overview |
16-1 |
| 16.2 Mine Phases |
16-1 |
| 16.2.1 Design Criteria |
16-1 |
| 16.2.2 Pit Slope Guidance |
16-2 |
| 16.2.3 Mine Phases & Ultimate Pit |
16-4 |
| 16.3 Mine Schedule & Production Plan |
16-7 |
| 16.3.1 Production Scheduling Criteria |
16-7 |
| 16.3.2 Mill Feed Cut-Off Grade Strategy |
16-8 |
| 16.3.3 Mine Plan |
16-9 |
| 16.4 Mine Facilities |
16-15 |
| 16.4.1 Waste Rock Facility & Tailings Storage Facility |
16-15 |
| 16.5 Mine Equipment |
16-16 |
| 16.5.1 Large Equipment Operating Parameters |
16-16 |
| 16.5.2 Mine Equipment Calculation |
16-17 |
| 16.6 Mine Operations |
16-19 |
| 16.6.1 Drilling & Blasting |
16-19 |
| 16.6.2 Slope Monitoring |
16-19 |
| 16.6.3 Loading |
16-19 |
| 16.6.4 Hauling |
16-19 |
| 16.6.5 Support Equipment |
16-19 |
| 16.7 Mining Engineering |
16-20 |
| 16.7.1 Geotechnical Program - Satellite Pits |
16-20 |
| 16.7.2 Geotechnical Results & Mine Planning |
16-21 |
| 16.7.3 Hydrogeology Mine Planning |
16-22 |
| |
|
| 17 RECOVERY METHODS |
17-1 |
| |
|
| 17.1 Overview |
17-1 |
| 17.2 Process Flowsheet |
17-1 |
| 17.3 Process Design Criteria |
17-4 |
| 17.4 Plant Description |
17-8 |
| 17.4.1 Crushing Plant |
17-8 |
| 17.4.2 Coarse Feed Stockpile |
17-9 |
| 17.4.3 Grinding & Classification |
17-9 |
| 17.4.4 Bulk Flotation |
17-9 |
| 17.4.5 Molybdenum Flotation |
17-10 |
| 17.4.6 Copper Concentrate Dewatering |
17-10 |
| 17.4.7 Molybdenum Concentrate Dewatering |
17-10 |
| 17.4.8 Copper Concentrate Leaching |
17-11 |
| 17.4.9 Acid Plant |
17-13 |
| 17.4.10 Tailings |
17-13 |
| 17.4.11 Reagents & Consumables |
17-14 |
| 17.4.12 Water Supply |
17-15 |
| 17.4.13 Air Supply |
17-15 |
| 17.4.14 Assay Laboratory |
17-15 |
| |
|
| 18 PROJECT INFRASTRUCTURE |
18-1 |
| |
|
| 18.1 Access Roads, Plant Roads, & Haul Roads |
18-1 |
| 18.2 Processing Plants |
18-1 |
| 18.3 Power Supply & Distribution |
18-2 |
| 18.4 Water Supply & Distribution |
18-2 |
| 18.5 Communications |
18-3 |
| 18.6 Air Services |
18-3 |
| 18.7 Tailings Storage Facility |
18-3 |
| 18.7.1 Tailings Storage Facility Designs |
18-4 |
| 18.7.2 Stability Analysis |
18-5 |
| 18.8 Waste Rock Facility |
18-6 |
| 18.9 Site Water Management |
18-6 |
| 18.9.1 Stormwater Management Facilities |
18-6 |
| 18.9.2 Tailings Storage Water Management |
18-7 |
| 18.9.3 Waste Rock Water Management |
18-7 |
| 18.10 Mine & Other Infrastructure |
18-7 |
| 18.10.1 Mine Infrastructure |
18-7 |
| 18.10.2 Plant Maintenance Shop, Warehouse, & Plant Administration |
18-7 |
| |
|
| 19 MARKETING |
19-1 |
| |
|
| 19.1 Copper Concentrate |
19-1 |
| 19.2 Copper Metal |
19-1 |
| 19.3 Molybdenum |
19-2 |
| 19.4 Sulfur |
19-2 |
| 19.5 Sulfuric Acid |
19-3 |
| 19.6 Silver Dore |
19-3 |
| 19.7 Marketing Assumptions Used in the Economic Model |
19-4 |
| |
|
| 20 ENVIRONMENTAL STUDIES, PERMITTING, & SOCIAL OR COMMUNITY IMPACT |
20-1 |
| |
|
| 20.1 Environmental Studies |
20-1 |
| 20.1.1 Biological |
20-1 |
| 20.1.2 Cultural |
20-1 |
| 20.1.3 Geochemical |
20-2 |
| 20.1.4 Groundwater |
20-2 |
| 20.1.5 Surface Water |
20-2 |
| 20.2 Project Permitting |
20-2 |
| 20.3 Social & Community Requirements & Plans |
20-4 |
| 20.4 Facility Details & Monitoring |
20-4 |
| 20.4.1 Waste Rock Facility |
20-4 |
| 20.4.2 Tailings Storage Facility |
20-5 |
| 20.4.3 Open Pits |
20-5 |
| 20.4.4 Process Plant |
20-5 |
| 20.4.5 Monitoring & Inspections |
20-5 |
| 20.5 Social & Environmental Benefits of the Project |
20-6 |
| 20.6 Reclamation & Closure |
20-7 |
| 20.6.1 Reclamation & Closure Concepts |
20-8 |
| 20.6.2 Closure Costs |
20-8 |
| 20.6.3 Financial Assurance |
20-8 |
| |
|
| 21 CAPITAL & OPERATING COSTS |
21-1 |
| |
|
| 21.1 Capital Costs Summary |
21-1 |
| 21.2 Growth Capital Costs |
21-1 |
| 21.2.1 EPCM Growth Capital Costs |
21-1 |
| 21.2.2 Owner's Growth Capital Costs |
21-4 |
| 21.3 Sustaining Capital Costs |
21-5 |
| 21.4 Operating Costs |
21-5 |
| |
|
| 22 ECONOMIC ANALYSIS |
22-1 |
| |
|
| 22.1 Summary of Results |
22-1 |
| 22.2 Sensitivity Analysis |
22-1 |
| 22.2.1 Sensitivity to Key Input Parameters on the Financial Model |
22-1 |
| 22.2.2 Sensitivity to the Addition of the Concentrate Leach Facility |
22-3 |
| 22.3 Key Model Assumptions |
22-4 |
| 22.3.1 Valuation Approach |
22-4 |
| 22.3.2 Processing |
22-4 |
| 22.3.3 Metal Price & Other Marketing Assumptions |
22-5 |
| 22.3.4 Royalty |
22-5 |
| 22.3.5 Stream |
22-5 |
| 22.3.6 Federal & State Taxes |
22-5 |
| 22.3.7 Working Capital Changes |
22-7 |
| 22.4 Production Profile & Cost of Production |
22-7 |
| 22.5 Details of the Economic Model & Cash Flow Profile |
22-8 |
| 23 ADJACENT PROPERTIES |
23-1 |
| |
|
| 24 OTHER RELEVANT DATA & INFORMATION |
24-1 |
| |
|
| 25 INTERPRETATION & CONCLUSIONS |
25-1 |
| |
|
| 25.1 Recent History of the Project |
25-1 |
| 25.2 Open Pit Mining |
25-1 |
| 25.3 Metallurgy & Processing |
25-1 |
| 25.4 Environmental Studies, Permitting, & Social or Community Impact |
25-2 |
| 25.5 Economic Analysis |
25-3 |
| 25.6 Risks & Uncertainties |
25-3 |
| |
|
| 26 RECOMMENDATIONS |
26-1 |
| |
|
| 26.1 Drilling & Resource Modeling Updates |
26-1 |
| 26.2 Feasibility Engineering Work |
26-1 |
| 26.2.1 Geotechnical Investigation & Design |
26-1 |
| 26.2.2 Surveys |
26-1 |
| 26.2.3 Hydrogeology Investigation & Study; Groundwater Model & Pit Dewatering |
26-2 |
| 26.2.4 Geochemical Impact Assessment |
26-2 |
| 26.2.5 Mining |
26-2 |
| 26.2.6 Water Management |
26-2 |
| 26.2.7 Metallurgy & Processing |
26-2 |
| 26.2.8 Infrastructure & Site Layout |
26-3 |
| 26.2.9 Logistics & Procurement |
26-4 |
| 26.2.10 Waste & Water Management |
26-4 |
| 26.2.11 Workforce & Schedule |
26-4 |
| 26.2.12 Environmental, Permitting, Social, & Sustainability |
26-4 |
| |
|
| REFERENCES |
27-1 |
LIST OF FIGURES
| Figure 1-1: Project Property Location |
1-3 |
| Figure 1-2: Comparison of Variability Testing With & Without CPS Copper Recovery vs. Acid Soluble Copper/Total Copper |
1-5 |
| Figure 1-3: Plan of Open Pits |
1-11 |
| Figure 1-4: Mine Production from Copper World Deposits over Full Life of Mine |
1-12 |
| Figure 1-5: Reduction in Energy Consumption & Emissions Resulting from the Flowsheet of the Project |
1-18 |
| Figure 4-1: Project Property Ownership |
4-1 |
| Figure 5-1: Project Property Location |
5-1 |
| Figure 6-1: Location of Historical Mine in the Helvetia-Rosemont Mining District |
6-1 |
| Figure 7-1: Laramide Belt & Associated Porphyry Copper Mineralization (Barra, 2005) |
7-1 |
| Figure 7-2: Project Regional Geology |
7-2 |
| Figure 7-3: East Deposit - Vertical Geological Section 11,555,050' N, Looking North |
7-2 |
| Figure 7-4: Peach-Elgin Deposit - Vertical Geological Section (Simplified) 11,656,200' N, Looking North |
7-3 |
| Figure 7-5: Broadtop Butte Deposit - Vertical Geological Section 11,562,000' N, Looking North |
7-3 |
| Figure 7-6: Project Deposit Geologic Model Structural Domains & Major Lithologies Plan View |
7-4 |
| Figure 7-7: East Deposit Geological Model of Structural Domains 3D View, Looking North |
7-5 |
| Figure 10-1: Drill Hole Locations by Company |
10-2 |
| Figure 11-1: Comparison Between Sulfur BY LECO & ICP at Bureau Veritas |
11-15 |
| Figure 11-2: Comparison Between Sulfur Analysis at Bureau Veritas vs ALS & SGS |
11-18 |
| Figure 11-3: Comparison Between Gold Analysis at ALS vs Skyline |
11-19 |
| Figure 13-1: Comparison of Variability Testing With & Without CPS Copper Recovery vs. Acid Soluble Copper/Total Copper |
13-7 |
| Figure 13-2: Mo Recovery vs. Acid Soluble Copper/Total Copper |
13-11 |
| Figure 13-3: Ag Recovery vs. Acid Soluble Copper/Total Copper |
13-11 |
| Figure 13-4: Au Recovery vs. Acid Soluble Copper/Total Copper |
13-12 |
| Figure 13-5: Solution Copper Tenors Over Time |
13-14 |
| Figure 13-6: PFS vs 2022 PEA Cu ROM Leach Recovery |
13-16 |
| Figure 14-1: General View of the Copper World 0.1% Grade Shells |
14-2 |
| Figure 14-2: Cross Section of the Mineralized Domains at East Deposit |
14-3 |
| Figure 14-3: Peach-Elgin Mineralized Envelopes |
14-3 |
| Figure 14-4: West Mineralised Envelope |
14-4 |
| Figure 14-5: Broadtop Butte Mineralised Envelopes |
14-4 |
| Figure 14-6: Typical Cross Section of East Deposit with Geological Units Looking North |
14-5 |
| Figure 14-7: Ore Percentage Example |
14-9 |
| Figure 14-8: East Deposit - OK Model & Copper Grade Composites E-W Section View |
14-10 |
| Figure 14-9: Peach-Elgin Deposit - OK Model & Copper Grade Composites E-W Section View |
14-11 |
| Figure 14-10: Copper World Deposit - OK Model & Copper Grade Composites E-W Section View |
14-11 |
| Figure 14-11: Broadtop Butte Deposit - OK Model & Copper Grade Composites E-W Section View |
14-12 |
| Figure 14-12: Bolsa Area (Part of East Deposit) - OK Model & Copper Grade Composites E-W Section View |
14-12 |
| Figure 14-13: WSP Model of Skarn Mineralization & Composites Broadtop Butte Zone - Plan View |
14-17 |
| Figure 14-14: Resource Classification at the East & Copper World Deposits |
14-17 |
| Figure 15-1: Project Pit Shell sensitivity analysis, by Revenue Factor |
15-4 |
| Figure 15-2: Plan View of Selected Lerchs-Grossman Pit |
15-5 |
| Figure 16-1: Project Mine Plan Site Layout |
16-2 |
| Figure 16-2: Geotechnical Sectors of East Pit |
16-3 |
| Figure 16-3: Plan View of the Project with Mine Phases |
16-4 |
| Figure 16-4: Section B-B' - Broadtop Butte Pit Mine Phases |
16-5 |
| Figure 16-5: Section C-C' - West Pit Mine Phases |
16-5 |
| Figure 16-6: Section D-D' - Peach-Elgin Pit Mine Phases |
16-5 |
| Figure 16-7: Section A-A' - East Pit Mine Phases |
16-6 |
| Figure 16-8: Annual Material Movement Plan |
16-8 |
| Figure 16-9: Plant Feed Mill Tonnages by Year |
16-8 |
| Figure 16-10: Mine Production from the Four Pits Over Life Of Mine |
16-9 |
| Figure 16-11: Mine Plan in Pre-Stripping |
16-11 |
| Figure 16-12: Mine Plan in Year 1 |
16-11 |
| Figure 16-13: Mine Plan in Year 2 |
16-12 |
| Figure 16-14: Mine Plan in Year 3 |
16-12 |
| Figure 16-15: Mine Plan in Year 4 |
16-13 |
| Figure 16-16: Mine Plan in Year 5 |
16-13 |
| Figure 16-17: Mine Plan in Year 10 |
16-14 |
| Figure 16-18: Mine Plan in Year 15 |
16-14 |
| Figure 16-19: Mine Plan Final Configuration at End of Mine Life |
16-15 |
| Figure 16-20: Waste & Tailing Loading Plan |
16-16 |
| Figure 16-21: Mine Equipment Requirements (Million Tons) |
16-16 |
| Figure 16-22: Haulage Fleet Per Year |
16-17 |
| Figure 17-1: Process Plant Flowsheet - Sulfide Concentrator |
17-2 |
| Figure 17-2: Process Plant Flowsheet - Concentrate Leach Facility |
17-3 |
| Figure 18-1: General Plant Site Arrangement |
18-1 |
| Figure 18-2: Infrastructure Arrangements |
18-4 |
| Figure 19-1: Global Copper Production & Primary Demand (Wood Mackenzie, 2023) |
19-1 |
| Figure 19-2: Global Copper Market Fundamentals (Wood Mackenzie, 2023) |
19-2 |
| Figure 20-1: Reducing Energy Consumption & GHG Emissions from Sulfide & Oxide Leaching |
20-7 |
| Figure 22-1: Sensitivity to Copper Price |
22-2 |
| Figure 22-2: Sensitivity to Concentrator Process Plant Growth Capex by 5% Increments |
22-2 |
| Figure 22-3: Sensitivity to Discount Rate |
22-2 |
| Figure 22-4: Sensitivity to Concentrate Leach Plant Capacity |
22-3 |
| Figure 22-5: Production Profile (KTonnes) |
22-7 |
| Figure 22-6: Sustaining Cash Costs |
22-8 |
| Figure 22-7: LOM Cash Flow Profile |
22-8 |
LIST OF TABLES
| Table 1-1: Drill Hole Summary |
1-4 |
| Table 1-2: Mineral Resource Statement (Inclusive of Mineral Reserves) |
1-8 |
| Table 1-3: Mineral Resource Statement (Exclusive of Mineral Reserves) |
1-9 |
| Table 1-4: Comparison of 2022 vs 2023 Mineral Resource Estimates |
1-9 |
| Table 1-5: Proven & Probable Mineral Reserves Total - Final Pits |
1-10 |
| Table 1-6: Mine Plan (Imperial Units) |
1-13 |
| Table 1-7: Mine Plan (Metric Units) |
1-13 |
| Table 1-8: Mine Equipment Fleet by Year |
1-14 |
| Table 1-9: Commodity Price Assumptions |
1-16 |
| Table 1-10: Summary of Project Key Valuation Metrics at $3.75/lb. Cu |
1-20 |
| Table 2-1: Dates of Recent Site Visits |
2-3 |
| Table 2-2: Unit Abbreviations |
2-3 |
| Table 2-3: Name Abbreviations |
2-4 |
| Table 3-1: Reliance on Other Experts |
3-1 |
| Table 4-1: Patented Mining Claims - Description & Location |
4-2 |
| Table 4-2: Unpatented Mining Claims - Description & Location |
4-6 |
| Table 4-3: Fee Owned Properties - Description & Location |
4-12 |
| Table 4-4: Fee Owned & Leased Properties - Description & Location |
4-14 |
| Table 6-1: Production History of the Helvetia-Rosemont District 1875-1969 after (Briggs, 2020) |
6-2 |
| Table 6-2: East Deposit Historical Mineral Resource Estimates (Augusta Resource Corp., 2012) |
6-3 |
| Table 6-3: Historical Mineral Reserve & Mineral Resource Estimate for the Stand-alone East Project |
6-4 |
| Table 6-4: Historical Mineral Reserve & Mineral Resource Estimate from the 2022 PEA |
6-4 |
| Table 10-1: Drillhole Database for the Project |
10-1 |
| Table 11-1: Summary of the Core Logging, Documentation & Security Before 2017 |
11-1 |
| Table 11-2: Summary of the Sample Preparation Before 2017 |
11-2 |
| Table 11-3: Summary of the Assaying Before 2017 |
11-3 |
| Table 11-4: Density Measurements Before 2017 |
11-4 |
| Table 11-5: Summary of Sample Preparation Used During the 2020-2023 Drilling Campaigns |
11-6 |
| Table 11-6: Density Measurements |
11-6 |
| Table 11-7: Summary of Analytical Specifications Used for 2020-2023 Drilling Campaigns |
11-8 |
| Table 11-8: Summary of Detection Limits |
11-9 |
| Table 11-9: Blanks & CRMS Expected Values (2020-2023 Drilling) |
11-11 |
| Table 11-10: Blanks QAQC Results Summary (2022 Drilling) |
11-12 |
| Table 11-11: Blanks QAQC Results Summary (Gold Pulp Composites) |
11-13 |
| Table 11-12: CRM QAQC Results Summary (2021-2022 Drilling) |
11-14 |
| Table 11-13: CRM QAQC Results Summary (Gold Pulp Composites) |
11-15 |
| Table 11-14: CRM QAQC Results Summary for Sulfur from Bureau Veritas (pre-2021 drilling) |
11-16 |
| Table 11-15: Coarse Duplicates QAQC Results Summary (2022-2023 drilling) |
11-16 |
| Table 11-16: External Check Assay Results Summary (2020-2021 drilling) |
11-17 |
| Table 11-17: External Check Assay for Sulfur at Bureau Veritas, ALS & SGS (2020-2021 drilling) |
11-18 |
| Table 12-1: Summary of Verification Prior to 2020-2021 Campaign |
12-1 |
| Table 13-1: QEMSCAN & TIMA modal abundance of XPS East Deposit Composite Samples |
13-3 |
| Table 13-2: TIMA modal abundance of Copper World Composite Samples |
13-4 |
| Table 13-3: Copper deportment in Copper World Composite Samples |
13-4 |
| Table 13-4: Summary of Comminution Data Across All Deposits |
13-6 |
| Table 13-5: 75th Percentile Value of Comminution Data Across Each Deposit |
13-6 |
| Table 13-6: Summary of Rougher & Cleaner Flotation Kinetic Parameters |
13-8 |
| Table 13-7: Summary of Locked Cycle Test Results |
13-9 |
| Table 13-8: Albion, LT-POX & HT-POX Test Conditions |
13-13 |
| Table 13-9: Copper Extraction in Albion, LT-POX & HT-POX |
13-13 |
| Table 13-10: Sulfur Flotation Results |
13-15 |
| Table 14-1: Drill Hole Summary for the Copper World Property |
14-1 |
| Table 14-2: Drill Hole Summary per Deposit |
14-1 |
| Table 14-3: Mineralized Envelopes Code Equivalency |
14-2 |
| Table 14-4: Regression Models, Formulas, & Statistics |
14-5 |
| Table 14-5: Summary of Core Box Weight Measurements for the Copper World Deposits |
14-6 |
| Table 14-6: Capping Thresholds |
14-7 |
| Table 14-7: East Deposit Variogram Parameters |
14-8 |
| Table 14-8: Copper World Deposits Variogram Parameters |
14-8 |
| Table 14-9: Search Ellipse Parameters |
14-9 |
|
Table 14-10: Global Statistics of the East Deposit
|
14-13 |
| Table 14-11: Global Statistics of the Copper World Deposits |
14-14 |
| Table 14-12: Summary of Smoothing Correction for the East Deposit |
14-15 |
| Table 14-13: Summary of Smoothing Correction for the Copper World Deposits |
14-16 |
| Table 14-14: Resource Classification Proportion Pre & Post Processing |
14-17 |
| Table 14-15: Mineral Resource Statement (Inclusive of Mineral Reserves) |
14-18 |
| Table 14-16: Mineral Resource Statement (Exclusive of Mineral Reserves) |
14-18 |
| Table 14-17: Comparison of 2022 vs 2023 Mineral Resource Estimates |
14-19 |
| Table 15-1: Other Recoveries for Mill Process |
15-2 |
| Table 15-2: Lerchs-Grossman Economic Parameters |
15-2 |
| Table 15-3: Proven & Probable Mineral Reserves Total - Final Pits |
15-6 |
| Table 16-1: Overall Pit Design Parameters |
16-2 |
| Table 16-2: East Pit Design Parameters by Sector |
16-3 |
| Table 16-3: Mining Production by Mine Phase |
16-7 |
| Table 16-4: Mine Production Schedule Criteria |
16-7 |
| Table 16-5: Mine Plan (Imperial Units) |
16-10 |
| Table 16-6: Mine Plan (Metric Units) |
16-10 |
| Table 16-7: WRF Design Criteria |
16-15 |
| Table 16-8: Mine Equipment Fleet by Year |
16-18 |
| Table 16-9: Major Equipment KPI & Productivity |
16-18 |
| Table 16-10: Pit Slope Recommendations for Satellite Pits |
16-22 |
| Table 16-11: East Pit Dewatering Wells |
16-23 |
| Table 17-1: Process Design Criteria - Overview |
17-4 |
| Table 17-2: Sulfide Concentrator Comminution Design Criteria |
17-4 |
| Table 17-3: Sulfide Concentrator Flotation Design Criteria |
17-5 |
| Table 17-4: Sulfide Concentrator Concentrate Dewatering Design Criteria |
17-6 |
| Table 17-5: Concentrate Leach Design Criteria |
17-6 |
| Table 17-6: Concentrate Leach Precious Metal Plant Design Criteria |
17-8 |
| Table 18-1: Summary of Power Supply by Area |
18-2 |
| Table 19-1: Price Deck Summary |
19-4 |
| Table 19-2: Other Marketing Assumptions |
19-5 |
| Table 20-1: Project Permitting Status |
20-3 |
| Table 21-1: Capital Costs Summary |
21-1 |
| Table 21-2: Growth Capital EPCM Costs Details |
21-2 |
| Table 21-3: Basis For Plant Costs Estimate |
21-2 |
| Table 21-4: Growth Capital Owner's Costs Details |
21-4 |
| Table 21-5: Project Sustaining Capital Costs Summary |
21-5 |
| Table 21-6: Unit Operating Cost Summary |
21-5 |
| Table 21-7: Cash Cost Summary |
21-6 |
| Table 21-8: Operating Cost Details - Mining |
21-6 |
| Table 21-9: Operating Cost Details - Processing |
21-6 |
| Table 22-1: Key Metrics of the Financial Analysis |
22-1 |
| Table 22-2: Key Metrics of the Financial Analysis - Sensitivity Analysis |
22-4 |
| Table 22-3: Income Tax Depreciation Rates |
22-6 |
| Table 22-4: Other Tax Assumptions |
22-6 |
| Table 22-5: Cash Flow Model - Physicals |
22-9 |
| Table 22-6: Cash Flow Model - Units Costs |
22-10 |
| Table 22-7: Cash Flow Model - Cash Flows |
22-10 |
1 SUMMARY
The information that follows provides an executive summary of important information contained in this Technical Report.
1.1 INTRODUCTION
Hudbay Minerals Inc. ("Hudbay" or the "company") is a copper-focused mining company with three long-life operations and a world-class pipeline of copper growth projects in tier-one mining-friendly jurisdictions of Canada, Peru, and the United States. Hudbay's mission is to create sustainable and strong returns by leveraging its core strengths in community relations, focused exploration, mine development, and efficient operations.
This Technical Report presents the results of a pre-feasibility study (the "2023 Phase I Pre-Feasibility Study" or "PFS"), and the updated mineral reserve and mineral resource estimates of Hudbay's 100%-owned Copper World project (the "Project") in Pima County, Arizona, USA. The Project is currently held by Copper World, Inc., an indirect wholly owned subsidiary of Hudbay.
Hudbay previously completed a feasibility study contemplating a standalone development plan for the East deposit and published the results in a technical report titled "NI 43-101, Feasibility Study, Updated Mineral Resource, Mineral Reserve and Financial Estimates, Rosemont Project, Pima County, Arizona, USA" that was filed by Hudbay in March 2017 (the "2017 Feasibility Study" or the "2017 Technical Report").
While litigation over the federal permits for the standalone Rosemont Project was ongoing, Hudbay commenced a comprehensive review of the exploration potential of the entire land package it acquired from Augusta Resource Corporation, along with the East deposit, in 2014. Drilling conducted in 2020 and 2021 resulted in the discovery and delineation of multiple satellite deposits, in an almost continuous manner over a 4.5-mile (7 km) strike length adjacent to the East deposit.
Exploration successes on patented mining claims and ongoing litigation uncertainty regarding the initial Rosemont Project contemplated by the 2017 Feasibility Study caused Hudbay to evaluate alternative design options to unlock value within this prospective district.
A Preliminary Economic Assessment (PEA) titled "Preliminary Economic Assessment, Copper World Complex, Pima County, Arizona, USA", effective May 2022 and filed by Hudbay in July 2022 (the "2022 PEA" or the "2022 Technical Report"), contemplated a two-phased mine plan with the first phase reflecting a standalone operation expected to require only state and local permits and reflected a 16-year mine life. A second phase extended the mine life to 44 years through an expansion onto federal land to mine the entire deposits. Phase II would be subject to the federal permitting process.
Since publishing the PEA, Hudbay has conducted an extensive infill drill program over the areas hosting the mineral resource estimates that were included in Phase I of the 2022 PEA, as well as new metallurgical testing. This led to a redesign and simplification of the process flowsheet, as well as a review and update of the mine plan and tailings deposition strategy.
This PFS and Technical Report contemplates a single phase 20-year mine plan based on mineral reserves and excludes a second phase expansion onto federal lands. Accordingly, the mineral resources that were part of the second phase of the PEA have not been included in the mine plan presented in this Technical Report and could be the subject of an updated preliminary economic assessment.
This Technical Report describes the latest resource model and mine plan, and the current state of metallurgical testing, operating cost, and capital cost estimates which constitute the basis for the mineral reserve estimates supporting the PFS. An update of the mineral resource estimates is also included. The mineral resources exclusive of the mineral reserve estimates retain potential for economic extraction and supersede and replace the mineral resource estimates reported in the 2022 Technical Report.
The Project set forth in this Technical Report contemplates a 20-year mine life and consists of four planned open pit mines with simpler processing infrastructure than what was contemplated in the 2022 PEA. The project design and layout are materially different from the 2017 Feasibility Study. The mine plan for the Project is now based on and optimized solely for the flotation of both copper sulfides and oxides. For the first 4 years of the Project, the final product is a copper concentrate sold to market. After construction of the process plant infrastructure is completed in Year 4, leaching of the concentrate produced by the mill is added in Year 5 of the Project, followed by solvent extraction and electrowinning to produce, and sell copper cathodes, molybdenum concentrate, and silver and gold in doré, with sulfuric acid as a byproduct. The Project also includes waste rock and tailings storage facilities, and support infrastructure and utilities.
This PFS demonstrates the economic viability of the proven and probable mineral reserve estimates. The inferred mineral resource estimates that were included in the PFS mine plan are considered too speculative geologically to have the economic consideration applied to them that would enable them to be categorized as mineral reserves, and as a result are treated as waste in this PFS. Likewise, there is a significant measured and indicated mineral resource that was formerly part of the Phase II mine plan in the 2022 PEA that has not yet been the subject of a pre-feasibility study and has been excluded from the mine plan presented in this Technical Report. In addition, some of the lower grade measured and indicated mineral resource estimates mined as part of the PFS mine plan cannot be processed at the end of the mine life due to lack of deposition space for the tailings they would generate and, as such have not been converted to mineral reserve estimates.
All dollar amounts in this Technical Report are in US dollars, unless otherwise noted.
1.2 PROPERTY DESCRIPTION & LOCATION
The Project is located within the historic Helvetia-Rosemont Mining District that dates to the 1800's. The deposit lies on the northern end and western foothills of the Santa Rita Mountain range approximately 28 miles (45 km) southeast of Tucson, in Pima County, Arizona (Figure 1-1).
The property consists of a combination of fee land, leased land, patented mining claims and mill sites, unpatented mining claims and mill sites, rights-of-way from the Arizona State Land Department, and grazing leases and permits. Taken together, the land position is sufficient to allow the proposed open pit mining operation, processing and concentrating facilities, storage of tailings, disposal of waste rock and a utility corridor to bring water and power to the Project.
1.3 GEOLOGICAL SETTING & MINERALIZATION
The deposits are within the Laramide belt, a major porphyry province that includes several other world class deposits. Mesozoic subduction and associated magmatism and tectonism in the southwestern United States and northern Mexico generated extensive and relevant porphyry copper mineralization. Compressional tectonism during the Mesozoic and early Cenozoic Laramide Orogeny caused folding and thrusting, accompanied by extensive calc-alkaline magmatism. Tertiary faulting juxtaposed mineralized and unmineralized rocks in large-scale block faulting that produced the present basin and range geomorphology that is typical throughout southern Arizona.
The Project is in the northern block of the Santa Rita Mountains dominated by Precambrian granite with slices of Paleozoic and Mesozoic sediments, and small stocks and dikes of quartz monzonite or quartz latite porphyry that are related to porphyry copper and skarn mineralization. Tertiary faulting has significantly segmented the original stratigraphy, juxtaposing mineralized and unmineralized rocks. Mineralization occurs as both copper oxides and sulfides in skarns, and intrusive porphyry.
FIGURE 1-1: PROJECT PROPERTY LOCATION

1.4 DEPOSIT TYPES
Genetically, skarns form part of the suite of deposit styles associated with porphyry copper centers. The skarns were formed as the result of thermal and metasomatic alteration of Paleozoic carbonate and, to a lesser extent, Mesozoic clastic rocks. Near surface weathering has resulted in the oxidation of the sulfides in the overlying Mesozoic units at the East deposit, and near surface Paleozoic units at Copper World.
Mineralization is mostly in the form of primary (hypogene) copper, molybdenum, and silver bearing sulfides, found in stockwork veinlets, and disseminated in the altered host rock at depth. Near surface, along structural zones, and in quartzite units, oxidized copper mineralization is present. The oxidized mineralization occurs as mixed copper oxide and copper carbonate minerals. Locally, enrichment of supergene chalcocite and associated secondary mineralization are found in and beneath the oxidized mineralization.
1.5 EXPLORATION
Prospecting began in the Helvetia-Rosemont Mining District in the mid-1800s, and by 1875, copper production was first recorded, which continued sporadically until 1951. By the late 1950s, exploration drilling had discovered the East deposit. A succession of major mining companies subsequently conducted exploratory drilling focused on the East deposit and the nearby Broadtop Butte and Peach-Elgin mineralized areas.
Two infill drilling campaigns were completed by Hudbay around the East deposit in 2014 and 2015. In addition to chemical assaying, magnetic susceptibility and conductivity measurements were also taken. Hudbay analyzed all samples of the 2014 and 2015 drilling programs with ICP multi-element geochemistry. This new geochemical data set was used to model stratigraphy and geochemical attributes and proved to be a useful tool for geological modeling and vectoring.
In October 2020, Hudbay resumed exploration drilling on targets at its Copper World private land claims located north and west of the East deposit. The drill program has continued until the end of 2022 focusing mostly on the Peach, Elgin, West and Broadtop Butte areas, as well as establishing the continuity to the East deposit through the Bolsa area.
The cut-off date for any drilling assay results used in this PFS is March 1, 2023.
1.6 DRILLING, SAMPLE PREPARATION, ANALYTICAL PROCEDURES, & DATA VALIDATION
All available data from the historical drilling was consolidated for inclusion in the geological model (Table 1-1). Out of a total of 1754 drill holes, 1277 holes have intersected copper mineralization and were used to define the mineralized envelopes for the Copper World and East deposits.
Sample preparation, security, and analytical procedures used by Augusta and Hudbay since 2005 meet current industry accepted standards. QA/QC procedures including the use of certified reference material, blanks and interlaboratory checks on pulp duplicates have resulted in acceptable precision, accuracy, and contamination level. Statistical comparisons and database entry checks of older historical drilling data did not identify any significant biases or database quality issues. Specific gravity was measured in laboratories using water displacement on core and validated with box weight measurements to derive in-situ density estimates for each mineralization domain.
Independent data verification by Hudbay was conducted under the supervision of Olivier Tavchandjian, Hudbay's Senior Vice President, Exploration and Technical Services, and a Qualified Person pursuant to NI 43-101, and it is the opinion of the author that the quality of the data is suitable for use in resource calculations and that sampling to date is representative of the deposit.
TABLE 1-1: DRILL HOLE SUMMARY

1.7 MINERAL PROCESSING & METALLURGICAL TESTING
Following the acquisition of the Project in 2014, Hudbay undertook a series of metallurgical programs focused on the East deposit. The objective of the testing campaigns was to improve the correlation between mineralogy and the metallurgical characteristics, considering mineral processing through flotation only. Metallurgical and mineralogical tests were primarily performed by XPS Consulting & Testwork Services (XPS); with SGS undertaking the comminution testing. Base Met Laboratory ("BML") was engaged to perform confirmation testing and additional process optimization. Bench scale testing was performed for additional metallurgical and project engineering data.
Following the discovery of the Copper World deposits in 2021, Hudbay engaged Kappes, Cassiday & Associates (KCA), Laboratorio Metalúrgico Chapi (Chapi) and SGS to perform mineralogical and metallurgical testing on the Peach, Elgin and Broadtop Butte deposits as well as on the East deposit transitional zone mineralization, where copper occurs as secondary copper sulfides and copper oxides. In 2022, Hudbay contracted AMinpro, TailPro Consulting (TailPro), McClelland Laboratories, Inc. (McClelland), Blue Coast Research (BCR), SGS, and Glencore Technology. Each performed various aspects of a more comprehensive test program designed to validate findings and assumptions from the 2022 PEA study, establish project engineering data, and better understand the mineralogy of the various mineralization zones at Copper World and how they relate to metallurgical responses.
The large number of composite and variability samples that have been tested has allowed for a comprehensive understanding of the variety of mineralization conditions within the Copper World Project. Where possible, recovery estimates and design criteria are correlated to mineralogy and are typically based on variability testing.
JK drop-weight (DWT), SAG Power Index (SPI®) and Bond ball mill work index (BWi) tests were conducted by SGS in 2015, while 2021 SAG Grindability Index (SGI) and BWi were done at Chapi. Both DWT and BWi results ranged from very soft to hard, while SGI test results ranged from soft to very hard. The 75th percentile parameters were chosen as the basis for design of the comminution circuit.
Since the XPS and BML test work was focused only on the flotation recovery of sulfide copper and did not employ CPS (controlled potential sulfidization), the KCA test work which used CPS to improve the flotation of secondary Cu sulfide and Cu Oxide minerals is used to forecast recovery. The KCA results have been independently validated by AMinpro and BCR based on composite samples which were more representative of mill feed from each one of the Copper World deposits.
This work evidenced a strong relationship between copper recovery and the content of oxide copper (as determined by acid soluble copper assay) in the feed (Figure 1-2). Oxide copper species were poorly recovered but did not interfere with the flotation of sulfides, which averaged 90% recovery to the cleaner concentrate (97% rougher recovery and 93% cleaner recovery).
FIGURE 1-2: COMPARISON OF VARIABILITY TESTING WITH & WITHOUT CPS
COPPER RECOVERY VS. ACID SOLUBLE COPPER/TOTAL COPPER

Additional findings from the KCA test work were that saleable concentrate grades (≥ 28%) were achievable, grind size impacted recovery with a 0.6% decrease in recovery per 10 μm increase in primary grind, within the P80 range of 104 - 265 μm, elevated swelling clay content did not have a large effect on rougher performance but did cause grade to decline in the cleaners as recirculating clays built up and elevated magnesium clay was more toxic to flotation. The recovery formula presented on Figure 1-2 accounts for all the Cu and other mineral species that could negatively impact the flotation process as per the selected flowsheet of the PFS.
Concentrates produced from locked cycle tests during the test programs were analyzed by ICP to indicate the presence of deleterious elements. Fluorine was the primary element of concern, with concentrate levels inversely proportional to copper concentrate grade and more elevated in concentrates formed from mineralization which would appear beyond the life of the mine presented for this Pre-Feasibility Study. Aside from fluorine, concentrates were relatively free of any other minor elements that would impede marketing of the concentrate. Fluorine is primarily hosted within fluorite, muscovite, apatite, and biotite. These minerals are not hydrophobic and typically report to concentrates through entrainment. It is expected that employing concentrate wash water would improve rejection of these minerals and mitigate any concerns with the ability to market concentrate. For the PFS, a fluorine penalty of $2.55/tonne of Cu concentrate sold was added in the financial model.
Preliminary tests from the XPS and BML East Deposit test campaigns have indicated successful separation of copper-molybdenum. Recovery of molybdenum into the rougher concentrate exceeded 97%. The molybdenum concentrates contained 2 - 4% copper after three stages of cleaning, however, concentrate grades remained low due to high levels of magnesium clays. Due to the limited amount of molybdenum flotation work to date, the recovery of molybdenum in copper molybdenum separation is based on industry benchmarking and assumes 90% recovery to a 50% molybdenum concentrate. The next stage of testing will validate this assumption.

Silver and gold recovery is forecast as a function of the ratio of acid soluble copper and total copper as per variability flotation tests. Recovery from the bulk rougher concentrate to the final copper concentrate is assumed to be 90%. The recovery function is:


A test work program was commissioned to determine the amenability of concentrate samples to the Albion Process™ (Albion), as well as low and high temperature pressure oxidation (LT-POX and HT-POX). The test work was conducted by SGS with the Albion work overseen by Glencore Technology. The Copper World deposit concentrates generated by AMinpro and BCR (Peach Pit, Elgin Pit, Broadtop Transitional and East Transitional) were tested. The tests indicated comparably high Cu extraction across all samples in Albion and HT-POX of 97% to 99% for all samples, whereas LT-POX resulted in relatively poor extraction. Albion was selected as the preferred concentrate leach technology as it is simpler to operate and more flexible to scale the plant with significantly lower acid neutralization requirements.
A sulfur flotation stage is used to remove elemental sulfur generated during Albion leaching from the solid leach discharge. The resultant sulfur product can be further upgraded via the sulfur melting purification process, and ultimately sent to a roaster to create sulfuric acid or be sold as molten sulfur. The results from testing completed so far suggest high sulfur, silver, and gold recoveries from the flotation concentrate.
Precious metals recovery following an oxidative leach, such as the Albion Process, is typically greater than 90%. The recovery of gold and silver in the precious metals plant is assumed to be 90%.
Although considered during the 2022 PEA, the ROM heap leaching processing route was abandoned for the PFS. Additional testing indicated lower copper recoveries than estimated during the 2022 PEA, with recovery ultimately being driven by the concentration of acid consuming gangue. Additional testing is ongoing to confirm a processing route suitable for treating this waste material which is still deemed potentially economic to mine and process through heap leaching although for the purpose of this Pre-Feasibility Study it was deemed preferable from an economic standpoint to simply sell the sulfuric acid produced from the leaching of the copper concentrate on the local market than to use it to leach oxides with high calcium content. In addition, approximately 45% of the mineralization which was designated as ROM leach feed in the 2022 PEA has been redirected to the mill in the PFS mine plan, with the remaining 55% of the mineralization treated as having only potential for economic processing in the future.
1.8 MINERAL RESOURCE ESTIMATES
The mineral resource models constructed for the Project have been prepared under the supervision of Mr. Olivier Tavchandjian P. Geo. and Qualified Person. Mr. Tavchandjian is Hudbay's Senior Vice President, Exploration and Technical Services. The mineral resource estimates have been updated based on the revised economic and technical parameters of the Project presented in this Technical Report. The estimates comply with CIM Definition Standards for Mineral Resources and Mineral Reserves (May 10, 2014). The resource modeling, classification and reporting methodology applied by Hudbay for the Project is similar and fully consistent with those used at its operating mines.
Hudbay used three-dimensional models of lithological units and mineralization envelopes constructed in Leapfrog Geo™ software using an 'implicit modeling' approach. A wireframe model of the 0.10% Cu grade shell was also constructed in Leapfrog Geo™. The selection of this copper grade threshold for modeling was based on visual inspection of the spatial and statistical grade distribution. The grade shell includes mineralization grading less than 0.10% Cu where it was deemed necessary to maintain a smooth and continuous three-dimensional envelope. The different lithological units were grouped into four structural domains which were further divided into mineralized envelopes based on the dominance of oxide or sulfide copper mineralization within the 0.10% Cu grade shell.
Drill core assay intervals for copper (Cu), soluble copper (CuSS), molybdenum (Mo), silver (Ag), and gold (Au) were composited down hole into a fixed length of 25 ft (7.5 m). Composite intervals with lengths less than 12.5 ft (4 m) were appended to the previous composite. The composite intervals were back-tagged with a copper grade-shell code based on the wireframe models to be used during grade estimation. Visual checks were conducted to ensure back-tagging worked as expected.
Exploratory Data Analysis (EDA), including industry standard statistical analysis and variography was undertaken within each mineralized envelope to help develop a plan for block grade estimation.
The block model consists of non-rotated regular blocks of 50 x 50 x 50 ft (15 x 15 x 15 m) as a reasonable proxy for the anticipated Selective Mining Unit (SMU) during open pit mining. The proportion of the individual blocks within each envelope was estimated using the wireframes prepared in Leapfrog™. A dry bulk density was assigned based on the volume of the block inside each envelope based on the mean value of in-situ density measured from core box weights and validated with laboratory measurements.
The Cu, CuSS, Mo, Ag, and Au block grade values were interpolated using an Ordinary Kriging (OK) estimator with a three-pass estimation approach with each successive pass having greater search distances and less restrictive sample selection requirements. A firm boundary approach within each mineralized envelope was employed for all metals.
The block model grade estimates were validated by Hudbay through visual inspection comparing composite grades to block grades, statistical checks, and selectivity checks. During its review, Hudbay identified an opportunity to reduce the inherent smoothing of the kriged model. This correction was implemented separately by mineralized envelope based on grade distribution and by areas with consistent drilling density. In each block, the weighted average grade was calculated using the interpolated grade estimate by envelope properly weighted by the volume and density within each envelope.
A Lerchs-Grossman analysis was performed using the block models constructed by Hudbay. Several economic analyses were developed for nested pit shells. The purpose of this assessment was to evaluate free discounted cash flow, revenue, stripping ratio, development, sustaining capital, and as guidance for internal phases, recoveries by processing route and by deposit. The base-case pit shell retained for resource reporting corresponds to a revenue factor of 1.0 with an assumed copper price of $3.75/lb. to ensure potential for economic extraction of the mineral resource estimates.
Table 1-2 shows the mineral resource estimates inclusive of mineral reserve estimates and tabulated within the resource pit shell at a cut-off value of 0.1% Cu for the flotation route and 0.1% CuSS for the leaching route. The mineral resource estimates are further divided into two categories based on the potential processing route using an oxidation ratio defined as CuSS/Cu above 50% for leaching and below 50% for flotation.
TABLE 1-2: MINERAL RESOURCE STATEMENT (INCLUSIVE OF MINERAL RESERVES)

(1) Totals may not add up correctly due to rounding.
(2) Mineral resources are estimated as of 1 July 2023
(3) Tons and grades constrained to a Lerchs-Grossman revenue factor 1 pit shell or inside reserve pit.
(4) Using a 0.1% copper cutoff grade and an oxidation ratio lower than 50% for flotation material
(5) Using a 0.1% soluble copper cutoff grade and an oxidation ratio higher than 50% for leach material
(6) Mineral resources are not mineral reserves as they do not have demonstrated economic viability.
(7) Mineral resource estimates are inclusive of mineral reserves and have been calculated using assumed long-term metal prices of $3.75 per pound copper, $12 per pound molybdenum, $22 per ounce silver, and $1,650 per ounce gold.
Table 1-3 summarizes the mineral resource estimates exclusive of the measured and indicated mineral resources estimates that have been converted to mineral reserve estimates in section 1.9. These mineral resource estimates include resource estimates in all categories located inside a pit shell with revenue factor of 1.0 and outside of the mineral reserve pit as well as mineral resource estimates located within the mineral reserve pit not processed within the mine life of the PFS and as such excluded from the mineral reserve estimates but still deemed to have potential for economic extraction with additional infill drilling and/or additional metallurgical test work.
TABLE 1-3: MINERAL RESOURCE STATEMENT (EXCLUSIVE OF MINERAL RESERVES)

(1) Totals may not add up correctly due to rounding.
(2) Mineral resources are estimated as of 1 July 2023
(3) Tons and grades constrained to a Lerchs-Grossman revenue factor 1 pit shell or inside reserve pit.
(4) Using a 0.1% copper cutoff grade and an oxidation ratio lower than 50% for flotation material
(5) Using a 0.1% soluble copper cutoff grade and an oxidation ratio higher than 50% for leach material
(6) Mineral resources are not mineral reserves as they do not have demonstrated economic viability.
(7) Mineral resource estimates are exclusive of mineral reserves and have been calculated using assumed long-term metal prices of $3.75 per pound copper, $12 per pound molybdenum, $22 per ounce silver, and $1,650 per ounce gold.
Table 1-4 presents a comparison of the historical mineral resource estimates presented in the 2022 PEA and the 2023 mineral resource estimates (inclusive of mineral reserve estimates). Overall, there are minimal changes between the 2022 and 2023 mineral resource estimates inclusive of the mineral reserve estimates with a 4% relative increase in the copper content in measured and indicated resources confirming potential to further enhance the Project in the future.
TABLE 1-4: COMPARISON OF 2022 VS 2023 MINERAL RESOURCE ESTIMATES

(1) Totals may not add up correctly due to rounding.
(2) 2023 mineral resource estimates are inclusive of mineral reserve estimates.
(3) 2022 mineral resource estimates include both flotation and leach material and were based on metals prices and other assumptions set forth in the 2022 PEA.
In the opinion of the author, the construction of the mineral resource model is consistent with the CIM Estimation of Mineral Resources and Mineral Reserves Best Practice Guidelines. The modeling and grade estimation process used is appropriate for a skarn/porphyry-style copper-molybdenum-silver-gold deposit and the resource model is suitable to support mine planning for a large-scale open pit mine. The assumptions used in 2023 to assess reasonable prospects of eventual economic extraction, including metal prices, mining, processing and G&A cost and metallurgical recoveries, are also all considered reasonable by the author.
Other than the risks identified in this Technical Report, the author is not aware of any other environmental, permitting, legal, title, taxation, socioeconomic, marketing, political, or other relevant factors that could materially affect the mineral resource estimate.
1.9 MINERAL RESERVE ESTIMATE
The mineral reserves estimate for the Project is based on a LOM which uses the block model described in section 1.8, with economic value calculation per block (NSR in $/ton) that incorporates diluted block grades, expected smelting/refining contracts (i.e., payables and deductions), metallurgical recoveries, and projected market prices for each metal (Cu, Mo, Ag and Au) to yield a net revenue value expressed in terms of US Dollars per ton. Metal recoveries used in the NSR calculation were derived from the metallurgical test work described in section 1.7.
The mineral reserves estimation is based only on measured and indicated mineral resource estimates. Therefore, the inferred mineral resource estimates within the mineral reserve pit are reported as waste, as they currently do not meet the economic and mining requirements to be categorized as mineral reserves. It cannot be assumed that all or any part of inferred mineral resources will ever be upgraded to a higher category. A significant portion of the measured and indicated mineral resource estimates has not been converted to mineral reserve estimates as their mining and waste and tailings deposition would require federal permits that are not part of the scope of this PFS.
Proven and probable mineral reserve estimates for the Copper World deposits are summarized in Table 1-5. Proven and probable mineral reserves within the designed final pit total 385.1 million tonnes of material, grading 0.54% Cu, 0.01% Mo, 6.0 g/tonne Ag, and 0.03 g/tonne Au. The total material excavated from the pit is 1,203 million tonnes. 41 million tonnes grading 0.16% Cu are left in a low-grade stockpile at the end of the 20 years mine life due to lack of disposal space for tailings. This material, classified as measured and indicated resources, remains an upside opportunity should Hudbay secure additional surface rights for tailings disposal.
The mineral reserves estimate presented in this Technical Report is dependent on market prices for the contained metals, metallurgical recoveries and ore processing, mining, and general/administration cost estimates. Mineral reserve estimates in subsequent evaluations of the Copper World deposits may vary according to changes in these factors. As of the effective date of this Technical Report, there are no other known mining, metallurgical, infrastructure or other relevant factors that may materially affect the mineral reserve estimates.
TABLE 1-5: PROVEN & PROBABLE MINERAL RESERVES TOTAL - FINAL PITS

(1) Totals may not add up correctly due to rounding.
(2) Mineral Reserve estimates are as at 1 July 2023.
(3) Mineral Reserve estimates are limited to the portion of the measured and indicated resource estimates scheduled for milling and included in the financial model of this PFS.
(4) Mineral reserves have been calculated using assumed long-term metal prices of $3.75 per pound copper, $12 per pound molybdenum, $22 per ounce silver, and $1,650 per ounce gold.
1.10 MINING METHODS
The mine will be a traditional open pit shovel and truck operation with bench heights of 50 and 100 ft (15 and 30 m), and 255-ton capacity haul trucks for material and waste movement.
The mining sequence considers the exploitation pits requiring only state and local permits at the anticipated time of operation and all waste, tailings, and leach pads will also be disposed within the limits of Hudbay's private land property. Such permitting requirements represent Hudbay's current expectations.
The Peach-Elgin, Broadtop Butte, and West pits will measure 5,600 ft (1.7 km) on average in diameters with an average depth of 520 ft (160 m) while the final East pit size will measure approximately 8,200 ft (2.5 km) in diameter and have a depth of approximately 2,250 ft (685 m). The overall mine footprint is shown below in Figure 1-3. Portions of the Peach-Elgin, West, and Broadtop Butte pits are later backfilled with waste once mining is completed.
FIGURE 1-3: PLAN OF OPEN PITS

Pit design and production were conducted using a NSR optimization model to select the optimum processing method that maximizes NPV for each mining block extracted from the open pits taking into consideration land restriction both for mining and for the connected actions of waste, leach pads and tailings depositions as well as the maximum capacity of the various components of the processing facilities.
An important constraint on the mine production schedule is the limited space for disposing of waste rock, tailings, and economic material on leach pads. In addition, some of the waste rock can only be disposed of after mining has been completed at the Peach-Elgin, West, and Broadtop Butte pits. These important constraints result in a sub-optimum mining sequence from a strict economic standpoint but allow the mine to operate in a sustainable manner for 20 years until federal permits are in place. Securing these permits earlier would unlock significant benefits to the Project by removing these important constraints on the mining schedule allowing more tons and/or better grade to enter the mine plan earlier than currently planned (Table 1-6 and Table 1-7).
Figure 1-4 illustrates the production profile by source material for the life of the mine, highlighting that in the first 5 years (including the year of pre-stripping) 90% of the mineral resources are extracted from the Peach-Elgin, West, and Broadtop Butte pits. The East pit becomes a major contributor only in Year 5 of the milling and leaching operation.
FIGURE 1-4: MINE PRODUCTION FROM COPPER WORLD DEPOSITS OVER FULL LIFE OF MINE

TABLE 1-6: MINE PLAN (IMPERIAL UNITS)

TABLE 1-7: MINE PLAN (METRIC UNITS)

Mine equipment requirements were developed based on the annual tonnage movement projected by the mine production schedule, bench heights of 50 ft (15 m), two twelve-hour shifts per day, 365 days per year operation, with manufacturer machine specifications and material characteristics specific to the deposit. A summary of fleet requirements by production year for major mine equipment is shown in Table 1-8. Equipment KPI's were developed based on benchmarking of Constancia (Hudbay's mine) experience and other similar operations.
TABLE 1-8: MINE EQUIPMENT FLEET BY YEAR

1.11 PROJECT INFRASTRUCTURE
The Project infrastructure consists of access and plant roads, a processing complex, electric power supply and distribution, water supply and distribution, voice and data communication, tailings storage facility (TSF), and other ancillary facilities.
Access to the Project area is through South Santa Rita Road, at the point between South Nogales Highway and South Country Club Road on East Sahuarita Road, in the Town of Sahuarita, Pima County, Arizona. The Project's primary access road will intersect Santa Rita Road and give entrance to the in-plant roads, haul roads and other roads used to access the facilities.
Tucson Electric Power (TEP) will provide service via a 138 kV transmission line connected at the proposed Toro Switchyard located in Hudbay's private land parcel (Sanrita South).
The water supply source identified for the Project is groundwater from the Santa Cruz Basin, which lies west of the Project and the Santa Rita Mountains. Hudbay has a permit to withdraw groundwater for mineral extraction and metallurgical processing in the amount of 6,000 acre-feet per year for 20 years. This amount may change depending on the final design.
Data networking and telecommunication systems will be integrated into a common infrastructure. Mobile radio will also be used by the mine and plant operation personnel for daily control and communications while outside the offices.
The Project includes the construction of three Tailings Storage Facilities: TSF-1, TSF-2, and TSF-N. A conventional tailings deposition is planned with a total capacity of 440 million tons, sufficient to accommodate a nominal rate of 60,000 tons per day through the mill for a period of 20 years.
The Waste Rock Facility (WRF), will receive waste rock from the pits, starting from the west side area. The WRF will be large enough to contain the estimated 856 million tons of waste rock generated from within the proposed limits of the pits.
The water management infrastructure will divert clean runoff from the Project site to minimize the amount of water that must be managed or treated, via a system of designed diversion channels and collection galleries. The waste rock material has been identified as non-acid generating (NAG) material and therefore does not pose a threat for the formation of acid mine drainage. Stormwater runoff will be collected in a temporary or permanent WRF sediment basin.
The mine infrastructure associated with the Project will include a truck shop, explosive magazine storage, fuel storage and dispensing for heavy equipment and light vehicles, and lube bay.
1.12 MARKETING
The Project will produce saleable metals in the form of copper concentrate, copper cathodes, molybdenum concentrates and silver/gold doré.
100% of the copper produced at Copper World during the first 4 years will be in the form of concentrate and sold externally. Global copper concentrate fundamentals are expected to be strong in the medium/longer term.
Smelters globally will seek to maximize metal production to attempt to satisfy unprecedented demand driven by the green energy megatrend. However, smelters' ability to do so will be constrained by a shortage of mine production.
Global markets are expected to compete aggressively for concentrate supply, providing a keen market for offshore sales of Copper World concentrate prior to full implementation of the Concentrate Leach facility.
After the initial four years of production, the majority of the copper produced at Copper World will be in the form of metal. As noted above, mine production will constrain global metal production, contributing to a structural metal deficit in the medium/long term. This scenario is now a well-established industry consensus. In such a market, buyers are expected to compete aggressively for available metal units.
The US market specifically will continue to be a significant net metal importer, requiring units from Canada and South America to attempt to satisfy strong demand. The trend toward reshoring of US manufacturing capacity is expected to reinforce the US's position as a key importing market.
In such a market, Copper World's cathode production, once the concentrator leach facility is implemented, will generate strong interest. The product will be sold domestically, with significant optionality regarding the ultimate customer base.
While copper will be the main product sold, Copper World will also produce molybdenum concentrate as a byproduct. Medium/long term fundamentals for molybdenum are forecast to be constructive. China is expected to emerge as a net concentrate importer, supporting global markets. Regionally, the US will continue to import molybdenum concentrate, as it does now from locations such as South America. Consequently, Copper World production is expected to be absorbed regionally, in part helping to satisfy growing molybdenum oxide demand related to the reshoring of the US manufacturing base.
The silver/gold doré grade is expected to be greater than 85% silver on average. The doré will be shipped to and refined by a third-party refinery. We have estimated provisional payment for 95% of the metal content value upon arrival at the refiner's premises (or other predetermined destination), with financing rates of 3% or less.
Precious metals production from the Project is subject to a stream agreement with Wheaton Precious Metals International Ltd. ("Wheaton"). Under the agreement, Hudbay is entitled to receive a deposit payment of $230 million against delivery of 92.5% of the gold and silver that is produced from the Project and sold to third party purchasers. Given certain ambiguities in the contract arising from the change in the development plan for the Project since the 2017 Feasibility Study and the subsequent changes since the 2022 PEA, Hudbay and Wheaton have commenced discussions regarding a possible restructuring of the stream agreement based upon the new mine plan and processing plant design. The PFS presented in this Technical Report assumes an upfront deposit of $230 million in the first year of construction in exchange for the delivery of 100% of gold and silver produced, at fixed prices of $450/oz and $3.90/oz, respectively.
In addition to producing base and precious metals, Copper World will also sell sulfuric acid. This acid will be produced from a combination of internally generated sulfur units from the leach plant, and third-party sulfur purchases.
The global sulfur market will be fundamentally supported in the medium/longer term. Strong demand is expected from the fertilizer industry, as well as from lithium producers expected to install sulfur burners. However, supply will be constrained, as the trend toward electrification of transportation reduces the requirement for gasoline, which will reduce byproduct sulfur production. From a regional perspective, the Arizona region is expected to be a net importer, sourcing units from California and Texas, among other locations. The logistics associated with this dynamic will result in regional prices exceeding international indexes such as Tampa.
The global sulfuric acid market is expected to be strong in the medium/longer term due to strong fertilizer and metal related demand. Supply will be constrained however, due to less burnt sulfuric acid production caused by the trend toward reduced byproduct sulfur supply noted above. The regional Arizona market is also expected to have strong fundamentals, requiring imports from Texas, Mexico, and Utah to satisfy demand. New SX/EW projects will require incremental units. Sulfuric acid produced at Copper World is therefore expected to be well positioned, providing a new source of truck delivered supply. Copper World will help to address the regional imbalance, displacing more expensive offshore import options.
Table 1-12 provides a summary of the commodity price assumptions used in the economic evaluation of the Project.
TABLE 1-9: COMMODITY PRICE ASSUMPTIONS
| Metric |
Unit |
Total |
| Metals |
| Copper |
$/lb. |
3.75 |
| Copper Cathode Net Premium* |
$/lb. |
0.02 |
| Molybdenum |
$/lb. |
12.00 |
| Gold - Offtaker |
$/oz |
1,650.00 |
| Silver - Offtaker |
$/oz |
22.00 |
| Gold - Stream |
$/oz |
450.00 |
| Silver - Stream |
$/oz |
3.90 |
| Stream Contracted Escalator |
% per year** |
1.00 |
| Other |
| Molten Sulfur - Purchases |
$/tonne |
215.00 |
| Acid - Sales |
$/tonne |
145.00 |
| Electricity |
$/kWh |
0.071 |
| NSR Royalty |
% |
3.00 |
| *Metal premium less freight costs |
| **Annual escalator begins in Year 3 |
1.13 ENVIRONMENTAL STUDIES, PERMITTING, & SOCIAL OR COMMUNITY
The relevant environmental studies, permitting requirements, social and community plans, monitoring of the Project facilities, social and environmental benefits, and reclamation requirements are summarized in this section and discussed in more detail in Section 20.
1.13.1 ENVIRONMENTAL STUDIES
As part of both current and past project activities, numerous surveys and studies related to the biological and cultural aspects of the site have been completed. Additionally, geochemical characterization of site materials has been performed along with groundwater and surface water studies. These surveys and studies will support permitting of the Project as needed and will be discussed further in Section 20.
1.13.2 PROJECT PERMITTING
The Copper World Project presented in this Technical Report utilizes private and state land in such a way that the Project is expected to only require state, county, and local permits and/or authorizations. No federal authorizations are expected to be required.
State, county, and local permits and/or authorizations will come from the following agencies:
• Arizona Corporation Commission (ACC)
• Arizona Department of Environment Quality (ADEQ)
• Arizona Department of Water Resources (ADWR)
• Arizona State Mine Inspector (ASMI)
• Pima County
• Town of Sahuarita
The status of the major permits required for the Project is listed below. Many of the permits have either been issued or are in the active permitting phase. Some will require an amendment based on this Technical Report.
• Groundwater Withdrawal Permit (issued by ADWR)
• Arizona Mined Land Reclamation Plan (MLRP) Authorization (ASMI issued, however an amendment will be needed to match this Technical Report)
• Class II Air Quality Control Permit (application submitted to ADEQ, substantive review in progress, an amendment will be required to match this Technical Report)
• Aquifer Protection Permit (APP) (application submitted to ADEQ, substantive review in progress, an amendment will be required to match this Technical Report)
• Certificate of Environmental Compatibility (CEC) (for powerline, issued to TEP by the ACC)
• Floodplain Use Permit (FUP) (for waterline within utility corridor, issued by Pima County)
The requirements for obtaining Air Quality Permits and Aquifer Protection permits from ADEQ are well defined and the regulations include maximum time frames for the agency to make a final decision on a permit application or amendment.
1.13.3 SOCIAL & COMMUNITY REQUIREMENTS & PLANS
Regarding community outreach and other social commitments, specific allocations will be determined as the Project progresses and the community is engaged. Additionally, Hudbay is committed to the preservation of historical and cultural resources as well as the protection of endangered and other protected species.
1.13.4 FACILITY DETAILS & MONITORING
The Project will include conventional tailings disposal with three tailings storage facilities. Permits issued for the Project will generally be required to meet specific design and monitoring requirements. For example, the Project will meet the Arizona Department of Environmental Quality (ADEQ) Best Available Demonstrated Control Technology (BADCT) requirements (includes facilities such as the Waste Rock Facility, and Tailings Storage Facilities). Equipment specifications, such as for dust collector efficiency, will be part of permit requirements for an air quality control permit issued by ADEQ. Additionally, monitoring and reporting requirements will be required for most of the permits associated with the Project.
1.13.5 SOCIAL & ENVIRONMENTAL BENEFITS OF THE PROJECT
The development plan proposed for the Copper World Project will yield many benefits. The "Made in America" copper cathodes produced through concentrate leaching at the Project are expected to be sold entirely to domestic U.S. customers, reducing the operation's total energy requirements, greenhouse gas ("GHG") and sulfur (SO2) emissions by eliminating overseas shipping, smelting, and refining activities relating to copper concentrate. The company estimates that the Project will reduce total energy consumption by more than 10%, including a more than 30% decline in energy consumption relating to downstream processing when compared to a design that produces copper concentrates for overseas smelting and refining. The PFS base case is expected to result in an approximate 14% reduction in scope 1, 2 and 3 GHG emissions compared to the flotation-only case (Figure 1-5). Hudbay is targeting further reductions in the Project's GHG emissions as part of the company's specific emissions reduction targets at its existing operations to align with the global 50% by 2030 climate change goal. Constructing the full 100% capacity concentrate leach facility at inception would reduce total GHG emissions by 25%.
The Copper World Project is expected to generate significant benefits for the community and local economy in Arizona. Over the anticipated 20-year life of the operation, the company expects to contribute more than $856 million in U.S. taxes, including approximately $168 million in taxes to the state of Arizona. Hudbay also expects Copper World to create more than 750 construction jobs, 430 permanent operating jobs and up to 3,000 indirect jobs in Arizona, The Project is estimated to generate $247 million in property taxes over the 20 years of operation. These benefits are estimated in un-escalated dollars from the start of construction of the Project and will directly support local taxpayers.
FIGURE 1-5: REDUCTION IN ENERGY CONSUMPTION & EMISSIONS RESULTING FROM THE FLOWSHEET OF THE PROJECT


1.13.6 RECLAMATION & CLOSURE
Hudbay will assume responsibility for reclamation of surface disturbances that are attributed to the Project. Reclamation and closure of private lands are regulated by ADEQ and ASMI. Closure and reclamation bonding is apportioned amongst the agencies as applicable.
1.14 CAPITAL & OPERATING COSTS
Total life of mine capital costs of $2,594M consist of $1,690M growth, $542M sustaining, and $362M deferred stripping costs. Growth capital includes two stages of construction; the first stage is the mine, Concentrator Process Plant and related infrastructure totaling $1,323M to be incurred during the 10 quarters prior to commercial production. The second stage is the expanded industrial complex, comprising the Concentrate Leach facility and including solvent extraction and electrowinning (SX/EW), precious metals, sulfur burner, and acid plant facilities totaling $367M that will be incurred during the fourth year of production. Sustaining capital of $542M is primarily mining related costs of the waste rock facility, tailings facility, major repairs and overhauls, and haul roads, as well as plant and general administrative facilities sustaining costs. Deferred stripping of $362M is composed of capitalized mine operating costs for stripping applicable to the portion of the annual strip ratio in excess of the life of mine strip ratio.
1.15 ECONOMIC ANALYSIS
Based on the Cash Flow Model results, the Project has an unlevered after-tax NPV8% and NPV10% of $1,100M and $771M respectively, an after-tax IRR of 19.2%, a payback period of 6 years including Year 4 investment in the Concentrate Leach Facility, and an annual average EBITDA of $372M at a long-term copper price of $3.75/lb. of copper.
The Project contemplates average annual copper production of 85,000 tonnes over a 20-year mine life, at average cash costs and sustaining cash costs of $1.47 and $1.82 per pound of copper, respectively. A variable cut-off grade strategy allows for higher mill head grade in the first ten years, which increases annual production to approximately 92,000 tonnes of copper at average cash costs and sustaining cash costs of $1.53 and $1.97 per pound of copper, respectively.
Thes economics demonstrate the project is robust, providing Hudbay with full flexibility to optimize the Project in the future through funding the addition of the concentrate leach facility with operating cash flows.
Key valuation, production, and cost details from the PFS are summarized in Table 1-10.
TABLE 1-10: SUMMARY OF PROJECT KEY VALUATION METRICS AT $3.75/LB. CU
| Summary of Key Metrics (at $3.75/lb Cu) |
| Valuation Metrics (Unlevered)1,2 |
Unit |
Phase I |
| Net Present Value @ 8% (after-tax) |
$ millions |
$1,100 |
| Net Present Value @ 10% (after-tax) |
$ millions |
$771 |
| Internal Rate of Return (after-tax) |
% |
19.2 |
| Payback Period |
# years |
5.9 |
| Project Metrics |
Unit |
Phase I |
| Growth Capital - Concentrator Process Plant |
$ millions |
$1,323 |
| Construction Length - Concentrator Process Plant |
# years |
2.6 |
| Growth Capital - Concentrate Leach Facility (Year 4) |
$ millions |
$367 |
| Construction Length - Concentrate Leach Facility |
# years |
1.0 |
| Operating Metrics |
Unit |
Year 1-10 |
Year 11-20 |
Phase I |
| Copper Production (annual avg.)3 |
000 tonnes |
92.3 |
77.5 |
85.3 |
| EBITDA (annual avg.)4 |
$ millions |
$404 |
$339 |
$372 |
| Sustaining Capital (annual avg.) |
$ millions |
$33.9 |
$19.4 |
$27.1 |
| Cash Cost5 |
$/lb. Cu |
$1.53 |
$1.39 |
$1.47 |
| Sustaining Cash Cost5 |
$/lb. Cu |
$1.95 |
$1.62 |
$1.81 |
| Sensitivity Analysis |
| Copper Price |
Unit |
$3.25/lb. |
$3.50/lb. |
$3.75/lb. |
$4.00/lb. |
$4.25/lb. |
$4.50/lb. |
| Net Present Value2 @ 8% |
$ millions |
$463 |
$786 |
$1,100 |
$1,409 |
$1,710 |
$2,006 |
| Net Present Value2 @ 10% |
$ millions |
$227 |
$503 |
$771 |
$1,033 |
$1,289 |
$1,540 |
| Internal Rate of Return2 |
% |
12.7% |
16.0% |
19.2% |
22.4% |
25.5% |
28.5% |
| Payback Period |
# years |
7.9 |
6.7 |
5.9 |
5.4 |
5.0 |
4.4 |
| EBITDA (annual avg.)2 |
$ millions |
288 |
330 |
$372 |
413 |
455 |
497 |
| Concentrate Leach Facility |
Unit |
No Conc Leach
(Flotation Only) |
50% Capacity in
Year 5 (Base Case) |
50% Capacity
in Year 1 |
100% Capacity
in Year 5 |
100% Capacity
in Year 1
|
| Net Present Value2 @ 8% |
$ millions |
$863 |
$1,100 |
$1,222 |
$1,302 |
$1,524 |
| Net Present Value2 @ 10% |
$ millions |
$605 |
$771 |
$869 |
$922 |
$1,107 |
| Internal Rate of Return2 |
% |
18.7% |
19.2% |
19.6% |
20.0% |
21.0% |
| Payback Period |
# years |
5.3 |
5.9 |
5.1 |
6.0 |
4.8 |
| EBITDA (annual avg.)4 |
$ millions |
296 |
$372 |
389 |
413 |
441 |
| Copper Prod (annual avg.)3 |
000 tonnes |
85.8 |
85.3 |
85.1 |
118.0 |
124.5 |
| Cash Cost5 |
$/lb Cu |
$1.81 |
$1.47 |
1.39 |
$1.43 |
$1.34 |
| Sustaining Cash Cost5 |
$/lb Cu |
$2.15 |
$1.82 |
1.74 |
$1.78 |
$1.69 |
1) Calculated assuming the following commodity prices: copper price of $3.75 per pound, copper cathode premium of $0.02 per pound (net of cathode freight charges), gold stream price of $450 per ounce, silver stream price of $3.90 per ounce and molybdenum price of $12.00 per pound. Reflects the terms of the existing Wheaton Precious Metals stream, including an upfront deposit of $230 million in the first year of Phase I construction in exchange for the delivery of 100% of gold and silver produced.
2) Net present value and internal rate of return are shown on an after-tax basis.
3) Copper production includes copper contained in concentrate sold and copper cathode produced from the concentrate leach facility. Average annual copper production excludes partial year of production in Year 20.
4) EBITDA is a non-IFRS financial performance measure with no standardized definition under IFRS. For further information, please refer to the company's most recent Management's Discussion and Analysis for the three and six months ended June 30, 2023.
5) By-product credits calculated using amortization of deferred revenue for gold and silver stream sales as per the company's approach in its quarterly financial reporting. By-product credits also include the revenue from the sale of excess acid produced at a price of $145 per tonne. Sustaining cash cost includes sustaining capital expenditures and royalties. Cash cost and sustaining cash cost are non-IFRS financial performance measures with no standardized definition under IFRS. For further details on why Hudbay believes cash costs are a useful performance indicator, please refer to the company's most recent Management's Discussion and Analysis for the three and six months ended June 30, 2023.
2 INTRODUCTION & TERMS OF REFERENCE
2.1 GENERAL
Hudbay is a diversified mining company primarily producing copper concentrate (containing copper, gold, and silver), silver/gold doré, and zinc and molybdenum concentrates. Hudbay's mission is to create sustainable value through the acquisition, development, and operation of high-quality, long-life deposits, with exploration potential in jurisdictions that support responsible mining, and to see the regions and communities in which the company operates benefit from its presence.
This Technical Report presents the results of a pre-feasibility study (PFS) and the mineral reserve and mineral resource estimates of Hudbay's 100%-owned Copper World Project in Pima County, Arizona, USA. The Project is directly held by Copper World, Inc., an indirect wholly owned subsidiary of Hudbay.
Hudbay previously completed a feasibility study contemplating a standalone development plan for the East deposit and published the results in a technical report titled "NI 43-101, Feasibility Study, Updated Mineral Resource, Mineral Reserve and Financial Estimates, Rosemont Project, Pima County, Arizona, USA" that was filed by Hudbay in March 2017 (the "2017 Feasibility Study" or the "2017 Technical Report").
While litigation over the federal permits for the standalone Rosemont Project was ongoing, Hudbay commenced a comprehensive review of the exploration potential of the entire land package it acquired from Augusta Resource Corporation, along with the East deposit, in 2014. Drilling conducted in 2020 and 2021 resulted in the discovery and delineation of multiple satellite deposits, in an almost continuous manner over a 7 km strike length adjacent to the East deposit.
Exploration successes on patented mining claims and ongoing litigation uncertainty regarding the initial Rosemont Project contemplated by the 2017 Feasibility Study caused Hudbay to evaluate alternative design options to unlock value within this prospective district.
A Preliminary Economic Assessment (PEA) titled "Preliminary Economic Assessment, Copper World Complex, Pima County, Arizona, USA", effective May 2022 and filed by Hudbay in July 2022 (the "2022 PEA" or the "2022 Technical Report"), contemplated a two-phased mine plan with the first phase reflecting a standalone operation and expected to require only state and local permits and reflected a 16-year mine life. A second phase extended the mine life to 44 years through an expansion onto federal land to mine the entire deposits. Phase II would be subject to the federal permitting process.
Since 2022, Hudbay has conducted an extensive infill drill program over the areas hosting the Mineral resource estimates that were included in Phase I of the 2022 PEA as well as new metallurgical testing work which led to a redesign and simplification of the process flowsheet as well as a review and update of the mine plan and tailings deposition strategy.
This Technical Report now contemplates a single phase mine plan based on mineral reserves and it does not include a second phase expansion on to federal lands that was previously included in the 2022 PEA, and which would have required federal permits.
This Technical Report describes the latest resource model and mine plan, and the current state of metallurgical testing, operating cost, and capital cost estimates which constitute the basis for the mineral reserve estimates supporting the PFS. An update of the mineral resource estimates exclusive of the mineral reserve estimates has also been completed. These mineral resources retain potential for economic extraction and supersede and replace the mineral resource estimates reported in 2022 Technical Report.
The Project set forth in this Technical Report contemplates a 20-year mine life and consists of four planned open pit mines with simpler processing infrastructure than what was contemplated in the 2022 PEA. The project design and layout are materially different from the 2017 Feasibility Study. The mine plan of the Project is now based on and optimized solely for the flotation of both copper sulfides and oxides. For the first 4 years of the Project, the final product is a copper concentrate sold to market. After construction of the processing plant infrastructure is completed in Year 4, leaching of the concentrate produced by the mill is added in Year 5 of the Project followed by solvent extraction and electrowinning to produce and sell copper cathodes, molybdenum concentrate, and silver and gold in doré, with sulfuric acid as a byproduct. The Project also includes waste rock and tailings storage facilities and supporting infrastructure and utilities.
The PFS demonstrates the economic viability of the proven and probable mineral reserve estimates. The inferred mineral resource estimates included in the PFS mine plan are considered too speculative geologically to have the economic consideration applied to them and as a result are treated as waste in this PFS. Likewise, there is a significant measured and indicated mineral resource that was formerly part of the Phase II mine plan in the 2022 PEA that has not yet been subject to a pre-feasibility study, and has been excluded from the mine plan presented in this Technical Report.
All dollar amounts in this Technical Report are in US dollars, unless otherwise noted.
2.2 TERMS OF REFERENCE
This Technical Report conforms with the 2014 CIM Definition Standards and the requirements of NI 43-101.
The author and Qualified Person who supervised the preparation of this Technical Report is Olivier Tavchandjian, P. Geo., Hudbay's Senior Vice President, Exploration and Technical Services. Mr. Tavchandjian made multiple site visits to the property to maintain familiarity with conditions on the property, to observe the geology and mineralization, and to verify the work completed on the Project. Mr. Tavchandjian has also reviewed and conducted sufficient confirmatory work to act as the Qualified Person for the reporting of the mineral resource and mineral reserve estimates for the Project.
The mineral resource and mineral reserve estimates are based on all scientific and technical information as of July 1, 2023, and therefore have an effective date of July 1, 2023.
Additional drilling collected since 2022 has focused on the infill drilling of the areas which were part of Phase I of the 2022 PEA and are expected to require only state and local permits. The cut-off date for any drilling assay results used in this PFS is March 1, 2023.
Additional mineralogical studies and metallurgical test work have been conducted since 2022 on material collected at all the deposits included in the scope of this PFS to assess the viability of the flotation and leaching components of the processing flow sheet.
The capital costs, sustaining capital costs, and operating costs have been reviewed and updated to reflect the current plan, and are expressed in 2023 dollars. All currency is expressed in United States dollars unless stated otherwise.
This Technical Report includes measurements in both imperial and metric tons. All references to "tons" and "(short) tons" are to imperial tons and all references to "tonnes" are to metric tonnes. Please refer to the Unit Abbreviations below for further information.
2.3 QUALIFIED PERSONS
The Qualified Person responsible for the preparation of this Technical Report, is Olivier Tavchandjian, P. Geo., Hudbay's Senior Vice President, Exploration and Technical Services. Mr. Tavchandjian is not independent from the company.
2.4 SITE VISITS & RESPONSIBILITY
Site visits to the Project have been completed as shown in Table 2-1. Mr. Tavchandjian, while on site, reviewed the site property, project office, and drilled core samples that remain at site, as well as visiting two external laboratories that were used for the drill campaigns since 2020.
Additional senior personnel of Hudbay involved in the preparation of this document are Matt Taylor (Vice President Metallurgy Services), Javier Toro (Vice President Mining Services), Andre Lauzon (Chief Operating Officer) and Jon Douglas (Vice President and Treasurer). Their involvement in this Technical Report is detailed in Table 3-1.
TABLE 2-1: DATES OF RECENT SITE VISITS
| Qualified Person |
Site Visit Dates |
| Olivier Tavchandjian |
May 17- 22, 2021
September 7-11, 2021
February 1-4, 2022
March 8-9, 2022
April 11-14, 2022
May 26-31, 2022
October 12-22, 2022 |
2.5 UNIT ABBREVIATIONS
The units of measure in this Technical Report are a combination of US standard units and metric units. Unless stated otherwise, all dollar amounts ("$") are in United States dollars. Unit abbreviations used are noted below in Table 2-2.
TABLE 2-2: UNIT ABBREVIATIONS

2.6 NAME ABBREVIATIONS
Abbreviations of company names, chemical terms, and general terms used in this Technical Report are as shown in Table 2-3.
TABLE 2-3: NAME ABBREVIATIONS
|
Abbreviation
|
Company Description
|
|
"404 Permit"
|
Permit contemplated by Section 404 of the Clean Water Act
|
|
ACC
|
Arizona Corporation Commission
|
|
ADEQ
|
Arizona Department of Environmental Quality
|
|
ADWR
|
Arizona Department of Water Resources
|
|
APP
|
Aquifer Protection Permit
|
|
ASMI
|
Arizona State Mine Inspector
|
|
Banner
|
Banner Mining Company
|
|
BLM
|
Bureau of Land Management
|
|
BML
|
Base Met Laboratory
|
|
BQ
|
BQ Drill Core Size 1.43 Inches Or 36.4mm Diameter
|
|
Bureau Veritas
|
Bureau Veritas Commodities Canada Ltd.
|
|
BWi
|
Bond Ball Mill Work Index
|
|
CEC
|
Certificate Of Environmental Compatibility
|
|
Chapi
|
Laboratorio Metalúrgico Chapi
|
|
CIM
|
Canadian Institute of Mining, Metallurgy and Petroleum
|
|
EPCM
|
Engineering Procurement and Construction Manager
|
|
FUP
|
Floodplain Use Permit
|
|
HQ
|
HQ Drill Core Size 2.50 Inches or 63.5mm Diameter
|
|
Hudbay
|
Collectively, Hudbay Minerals Inc., its subsidiaries & business units
|
|
ISO
|
International Standards Organization
|
|
KCA
|
Kappes, Cassiday & Associates
|
|
MLRP
|
Arizona Mined Land Reclamation Plan
|
|
MSRDI
|
Mountain State R&D International
|
|
NEPA
|
National Environmental Policy Act
|
|
NHPA
|
National Historic Preservation Act
|
|
NQ
|
HQ Drill Core Size 1.875 Inches or 47.6mm Diameter
|
|
OREAS
|
Ore Research and Exploration
|
|
PQ
|
PQ Drill Core Size 3.3 Inches Or 83mm Diameter
|
|
SGS
|
SGS Canada Inc.
|
|
Skyline
|
Skyline Assayers & Laboratories
|
|
TEP
|
Tucson Electric Power
|
|
TIA
|
Tucson International Airport
|
|
TRICO
|
Trico Electric Cooperative Inc.
|
|
SEDAR+
|
System for Electronic Document Analysis and Retrieval
|
|
TIMA
|
TESCAN Integrated Mineral Analyzer
|
|
UCM
|
United Copper & Moly LLC
|
|
USACE
|
United States Army Corps of Engineers
|
|
USFS
|
United States Forest Service
|
|
USFWS
|
United States Fish and Wildlife Service
|
|
VoIP
|
Voice-over Internet Protocol
|
|
XPS
|
XPS Consulting & Test work Services
|
|
Abbreviation
|
General Description
|
|
3D
|
Three-Dimensional
|
|
AAS
|
Atomic Absorption Spectrometry
|
|
AG
|
Acid-Generating
|
|
AV
|
Average
|
|
BA
|
Biological Assessment
|
|
BADCT
|
Best Available Demonstrated Control Technology
|
|
BO
|
Biological Opinion
|
|
CBV
|
Certified Best Value
|
|
CCD
|
Countercurrent Decantation
|
|
CCTV
|
Closed-Circuit Television
|
|
CEC
|
Cation Exchange Capacity
|
|
CPS
|
Controlled Potential Sulfidization
|
|
CRM
|
Certified Reference Materials
|
|
DCIP
|
Induced Polarization/Resistivity
|
|
DIA
|
Discharge Impact Area
|
|
DWT
|
JK Drop-Weight
|
|
EBITDA
|
Earnings Before Interest, Taxes, Depreciation, And Amortization
|
|
EDA
|
Exploratory Data Analysis
|
|
EIS
|
Environmental Impact Statement
|
|
EPMA
|
Electron Probe Micro-analysis
|
|
FROD
|
Final Record of Decision
|
|
GCL
|
Geosynthetic Clay Liner
|
|
HMI
|
Human Machine Interface
|
|
HPTPs
|
Historic Properties Treatment Plans
|
|
ICP
|
Inductively Coupled Plasma
|
|
ICP-ES
|
Inductively Coupled Plasma Emission Spectroscopy
|
|
ICP-MS
|
Inductively Coupled Plasma Mass Spectrometry
|
|
ICP-OES
|
Inductively Coupled Plasma Optical Emission Spectroscopy
|
|
LOM
|
Life Of Mine
|
|
MPO
|
Mine Plan of Operations
|
|
NAG
|
Non-Acid Generating
|
|
NIR
|
Near Infrared Spectroscopy
|
|
NN
|
Nearest Neighbour
|
|
NPV
|
Net Present Value
|
|
NSR
|
Net Smelter Return
|
|
OK
|
Ordinary Kriging
|
|
OSA
|
Online Sample Analyzer
|
|
PAG
|
Potentially Acid Generating
|
|
PCS
|
Process Control System
|
|
PEA
|
Preliminary Economic Assessment
|
|
PFS
|
Pre-Feasibility Study
|
|
PLS
|
Pregnant Leach Solution
|
|
POC
|
Point Of Compliance
|
|
QA/QC
|
Quality Assurance and Quality Control
|
|
QEMSCAN
|
Quantitative Evaluation of Minerals by Scanning Electron Microscopy
|
|
R2
|
Coefficient Of Determination
|
|
RC
|
Reverse Circulation
|
|
RE
|
Absolute Relative Error
|
|
RMA
|
Reduced-To-Major-Axis Regression
|
|
ROD
|
Record Of Decision
|
|
ROM
|
Run Of Mine
|
|
RQD
|
Rock Quality Designation / Rock Quality Data
|
|
SAG
|
Semi-Autogenous Grinding
|
|
SD
|
Standard deviation
|
|
SG
|
Specific Gravity
|
|
SGI
|
SAG Grindability Index
|
|
SMU
|
Selective Mining Unit
|
|
SPI®
|
SAG Power Index
|
|
SX/EW
|
Solvent Extraction and Electro-Winning
|
|
TSF
|
Tailings Storage Facility
|
|
WRFs
|
Waste Rock Facilities
|
|
XRD
|
X-Ray Diffraction
|

3 RELIANCE ON OTHER EXPERTS
The information, conclusions, opinions, and estimates contained herein are based on:
- Information available to Hudbay at the time of preparation of this Technical Report, and
- Assumptions, conditions, and qualifications as set forth in this Technical Report.
TABLE 3-1: RELIANCE ON OTHER EXPERTS
| Section |
Description |
Responsible Person |
| 1 |
Summary |
Olivier Tavchandjian |
| 2 |
Introduction & Terms of Reference |
Olivier Tavchandjian |
| 3 |
Reliance on Other Experts |
Olivier Tavchandjian |
| 4 |
Property Description & Location |
Andre Lauzon |
| 5 |
Accessibility, Climate, Local Resources, Infrastructure & Physiography |
Olivier Tavchandjian |
| 6 |
History |
Olivier Tavchandjian |
| 7 |
Geological Setting & Mineralization |
Olivier Tavchandjian |
| 8 |
Deposit Type |
Olivier Tavchandjian |
| 9 |
Exploration |
Olivier Tavchandjian |
| 10 |
Drilling |
Olivier Tavchandjian |
| 11 |
Sample Preparation Analyses & Security |
Olivier Tavchandjian |
| 12 |
Data Verification |
Olivier Tavchandjian |
| 13 |
Mineral Processing & Metallurgical Testing |
Matt Taylor |
| 14 |
Mineral Resource Estimates |
Olivier Tavchandjian |
| 15 |
Mineral Reserve Estimates |
Javier Toro |
| 16 |
Mining Methods |
Javier Toro |
| 17 |
Recovery Methods |
Matt Taylor |
| 18 |
Project Infrastructure |
Javier Toro |
| 19 |
Marketing |
Jon Douglas |
| 20 |
Environmental Studies, Permitting, & Social or Community Impact |
Andre Lauzon |
| 21 |
Capital & Operating Costs |
Olivier Tavchandjian |
| 22 |
Economic Analysis |
Jon Douglas |
| 23 |
Other Relevant Data & Information |
Olivier Tavchandjian |
| 24 |
Interpretation & Conclusions |
Olivier Tavchandjian |
| 25 |
Recommendations |
Olivier Tavchandjian |
| 26 |
References |
Olivier Tavchandjian |
4 PROPERTY DESCRIPTION & LOCATION
4.1 LOCATION
The Project is located within the historical Helvetia-Rosemont Mining District that dates to the 1800's. The deposits lie on the northern end and western foothills of the Santa Rita Mountain range approximately 28 miles (45 km) southeast of Tucson, in Pima County, Arizona, USA. The land is located within Townships 17, 18 and 19 South, Ranges 15 and 16 East, Gila & Salt River Meridian, Pima County, Arizona. The Project geographical coordinates are approximately 31º 86'N and 110º 77'W.
Access to the Project is from Santa Rita and Helvetia Roads from the west and Highway 83, over and across Forest Service roads from the east.
FIGURE 4-1: PROJECT PROPERTY OWNERSHIP

4.2 TENURE
The property consists of a combination of fee land, leased land, patented mining claims and mill sites, unpatented mining claims and mill sites, rights-of-way from the Arizona State Land Department, and grazing leases and permits (Figure 4-1). Taken together, the land position is sufficient to allow an open pit mining operation, processing and concentrating facilities, storage of tailings, disposal of waste rock, and a utility corridor to bring water and power to the Project. The Federal lands covered by unpatented mining claims and mill sites are accessible under the provisions of the Mining Law of 1872, subject to approval in accordance with the surface use regulations of the U.S. Forest Service ("USFS") and the Bureau of Land Management ("BLM") and in compliance with the National Environmental Policy Act ("NEPA").
The core of the Project Mineral resource is contained within the 132 patented mining claims and mill sites that in total encompass an area of 2,004 acres (811 hectares) (the "Patented Claims"). Surrounding the Patented Claims is a contiguous package of 1,866 unpatented mining claims and mill sites with an aggregate area of more than 22,416 acres (9,072 hectares) (the "Unpatented Claims"). Associated with the Patented Claims and Unpatented Claims are 81 parcels of fee (private) land consisting of approximately 3,461 acres (1,401 hectares) (the "Associated Fee Lands"). The area covered by the Patented Claims, Unpatented Claims and Associated Fee Lands totals approximately 27,721 acres (11,218 hectares). A table of the legal descriptions, location and acreages of the Patented Claims, Unpatented Claims and Associated Fee Lands is provided in Table 4-1, Table 4-2, Table 4-3, and Table 4-4.
TABLE 4-1: PATENTED MINING CLAIMS - DESCRIPTION & LOCATION
PATENTED CLAIM PROPERTY (2021)
BY PIMA COUNTY PROPERTY TAX PARCEL NO. |
| PARCEL NO. |
PARCEL DESCRIPTION |
PROPERTY NAME |
ASSESSED ACRES |
| 305540020 |
US PAT MINE HELVETIA DIST BLACK BESS 13.54 AC SEC 13-18-15 |
BLACK BESS |
13.54 |
| 305540030 |
US PAT MINE HELVETIA DIST FLYING DUTCHMAN 20.38 AC SEC 13-18-15 |
FLYING DUTCHMAN |
20.38 |
| 305540040 |
US PAT MINE HELVETIA DIST WISCONSIN 20.66 AC SEC 13-18-15 |
WISCONSIN |
20.66 |
| 305540050 |
US PAT MINE HELVETIA DIST EXCHANGE 20.66 AC SEC 13-18-15 |
EXCHANGE |
20.66 |
| 305540060 |
US PAT MINE HELVETIA DIST EXCHANGE 2 6.59 AC SEC 13-18-15 |
EXCHANGE NO. 2 |
6.59 |
| 305540070 |
US PAT MINE HELVETIA DIST COPPER WORLD 20.66 AC SEC 13-18-15 |
COPPER WORLD |
20.66 |
| 305540080 |
US PAT MINE HELVETIA DIST OWOSKO 20.66 AC SEC 13-18-15 |
OWOSKO |
20.66 |
| 305540090 |
US PAT MINE HELVETIA DIST BLACK HORSE 13.81 AC SEC 13-18-15 |
BLACK HORSE |
13.81 |
| 305540100 |
US PAT MINE HELVETIA DIST BRUNSWICK 18.66 AC SEC 13-18-15 |
BRUNSWICK |
18.66 |
| 305540110 |
US PAT MINE HELVETIA DIST ANTELOPE 17.36 AC SEC 13-18-15 |
ANTELOPE |
17.36 |
| 305550010 |
US PAT MINE HELVETIA DIST NEWMAN 16.50 AC SEC 14-18-15 |
NEWMAN |
16.5 |
| 305550040 |
US PAT MINE HELVETIA DIST CHANCE 20.16 AC SEC 14-18-15 |
CHANCE |
20.16 |
| 305550050 |
US PAT MINE HELVETIA DIST BLACK HAWK 11.36 AC SEC 14-18-15 |
BLACK HAWK |
11.36 |
| 305550060 |
US PAT MINE HELVETIA DIST TELEMETER 8.15 AC SEC 14-18-15 |
TELEMETER |
8.15 |
| 305550070 |
US PAT MINE HELVETIA DIST WEST END 19.53 AC SEC 14-18-15 |
WEST END |
19.53 |
| 305550080 |
US PAT MINE HELVETIA DIST HATTIE 12.19 AC SEC 14-18-15 |
HATTIE |
12.19 |
| 305550090 |
US PAT MINE HELVETIA DIST SILVER SPUR 8.61 AC SEC 14-18-15 |
SILVER SPUR |
8.61 |
| 305550100 |
US PAT MINE HELVETIA DIST SLIDE 12.88 AC SEC 14-18-15 |
SLIDE |
12.88 |
| 305550110 |
US PAT MINE HELVETIA DIST BACK BONE 19.07 AC SEC 14-18-15 |
BACK BONE |
19.07 |
| 305550130 |
US PAT MINE HELVETIA DIST BUZZARD 20.66 AC SEC 14-18-15 |
BUZZARD |
20.66 |
| 305550140 |
US PAT MINE HELVETIA DIST HEAVY WEIGHT 20.66 AC SEC 14-18-15 |
HEAVY WEIGHT |
20.66 |
| 305550150 |
US PAT MINE HELVETIA DIST LIGHT WEIGHT 20.66 AC SEC 14-18-15 |
LIGHT WEIGHT |
20.66 |
| 305560040 |
US PAT MINE HELVETIA DIST PEACH 18.07 AC SEC 15-18-15 |
PEACH |
18.07 |
| 305560050 |
US PAT MINE HELVETIA DIST SOUTH END 17.81 AC SEC 15-18-15 |
SOUTH END |
17.81 |
| 305560060 |
US PAT MINE HELVETIA DIST MONITOR 13.32 AC SEC 15-18-15 |
MONITOR |
13.32 |
| 305560070 |
US PAT MINE HELVETIA DIST GAP 16.25 AC SEC 15-18-15 |
GAP |
16.25 |
| 305580080 |
US PAT MINE HELVETIA DIST WATER WISH 20.66 AC SEC 23-18-15 |
WATER WISH |
20.66 |
| 305580090 |
US PAT MINE HELVETIA DIST NEW MEXICO 15.13 AC SEC 23-18-15 |
NEW MEXICO |
15.13 |
| 305580100 |
US PAT MINE HELVETIA DIST GRIZZLY 20.66 AC SEC 23-18-15 |
GRIZZLY |
20.66 |
| 305580110 |
US PAT MINE HELVETIA DIST OLD DICK 20.13 AC SEC 23-18-15 |
OLD DICK |
20.13 |
| 305580120 |
US PAT MINE HELVETIA DIST AMERICAN 20.10 AC SEC 23-18-15 |
AMERICAN |
20.1 |
| 305580130 |
US PAT MINE HELVETIA DIST RECORDER 6.70 AC SEC 23-18-15 |
RECORDER |
6.7 |
| 305580140 |
US PAT MINE HELVETIA DIST MOHAWK 13.55 AC SEC 23-18-15 |
MOHAWK |
13.55 |
| 305580150 |
US PAT MINE HELVETIA DIST WEDGE 19.31 AC SEC 23-18-15 |
WEDGE |
19.31 |
| 305580160 |
US PAT MINE HELVETIA DIST DAN 2.48 AC SEC 23-18-15 |
DAN |
2.48 |
| 305580170 |
US PAT MINE HELVETIA DIST GENERAL 9.17 AC SEC 23-18-15 |
GENERAL |
9.17 |
| 305580180 |
US PAT MINE HELVETIA DIST ELGIN 14 AC SEC 23-18-15 |
ELGIN |
14 |
| 305580190 |
US PAT MINE HELVETIA DIST SUNSETE .667 AC SEC 23-18-15 |
SUNSETE |
0.667 |
| 305580200 |
US PAT MINE HELVETIA DIST TELEPHONE 18.66 AC SEC 23-18-15 |
TELEPHONE |
18.66 |
| 305580220 |
US PAT MINE HELVETIA DIST ELGIN M S 4.994 AC SEC 23-18-15 |
ELGIN MILLSITE |
4.994 |
| 305580250 |
US PAT MINE HELVETIA DIST DAN M S 2.856 AC SEC 23-18-15 |
DAN MILLSITE |
2.856 |
| 305580260 |
US PAT MINE HELVETIA DIST WEDGE M S 4.987 AC SEC 23-18-15 |
WEDGE MILLSITE |
4.987 |
| 305580270 |
US PAT MINE HELVETIA DIST OLD DICK M S 2.196 AC SEC 23-18-15 |
OLD DICK MILLSITE |
2.196 |
| 305590060 |
US PAT MINE HELVETIA DIST ARCOLA 20.66 AC SEC 24-18-15 |
ARCOLA |
20.66 |
| 305590070 |
US PAT MINE HELVETIA DIST BONNIE BLUE 20.66 AC SEC 24-18-15 |
BONNIE BLUE |
20.66 |
| 305590080 |
US PAT MINE HELVETIA DIST KING 20.66 AC SEC 24-18-15 |
KING |
20.66 |
| 305590090 |
US PAT MINE HELVETIA DIST EXILE 16.02 AC SEC 24-18-15 |
EXILE |
16.02 |
| 305590100 |
US PAT MINE HELVETIA DIST VULTURE 15.73 AC SEC 24-18-15 |
VULTURE |
15.73 |
| 305590110 |
US PAT MINE HELVETIA DIST ISLE ROYAL 20.66 AC SEC 24-18-15 |
ISLE ROYAL |
20.66 |
| 305590120 |
US PAT MINE HELVETIA DIST INDIAN CLUB 19.20 AC SEC 24-18-15 |
INDIAN CLUB |
19.2 |
| 305590130 |
US PAT MINE HELVETIA DIST A O T 14.20 AC SEC 24-18-15 |
A.O.T. |
14.2 |
| 305590140 |
US PAT MINE HELVETIA DIST BALTIMORE 9.62 AC SEC 24-18-15 |
BALTIMORE |
9.62 |
| 305590150 |
US PAT MINE HELVETIA DIST PILOT 14.70 AC SEC 24-18-15 |
PILOT |
14.7 |
| 305590160 |
US PAT MINE HELVETIA DIST LITTLE DAVE 20.66 AC SEC 24-18-15 |
LITTLE DAVE |
20.66 |
| 305590170 |
US PAT MINE HELVETIA DIST COPPER FEND 20.66 AC SEC 24-18-15 |
COPPER FEND |
20.66 |
| 305590180 |
US PAT MINE HELVETIA DIST TALLY HO 20.38 AC SEC 24-18-15 |
TALLY HO |
20.38 |
| 305590190 |
US PAT MINE HELVETIA DIST LEADER 20.66 AC SEC 24-18-15 |
LEADER |
20.66 |
| 305590200 |
US PAT MINE HELVETTA DIST OMEGA 20.66 AC SEC 24-18-15 |
OMEGA |
20.66 |
| 305590220 |
US PAT MINE HELVETIA DIST ECLIPSE COPPER 20.66 AC SEC 24-18-15 |
ECLIPSE COPPER |
20.66 |
| 305590230 |
US PAT MINE HELVETIA DIST SCHWAB 9.261 AC SEC 24-18-15 |
SCHWAB |
9.261 |
| 305590240 |
US PAT MINE HELVETIA DIST NARRAGANSETT BAY 12.428 AC SEC 24-18-15 |
NARRAGANSETT BAY |
12.428 |
| 30559025A |
US PAT MINE HELVETIA DIST LANDOR 11.200 AC SEC 24-18-15 |
LANDOR (WESTERLY PORTION) |
11.2 |
| 30559025B |
US PAT MINE HELVETIA DIST LANDOR 4.470 AC SEC 14-18-15 |
LANDOR (EASTERLY PORTION) |
4.47 |
| 30559026A |
US PAT MINE HELVETIA DIST WARD 16.664 AC SEC 24-18-15 |
WARD (WESTERLY PORTION) |
16.664 |
| 30559026B |
US PAT MINE HELVETIA DISTRICT WARD .9240 AC SEC 19-18-16 |
WARD (EASTERLY PORTION) |
0.924 |
| 305590270 |
US PAT MINE HELVETIA DIST ALTA COPPER 18.18 AC SEC 24-18-15 |
ALTA COPPER |
18.18 |
| 305590280 |
US PAT MINE HELVETIA DIST BROADTOP BUTTE 17.15 AC SEC 24-18-15 |
BROADTOP BUTTE |
17.15 |
| 30559029A |
US PAT MINE HELVETIA DIST MALACHITE 14.840 AC SEC 24-18-15 |
MALACHITE (WESTERLY PORTION) |
14.84 |
| 30559029B |
US PAT MINE HELVETIA DIST MALACHITE 6.780 AC SEC 19-18-16 |
MALACHITE (EASTERLY PORTION) |
6.78 |
| 305600040 |
US PAT MINE HELVETIA DIST YORK 13.38 AC SEC 25-18-15 |
YORK |
13.38 |
| 305600050 |
US PAT MINE HELVETIA DIST OLCOTT 5.485 AC SEC 25-18-15 |
OLCOTT |
5.485 |
| 305600060 |
US PAT MINE HELVETIA DIST HILO CONSOLIDATED 12.19 AC SEC 25-18-15 |
HILO CONSOLIDATED |
12.19 |
| 305600070 |
US PAT MINE HELVETIA DIST ELDON 18.984 AC SEC 25-18-15 |
ELDON |
18.984 |
| 305600080 |
US PAT MINE HELVETIA DIST RAINBOW 7.765 AC SEC 25-18-15 |
RAINBOW |
7.765 |
| 305600090 |
US PAT MINE HELVETIA DIST AJAX CON 12.03 AC SEC 25-18-15 |
AJAX CONSOLIDATED |
13.98 |
| 305600100 |
US PAT MINE HELVETIA DIST CUBA 12.03 AC SEC 25-18-15 |
CUBA |
12.03 |
| 305600110 |
US PAT MINE HELVETIA DIST FALLS 16.34 AC SEC 25-18-15 |
FALLS |
16.34 |
| 305600130 |
US PAT MINE HELVETIA DIST OLD PUT CON 20.65 AC SEC 25-18-15 |
OLD PUT CON |
20.65 |
| 305600140 |
US PAT MINE HELVETIA DIST FRANKLIN 20.54 AC SEC 25-18-15 |
FRANKLIN |
20.54 |
| 305600150 |
US PAT MINE HELVETIA DIST CUSHING 15.04 AC SEC 25-18-15 |
CUSHING |
15.04 |
| 305600160 |
US PAT MINE HELVETIA DIST CENTRAL 17.86 AC SEC 25-18-15 |
CENTRAL |
17.86 |
| 30560017A |
US PAT MINE HELVETIA DIST POTOMAC 19.99 AC SEC 25-18-15 |
POTOMAC (WESTERLY PORTION) |
19.99 |
| 30560017B |
US PAT MINE HELVETIA DIST POTOMAC .5280 AC SEC 30-18-16 |
POTOMAC (EASTERLY PORTION) |
0.528 |
| 305610010 |
US PAT MINE HELVETIA DIST MARION 20.66 AC SEC 36-18-15 |
MARION |
20.66 |
| 305610030 |
US PAT MINE HELVETIA DIST EXCELSIOR 20.575 AC SEC 36-18-15 |
EXCELSIOR |
20.575 |
| 305610040 |
US PAT MINE HELVETIA DIST EMPIRE 10.21 AC SEC 36-18-15 |
EMPIRE |
10.21 |
| 305610050 |
US PAT MINE HELVETIA DIST ALTAMONT 20.61 AC SEC 36-18-15 |
ALTAMONT |
20.61 |
| 305610060 |
US PAT MINE HELVETIA DIST ERIE 19.61 AC SEC 36-18-15 |
ERIE |
19.61 |
| 305610080 |
US PAT MINE HELVETIA DIST CHICAGO 16.66 AC SEC 36-18-15 |
CHICAGO |
16.66 |
| 305610090 |
US PAT MINE HELVETIA DIST COCONINO 14.10 AC SEC 36-18-15 |
COCONINO |
14.1 |
| 30563002A |
US PAT MINE HELVETIA DIST OLUSTEE 20.36 AC SEC 19-18-16 |
OLUSTEE (EASTERLY PORTION) |
20.36 |
| 30563002B |
US PAT MINE HELVETIA DIST OLUSTEE .450 AC SEC 24-18-15 |
OLUSTEE (WESTERLY PORTION) |
0.45 |
| 30563004A |
US PAT MINE HELVETIA DIST AMOLE 17.573 AC SEC 19-18-16 |
AMOLE (EASTERLY PORTION) |
17.573 |
| 30563004B |
US PAT MINE HELVETIA DIST AMOLE .459 AC |
AMOLE (WESTERLY PORTION) |
0.459 |
| 305640020 |
US PAT MINE HELVETIA DIST CHICAGO M S 5 AC SEC 29-18-16 |
CHICAGO MILLSITE |
5 |
| 305640030 |
US PAT MINE HELVETIA DIST COCONINO M S 5 AC SEC 29-18-16 |
COCONINO MILLSITE |
5 |
| 305640040 |
US PAT MINE HELVETIA DIST OLD PUT M S 5 AC SEC 29-18-16 |
OLD PUT MILLSITE |
5 |
| 305640050 |
US PAT MINE HELVETIA DIST OREGON M S 5 AC SEC 29-18-16 |
OREGON MILLSITE |
5 |
| 305640060 |
US PAT MINE HELVETIA DIST OLD PAP M S 5 AC SEC 29-18-16 |
OLD PAP MILLSITE |
5 |
| 305640070 |
US PAT MINE HELVETIA DIST AJAX CON M S 5 AC SEC 29-18-16 |
AJAX CONSOLIDATED MILLSITE |
5 |
| 305650020 |
US PAT MINE HELVETIA DIST R G INGERSOLL 20.62 AC SEC 30-18-16 |
R. G. INGERSOLL |
20.62 |
| 305650040 |
US PAT MINE HELVETIA DIST PATRICK HENRY 19.05 AC SEC 30-18-16 |
PATRICK HENRY |
19.05 |
| 305660050 |
US PAT MINE HELVETIA DIST MOHAWK SILVER 19.76 AC SEC 1-19-15 |
MOHAWK SILVER |
19.76 |
| 305660060 |
US PAT MINE HELVETIA DIST TREMONT 12.86 AC SEC 1-19-15 |
TREMONT |
12.86 |
| 30554012A |
US PAT MINE HELVETIA DIST BLUE POINT 19.288 AC SEC 13-18-15 |
BLUE POINT |
19.288 |
| 30555012A |
US PAT MINE HELVETIA DIST HEAVY WEIGHT M S 5 AC SEC 14-18-15 |
HEAVY WEIGHT MILLSITE |
5 |
| 30558021A |
US PAT MINE HELVETIA DIST TELEPHONE M S EXC SLY PTN 4.61 AC SEC 23-18-15 |
TELEPHONE MILLSITE |
4.61 |
| 30558023A |
US PAT MINE HELVETIA DIST RECORDER M S EXC NLY PTN 2.64 AC SEC 23-18-15 |
RECORDER MILLSITE |
2.64 |
| 30558023B |
US PAT MINE HELVETIA DIST PTN S CNTL TELEPHONE MS & PTN N2 RECORDER MS & PTN NWLY AMERICAN MS 3.83 AC SEC 23-18-15 |
TELEPHONE MILLSITE |
3.83 |
| RECORDER MILLSITE |
| AMERICAN MILLSITE |
| 30558024A |
US PAT MINE HELVETIA DIST AMERICAN M S EXC NWLY PTN 4.54 AC SEC 23-18-15 |
AMERICAN MILLSITE |
4.54 |
| 30559021A |
US PAT MINE HELVETIA DIST OMEGA FIRST EXT SOUTH 20.66 AC SEC 24-18-15 |
OMEGA FIRST EXTENSION SOUTH |
20.66 |
| 30560003A |
US PAT MINE HELVETIA DIST DAYLIGHT EXC PTN IN SEC 30-18-16 13.21 AC SEC 25-18-15 |
DAYLIGHT |
13.21 |
| 30560003B |
US PAT MINE HELVETIA DIST DAYLIGHT 5.96 AC SEC 30-18-16 |
DAYLIGHT |
5.96 |
| 30560012A |
US PAT MINE HELVETIA DIST OLD PAP COPPER 20.65AC SEC 25-18-15 |
OLD PAP COPPER |
20.65 |
| 30560012D |
US PAT MINE HELVETIA DIST FALLS NO 2 7.32 AC SEC 25-18-15 |
FALLS NO. 2 |
7.32 |
| 30560012F |
US PAT MINE HELVETIA DIST WEDGE NO 2 1.28 AC SEC 25-18-15 |
WEDGE NO. 2 |
1.28 |
| 30560012G |
US PAT MINE HELVETIA DIST WEDGE 6.60 AC SEC 25-18-15 |
WEDGE |
6.6 |
| 30560012H |
US PAT MINE HELVETIA DIST SANTA RITA FRACTION .98 AC SEC 25-18-15 |
SANTA RITA FRACTION |
0.98 |
| 30560012J |
US PAT MINE HELVETIA DIST SANTA RITA #13 10.52 AC SEC 25-18-15 |
SANTA RITA #13 |
10.52 |
| 30561007A |
US PAT MINE HELVETIA DIST OREGON COPPER 16.08 AC SEC 36-18-15 |
OREGON COPPER |
16.08 |
| 30561007D |
US PAT MINE HELVETIA DIST SANTA RITA #15 13.59 AC SEC 36-18-15 |
SANTA RITA #15 |
13.59 |
| 30561007E |
US PAT MINE HELVETIA DIST SANTA RITA #14 19.16 AC SEC 36-18-15 |
SANTA RITA #14 |
19.16 |
| 30561007F |
US PAT MINE HELVETIA DIST SANTA RITA #12 19.62 AC SEC 36-18-15 |
SANTA RITA #12 |
19.62 |
| 30561007G |
US PAT MINE HELVETIA DIST LAST CHANCE NO 1 15.60 AC SEC 36-18-15 |
LAST CHANCE NO. 1 |
15.6 |
| 30561007H |
US PAT MINE HELVETIA DIST LAST CHANCE NO 2 18.27 AC SEC 36-18-15 |
LAST CHANCE NO. 2 |
18.27 |
| 30561007J |
US PAT MINE HELVETIA DIST SANTA RITA #26 20.03 AC SEC 36-18-15 |
SANTA RITA #26 |
20.03 |
| 30561007K |
US PAT MINE HELVETIA DIST SANTA RITA #27 18.76 AC SEC 36-18-15 |
SANTA RITA #27 |
18.76 |
| 30561007L |
US PAT MINE HELVETIA DIST SANTA RITA #28 18.57 AC SEC 36-18-15 |
SANTA RITA #28 |
18.57 |
| 30562034C |
US PAT MINE HELVETIA DIST SANTA RITA #16 18.92 AC SEC 31-18-16 |
SANTA RITA #16 |
18.92 |
| 30562034D |
US PAT MINE HELVETIA DIST SANTA RITA #15 6.44 AC SEC 31-18-16 |
SANTA RITA #15 |
6.44 |
| 30562034E |
US PAT MINE HELVETIA DIST SANTA RITA #28 2.01 AC SEC 31-18-16 |
SANTA RITA #28 |
2.01 |
| 30562034F |
US PAT MINE HELVETIA DIST SANTA RITA #13 7.51 AC SEC 31-18-16 |
SANTA RITA #13 |
7.51 |
| 30563003A |
US PAT MINE HELVETIA DIST CUPRITE 20.66 AC SEC 19-18-16 |
CUPRITE |
20.66 |
| 30564008A |
US PAT MINE HELVETIA DIST FRANKLIN M S 5 AC SEC 29-18-16 |
FRANKLIN MILLSITE |
5 |
| 30565003A |
US PAT MINE HELVETIA DIST LA FAYETTE 13.95 AC SEC 30-18-16 |
LA FAYETTE |
13.95 |
| 30565003D |
US PAT MINE HELVETIA DIST SANTA RITA #4 19 AC SEC 30-18-16 |
SANTA RITA #4 |
19 |
| 30565003E |
US PAT MINE HELVETIA DIST SANTA RITA #5 19.02 AC SEC 30-18-16 |
SANTA RITA #5 |
19.02 |
| 30565003F |
US PAT MINE HELVETIA DIST SANTA RITA #6 18.99 AC SEC 30-18-16 |
SANTA RITA #6 |
18.99 |
| 30565003G |
US PAT MINE HELVETIA DIST SANTA RITA #8A 3.66 AC SEC 25-18-15 |
SANTA RITA #8A |
3.66 |
| 30565003H |
US PAT MINE HELVETIA DIST SANTA RITA #9 SEC 31 & 30-18-16 EXC PTN IN SEC 25-18-15 19.58 AC |
SANTA RITA #9 |
19.58 |
| 30565003J |
US PAT MINE HELVETIA DIST SANTA RITA #10 20.56 AC SEC 30 & 31-18-16 |
SANTA RITA #10 |
20.56 |
| 30565003K |
US PAT MINE HELVETIA DIST SANTA RITA #11 20.56 AC SEC 30 & 31-18-16 |
SANTA RITA #11 |
20.56 |
| 30565003L |
US PAT MINE HELVETIA DIST SANTA RITA #8A 10.75 AC SEC 25-18-15 (S/B 30-18-16) EXC PTN IN SEC 25-18-15) |
SANTA RITA #8A |
10.75 |
| 30565003M |
US PAT MINE HELVETIA DIST SANTA RITA #9 1.02 AC SEC 25-18-15 |
SANTA RITA #9 |
1.02 |
| 30565005A |
US PAT MINE HELVETIA DIST DAN WEBSTER 15.19 AC SEC 30 T18S R16E EXC PTN SEC 25-18-15 |
DAN WEBSTER |
15.19 |
| 30565005B |
US PAT MINE HELVETIA DIST DAN WEBSTER 3.77 AC SEC 25-18-15 EXC PTN SEC 30-18-16 |
DAN WEBSTER |
3.77 |
| COPPER WORLD, INC. - PATENTED CLAIM TOTALS |
2004.474 |
*As assigned
** Ownership does not expire so long as real estate taxes are paid.
TABLE 4-2: UNPATENTED MINING CLAIMS - DESCRIPTION & LOCATION


All of said claims and mill sites are located in Sections 1, 2, 10, 11, 12, 13, 14, 15, 22, 23, 24, 25, 26, 35 and 36, Township 18 South, Range 15 East; Sections 5, 6, 7, 8, 9, 14, 15, 16, 17, 18, 19, 20, 21, 22, 23, 26, 27, 28, 29, 30, 31, 32, 33 and 34, Township 18 South, Range 16 East; Sections 1, 2 and 12, Township 19 South, Range 15 East; and Sections 4, 5, 6, 7, 8, and 9, Township 19 South, Range 16 East; G&SRB&M.
Ownership does not expire as long as the BLM Annual Maintenance Fee Due September 1 are paid, subject to change by Act of U.S. Congress (Current Fee is $165/claim for a total of US $307,890.00 annually)
*Lauderbach & Pioneer Trust No. 11,778, 1.5% each of a 3.0% Net Smelter Return Royalty, Recorded in Docket 8351, Pages 1801-1824, Pima County, AZ (AS ASSIGNED)
TABLE 4-3: FEE OWNED PROPERTIES - DESCRIPTION & LOCATION
| FEE OWNED (ASSOCIATED) PROPERTY BY PIMA COUNTY PROPERTY TAX PARCEL NO. |
| |
PARCEL NO. |
PROPERTY NAME |
ACRES |
| 1 |
305580280 |
HELVETIA RANCH - LOT 5 10.08 AC SEC 23-18-15 |
10.08 |
| 2 |
305580330 |
HELVETIA RANCH ANNEX - NW4 SW4 EXC MINERAL RIGHTS 40.00 AC SEC 23-18-15 |
40 |
| 3 |
305580350 |
HELVETIA RANCH ANNEX - W/2 W/2 NW/4 SE/4 10.00 AC SEC 23-18-15 |
10 |
| 4 |
305580360 |
HELVETIA RANCH ANNEX - E2 W2 NW4 SE4 10.00 AC SEC 23-18-15 |
10 |
| 5 |
305580370 |
HELVETIA RANCH ANNEX - NW4 SE4 EXC W2 THEREOF 20.00 AC SEC 23-18-15 EXC MINERAL RIGHTS |
20 |
| 6 |
305580420 |
HELVETIA RANCH ANNEX - SW4 SW4 40.00 AC SEC 23-18-15 |
40 |
| 7 |
30553002D |
HELVETIA RANCH ANNEX NORTH - N2 NW4 NW4 20 AC SEC 10-18-15 |
20 |
| 8 |
30553002F |
HELVETIA RANCH ANNEX NORTH - LOT 4 & NW4 SW4 & SW4 NW4 120 AC SEC 10-18-15 |
120 |
| 9 |
30553002G |
HELVETIA RANCH ANNEX NORTH - PTN N2 & NE4 SW4 & N2 N2 LOT 3 310 AC SEC 10-18-15 |
310 |
| 10 |
30553002H |
HELVETIA RANCH ANNEX - LOT 3 EXC N2 N2 & LOTS 1 & 2 108.42 AC SEC 10-18-15 |
108.42 |
| 11 |
30553004D |
HELVETIA RANCH ANNEX - NE4 NW4 40.00 AC SEC 27-18-15 |
40 |
| 12 |
30553004H |
HELVETIA RANCH ANNEX - NE4 NE4 40.00 AC SEC 27-18-15 |
40 |
| 13 |
30556001B |
HELVETIA RANCH ANNEX - LOTS 3 & 4 & S2 OF NW4 & SW4 313.11 AC SEC 15-18-15 |
313.11 |
| 14 |
30556001C |
HELVETIA RANCH ANNEX - LOTS 1 & 2 67.80 AC SEC 15-18-15 |
67.8 |
| 15 |
30557004B |
HELVETIA RANCH ANNEX - W2 NE4 SW4 NE4 5.00 AC SEC 22-18-15 |
5 |
| 16 |
30557004C |
HELVETIA RANCH ANNEX - S2 SW4 NE4 & GLO LOT 5 52.48 AC SEC 22-18-15 |
52.48 |
| 17 |
30557004D |
HELVETIA RANCH - NW4 SW4 NE4 10.00 AC SEC 22-18-15 |
10 |
| 18 |
30557005B |
HELVETIA RANCH ANNEX - E2 SE4 NW4 20 AC SEC 22-18-15 |
20 |
| 19 |
30557013B |
HELVETIA RANCH ANNEX - NW4 SW4 EXC W2 NW4 THEREOF 35.00 AC SEC 22-18-15 |
35 |
| 20 |
30557013C |
HELVETIA RANCH ANNEX - SW4 SW4 40.00 AC SEC 22-18-15 |
40 |
| 21 |
30557013D |
HELVETIA RANCH ANNEX - W2 NE4 SW4 20 AC SEC 22-18-15 |
20 |
| 22 |
30557013E |
HELVETIA RANCH ANNEX - W2 NW4 SE4 & E2 NE4 SW4 40 AC SEC 22-18-15 |
40 |
| 23 |
30557022C |
HELVETIA RANCH ANNEX - NE4 SE4 40.00 AC SEC 22-18-15 (EXC MINERAL RIGHTS) |
40 |
| 24 |
30558034C |
HELVETIA RANCH ANNEX (PIPELINE TRIANGLE) NLY PTN Lot 3 2.19 AC SEC 23-18-15 |
2.19 |
| 25 |
30562006B* |
ROSEMONT RANCH - NE4 SW4 EXC PTN LYG WITHIN HWY-83 34.12 AC SEC 14-18-16 |
34.12 |
| 26 |
30562007D* |
ROSEMONT RANCH - SW4 SE4 40.00 AC SEC 15-18-16 |
40 |
| 27 |
30562007F* |
ROSEMONT RANCH - NW4 SE4 40.00 AC SEC 15-18-16 |
40 |
| 28 |
30562007G* |
ROSEMONT RANCH - E2 SE4 EXC PTN LYG WITHIN HWY-83 70.59 AC SEC 15-18-16 |
70.59 |
| 29 |
30562007H* |
ROSEMONT RANCH - N2 E2 160 AC SEC 15-18-16 |
160 |
| 30 |
30562008C |
HIDDEN VALLE - NELY PTN NE4 60.15 AC SEC 21-18-16 |
60.15 |
| 31 |
30562008F |
HIDDEN VALLEY - NW4 NE4 EXC W660.84' E1090.84' S330' THEREOF 35.06 AC SEC 21-18-16 |
35.06 |
| 32 |
30562008G |
HIDDEN VALLEY - W660.84' E1090.84' S330' NW4 NE4 5.01 AC SEC 21-18-16 |
5.01 |
| 33 |
30562008H |
HIDDEN VALLEY - SWLY PTN NE4 EXC W1161.94' 24.88 AC SEC 21-18-16 |
24.88 |
| 34 |
30562008J |
HIDDEN VALLEY - W1161.94' SWLY PT NE4 SEC 21-18-16 35.27 AC |
35.27 |
| 35 |
30591021B |
DAVIDSON CANYON - PTN S2 N2 LYG E OF SONOITA HWY 17.98 AC SEC 1-18-16 AKA LOT 21 EXC E 713.50' SONOITA HILLS |
17.98 |
| 36 |
30591020B |
DAVIDSON CANYON - IRR CENT PTN BNG PT OF LOT 20 OF SONOITA HILLS R/S 2/53 1.440 AC SEC1 18-16 |
14.4 |
| 37 |
30562009A* |
ROSEMONT RANCH - SE4 160 AC SEC 23-18-16 |
160 |
| 38 |
30562011A* |
ROSEMONT RANCH - SE4 SE4 40 AC SEC 27-18-16 |
40 |
| 39 |
30562012A* |
ROSEMONT RANCH - SE4 NW4 SW4 & SW4 NE4 SW4 SEC 32-18-16 20.00 AC |
20 |
| 40 |
30562012C* |
ROSEMONT RANCH - E2 NW4 & SW4 NW4 & N2 N2 SW4 & SW4 NW4 SW4 & SE4 NE4 SW4 180 AC SEC 32-18-16 |
180 |
| 41 |
305570120 |
HELVETIA RANCH ANNEX - PTN W2 NW4 NW4 SW4 5.00 AC SEC 22-18-15 |
5 |
| 42 |
305570030 |
HELVETIA NORTH ANNEX - E2 NE4 SW4 NE4 5.00 AC SEC 22-18-15 |
5 |
| 43 |
30553003B |
HELVETIA RANCH ANNEX - E2 E2 NW4 NW4 10 AC SEC 26-18-15 22250 S Santa Rita Road (EXCLUDING MINERAL RIGHTS) |
10 |
| 44 |
30557019D |
HELVETIA RANCH ANNEX - SW4 SE4 SE4 & ELY PTN SE4 SW4 SE4 12.33 AC SEC 22-18-15 |
12.33 |
| 45 |
30553003E |
HELVETIA RANCH ANNEX - W2 NW4 NW4 20 AC SEC 26-18-15 |
20 |
| 46 |
30557022F |
HELVETIA RANCH ANNEX - E2 SE4 SE4 20.00 AC SEC 22-18-15 |
20 |
| 47 |
305380160 |
STONE SPRINGS - LOTS 1 2 5 7 8 & EXC PTNS OF LOTS 5 7 & 8 - 167.67 AC SEC 35-17-15 |
167.67 |
| 48 |
30553001C |
STONE SPRINGS - SW4 160 AC SEC 2-18-15 |
160 |
| 49 |
30553001B |
STONE SPRINGS - NW4 159.66 AC SEC 2-18-15 |
159.66 |
| 50 |
305570090 |
HELVETIA RANCH ANNEX - N2 NE4 SW2 NW2 5.00 AC SEC 22-18-15 |
5 |
| 51 |
305570110 |
HELVETIA RANCH ANNEX - SW4 SW4 NW4 10.00 AC SEC 22-18-15 |
10 |
| 52 |
305530160 |
ARIZONA STATE LAND DEPARTMENT - proposed purchase by auction in 2023 160 AC NW4 SEC11-18-15 |
160 |
| COPPER WORLD, INC. FEE OWNED (ASSOCIATED) PROPERTY- TOTAL ASSESSED ACREAGE |
3,086.20 |
| |
PARCEL NO. |
PROPERTY NAME/PARCEL DESCRIPTION |
ACRES |
| 1 |
305-53-003C |
SONORAN PROPERTY INVESTORS (SEDONA) |
10 |
| W2 E2 NW4 NW4 10.00 AC SEC 26-18-15 (EXC MINERAL RIGHTS) |
| 2 |
305-53-004C |
SONORAN PROPERTY INVESTORS (CHRISTIAN) |
20 |
| W2 NW4 NE4 20.00 AC SEC 27-18-15 (EXC MINERAL RIGHTS) |
| 3 |
305-53-004G |
SONORAN PROPERTY INVESTORS (VESTERDAL) |
10 |
| E2 E2 NW4 NW4 SEC 27-18-15 (EXC MINERAL RIGHTS) |
| 4 |
305-53-004J |
SONORAN PROPERTY INVESTORS (GANT FAMILY LIVING TRUST) |
20 |
| E2 NW4 NE4 SEC 27-18-15 (EXC MINERAL RIGHTS) |
| 5 |
305-53-004K |
SONORAN PROPERTY INVESTORS PROPERTY INVESTORS (EBENAL) |
4.98 |
| E309.57' of N700.10' W2 E2 NW4 NW4 SEC 27-18-15 (EXC MINERAL RIGHTS) |
| 6 |
305-53-004L |
SONORAN PROPERTY INVESTORS (BLANCO) |
4.98 |
| W2 E2 NW4 NW4 EXC E309.57' of N700.10' THEREOF sec 27-18- (EXC MINERAL RIGHTS) |
| 7 |
305-53-004M |
SONORAN PROPERTY INVESTORS (R&C LANSKY) |
15 |
| W2 NW4 NW4 EXC 4/14 THEREOF SEC 27-18-15 (EXC MINERAL RIGHTS) |
| 8 |
305-53-004N |
SONORAN PROPERTY INVESTORS (W&J LANSKY) |
5 |
| N1/4 W2 NW4 NW4 SEC 27-18-15 (EXC MINERAL RIGHTS) |
| 9 |
305-56-002A |
SONORAN PROPERTY INVESTORS (RUELAS) |
10.33 |
| N2 OF US PAT MINE HELVETIA DIST BULL DOCER AKA BULLDOZER 10.33 AC SEC 15-18-15 |
| 10 |
305-56-002B |
SONORAN PROPERTY INVESTORS (ULIBARRI) |
10.33 |
| S2 OF US PAT MINE HELVETIA DIST BULL DOCER AKA BULLDOZER 10.33 AC SEC 15-18-15 |
| 11 |
305-57-005C |
SONORAN PROPERTY INVESTORS (WORD) |
10 |
| N2 W2 SE4 NW4 SEC 22-18-15 |
| 12 |
305-57-005D |
SONORAN PROPERTY INVESTORS (NcNIEL) |
10 |
| S2 W2 SE4 NW4 22-18-15 |
| 13 |
305-57-007A |
SONORAN PROPERTY INVESTORS (VERSLUIS) |
5.03 |
| N661.17' E331.81' SW4 NW4 5.03 AC SEC 22-18-15 |
| 14 |
305-57-007B |
SONORAN PROPERTY INVESTORS (VILLASENOR) |
5.01 |
| S661.17' of E330.85' SW4 NW4 SEC 22-18-15 |
| 15 |
###-##-#### |
SONORAN PROPERTY INVESTORS (SIMON) |
10 |
| W2 E2 SW4 NW4 SEC 22-18-15 |
| 16 |
###-##-#### |
SONORAN PROPERTY INVESTORS (SHULTZ) |
10 |
| W2 W2 SE4 SW4 SEC 22 -18-15 |
| 17 |
###-##-#### |
SONORAN PROPERTY INVESTORS (PALLANES) |
10 |
| E2 W2 SE4 SW4 10.00 AC SEC 22-18-15 (EXC MINERAL RIGHTS) |
| 18 |
###-##-#### |
SONORAN PROPERTY INVESTORS (STERN) |
10 |
| W2 E2 SE4 SW4 10 AC SEC 22-18-15 |
| 19 |
###-##-#### |
SONORAN PROPERTY INVESTORS (BORING) |
15 |
| E2 E2 SE4 SW4 & W4 SW4 SE4 15 AC SEC 22-18-15 |
| 20 |
###-##-#### |
SONORAN PROPERTY INVESTORS (COPLEN) |
10 |
| E2 W2 W2 SW4 SE4 & W2 E2 SW4 SE4 22-18-15 |
| 21 |
305-57-019C |
SONORAN PROPERTY INVESTORS (PATTON) |
11.33 |
| PTN W711.34' E823.68' S790.70' SW4 SE4 11.33 AC SEC 22-18-15 |
| 22 |
305-57-019E |
SONORAN PROPERTY INVESTORS (MIDDLETON EQUITY TRUST) |
11.33 |
| NLY PTN SW4 SE4 SEC22-18-15 |
| 23 |
305-57-022G |
SONORAN PROPERTY INVESTORS (MENDEZ) |
10 |
| NW4 SE4 SE4 10.00 AC SEC 22-18-15 |
| 24 |
305-57-022H |
SONORAN PROPERTY INVESTORS (PRESSNALL) |
20 |
| E2 NW4 SE4 20 AC SEC 22-18-15 |
| 25 |
305-58-006J |
SONORAN PROPERTY INVESTORS (DIETZMAN) |
5 |
| N264' W825' NE4 SW4 5AC SEC 23-18-15 (EXC MINERAL RIGHTS) |
| 26 |
###-##-#### |
SONORAN PROPERTY INVESTORS (DIETZMAN) |
15.76 |
| Lot 2 SEC 23-18-15 |
| 27 |
305-58-034D |
SONORAN PROPERTY INVESTORS (PRESSNALL) |
20.45 |
| SW PTN NE4 SW4 & N30' W2 SE4 SW4 23-18-15 (EXC MINERAL RIGHTS) |
| 28 |
305-58-034E |
SONORAN PROPERTY INVESTORS (PRESSNALL) |
35.69 |
| SLY PTN LOT 3 & ELY PTN NE4 SW4 SEC 23-18-15 |
| 29 |
305-58-038A |
SONORAN PROPERTY INVESTORS (PRESSNALL) |
40 |
| NE4 SE4 40 AC SEC 23-18-15 (EXC MINERAL RIGHTS) |
| SONORAN PROPERTY INVESTORS LLC - FEE OWNED (ASSOCIATED) PROPERTY - TOTAL ACREAGE |
375.22 |
| ALL FEE OWNED (ASSOCIATED) PROPERTY - TOTAL ACREAGE |
3461.42 |
*Rights in Mineral Interests & Terms and Conditions as may be contained in deed & instruments. (Recorded in Docket 3413, Pages 362 & 369, Pima County, AZ [as assigned])
Hudbay has also acquired 14 parcels of fee (private) land and 1 parcel of leased land that are more distal from the Project area which are planned for infrastructure purposes including well fields, pump stations, and utilities (the "Distal Fee Lands"). The Distal Fee Lands constitute an additional approximately 183 acres (74 hectares) and are detailed in Table 4-4.
TABLE 4-4: FEE OWNED & LEASED PROPERTIES - DESCRIPTION & LOCATION
| FEE OWNED & LEASED (ASSOCIATED BUT DISTAL) PROPERTY - BY PIMA COUNTY TAX PARCEL NO. |
| |
PARCEL NO. |
PARCEL DESCRIPTION |
ACRES |
ROYALTY INTEREST |
| 1 |
303601410 |
SANRITA WEST |
53.5 |
|
| SLY PTN NW4 53.50 AC SEC 17-17-14 |
|
| 2 |
30354005B |
SANRITA SOUTH |
19.55 |
ANNE SCALESE TRUST, 5% NET PROFITS INTEREST (METALS) ROYALTY Recorded as Seq. No. 20110420776, Pima County, AZ |
| E/2 SW/4 SE/4 EXC S30' FOR RD 19.55 AC SEC 29-17-14 |
| 3 |
30363013C |
SANRITA EAST |
16.93 |
|
| S723.30' E2 NE4 EXC N292' E487.53' & EXC RDS 16.93 AC SEC 21-17-14 |
|
| 4 |
30363013D |
SANRITA EAST |
3 |
|
| N292' S723.30' W447.53' E487.53' E2 NE4 3.00 AC SEC 21-17-14 |
|
| 5 |
30365003C |
WILMOT JUNCTION |
15 |
|
| E2 SW4 SE4 EXC E165' M/L 15.00 AC SEC 24-17-14 |
|
| 6 |
30365003E |
WILMOT JUNCTION |
20.91 |
|
| E720' SE4 SE4 EXC N60' THEREOF 20.91 AC SEC 24-17-14 |
|
| 7 |
30365003F |
WILMOT JUNCTION |
23.18 |
|
| E165' SW4 SE4 & SE4 SE4 EXC 720' THEREOF 23.18 AC SEC 24-17-14 |
|
| 8 |
30365004A |
WILMOT JUNCTION |
20.91 |
|
| E2 NE4 SE4 & N60' E2 SE4 SE4 20.91 AC SEC 24-17-14 |
|
| 9 |
30353008D |
OLD NOGALES TRIANGLE |
4.38 |
|
| PTN E250' N1043.77' NE4 NE4 4.38 AC SEC 36-17-13 |
|
| 10 |
30367001E |
OLD NOGALES TRIANGLE |
1.16 |
|
| N318.87' LOT 1 LYG W HWY 1.16 AC SEC 31-17-14 |
|
| 11 |
30367001F |
OLD NOGALES TRIANGLE |
1.28 |
|
| THAT PT OF LOT 1 LYG W OF HWY EXC N465.5' &S277' THEREFROM 1.28 AC SEC 31-17-14 |
|
| 12 |
30367002G |
OLD NOGALES TRIANGLE |
0.26 |
|
| PT OF LOT 2 LYG W OF HWY .26 AC SEC 31-17-14 |
|
| 13 |
30367003B |
OLD NOGALES TRIANGLE |
0.47 |
|
| S146.68' OF N465.55' OF THAT PTN OF LOT 1 LYG W OF HWY .47 AC SEC 31-17-14 |
|
| 14 |
30367004B |
OLD NOGALES TRIANGLE |
0.25 |
|
| N217' S277' LOT 1 LYG W OF HWY .25 AC SEC 31-17-14 |
|
| COPPER WORLD, INC. - FEE OWNED (DISTAL) TOTAL |
180.78 |
|
| 1 |
LEASED PARCEL 30367002H |
OWNER: VULCAN MATERIALS. LEASED PORTION IS 38.70 AC OUT OF: NW4 LYG ELY OF RR EXC TUC-NOGALES HWY 129.58 AC SEC 31-17-14 |
38.7 |
|
| |
| COPPER WORLD, INC. - FEE LEASED (DISTAL) TOTALS |
38.7 |
|
The Patented Claims are considered private lands that provide the owner with both surface and mineral rights. The Patented Claims, including the core of the mineral resource, are monumented in the field by surveyed brass caps on short pipes cemented into the ground. The Associated Fee Lands have been legally acquired by instruments recorded in the Pima County Recorder's Office which describe the location of the land and ownership is insured with Policies of Title Insurance. The Patented Claims and Associated Fee Lands are subject to annual property taxes currently amounting to approximately $79,412/year.
Rights to the mineral interest on USFS and BLM lands have been vested to Copper World, Inc. via the location and maintenance of the Unpatented Claims that surround the Patented Claims. Notices of Location of the Unpatented Claims have been posted on the claims and recorded at the BLM and with the Pima County Recorder's Office as required by state and federal law. Wooden posts and stone cairns mark the location of the unpatented mining claim corners, end lines and discovery monuments, all of which have been surveyed. Wooden posts mark the location of the unpatented mill site corners and location monuments, all of which have been surveyed. The Unpatented Claims are maintained on BLM and USFS land through the payment of annual maintenance fees currently set at $165.00 per claim, for a total of approximately $307,890.00, payable annually to the BLM on or before September 1st of each year.
The rights-of-way over Arizona State Land are all non-exclusive but grant Hudbay the rights required to construct certain utility infrastructure connecting the well field and power supply to the Project. Two of these rights-of-way have a term of 10 years while the other four have a term of 50 years. These rights-of-way across Arizona State Land are not shown in Figure 4-1, but generally run northwest from the Project along Santa Rita Road towards the Town of Sahuarita. Additionally, Hudbay has obtained a 30-year right-of-way from the Arizona State Land Department providing access between its private properties in Section 22 and in Section 15, all in Township 18 South, Range 15 East, which is shown in Figure 4-1.
There is a 3% NSR royalty on all 132 Patented Claims, 603 of the Unpatented Claims, and 1 parcel of the Associated Fee Lands consisting of approximately 180 acres (73 hectares). In the original royalty deeds, a 1.5% NSR is reserved to each of (1) Dennis Lauderbach et. Ux. and (2) Pioneer Trust Company of Arizona, as Trustee under Trust No. 11778. Precious metals production from the Project is subject to a stream agreement with Wheaton Precious Metals (Wheaton). Under the stream agreement, Hudbay is entitled to receive a deposit payment of $230 million against delivery of 92.5% of the gold and silver that is produced from the Project and sold to third-party purchasers. Given certain ambiguities in the contract arising from the change in the development plan for the Project since the 2017 Feasibility Study, Hudbay and Wheaton have commenced discussions regarding a possible restructuring of the stream agreement based upon the new mine plan and processing plant design. The PFS presented in this Technical Report assumes an upfront deposit of $230 million in Project construction in exchange for the delivery of 100% of gold and silver produced, at a fixed price of $450/oz and $3.90/oz respectively, subject to a 1% per annum contracted escalator beginning in the 4th year of production.
Hudbay's ownership in the Project was subject to an earn-in agreement and joint venture agreement dated September 16, 2010, between Copper World, Inc., and United Copper & Moly LLC (''UCM''), pursuant to which UCM had earned a 7.95% interest and could have earn up to a 20% joint venture interest in the Project. Subsequently, all the interest of UCM was purchased by Hudbay under the Acquisition Agreement dated April 25, 2019. The Project is currently held directly by Copper World, Inc., and indirect wholly owned subsidiary of Hudbay.
The permits that are expected to be required to conduct the operations proposed for the Project are described in Section 20.
Other than as disclosed in this Technical Report, there are no known environmental liabilities or significant factors or risks that may affect access, title, or the right or ability to perform the work on land associated with the Project.
5 ACCESSIBILITY, CLIMATE, LOCAL RESOURCES, INFRASTRUCTURE, & PHYSIOGRAPHY
5.1 ACCESSIBILITY
The Project is in Pima County, Arizona, approximately 28 miles (45 km) southeast of Tucson. The main access to the Project site is from Tucson by travelling to the town of Sahuarita via the Tucson-Nogales highway (I-19) for about 20 miles (32 km), and then east along Sahuarita Road to Santa Rita Road. Santa Rita Road becomes an unpaved access road that connects with the Copper World plant site (Figure 5-1).
FIGURE 5-1: PROJECT PROPERTY LOCATION

5.2 CLIMATE
The southern Arizona climate is typical of a semi-arid continental desert with hot summers and temperate winters. The Project area topography ranges from flat to mountainous, with the flanks of the Santa Rita mountains to the northeast and northwest. Surface elevation ranges from about 4,265 to 6,280 feet (1,300 to 1,914 m) above mean sea level (amsl).
Summer daily high temperatures are above 90°F (32°C) with significant cooling at night. Winter is typically drier, with mild daytime and overnight temperatures typically above freezing. Winter can have occasional low-intensity rainstorms and light snowfall patterns that can last for several days.
The average annual precipitation in the Project area is approximately 20 inches (50 cm) based on historical data from eight meteorological stations within a 30-mile (48 km) radius of the Project area. More than half of the annual precipitation occurs during the monsoon season, which lasts from July through to September. The monsoon season is characterized by afternoon thunderstorms typically of short duration, but with high-intensity rainfall that can have minor effects on a mining operation. The lowest precipitation months are April to June.
As with Hudbay's other operations, the Project is subject to the physical risks of climate change which may arise in the future and could include more frequent extreme weather events, such as extreme dry heat, increased frequency of storms, and reduced water availability. For further information regarding such risks, please see Hudbay's most recent annual information form and management's discussion and analysis available on its SEDAR+ and EDGAR profiles.
5.3 LOCAL RESOURCES
The largest city near the Project area is Tucson, with a population of 542,629 based on data from the 2020 United States Census. The Tucson Metropolitan Area has a population of over one million.
Arizona is responsible for approximately 66% of the copper production in the USA, and Tucson is a mining industry hub with nine operating copper mines within a 125 miles (200 km) radius. The cultural and educational facilities provided in the Tucson Metropolitan Area attract experienced technical staff into the area. The Tucson Metropolitan Area is home to a well-established base of contractors and service providers for the mining industry.
5.4 INFRASTRUCTURE
The state and interstate highway systems allow access to the Project site for all major truck deliveries. Much of the labor and supplies for construction and operations can come from the surrounding areas in Pima, Cochise, and Santa Cruz Counties.
The Union Pacific mainline east-west railroad route passes through Tucson, Arizona and generally follows the I-10. The Port of Tucson has rail access from the Union Pacific mainline, consisting of a 2-mile (3.2 km) siding, complemented by an additional 3,000-foot (914 m) siding.
The Tucson International Airport ("TIA") is located approximately 30 miles (48 km) travel distance from the Project site and near Interstate highways I-10 and I-19. TIA provides international air passenger and air freight services to businesses in the area, with seven airlines currently providing nonstop service to 15 destinations, and connections worldwide.
The power to the Project will be supplied by Tucson Electric Power (TEP) under a shared service agreement with Trico Electric Cooperative Inc. (TRICO). Since the electrical load for the mining and process operations will be within both the TEP and TRICO service territories, a joint venture business arrangement is expected to be established between both companies to compensate each service provider appropriately, with review and approval by the Arizona Corporation Commission (ACC). Currently, Trico services the Helvetia Site Office with a distribution line that runs through the property. A new transmission line will be built to bring power to site and service the Project. For further description see Section 18.
5.5 PHYSIOGRAPHY
The Project is located within the northern portion of the Santa Rita Mountains in the Basin and Range Physiographic Province of the southwestern United States. The province is characterized by high mountain ranges adjacent to alluvial-filled basins. The Basin and Range province has been further divided into the Mexican Highlands and Sonoran Desert sub-provinces. The Santa Rita Mountains form the boundary between the Mexican Highlands of southeastern Arizona and the Sonoran Desert sub-province to the West.
The Project occupies relatively flat to mountainous topography on the northeastern and northwestern flanks of the Santa Rita Mountains. The Santa Rita Mountains separate the Cienega Basin to the east from the Santa Cruz Basin to the west.
Vegetation in the Project area reflects the climate of the lower slopes of the Santa Rita Mountains. This area covers three main vegetation communities: the Desert (Scrub) Grasslands, the Desert and Semi-Desert Grasslands, and the Oak, Juniper, Pinyon Community. As the elevation increases in the Project area, vegetation density also increases and transitions into semi-desert grassland that supports abundant catclaw acacia, and mimosa, ocotillo, and yucca.
6 HISTORY
The early history and production from the Property has been described in (Anzalone, 1995), (M3 Engineering and Technology Corporation, 2012), (Briggs, 2014), and (Briggs, 2020) from which the following summarization is taken. Hudbay considers the mineral reserve and resource estimates referred to in this section (including the estimates prepared by Augusta) to be historical in nature since no work was done by a qualified person to verify such estimates and such estimates should not be relied upon.
6.1 HELVETIA-ROSEMONT MINING DISTRICT (1875-1973)
The first recorded mining activity in the Helvetia-Rosemont mining district occurred in 1875. The Helvetia-Rosemont mining district was officially established in 1878. Production from mines on both sides of the Santa Rita ridgeline supported the construction and operation of the Columbia Smelter in Helvetia and the Rosemont Smelter in Old Rosemont (Figure 6-1).
FIGURE 6-1: LOCATION OF HISTORICAL MINE IN THE HELVETIA-ROSEMONT MINING DISTRICT

Copper production from the district ceased in 1961 after production of about 438,000 tons (397,000 tonnes) of ore containing 36,766,000 pounds (16,676,777 kg) of copper, 1,130,000 pounds (512,559 kg) of zinc and 361,600 ounces of silver (Table 6-1).
TABLE 6-1: PRODUCTION HISTORY OF THE HELVETIA-ROSEMONT DISTRICT 1875-1969
AFTER (BRIGGS, 2020)
| Mine Name |
Years |
Ore Treated Tons |
Copper lbs. |
Lead lbs. |
Zinc lbs. |
Gold
(Troy oz) |
Silver
(Troy oz) |
| Bulldozer |
1882 - 1960 |
6,700 |
613,000 |
0 |
0 |
8 |
6,450 |
| Copper World |
1900 - 1960 |
17,400 |
1,777,000 |
0 |
0 |
49 |
15,530 |
| Elgin |
1901 - 1960 |
90,900 |
4,267,000 |
0 |
0 |
555 |
33,050 |
| King-Exile |
1913 - 1959 |
69,600 |
8,158,000 |
66,000 |
376,700 |
33 |
93,060 |
| Leader |
1885 - 1944 |
35,100 |
3,720,000 |
0 |
0 |
154 |
34,740 |
| Mohawk |
1885 - 1948 |
36,600 |
2,676,000 |
3,000 |
28,020 |
32 |
7,330 |
| Narragansett-Daylight |
1907 - 1961 |
97,100 |
8,441,000 |
143,000 |
254,800 |
59 |
63,470 |
| Old Dick |
1940 - 1952 |
12,000 |
893,000 |
0 |
0 |
88 |
7,730 |
| Omega |
1875 - 1920 |
6,700 |
718,000 |
42,000 |
0 |
0 |
7,990 |
| Peach |
1916 - 1952 |
11,100 |
1,175,000 |
4,000 |
460,190 |
2 |
8,940 |
| Tip Top |
1899 - 1956 |
27,400 |
2,766,000 |
0 |
0 |
6 |
11,190 |
| Other Producers (22) |
1881 - 1969 |
26,700 |
1,572,000 |
113,000 |
8,790 |
283 |
72,110 |
| District Total |
1875 - 1969 |
438,000 |
36,776,000 |
372,000 |
1,130,000 |
1269 |
361,600 |
By the late 1950s, the Banner Mining Company (Banner) had acquired most of the claims in the area and had drilled the discovery hole into the East deposit. In 1963, the Anaconda Mining Co. acquired options to lease the Banner holdings and over the next ten years they drilled 113 holes on both sides of the mountain. The exploration program demonstrated that a large-scale porphyry/skarn existed at the East deposit. Regional exploration also identified targets at the Broadtop Butte and Peach-Elgin prospects. In 1964, Anaconda produced a historical resource estimate for the Peach-Elgin deposit located in the Helvetia District. Based on assays from 67 churn and diamond drill holes, the estimate identified 14 million tons (12 million tonnes) of sulfide material averaging 0.78% copper and 10 million tons (9 million tonnes) of oxide material averaging 0.72% copper.
6.2 ANAMAX MINING COMPANY (1973-1985)
In 1973, Anaconda Mining Co. and Amax Inc. formed a 50/50 partnership to form the Anamax Mining Co. In 1977, following years of drilling and evaluation, the Anamax joint venture commissioned the mining consulting firm of Pincock, Allen & Holt, Inc. to estimate a resource for the East deposit. Their historical resource estimate of about 445 million tons (403 million tonnes) of sulfide mineralization averaged 0.54% copper, using a cut-off grade of 0.20% copper. In addition to the sulfide material, 69 million tons (62.5 million tonnes) of oxide mineralization averaging 0.45% copper was estimated. Subsequent engineering designed a pit based on 40,000 tons/day (36,300 tonnes/day) production rate for a mine life of 20 years.
In 1979, Anamax carried out a resource estimate for the Broadtop Butte deposit located about one mile north of the East deposit. Based on assays from 18 widely spaced diamond drill holes, a historical estimate identified 9 million tons (8 million tonnes) averaging 0.77% copper and 0.037% molybdenum. In 1985, Anamax ceased operations and liquidated their assets. Today, most of the Anaconda/Anamax core is currently stored at Hidden Valley core storage facility at the Project site.
6.3 ASARCO INCORPORATED (1988-2004)
Asarco purchased the patented and unpatented mining claims in the Helvetia-Rosemont mining district from real estate interests in August 1988, renewed exploration of the Peach-Elgin deposit, and initiated engineering studies on the East deposit. In 1995, Asarco succeeded in acquiring patents on 21 mining claims in the Rosemont area just prior to the moratorium placed on patented mining claims in 1996.
In 1999, Grupo Mexico acquired the Helvetia-Rosemont property through a merger with Asarco. During the 16 years of ownership by Asarco and Grupo Mexico, 11 diamond drill holes were completed. Asarco estimated historical reserves of 294,834,000 tons (267,468,905 tonnes) at 0.673% copper based on a mine production schedule with a strip ratio of 3.7:1. In 2004, Grupo Mexico sold the property to a Tucson developer.
6.4 AUGUSTA RESOURCE CORPORATION (2005-2014)
In April 2005, Augusta purchased the property from Triangle Ventures LLC. Between mid-2005 and January 2007, Augusta drilled 55 diamond drill holes to bring the resource estimate into compliance with NI 43-101 standards. The program was designed to better define the geology, distribution of copper mineralization, as well as gather geotechnical data required for mine design. In June 2006, the Washington Group Int. completed a preliminary assessment and economic evaluation of the Project.
Over the next several years, Augusta continued to evaluate the mineral potential and refine the economics of developing this resource. 32 additional drill holes were drilled between 2007 and 2012 and a Technical Report was issued by Augusta in 2012 to support mineral resource and mineral reserve estimates. Augusta's mineral resource estimates are summarized in Table 6-2.
TABLE 6-2: EAST DEPOSIT HISTORICAL MINERAL RESOURCE ESTIMATES
(AUGUSTA RESOURCE CORP., 2012)
| Category |
Tons (Millions) |
Cu (%) |
Mo (%) |
Ag (oz/ton) |
| Measured |
334.619 |
0.440 |
0.015 |
0.124 |
| Indicated |
534.735 |
0.373 |
0.014 |
0.105 |
| Inferred |
128.488 |
0.397 |
0.013 |
0.104 |
6.5 HUDBAY (2014-PRESENT)
Following the acquisition of the Project, Hudbay added 89 drill holes between September 2014 and November 2015 in further efforts to gain a better understanding of the geological setting and mineralization of the East deposit, and to collect additional metallurgical and geotechnical information.
Drilling conducted by Hudbay was used in combination with previous drilling campaigns to build resource models that supported a Feasibility Study completed and documented in the 2017 Technical Report. The 2017 Technical Report included an estimate of the mineral reserves and mineral resources at the East deposit that is now considered to be a historical estimate for purposes of NI 43-101 (Table 6-3). The historical estimate is no longer current and should not be relied upon, as it has been superseded by the new mine plan and the current estimate of mineral resources presented in this PFS.
TABLE 6-3: HISTORICAL MINERAL RESERVE & MINERAL RESOURCE ESTIMATE FOR THE STAND-ALONE EAST PROJECT

Hudbay initiated exploration drilling on targets north and west of the East deposit in October 2020. Drilling started proximal to the historical mines, near historically drill-identified targets, and in areas exhibiting significant indication of copper oxide mineralization on surface. Several holes were also drilled for condemnation purposes. Drilling by Hudbay continued through December of 2022.
A total of 614 holes drilled by Hudbay and previous owners over the Copper World Project area have intersected copper mineralization and were used to estimate initial mineral resource estimates for the Copper World deposits in May 2022.
TABLE 6-4: HISTORICAL MINERAL RESERVE & MINERAL RESOURCE ESTIMATE
FROM THE 2022 PEA

7 GEOLOGICAL SETTING & MINERALIZATION
7.1 REGIONAL GEOLOGY
The Project deposits are in the Laramide belt, a major porphyry province that extends for approximately 600 miles (965 km) from Arizona to Sinaloa, Mexico (Figure 7-1) and includes several other world class deposits (e.g., Morenci, Resolution, and Cananea). Mesozoic subduction and associated magmatism and tectonism in the southwestern United States and northern Mexico generated extensive and relevant porphyry copper mineralization. Compressional tectonism during the Mesozoic and early Cenozoic Laramide Orogeny caused folding and thrusting, accompanied by extensive calc-alkaline magmatism (Barra, 2005). Tertiary extensional tectonism followed the Laramide Orogeny, accompanied by voluminous felsic volcanism (Barra et al., 2005). Tertiary faulting juxtaposed mineralized and unmineralized rocks. The extensional tectonics culminated in the large-scale block faulting that produced the present basin and range geomorphology that is typical throughout southern Arizona (Maher, 2008).
FIGURE 7-1: LARAMIDE BELT & ASSOCIATED PORPHYRY COPPER MINERALIZATION
(BARRA, 2005)

7.2 DISTRICT GEOLOGY
The Project deposits sit within the northern block of the Santa Rita Mountains in southern Arizona (Figure 7-2). As reviewed by Ramussen et al. (2012), the northern block is dominated by Precambrian granite (brown on the map), with slices of Paleozoic and Mesozoic sediments on the eastern and northern sides (blue, green, and yellow on the map). This block includes small stocks and dikes of quartz monzonite or quartz latite porphyry that are related to porphyry copper and skarn mineralization; and broader, more equigranular, Tertiary, granitic intrusive stocks. Tertiary faulting appears to have significantly segmented the original stratigraphy and deposits, juxtaposing mineralized and unmineralized rocks.
FIGURE 7-2: PROJECT REGIONAL GEOLOGY

7.3 DEPOSIT GEOLOGY
Since 2014, Hudbay's drilling programs have included complete ICP (inductively coupled plasma) multi-element assays for every sample. This extensive database was used to classify the different stratigraphic units according to their geochemical affinities. The original formations were grouped into equivalent chemostratigraphic units that reflect chemical changes induced by mixing of siliciclastic, dolomitic, and calcareous sediments as well as a hydrothermal component. The chemostratigraphic groups honor both the deposit stratigraphy and geochemical attributes and ultimately reflect the mineralogy as illustrated on a cross-section through the East deposit (Figure 7-3).
FIGURE 7-3: EAST DEPOSIT - VERTICAL GEOLOGICAL SECTION
11,555,050' N, LOOKING NORTH

The predominantly carbonate Paleozoic units are the main host rocks for the copper mineralization in the district excluding the Broadtop Butte and Elgin deposits. At the East deposit, Mesozoic clastic units structurally overlie the Paleozoic sequence; in contrast the Paleozoic sequence in all other Copper World Deposits are generally exposed or near surface. Quartz monzonite porphyries are the predominant host of copper mineralization at Broadtop Butte and Elgin (Figure 7-4 and Figure 7-5).
FIGURE 7-4: PEACH-ELGIN DEPOSIT - VERTICAL GEOLOGICAL SECTION (SIMPLIFIED)
11,656,200' N, LOOKING NORTH

FIGURE 7-5: BROADTOP BUTTE DEPOSIT - VERTICAL GEOLOGICAL SECTION
11,562,000' N, LOOKING NORTH

7.4 ALTERATION
The Project deposits consist of copper-molybdenum-silver-gold mineralization primarily hosted in skarn. Skarn formed in the Paleozoic rocks from mineralizing fluids related to the intrusion of quartz latite to quartz monzonite porphyry intrusions. The quartz monzonite porphyries are the major hosts of mineralization in the Elgin and Broadtop Butte Deposits. Bornite-chalcopyrite-molybdenite mineralization occurs as veinlets and disseminations.
Garnet-diopside-wollastonite skarn, which formed in impure limestone, is the most important skarn type volumetrically. Diopside-serpentine skarn, which formed in dolomitic rocks is less significant. Marble was developed in the purest carbonate rocks, while the more siliceous, silty rocks were converted to hornfels; both marble and hornfels are relatively poor hosts to mineralization. The main skarn minerals can be accompanied by quartz, amphibole, magnetite, epidote, chlorite, and clay minerals. Quartz latite to quartz monzonite intrusive rocks host strong quartz-sericite-pyrite alteration with minor mineralization. Where the mineralized package of Paleozoic rocks and quartz latite intrusive outcrop on the western side of the deposit, near-surface weathering and oxidation has produced disseminated and fracture-controlled copper oxide minerals.
The Mesozoic and lesser Paleozoic rocks above the low angle fault at the East deposit show a propylitic alteration to an assemblage including epidote, chlorite, calcite, and pyrite; copper mineralization is irregularly developed. The rocks are commonly deeply weathered and limonitic. The original chalcopyrite is typically oxidized to chrysocolla, copper wad and copper carbonates; supergene chalcocite is locally present.
7.5 STRUCTURAL DOMAINS
The geological model incorporated structural framework based on a surface and downhole structural review. The temporal and special relations between the main fault surfaces define 5 structural domains at The Project: Backbone Footwall, Lower Plate, Upper Plate, Graben Block and the Helvetia Thrust klippe (Figure 7-4).;
FIGURE 7-6: PROJECT DEPOSIT GEOLOGIC MODEL STRUCTURAL DOMAINS & MAJOR LITHOLOGIES
PLAN VIEW

The north trending, steeply dipping Backbone Fault juxtaposes Precambrian granodiorite and Lower Paleozoic quartzite and limestone to the west (Backbone Footwall block) against a block of an homoclinical sequence of younger, mineralized, metamorphosed sedimentary units to the east (Lower Plate). A series of subparallel, anastomosing, curviplanar faults that generally strike north and dip steeply within the Lower Plate define a zone along the Backbone Fault strike.
The Backbone Fault generally strikes north-south at the East deposit and continues north, slightly east of the ridgeline, crossing to the west side of the ridgeline west of Broadtop Butte. The Lower Paleozoic quartzite (Bolsa Formation) and limestone (Abrigo and Martin Formations) are well mineralized in the Backbone Footwall within the Bolsa Deposit. North of Broadtop Butte, the Backbone Fault shifts to a more north-northwestwardly strike and constitutes the controlling feature of the mineralization at the West deposit.
The Low Angle Faults at the East deposit are a series of shallowly east-dipping faults that are comprised of one major fault and a series of steep to shallow splay structures. The main Low Angle Fault forms the non-conformable contact between the Upper Plate (siliciclastics and volcanics) and the Lower Plate (carbonate dominant, Paleozoic rocks) structural domains at the East Deposit.
The Graben Fault is a significant, late, high-angle fault at the very southeastern margin of the East Deposit which appears to truncate mineralization. No significant mineralized domains exist inside the Graben fault Hanging Wall.
Within the Upper Plate Domain, approximately a mile north of the East Deposit and immediately East of Gunsight Pass, a mass of quartz-monzonite porphyry comprises the core of the Broadtop Butte Deposit. Within Broadtop Butte, a generally east-northeast breccia pipe sits along the southern margin of the quartz monzonite porphyry, varying from a monomictic breccia of quartz monzonite porphyry in a quartz matrix, to a less abundant, polymictic breccia like above, but with skarn and limestone clasts.
The fifth major structural domain, the Helvetia Thrust Klippe, is on the western slope of the Santa Rita Mountains. The low-angle Helvetia Thrust Fault places Laramide-aged quartz monzonite porphyry, intruded Paleozoic-aged carbonate, and clastic sequences atop intrusive equigranular to seriate granitic rocks. The Helvetia Thrust hanging wall hosts the Peach, Elgin, Old Dick, Mohawk, and Heavy Weight historical mines. A north-striking, high angle fault occurs between the sedimentary hosted Peach Deposit on the west side, and the quartz monzonite porphyry and skarn margin dominant Elgin deposit to the west. Although, mineralization does appear to occur in continuity across this fault.
FIGURE 7-7: EAST DEPOSIT GEOLOGICAL MODEL OF STRUCTURAL DOMAINS
3D VIEW, LOOKING NORTH

7.6 MINERALIZATION
Mineralization occurs as both copper -oxides and -sulfides in skarns and intrusive porphyry rock. A 3D model of five mineralization domains was completed based on analytical data, including the hole acid soluble data, and Quemscan analysis collected by Hudbay from the East, Bolsa, Broadtop Butte, West and Peach-Elgin deposits.
7.6.1 EAST DEPOSIT
The East deposit ranges between 3,400 to 5,600 feet (1,000 to 1,700 m) in diameter and extends to a depth of approximately 2,600 feet (790 m) below the surface. The main fault systems partially delimit copper mineralization, dividing the deposit into major structural blocks with contrasting intensities, and types of mineralization (Figure 7-7). The north-trending, steeply dipping Backbone Fault juxtaposes marginally mineralized Precambrian granodiorite and Lower Paleozoic quartzite and variably mineralized limestone to the west (Backbone Footwall Block), against a block of younger, well-mineralized, Paleozoic limestone units to the east (Lower Plate). The Graben Fault on the southeast side of the East Deposit truncates significant mineralization.
Oxidized copper mineralization is present in the upper portion of the deposit. The oxidized mineralization is primarily hosted in Mesozoic rocks but is also found in Paleozoic rocks on the west side of the deposit, and deeper along some faults. The oxidized mineralization occurs as mixed copper oxide and copper-carbonate minerals. Locally, enrichment of supergene chalcocite and associated secondary mineralization are found in and beneath the oxidized mineralization. Oxide copper in the northwest of the East deposit extends considerably at depth on fractures within the Backbone Footwall.
Primary (hypogene) mineralization occurs mostly in the form of copper-, molybdenum-, and silver-bearing sulfides, found in stockwork veinlets and disseminated in the altered host rock. Pyrite and chalcopyrite comprise approximately 25% and 35% of the total sulfides content, respectively; along with bornite (20%) and chalcocite (12%). The ratio of these main sulfide minerals is variable through the stratigraphy of the deposit owing to competing, over-printing pulses of mineralization and possible supergene effects. Molybdenite is a minor phase but appears to be distributed throughout the skarn and in peripheral portions of the deposit. Gold and silver are present in small amounts across the deposit and are thought to be contained in the primary sulfide minerals.
7.6.2 BOLSA DEPOSIT
Drilling at Bolsa has defined a mineral resource of approximately 4,000 feet (1,220 m) in strike, generally 600 to 1,100 feet (180 to 340 m) wide, over a depth of 750 to 1,500 feet (230 to 460 m). Drilling in 2022 has confirmed the mineralization of the Bolsa deposit is continuous with the Backbone Footwall mineralization of the East Deposit. Mineralization is hosted almost exclusively in the lower Paleozoic Bolsa quartzite, and the Abrigo, and Martin Limestone Formations within the Backbone Fault Domain. Stronger mineralization is truncated to the west at the disconformity, with generally unmineralized to weakly mineralized granitic rocks; although weaker, secondary copper oxide mineralization does occasionally occur on fractures a couple of hundred feet into the granitic rock. The eastern boundary is less distinctly defined by structure or stratigraphy. Near surface mineralization generally declines eastward towards, but not necessarily at, the fault contact with the Upper Plate lithologies. At depth, however, and especially in the southern half of the Bolsa Deposit, mineralization continues into both the Upper and Lower Plate Rocks. Mineralization in the Bolsa Formation Quartzite and in granitic rock, when present, is nearly entirely of non-carbonate copper oxide and copper silicate. In the altered skarn of the Abrigo and Martin Formations it is composed of a mix of copper oxides and sulfides.
7.6.3 BROADTOP BUTTE DEPOSIT
Drilling at Broadtop Butte has defined a mineral resource 1,600 to 2,500 feet (490 to 760 m) in diameter and up to 800 feet (240 m) thick. Mineralization is predominantly hosted by quartz monzonite porphyry, including an east-northeast striking brecciated zone. Skarns hosted in the Arkose Group and Glance group to the south of the quartz monzonite, and in the Glance Group, Scherrer Formation and Epitaph Formation to the north, east and below the quartz monzonite also host mineralization. Mineralization appears to be truncated on the east at Gunsight Pass by the Backbone Fault, although mineralization in the Bolsa Deposit is juxtaposed almost directly west of Broadtop Butte at Gunsight Pass. The extent of mineralization in all other directions does not appear to have strict stratigraphic or structural boundaries but seems to be related to the distance from the quartz monzonite porphyry and its associated skarn alteration halo. Mineralization in the unbrecciated quartz monzonite porphyry is dominated by sulfide mineralization, however, oxide copper mineralization is dominant in the breccia pipe portion of the quartz monzonite porphyry. Skarns at depth to the north and northeast of the quartz monzonite porphyry are relatively narrow, but with higher-grade sulfides.
7.6.4 WEST DEPOSIT
The West deposit mineralization strikes at approximately 160°, parallel to the Backbone Fault for 3,200 feet (980 m). It ranges from 400 to 1,100 feet (120 to 340 m) wide, and 300 to 700 feet (90 to 210 m) deep. Mineralization is hosted by Paleozoic quartzites, and skarn altered carbonate units on both the footwall and hanging wall of the Backbone Fault domain. In the northern half of the deposit, mineralization is also hosted in fractured coarse granitic rocks in the Backbone Fault domain footwall. The strongest mineralization is within the Backbone Fault structural zone and is dominated by sulfide mineralization. The Hanging Wall of the main Backbone structure has lower grades and is oxide dominated. The major host stratigraphies at the West deposit are the Precambrian coarse granitic rocks within the Backbone Fault Zone, and Paleozoic formations from Bolsa to Epitaph (footwall and lower plate units at the West Deposit). Mineralization nearly reaches the surface on the west slope of the low mountain that hosts most of the West deposit. Eastward no distinct structural or stratigraphic features limit mineralization. Drilling has defined the southern extent of mineralization, although the extent of mineralization to the north has not been completely defined.
7.6.5 PEACH-ELGIN DEPOSIT
The Peach-Elgin mineralization is hosted in the hangingwall of the low-angle Helvetia Thrust Fault (Helvetia Klippe) which hosts several historically mined deposits including the Peach, Elgin, Mohawk, Old dick, and Heavy Weight mines. Drill holes, both historical and recent, have connected much of the Helvetia Thrust hanging wall mineralization.
Peach is entirely hosted in variably skarn-altered sedimentary rocks and is cut by moderately shallow, east dipping faults, producing gaps in the stratigraphic sequence. Host stratigraphies include Bolsa, Abrigo, Martin, Escabrosa, Horquilla, and Epitaph. The Peach mineralization hosts an irregularly intertwined mix of copper oxide and copper sulfide dominated units.
The Helvetia Thrust mineralization, east of Peach, is hosted within the quartz monzonite porphyry, or in the skarn altered halo around the porphyry, primarily in the Epitaph and Concha Formations. A very narrow massive sulfide has been intercepted in the northeast of the Helvetia Thrust hangingwall, however the bulk of mineralization is disseminated in the porphyries, or in broader, marginal skarns.
8 DEPOSIT TYPE
The Project deposits consist of copper-molybdenum-silver-gold mineralization hosted in quartz monzonite porphyries, and in skarn. The skarn formed in the Paleozoic rocks from fluids associated with quartz latite to quartz monzonite porphyry intrusions. Genetically, skarns form part of the suite of deposit styles associated with porphyry copper centers. The skarns were formed as the result of thermal and metasomatic alteration of Paleozoic carbonate and, to a lesser extent, Mesozoic clastic rocks. Near-surface weathering has resulted in the oxidation of the sulfides in the overlying Mesozoic units at the East deposit, and in the near-surface Paleozoic units of the Copper World deposits.
Mineralization occurs mostly in the form of primary (hypogene) copper-, molybdenum-, and silver-bearing sulfides, found in stockwork veinlets and disseminated in the altered host rock at depth. Near surface, along structural zones, and in quartzite units, oxidized copper mineralization is present. The oxidized mineralization occurs as mixed copper oxide and copper carbonate minerals. Locally, enrichment of supergene chalcocite and associated secondary mineralization are found in and beneath the oxidized mineralization.
The Twin Buttes Mine, operated by Anaconda and later by Cyprus, was developed on a deposit with several geologic similarities, located approximately 20 miles (32 km) to the west of the Project. The Twin Buttes mine was in production from 1969 to 1994. In addition, the Asarco Mission Mine, located approximately 20 miles (32 km) to the west of the Project, also has many geologic characteristics in common with the Copper World deposits.
9 EXPLORATION
9.1 PREVIOUS WORK
Prospecting began in the Rosemont and Helvetia Mining Districts in the mid-1800s and by 1875 copper production was first recorded, which continued sporadically until 1951. By the late 1950s, exploration drilling had discovered the East deposit. A succession of major mining companies subsequently conducted exploratory drilling of the East deposit and the nearby Broadtop Butte, Peach-Elgin, and Copper World mineralized areas.
Augusta acquired the property in 2005 and performed infill drilling at the East deposit, along with exploration geophysical surveys. A Titan 24 induced polarization/resistivity ("DCIP") survey over the East deposit, performed in 2011, discovered significant chargeability anomalies which are only partially tested to date. These anomalies appear to define mineralization and certain unmineralized lithologic units. A regional scale airborne magnetics survey was also completed in 2008 to aid in geological mapping of the property and outline the magnetic footprint of the deposit.
Two infill drilling campaigns were completed by Hudbay in and beneath the East deposit in 2014 and 2015. In addition to chemical assaying, magnetic susceptibility and conductivity measurements were taken using the Terraplus' KT-10 & KT-20 instruments at approximately 3-meter (10-feet) intervals of recovered core from the drilling program. The magnetic susceptibility data has been used from both drilling programs as a constraint for a 3D inversion of the deposit. A single test-line of DCIP data was collected over the East deposit using the DIAS Geophysical (3D Survey/Mapping) in April 2015 for comparison to the previously completed Titan 24 survey.
A mapping and geochemical sampling program was completed in the latter half of 2015 on the property to reassess the interpretation of the regional geology and deposit setting. This was followed by a structural interpretation using both surface and drill core measurements to aid in the geotechnical evaluation of the Project. Magnetic susceptibility and conductivity measurements were taken using the Terraplus' KT-10 & KT-20 instruments at the same locations as the geochemical samples.
In October 2020 a 29 line-mile (47 line-km) Versatile Time-Domain Electromagnetic (VTEM) test survey was completed over the property on 10 east-west & 2 north-south lines to determine if this method is appropriate to aid in the delineation of poor to moderately conductive skarn material in the area. In general, the results highlighted lithological units rather than specific mineralization hosted in skarn deposits.
During the fall 2020 field program five drillholes were surveyed by DGI Geoscience Incorporated using Acoustic & Optical Televiewer downhole equipment. These surveys were completed to identify features (joints, bedding, etc.) to aid in the structural interpretation of the intersected geological units as well as highlight faults or shear zones.
From January to April 2021 Quantec Geoscience Incorporated using their Titan 24 induced polarization/resistivity ("DCIP") method surveyed 50.3 line-km over thirteen east-west lines. Additional significant chargeable anomalies were identified and are only partially tested to date. This survey is meant to be an expansion of the 2011 program.
Hudbay initiated exploration drilling on targets within its Copper World private land in October 2020. Drill targets proximal to the historical mines included the Elgin, Copper World, Leader, Isle Royale, and King Mines; historically identified drill targets included Broadtop Butte and Peach; and previously undrilled targets, most notably the Bolsa area.
9.2 EXPLORATION POTENTIAL BETWEEN, & PROXIMAL TO, KNOWN DEPOSITS
The West deposit remains open to the north. Broadtop Butte's mineralized extent has not been fully defined at depth in the east or south of the deposit. The Peach-Elgin deposit remains open in the north towards Hudbay's unpatented mining claims. The extent of mineralization along the Bolsa Deposit has been constrained eastward at shallow depths but remains open at depth. The western extent of mineralization of the Bolsa and East deposits has not been completely defined.
Several geophysical targets exist outside of the known deposits. The most notable are a pair of anomalies approximately 1,400 feet (400 m) north of the known West deposit on Forest Service land where Hudbay holds unpatented mining claims. Limited transects have identified numerous small exploration pits within this region, however the anomalies have never been drill tested. Additional untested anomalies include those approximately 2,200 feet (670 m) south of the West deposit and east of Broadtop Butte.
9.3 ADDITIONAL REGIONAL POTENTIAL ON HUDBAY TENEMENTS
Additional potential targets not currently covered by IP coverage exist on Hudbay unpatented mining claims. These include targets proximal to historical mines, and mapped intrusions roughly 4,000 feet (1,200 m) south and 3,000 feet (900 m) south of the West deposit. Both targets would benefit from detailed field mapping and geophysics. Another potential target area is a northwest striking intrusive body of quartz-monzonite, approximately 8,000 feet (2,400 m) north of the West deposit and approximately 1 mile (1.6 km) northeast of the Imery's Marble Quarry. The intrusion was mapped by the USGS (Drewes, 1971) as the same intrusive unit that hosts porphyry mineralization at both Broadtop Butte and Elgin. The target would benefit from detailed mapping, ground-penetrating geophysics, and drilling.
10 DRILLING
Extensive drilling has been conducted by several successive property owners. The most recent drilling was done by Hudbay, with prior campaigns completed by Lewisohn, Banner, Anaconda Mining Co., Anamax, Asarco and Augusta. Table 10-1 summarizes the drill holes used to estimate the current mineral resource estimate.
TABLE 10-1: DRILLHOLE DATABASE FOR THE PROJECT
The drill holes in the database are mostly diamond drill holes. In some older holes, the top portion was drilled using a rock bit to set the collar, or by rotary drilling methods and then switched to core drilling before intercepting mineralization. Reverse-circulation ("RC") drilling was utilized by Hudbay from 2021 to mid-2022. Although all RC holes are stored in the database, only those within porphyry (Elgin and Broadtop Butte), low copper grade quartzite, and granite were used in resource calculations.
A map showing the location of the drill holes by company is provided in Figure 10-1 for the Copper World Project.
Core recoveries within the mineralized zone for the Hudbay and Augusta drilling programs average over 90%, lending confidence that quality samples were obtained including the oxidized intervals.
10.1 LEWISOHN & BANNER MINING COMPANY (1953 - 1963)
The earliest drilling recorded on the Project area was conducted by Lewisohn between 1953 and 1957 and utilized churn drilling. No material is left from this drilling, and only paper logs and copper assay results are available. This data was validated by conducting a global statistical comparison with recent core drilling done by Hudbay over the same volume.
The first significant core drilling campaign on the Property was by Banner, beginning in about 1961. Banner primarily completed shallow diamond drill holes, many of which were subsequently deepened by Anaconda Mining Co.
10.2 ANACONDA MINING COMPANY (1963 - 1986)
Anaconda acquired Banner Rosemont Holdings around 1963 and conducted exploration at the East deposit as well as in adjacent mineralized areas. Between 1963 and 1973, Anaconda completed 210 diamond drill holes for a total of 178,399 feet (54,376 m). These holes were primarily drilled vertically. Down-hole and collar surveys completed by company surveyors were conducted during drilling or immediately following drill hole completion. Anaconda drilled approximately 85% of these holes as the larger N-size core and 15% as the smaller B-size core (1.4 inch or 36.4 mm diameter). Overall core recovery was more than 85%.
Exploration subsequently transferred to Anamax Mining Company, (an Anaconda Mining Co., and Amax Inc. joint venture), which continued diamond drilling and analytical work until 1986. Anamax completed 186 core holes for a total of 127,979 feet (39,008 m). These holes were almost exclusively drilled as angled holes inclined -45° to -55° to the west, approximately perpendicular to the direction of the east-dipping, Paleozoic, metasedimentary host rocks. Down-hole and collar surveys by company surveyors were conducted during drilling or immediately following drill hole completion. Anamax drilled approximately 80% of the holes as N-sized core and 20% as B-sized core, with an overall core recovery of more than 88%.
FIGURE 10-1: DRILL HOLE LOCATIONS BY COMPANY

10.3 ASARCO MINING COMPANY (1988 - 2004)
Asarco acquired the Rosemont property in 1988 and conducted exploration until 2004. 11 vertical drill holes were completed for a total of 14,695 feet (4,479 m). Data was available from 8 of the Asarco core holes in the deposit area and were incorporated into Hudbay's mineral resource estimates. No downhole survey data is available for these holes. Drill hole collars were surveyed by company surveyors. The size of core collected by Asarco was predominantly N-size. Core recovery information was not available but re-logging by Augusta personnel indicated it to be of similar quality to other drilling campaigns.
10.4 AUGUSTA RESOURCE CORPORATION (2005 - 2012)
Augusta optioned the property in 2005 and conducted diamond drilling through several campaigns from 2005 to 2012. In total, Augusta completed 87 core holes for a total of 132,438 feet (40,381 m). Of these, 60 holes were drilled for the purposes of delineating the deposit and providing infill information. 6 others were exploration holes outside of the planned pit area, but close enough to be a part of the resource database. The remaining 21 core holes supported geotechnical (13) and metallurgical (8) studies. Augusta holes were usually collared by a solid, non-coring rock-bit through the overburden, then drilled with larger HQ-sized core as deeply as possible and finished with NQ-sized core if ground conditions deteriorated.
Most of the holes were oriented vertically with a few inclined to intercept targets from reasonably accessible drill pad locations. All drill holes were down-hole surveyed using a Reflex EZ-Shot survey instrument, which measures inclination/dip and azimuth direction. Measurements were taken every 100 ft (30m) down the hole during the 2008 drilling campaign, and every 200 or 500 feet (60 or 150 m) down the hole during the 2005, 2006 and 2011 to 2012 campaigns. The initial drill hole collar locations were surveyed by Putt Surveying of Tucson, Arizona, while all later drilling locations were measured and certified by Darling Environmental & Surveying of Tucson, Arizona.
10.5 HUDBAY (2014 - 2015)
Shortly after acquiring the Project, Hudbay initiated a 44-hole diamond drill program in September 2014 and completed 93,122 feet (28,383 m) of diamond drilling by December 2014. The drill program was conducted entirely on patented claims within the footprint of Augusta's mineral resource estimates. It was designed to gain an initial understanding of the geological setting and mineralization, provide infill drilling density, and metallurgical, geochemical, and geophysical data.
Diamond drilling was primarily HQ-sized core as deeply as possible, then finished with NQ-sized core if a reduction in core size was required due to ground conditions. If ground conditions dictated, drill holes were collared in larger PQ size (3.3 inch or 83 mm diameter) and reduced to HQ as ground conditions improved. Drilled length and respective recoveries were PQ 4,326 feet (1,319 m) with 83.5% recovery, HQ 85,583 feet (26,086 m) with 95.9% recovery, and NQ 3,213 feet (979 meters) with 92.8% recovery (statistics include HB-2119 that was abandoned due to poor ground conditions at 200 feet (60 meters).
43 of the drill holes were orientated vertically, with 1 inclined to intercept a target area from an accessible drill pad location. Down hole surveying was conducted on 200 feet intervals with either a Multishot Reflex or a Surface Recording Gyro Survey instrument. Both instruments measured inclination/dip and azimuth direction. Collar locations were surveyed and certified by Darling Environmental & Surveying of Tucson, Arizona
From August to November 2015, Hobday completed a 46-hole, 75,164 feet (22,910 m) diamond drill program. This drill program was also conducted on patented claims entirely within the footprint of Augusta's mineral resource estimates. Designed to gain a further understanding of the geological setting and mineralization while providing infill drilling density, it also collected metallurgical, geotechnical, geochemical, and geophysical data.
Diamond drilling was primarily HQ-sized core as deeply as possible, and finished with NQ-sized core if ground conditions warranted a reduction in core size. Where required, drill holes were collared in larger PQ size and reduced to HQ as ground conditions improved. 22 of the drill holes were oriented vertically, with 24 inclined. 8 holes were inclined for drilling-oriented core utilizing the Reflex ACT III instrument to gather geotechnical structural data, and 16 holes were inclined to intercept a target area from an accessible drill pad location. Down hole surveying was conducted on 200 feet (61 m) intervals with either a Multishot Reflex or a Surface Recording Gyro Survey instrument. Both instruments measured inclination/dip and azimuth direction. Collar locations were surveyed and certified by Darling Environmental & Surveying of Tucson, Arizona.
10.6 HUDBAY (2020 - 2022)
Hudbay initiated exploration drilling on targets north and west of the East deposit in October 2020. Drill target included areas proximal to the historical mines; historically identified target; and previously undrilled targets. Several holes were additionally drilled for condemnation or geotechnical purposes.
Drilling in 2020 through December 20th, 2022, totaled approximately 455,913 feet (138,962 m) from 945 drill holes. Diamond drilling was primarily HQ-sized core as deep as possible, then finished with NQ-sized core, if poor ground conditions were encountered. Where required, drill holes were collared in larger PQ size and reduced to HQ as ground conditions improved.
Drill holes were primarily negatively inclined, to vertical. Underground-type drill rigs were used in some areas to drill holes shallower than -45 inclination, including horizontal and positively inclined holes in areas of very steep terrain. Higher relief terrain in much of the Copper World Deposits generally dictated less regular spacing than at the East deposit leading to multiple holes being drilled from the same pads.
RC drilling was also performed between May 2021 through and June 2022. RC twinning of core holes indicated the RC drilling assay results were comparable to diamond drilling in quartz monzonite porphyry hosts. As a result, assays from RC holes were only used for resources calculations for portions within quartz monzonite porphyry in Broadtop Butte and Peach-Elgin, and low-copper grade quartzite and granite in the Bolsa deposit.
10.7 DRILLING METHOD & SURVEY
Documentation from owners prior to Augusta regarding drill equipment, hole size, collar location, down-hole survey methods and core recovery is not available. Inspection of drill logs and archived samples show that drill programs were carried out using RC, diamond, or a combination of both types of drilling. Core diameters varied with drill programs and were generally NQ or BQ. Diameters for RC drill programs were not recorded. Collar coordinates were likely surveyed by theodolite. Most holes have multiple downhole surveys with varying azimuth and dip. Downhole survey methods and instruments are not reported. Inspection of available archived core indicates reasonably good core recovery.
For the 2020-2022 drilling, downhole surveying was conducted at 100 feet (30 m) intervals with either a Multishot Reflex or a Surface Recording Gyro Survey instrument. Both instruments measured inclination/dip and azimuth direction. For upward and horizontal holes, a Reflex Gyro Sprint-IQ survey tool was used. Beginning in February 2021, a TN-14 Rig Alignment Tool was utilized to line up drill rigs on planned azimuths and inclinations. Collar locations of holes drilled in 2020 were surveyed and certified by Darling Environmental & Surveying of Tucson, Arizona. Collar locations from the 2021 program were estimated based on surveyed and certified pad outlines. Collar locations from the 2022 program were estimated based on surveyed and certified pad outlines or surveyed directly over stake markers placed over the completed collars (124 surveys taken over marked collars). A small minority of holes either had no down hole survey recorded, unreliable survey values, or were lost. Generally, holes with no survey were not used for resource calculations except in rare cases such as for short vertical holes or short inclined holes with TN-14 Rig alignment recorded.
Drill coordinates are recorded in Hudbay's database as UTM feet, calculated by multiplying the UTM metric coordinates by a factor of 0.3048 The entire property is within zone 12 of the Universal Transverse Mercator coordinate system, North America Datum 83.
11 SAMPLE PREPARATION, ANALYSES, & SECURITY
Sample preparation, analysis, and security procedures were reviewed by the Qualified Person, Olivier Tavchandjian, P. Geo., Hudbay's Senior Vice President, Technical Services and Exploration. The sampling methodology, analyses and security measures used by the previous owners were reviewed and documented in detail in the 2017 Technical Report. The following section provides a summary of the material information related to the sampling work performed prior to 2017 and describes in more detail the methods and processes used for the sampling and analysis during the more recent drilling campaigns performed by Hudbay since 2020.
11.1 SUMMARY OF EARLIER WORK (1956-2016)
11.1.1 CORE LOGGING, DOCUMENTATION, & SECURITY
Table 11-1 presents a summary of the methodology, documentation, and security related to the core logging and sampling activities followed before the 2020-2022 drilling campaigns.
TABLE 11-1: SUMMARY OF THE CORE LOGGING, DOCUMENTATION & SECURITY BEFORE 2017
| Company |
Banner &
Anaconda |
Anamax |
Asarco |
Augusta |
Hudbay |
| Year |
1956-1964 |
1970-1985 |
1988-2004 |
2005-2012 |
2014-2015 |
| Core logging |
lithologies, alterations, mineralization - on paper |
lithologies, alterations, mineralization
- on paper |
lithologies, alterations, mineralization - iPad with FileMaker Pro database interface |
| Core photograph |
n/a |
yes |
| Sample length |
1'-5' (0.3-1.5m) in mineralized zones and 20'-30' (6-10m) in barren zones |
10' (3m) |
5' (1.5m) |
| Quality assurance |
n/a |
QAQC samples inserted within the samples dispatch stream |
| Samples dispatch |
n/a |
Sample tags in bags, requisition form with samples list and requested analytics sent to lab |
| Security |
n/a |
Gated and locked logging facility with 24 hours private security |
11.1.2 PREPARATION METHODS
Table 11-2 presents a summary of the sample preparation used before the 2020 - 2021 drilling campaign.
TABLE 11-2: SUMMARY OF THE SAMPLE PREPARATION BEFORE 2017
|
Company
|
Banner & Anaconda
|
Anamax
|
Asarco
|
Augusta
|
Hudbay
|
|
Year
|
1956-1964
|
1970-1985
|
1988-2004
|
2005-2012
|
2014-2015
|
|
Core split
|
half core split
|
half core split
|
half core split
|
half core cut
|
half core cut
|
|
Laboratory
|
Anaconda analytical lab
|
Anamax analytical lab
|
Skyline, Tucson (AZ)
|
Skyline, Tucson (AZ)
|
Inspectorate, Spark (NV)
|
|
ISO Certified
|
n/a
|
yes
|
yes
|
yes
|
|
Drying
|
n/a
|
no
|
no
|
no
|
|
Crushing
|
n/a
|
Jaw
|
Jaw
|
|
Mesh size
|
n/a
|
-10 Mesh (2 mm)
|
-10 Mesh (2 mm)
|
|
Spitting
|
n/a
|
Riffle
|
Riffle
|
|
Weight of sub-sample
|
n/a
|
300 to 400g
|
1000g
|
|
Size of sub-sample
|
n/a
|
≥ 90% passing through - 150 mesh (105 μm)
|
≥ 85% passing through - 200 mesh (75 μm)
|
|
Grinding bowl
|
n/a
|
Steel / Chrome
|
Steel / Chrome
|
|
Quartz wash
|
n/a
|
yes
|
yes
|
|
Assay charge
|
n/a
|
20 to 25g
|
150g dispatch to Bureau Veritas, Vancouver (BC) and assay charge of 25 g
|
11.1.3 ASSAY METHODOLOGIES
Table 11-3 presents a summary of the assaying before the 2020-2021 drilling campaign.
TABLE 11-3: SUMMARY OF THE ASSAYING BEFORE 2017
| Company |
Banner &
Anaconda |
Anamax |
Asarco |
Augusta |
Hudbay |
| Year |
1956-1964 |
1970-1985 |
1988-2004 |
2005-2012 |
2014-2015 |
| Number of samples |
30,706 |
14,026 |
921 |
21,341 |
33,227 |
| Assaying laboratory |
Anaconda analytical lab |
Anamax analytical lab |
Skyline, Tucson (AZ) |
Skyline, Tucson (AZ) |
Bureau Veritas, Vancouver (BC) |
| Assaying method |
XRF & wet chemistry / colorimetric |
XRF & wet chemistry / colorimetric |
n/a |
AA and ICP-MS |
AA and ICP-MS |
| QAQC program |
n/a |
yes |
yes |
| Blank |
553 |
1,962 |
| Coarse duplicates |
< 50 |
1,956 |
| Standards |
2,957 |
1,961 |
| Check Assays at umpire laboratory |
326 |
1,742 |
| Total QAQC |
4.6% of all samples |
5.7% of all samples |
| Twin holes & correction factors |
n/a |
10 historical drill holes were twinned to verify assay results reported in historical drilling and sampling programs. A high Mo bias was observed compared to original results from wet and XRF assaying method |
Based on results obtained from Augusta twin hole program, Hudbay developed the following correction factors: Mo grades reported by wet assays were multiplied by 0.85, and those reported by XRF by 0.45 |
| Comments |
no information available given the historical nature of the information |
QAQC protocol monitored the potential cross-contamination, precision, and accuracy |
QAQC protocol monitored the sub-sampling procedures, potential cross-contamination, precision, and accuracy |
11.1.4 DENSITY MEASUREMENTS
A total of 1,177 samples from 154 drill holes were collected for density measurements prior to Hudbay's 2020 and 2021 drilling campaigns (Table 11-4). Density measurements conducted by Augusta and Hudbay were performed using water displacement methods. As for the measurements conducted by Anaconda and Anamax, given the age of the measurements, it can be safely assumed that they were also performed using water displacement methods (i.e., un-waxed or waxed core).
TABLE 11-4: DENSITY MEASUREMENTS BEFORE 2017
| Company |
Banner &
Anaconda |
Anamax |
Asarco |
Augusta |
Hudbay |
| Year |
1956-1964 |
1970-1985 |
1988-2004 |
2005-2012 |
2014-2015 |
| Number of samples (number of DHs) |
205 (58 DHs) |
123 (35 DHs) |
n/a |
92 (15 DHs) |
757 (46 DHs) |
| Method |
n/a |
n/a |
n/a |
specific gravity on core |
specific gravity on waxed core |
| Sample size |
n/a |
n/a |
n/a |
n/a |
10-15 cm piece of core |
11.1.5 CONCLUSION ON THE HISTORICAL DATA
In the opinion of the author, the QAQC results from Augusta, including the twin hole program aimed at validating the historical results, as well as Hudbay's 2014 - 2015 QAQC results demonstrate that the precision and accuracy of the assay results are of adequate quality and can be used for resource estimation purposes.
11.2 SUMMARY OF WORK DONE SINCE 2020
11.2.1 CORE LOGGING
The drilling contractors thoroughly cleaned the drill core retrieved from the core tube before piecing all the segments together in the core boxes. Footage marker blocks were inserted in the core boxes after each run to indicate the relative down-hole depth. Core boxes were labelled with the hole name, box number, and from - to footage measurements before securely closing the box with a tightly fitted lid. Core boxes were delivered to a secure laydown area where they were transferred to the core logging facility by core technicians.
Core boxes were loaded onto conveyor racks by the core technicians and geologists. Prior to measuring the core recovery and rock quality data ("RQD"), visual checks were performed for incorrect placement and orientation of core fragments. Any discrepancies caused by misplaced footage tags were resolved by consulting the drilling contractors. The drill core was marked with cut lines designed to provide the most representative split.
All core logging was completed by experienced geologists. All geologists were trained in the rock types, alterations, mineralization styles, and structures found on the property before logging began. All drill holes were logged using tablets with FileMaker Pro©, a database hosted on local hotspot network. The drill core was divided into sub intervals based on the rock types observed by the geologists. Each interval was further described for alteration, mineralization, and oxidation state of the primary sulfides.
11.2.2 SAMPLE SELECTION
Core samples for assaying were selected by the logging geologist. Initially, sample intervals were 5- or 10-foot (1.5 or 3 m) lengths. The start and end of sample intervals were adjusted to correspond to major lithologic or mineralogic breaks, or if significant voids were encountered. Geologists generated the samples sequence in FileMaker Pro, along with the QAQC insertion sample numbers. The geologists or trained technicians were responsible for filling the tags, with the hole name and sample interval from the FileMaker Pro generated list.
Reverse circulation ("RC") drilling was conducted during the 2021 program. The absence of bias from RC drilling was tested through a spatially proximal twin hole core drilling program. This comparative study is still in progress and assay results from RC drilling have not been used to support the mineral resource estimate for this PFS.
11.2.3 CORE PHOTOGRAPHS
Core boxes with sample tags inserted were photographed using a digital SLR camera mounted to an aluminum frame that sits atop the core boxes. The camera was attached to a tablet with the Imago© application installed which records the drill hole name, and depths in each photo. The photos were uploaded to an Imago cloud server accessible by authorized Hudbay personnel only.
11.2.4 CORE CUTTING
Prior to cutting the core, geologists printed the FileMaker Pro sample list for each drill hole that included the sample identification number, hole name, sample type, and the start and end footage of each sample. This list was used to label the sample bags. At the core cutting stations, buckets were lined up with the correctly labelled sample bag and the corresponding core box was placed on a worktable next to the core saw. The core samples were cut along the center of the core so approximately 50% of the core was split. For PQ sized core, roughly 1/3rd of the core was split off to prevent excessive sample weight. In gouge and rubble intervals, an aluminum or plastic sampling scoop was used to separate the gouge into two halves in the core boxes. Filled sample bags were closed using the bag draw strings and secured at the neck using zip ties. Saws were rinsed with water between cutting each sample to prevent cross contamination.
11.2.5 SAMPLE DISPATCHING
Samples were dispatched using the dispatching module in the core logging database. A requisition form was automatically created from FileMaker Pro. The requisition forms listed the sample, job order number, requested analytical codes, and any special instructions. The requisition forms and lists of samples were e-mailed to the laboratory prior to, or immediately after sample shipment. Hard copies of the requisition forms were also included with each shipment. QAQC samples including blanks, duplicates and standards were introduced into the sample dispatch stream. Sample bags were cross-checked with the sample requisition form before packing. Samples were either picked up by a truck dispatched by the lab or transported using a commercial carrier.
11.2.6 SAMPLE PREPARATION
During the 2020 -2023 drilling campaigns four different laboratories were used (Table 11-5), with ALS and Skyline being the primary labs during the 2022-2023 period:
- Skyline in Tucson, Arizona (preparation and analysis)
- ALS (samples preparation in Tucson (AZ), Hermosillo and Zacatecas (Mexico), gold analysis in Reno (NV) and whole rock geochemistry and soluble copper analysis in North Vancouver (BC)
- Bureau Veritas (Sample preparation in Reno (NV) & Hermosillo in New Mexico, and analyses in Vancouver (BC).
- SGS in Burnaby (BC) (preparation and analysis)
All the laboratories used by Hudbay have a quality system that meet the requirements of the International Standards Organization (ISO) 9001 Model for Quality Assurance and ISO/IEC 17025 General Requirements for the Competence of Testing and Calibration Laboratories.
TABLE 11-5: SUMMARY OF SAMPLE PREPARATION USED DURING THE 2020-2023 DRILLING CAMPAIGNS
| Laboratory |
Bureau Veritas |
SGS |
Skyline |
ALS |
| ISO Certified |
Yes |
Yes |
Yes |
Yes |
| Drying |
No |
Yes |
No |
No |
| Crushing |
jaw |
jaw |
jaw |
jaw |
| Mesh size |
70% passing #10 mesh (2 mm) |
75% passing #10 mesh (2 mm) |
75% passing #10 mesh (2 mm) |
70% passing #10 mesh (2 mm) |
| Spitting |
riffle splitter |
riffle splitter |
riffle splitter |
rotary splitter |
| Weight of sub-sample |
250 g |
250 g |
250 to 300 g |
250 g |
| Size of sub-sample |
85% passing #200 mesh (75 μm) |
85% passing #200 mesh (75 μm) |
85% passing #200 mesh (75 μm) |
85% passing #200 mesh (75 μm) |
| Grinding bowl |
Steel / Chrome |
Steel / Chrome |
Steel / Chrome |
Steel / Chrome |
| Quartz wash |
Yes |
Yes |
Yes |
Yes |
| Assay charge |
25 g |
30 g |
30 g |
30 g |
11.2.7 DENSITY MEASUREMENTS
In addition to the existing 434 density measurements on core and pulp samples (Table 11-6), 727 new pulp samples from 255 drill holes were analyzed by pycnometer at ALS. Earlier density measurements sent to Bureau Veritas, Skyline, ALS, and SGS (Table 11-6) were performed using bulk density by water displacement on waxed core at Bureau Veritas, and un-waxed core at Skyline. Specific gravity measurements on pulps were taken by pycnometer at ALS, and specific gravity on un-waxed and waxed core by water displacement and pycnometer at SGS.
TABLE 11-6: DENSITY MEASUREMENTS
| Laboratory |
Bureau Veritas |
Skyline |
ALS |
SGS |
| Number of samples (number of DHs) |
171 (63 DHs) |
64 (19 DHs) |
86 (25 DHs) + 727 (255 DHs) |
88 (32 DHs) |
5 (1 DH) |
20 (6 DHs) |
| Method |
specific gravity on waxed core |
specific gravity on core |
liquid pycnometer |
specific gravity on waxed core |
specific gravity on core |
gas pycnometer |
| Sample size |
7-9" (20-25 cm) piece of core |
7-9" (20-25 cm) piece of core |
pulp rejects |
7-9" (20-25 cm) piece of core |
7-9" (20-25 cm) piece of core |
pulp rejects |
Measuring specific gravity on un-waxed core involves weighing the sample both in air and in water. The specific gravity is calculated by dividing the dry weight by the difference between the saturated weight and the submerged weight. For waxed core, the sample is first coated with paraffin before proceeding with the same weighing procedure.
In-situ density measurements on pulps requires placing the samples in vessels (i.e., pycnometers) and filling the remaining volume with a liquid or a gas. The in-situ density is determined by calculating the ratio of the sample weight to the weight of the solvent displaced.
Specific gravity measurements from competent pieces of core may not necessarily reflect in-situ density during the mining operation in unconsolidated ground with natural voids. To quantify the potential for correction, an alternative measure of in-situ density was developed based on core box weight. Using the sample interval length and core size, the inner effective volume of the core drilled was calculated by using the cylinder volume equation (𝑉=𝜋𝑟2ℎ) in each box and its in-situ density was then derived by dividing the core box by this effective drilled volume. It must be noted that when weighed, the core in the box was already dry, and as a result no additional adjustment has been applied to remove any assumed moisture content.
Results of the comparison between laboratory measurements of specific gravity and in-situ density estimates based on core box weights are presented and discussed in Section 14 of this Technical Report.
11.2.8 ASSAY METHODOLOGY
11.2.8.1 DRILL CORE
Samples collected after 2021 continued to be assayed at two of the independent commercial analytical laboratories: Skyline in Tucson (AZ) and ALS laboratories in North Vancouver (BC). To ensure assay consistency between the different laboratories, sample preparation and analytical protocols remained similar to those used by ALS and Skyline (as well as SGS and Bureau Veritas) during Hudbay's 2020 - 2021 drilling campaign (Table 11-7) (Hudbay Minerals Inc., 2022). Sample preparation and analytical protocols were also consistent with those carried out earlier by Bureau Veritas during Hudbay's 2014 - 2015 drilling program.
Analytical assaying comprises a standard set of analytical packages with major & trace elements, base & precious metals (including Cu, Zn Pb, Mo, Ag, Au), soluble copper, as well as pathfinder elements (e.g., As, Bi, Sb, Se, Sn, Te, W).
Analyses were performed using a combination of Inductively Coupled Plasma Mass Spectrometry (ICP-MS) and Inductively Coupled Plasma Emission Spectroscopy (ICP-ES), following multi acid digestion to achieve near total dissolution. Two stages of copper sequential analysis (sulfuric acid leach followed by sodium cyanide leach) were performed at Skyline and ALS. Only the results for the sulfuric acid leach were used in the resource estimate. Gold content was analyzed by fire assay.
11.2.8.2 GOLD PULPS ASSAY
In addition to the regular drill core assays, a subset of historical pulp samples (each pulp weighing 2 to 4 lbs. (1 to 2 kg)), stored in individual paper pockets, representing 5 ft (1.5 m) intervals) was re-analyzed for gold by fire assay at Skyline (Tucson) and ALS (Reno). Initially the preparation involved two different approaches: a cement mixer was used at ALS to turn and homogenize three 2.5-gallon screw top pails for several minutes. Each pail will hold one composite containing the 4 or 5 pulps representative of the 25 ft composite. Once the homogenization stage was completed, an aliquot of about 150 grams was sent to Reno for fire assay. At ALS, 910 composite samples were prepared and analyzed by this method.
At Skyline, each 2 to 4 lbs. (1 to 2 kg) pulp stored in paper packets was transferred individually to zip lock bags. Each zip lock was then manually mixed, then 50 g of pulp from five individual bags was combined and homogenized into a single 200- to-250-gram sample to be representative of the 25' composite. Finally, a 30-gram aliquot from the 200- to 250-gram sample was analyzed by fire assay. At Skyline, 805 composite samples were prepared and analyzed with this method. Given the time-consuming nature of this method, the original individual pulp samples (2982 pulp samples) continued to be analyzed at Skyline by Fire assay.
TABLE 11-7: SUMMARY OF ANALYTICAL SPECIFICATIONS USED FOR 2020-2023 DRILLING CAMPAIGNS
| Lab |
Samples |
Procedure |
Sample Assaying Procedures |
Skyline
Tucson |
8916 |
TE-5 |
47 elements by Multi Acid Digestion, ICP-OES/ICP-MS |
| 8916 |
Cu-SEQ |
Sequential Cu by H2SO4 and CN leach - AAS |
| 375 |
CuT |
Copper (total) |
| 25 |
SEA-Mo |
Molybdenum (ICP-OES, up to 10%) |
| 64 |
SEA-MI-6 |
Bulk Density - Immersion - Unwaxed-Core |
SGS
Vancouver |
3803 |
GE_ICM40Q12 |
49 elements (GE_ICP40Q12 + GE_IMS40Q12) by 4-acid digestion, ICP-OES/MS |
| 126 |
GO_ICP42Q100 |
Ore Grade, 4-Acid digestion by ICP-AES |
| 3803 |
GC_ASQ01D50 |
Sequential Cu (5% H2SO4 soluble Cu) |
| 3803 |
GC_ASQ02D100 |
Sequential Cu (10% NaCN / 1% NaOH soluble Cu) |
| 775 |
GC_ASQ03D50 |
Sequential Cu (HNO3/HCL/HF/KCL04 Cu Residual) |
| 115 |
GE_ICM95A50 |
47 elements by Lithium metaborate fusion and ICP-OES/MS |
| 113 |
G_PHY06V |
Specific Gravity (SG), Solids, Pycnometer |
| 88 |
No Code |
Bulk Density, Immersion waxed core |
| - |
S_PHY17V |
Bulk Density, Immersion non-waxed |
ALS
Reno & Vancouver |
1675 |
ME-MS61 |
Four Acid / ICP-MS 48 Multi-element Package |
| 86 |
ME-ICP06 |
Whole Rock: 13 elements by acid digestion and ICP-AES |
| 86 |
ME-MS81 |
30 elements by lithium borate fusion and ICP-MS |
| 57 |
Cu-OG62 |
Ore Grade Cu Four Acid Digestion by ICP-AES |
| 1675 |
ME-OG62 |
Ore Grade Elements Four Acid Digestion by ICP-AES |
| 1675 |
Cu-AA05 |
Cu Non-Sulfide method, dilute sulfuric acid - AAS |
| 1675 |
Cu-AA17h |
Cyanide leach for Cu after sulfuric acid leach - AAS |
| 86 |
OA-GRA08b |
Specific Gravity by Pycnometer |
Bureau Veritas
Reno & Vancouver |
175 |
LF200 |
Total Whole Rock Characterization |
| 6584 |
MA200 |
45 element digest ICP-MS |
| 465 |
MA370 |
Ore Grade Elements Four Acid Digestion by ICP-ES |
| 5645 |
LH402 |
Cu in oxide form, 5% H2SO4, AAS Finish |
| 957 |
LH403 |
Cu by Leach in Cyanide Sodium by AAS |
| 709 |
LHSQ2 |
Sequential Cu - H2SO4, CN leach only |
| 171 |
SPG03 |
Specific Gravity on Waxed core |
| - |
SPG04 |
Specific Gravity by Pycnometer |
Samples with Cu and Mo concentration greater than the over-limit were re-analyzed for the grade of base-metal sulfide and precious-metal resources. Table 11-8 presents a summary of the detection limits used four different laboratories during the 2020-2023 drilling campaigns.
TABLE 11-8: SUMMARY OF DETECTION LIMITS
| Lab |
Details |
Cu
ppm |
Cu>8000
% |
Mo
ppm |
Mo>8000* |
CuSS
% |
CuCN*
% |
Ag
ppm |
Au
ppm |
S % |
Ca % |
| Skyline |
LDL |
0.1 |
0.001 |
0.1 |
0.01 |
0.005 |
0.005 |
0.05 |
0.005 |
0.05 |
0.01 |
| UDL |
10000 |
10 |
1000 |
10 |
10 |
|
150 |
5 |
10 |
25 |
| Digestion |
Multi Acid |
Multi Acid |
Multi Acid |
Multi Acid |
Sulfuric acid |
Sodium cyanide |
Multi Acid |
Fire Assay |
Multi Acid |
Multi Acid |
| Technique |
ICP-MS |
ICP-OES |
ICP-MS |
ICP-OES |
AAS |
AAS |
ICP-MS |
AAS |
ICP-MS |
ICP-MS |
| SGS |
LDL |
0.5 |
0.1 |
0.05 |
0.01 |
0.001 |
0.001 |
0.02 |
0.005 |
0.01 |
0.01 |
| UDL |
10000 |
30 |
10000 |
10 |
100 |
100 |
100 |
10 |
5 |
15 |
| Digestion |
Multi Acid |
Multi Acid |
Multi Acid |
Multi Acid |
Sulfuric acid |
Sodium cyanide |
Multi Acid |
Fire Assay |
Multi Acid |
Multi Acid |
| Technique |
ICP-MS |
ICP-AES |
ICP-MS |
ICP-AES |
AAS |
AAS |
ICP-MS |
AAS |
ICP-MS |
ICP-MS |
| ALS |
LDL |
0.2 |
0.001 |
0.05 |
0.001 |
0.001 |
0.001 |
0.01 |
0.005 |
0.01 |
0.01 |
| UDL |
10000 |
50 |
10000 |
50 |
10 |
15 |
100 |
10 |
10 |
50 |
| Digestion |
Multi Acid |
Multi Acid |
Multi Acid |
Multi Acid |
Sulfuric acid |
Sodium cyanide |
Multi Acid |
Fire Assay |
Multi Acid |
Multi Acid |
| Technique |
ICP-MS |
ICP-OES |
ICP-MS |
ICP-OES |
AAS |
AAS |
ICP-MS |
AAS |
ICP-MS |
ICP-MS |
| Bureau Veritas |
LDL |
0.1 |
0.001 |
0.1 |
0.001 |
0.001 |
- |
0.1 |
0.005 |
0.1 |
0.01 |
| UDL |
10000 |
10 |
4000 |
5 |
10 |
- |
200 |
10 |
10 |
40 |
| Digestion |
Multi Acid |
Multi Acid |
Multi Acid |
Multi Acid |
Sulfuric acid |
- |
Multi Acid |
Fire Assay |
Multi Acid |
Multi Acid |
| Technique |
ICP-MS |
ICP-ES |
ICP-MS |
ICP-ES |
AAS |
- |
ICP-MS |
AAS |
ICP-MS |
ICP-MS |
* Overlimit for Mo >8000 at ALS, SGS and >1,000 for Skyline and >3,200 for Bureau Veritas
11.2.9 QUALITY ASSURANCE & QUALITY CONTROL PROGRAMS
Blanks, certified reference materials (CRM), and coarse preparation duplicates were introduced in the sample stream to monitor and detect cross-contamination, sample swap, and sub-sampling procedures, along with monitoring the precision & accuracy of the assay results. A random subset of samples was also used for inter-lab check validation. For the Gold Pulps assaying, QAQC materials (blanks, CRMs, and duplicates) were also inserted initially with the composite pulp samples at both ALS and Skyline. Once Skyline started the gold assays on individual pulp samples, no QAQC material was inserted during the transitions from analyzing composite pulp samples to individual pulps. Therefore, 5% (149 samples) randomly selected subset of pulps were sent for re-analysis at ALS to validate the Skyline data (see section 12.2.10 below).
The insertion rate of the CRMs (i.e., standards), blanks and coarse preparation duplicates were one in every 20 samples. Overall, Hudbay's QAQC program included 5.2% blanks, 5.2% CRMs, 2.2% pulp duplicates, and 2.2% pulp duplicate for interlaboratory checks (i.e., 680 randomly selected pulps). The standards and blanks were prepared by Ore Research and Exploration (OREAS) laboratories. Table 11-9 presents the expected values for each blank and CRM.
11.2.9.1 THRESHOLD FOR BLANKS FAILURE
Blank failure due to possible cross-contamination or samples swap is commonly recorded when a blank value exceeds five times the Lower Limit of Detection (LLD) value set by the analytical laboratory. Some blanks however may have concentrations of the elements of interest above the LLD (Most blanks yield values at or above the certified best value (CBV) plus three standard deviations), thus a practical failure threshold of 40 ppm for Cu and 5 ppm for Mo were used. Gold and silver for the analyzed blanks only have indicative values, so a practical failure threshold of 50 ppb and 1 ppm were used respectively.
In case of failure of a blank: the blank was re-analyzed together with the preceding and following three samples. If a blank failed for a second time after reanalysis, the practice would have been to re-assay the full batch associated with the failed blank. However, the latter case has not occurred to date. Samples that failed commonly reported high values because of minor subeconomic carryover at sample preparation from preceding high-grade samples (i.e., Significant differences between the weight of the preceding drill core (~15 lb. [~6 to 7 kg]) and the weight of the blank material (~1 lb. [~500 g]) magnify the effect of carryover due to sample preparation). However, the observed carryover is minimal and lower than the accepted analytical carryover in most labs (< 1%). The preparation carryover effect is minimized in the laboratories by cleaning the equipment between each sample with compressed air. A wash with barren material was requested when samples were re-analyzed to better constrain the level of analytical carryover. If a re-assayed blank failed for a second time, the procedure would be to re-assay the full sample tray corresponding to the failed blank. However, this has not been required for any of the blanks re-assayed since the 2022 PEA report.
11.2.9.2 THRESHOLD FOR CRMS FAILURE
Failure due to analytical bias was recorded based on the Certified Best Value (CBV) and standard deviation (SD) of the CRMs analyzed at each laboratory. The CRM performance gates (Table 11-9) are a result of round robin tests reported in each of the OREAS certificates:
- The failure threshold was set based on the reported CBV and standard deviation (SD) of the assayed CRMs.
- The CRM assay values were accepted when within CBV±2SD and isolated values between CBV±2SD and CBV±3SD. The CRM assay values outside CBV±3SD were considered failures.
- The absolute analytical bias was estimated based on the CBV and standard deviation (SD) of the assayed CRMs (Table 11-9) with respect to the Lab mean for the analyzed CRMs.
In case of CRMs failure, the 12 preceding and 12 following samples were re-assayed. In case of repeated failure, the procedure would be to re-assay the full sample tray corresponding to the failed CRM samples, but this has not been required for any of the CRMs re-assayed since 2022 PEA report.
TABLE 11-9: BLANKS & CRMS EXPECTED VALUES (2020-2023 DRILLING)
| CRM |
Type |
Material |
Cu (%) |
Cu STDV |
Mo (%) |
Mo STDV |
Ag
(g/t) |
Ag STDV |
Au
g/t) |
Au
STDV |
CuSS
(%) |
CuSS
STDV |
S (%) |
S
STDV |
Ca
(%) |
Ca
STDV |
| OREAS 21e |
Fine blank |
Quartz sand + 0.5% iron oxide |
0.000568 |
0.000081 |
0.000069 |
0.000005 |
n/a |
n/a |
0.005 |
n/a |
n/a |
n/a |
n/a |
n/a |
n/a |
n/a |
| OREAS 22f |
Fine blank |
Grey pigmented quartz |
0.00106 |
0.00005 |
0.0002 |
0.0000109 |
n/a |
n/a |
0.005 |
n/a |
n/a |
n/a |
n/a |
n/a |
0.027 |
0.003 |
| OREAS 22h |
Fine blank |
Quartz sand + 0.5% iron oxide |
0.00062 |
0.0000364 |
0.00006 |
0.00001 |
n/a |
n/a |
0.005 |
n/a |
n/a |
n/a |
n/a |
n/a |
0.009 |
0.001 |
| OREAS C27e |
Coarse blank |
Rhyodacite Blank Chip |
0.00141 |
0.00014 |
0.000244 |
0.0000187 |
0.149 |
0.0000032 |
0.005 |
n/a |
n/a |
n/a |
0.33 |
0.003 |
0.91 |
0.03 |
| OREAS 21f |
Standard |
Quartz sand + 0.5% iron oxide |
4.900 |
0.51 |
0.48 |
0.06 |
0.1 |
n/a |
0.005 |
n/a |
n/a |
n/a |
n/a |
n/a |
n/a |
n/a |
| OREAS 152a |
Standard |
Copper ore from a porphyry Cu-Au-Mo-S deposit |
0.385 |
0.009 |
0.008 |
0.0005 |
1 |
n/a |
0.116 |
0.005 |
n/a |
n/a |
0.921 |
0.046 |
n/a |
n/a |
| OREAS 153a |
Standard |
Copper ore from a porphyry Cu-Au-Mo-S deposit |
0.712 |
0.025 |
0.0177 |
0.0009 |
1 |
n/a |
0.311 |
0.012 |
n/a |
n/a |
1.27 |
0.07 |
n/a |
n/a |
| OREAS 153b |
Standard |
Copper ore + Cu concentrate (0.76%) |
0.678 |
0.015 |
0.0163 |
0.00105 |
1.4 |
0.09 |
0.313 |
0.009 |
n/a |
n/a |
1.28 |
0.034 |
1.83 |
0.078 |
| OREAS 901 |
Standard |
Low grade oxide copper-gold ore |
0.141 |
0.005 |
0.000336 |
0.0000234 |
0.439 |
0.06 |
0.363 |
0.0183 |
0.083 |
0.004 |
0.036 |
0.005 |
0.092 |
0.006 |
| OREAS 902 |
Standard |
Low grade transitional copper ore |
0.301 |
0.008 |
0.00122 |
0.000065 |
0.343 |
0.04 |
0.05 |
n/a |
0.111 |
0.011 |
1.76 |
0.064 |
4.05 |
0.142 |
| OREAS 905 |
Standard |
Blend of copper oxide ore and barren weathered rhyodacite |
0.1533 |
0.0061 |
0.000327 |
0.0000262 |
0.518 |
0.095 |
0.391 |
0.009 |
0.1272 |
0.0065 |
0.066 |
0.006 |
0.59 |
0.028 |
| OREAS 907 |
Standard |
Blend of copper oxide ore and barren weathered rhyodacite |
0.638 |
0.019 |
0.000588 |
0.0000384 |
1.35 |
0.115 |
0.1 |
0.004 |
0.533 |
0.019 |
0.069 |
0.006 |
0.502 |
0.019 |
| OREAS 908 |
Standard |
Blend of copper oxide ore and barren weathered rhyodacite |
1.26 |
0.029 |
0.000953 |
0.0000577 |
2.4 |
0.109 |
0.187 |
0.007 |
1.06 |
0.047 |
0.128 |
0.007 |
0.418 |
0.017 |
11.2.9.3 BLANKS QAQC RESULTS
Only the certified copper and molybdenum values are considered highly reliable in Table 11-10. The values for soluble copper and silver (except OREAS C27e) in these blanks are indicative and no values for standard deviation are reported in the certificate to properly calculate a failure threshold. No indications of contamination or sample swapping were found in the data available regarding the gold pulp assaying program (Table 11-11).
TABLE 11-10: BLANKS QAQC RESULTS SUMMARY (2022 DRILLING)
| |
Skyline |
| |
OREAS 21e (60 blanks) |
OREAS 22h (251 blanks) |
| |
expected value |
value > threshold |
Max value
reported |
expected value |
value > threshold |
Max value
reported |
| Cu (ppm) |
5.68 |
40.00 |
0.0% |
25.9 |
6.2 |
40.00 |
2.0% |
78 |
| CuSS (%) |
- |
- |
- |
- |
- |
- |
- |
- |
| Ag (ppm) |
<0.05 |
1.00 |
0.0% |
0.30 |
<0.05 |
1.00 |
0.0% |
3.40 |
| Mo (ppm) |
0.69 |
5.00 |
0.0% |
2.8 |
0.6 |
5.00 |
0.4% |
10.9 |
| Au (ppm) |
0.005 |
0.05 |
0.0% |
0.0025 |
0.005 |
0.05 |
0.0% |
0.009 |
| |
OREAS C27e (248 blanks) |
OREAS 21f (194 blanks) |
| |
expected value |
value > threshold |
Max value
reported |
expected value |
value > threshold |
Max value
reported |
| Cu (ppm) |
14.1 |
40.00 |
10.9% |
732 |
4.9 |
40.00 |
2.6% |
6523 |
| CuSS (%) |
- |
- |
- |
- |
- |
- |
- |
- |
| Ag (ppm) |
0.149 |
1.00 |
0.4% |
1.20 |
<0.05 |
1.00 |
0.0% |
1.00 |
| Mo (ppm) |
2.44 |
5.00 |
7.7% |
597 |
0.48 |
5.00 |
0.5% |
7.1 |
| Au (ppm) |
0.005 |
0.05 |
0.0% |
0.0025 |
0.005 |
0.05 |
0.5% |
0.103 |
| |
ALS |
| OREAS 21e (46 blanks) |
OREAS 22h (393 blanks) |
| expected value |
value > threshold |
Max value
reported |
expected value |
value > threshold |
Max value
reported |
| Cu (ppm) |
5.68 |
40.00 |
0.0% |
20.7 |
6.2 |
40.00 |
1.0% |
1475 |
| CuSS (%) |
- |
- |
- |
- |
- |
- |
- |
- |
| Ag (ppm) |
<0.05 |
1.00 |
0.0% |
0.02 |
<0.05 |
1.00 |
0.5% |
1.64 |
| Mo (ppm) |
0.69 |
5.00 |
0.0% |
0.9 |
0.6 |
5.00 |
0.5% |
3.4 |
| Au (ppm) |
0.005 |
0.05 |
0.0% |
0.027 |
0.005 |
0.05 |
0.5% |
0.378 |
| |
OREAS C27e (386 blanks) |
OREAS 21f (348 blanks) |
| expected value |
value > threshold |
Max value
reported |
expected value |
value > threshold |
Max value
reported |
| Cu (ppm) |
14.1 |
40.00 |
13.5% |
382 |
4.9 |
40.00 |
1.1% |
10000 |
| CuSS (%) |
- |
- |
- |
- |
- |
- |
- |
- |
| Ag (ppm) |
0.149 |
1.00 |
0.0% |
0.41 |
<0.05 |
1.00 |
0.6% |
2.49 |
| Mo (ppm) |
2.44 |
3 |
6.7% |
14.5 |
0.48 |
5.00 |
0.6% |
9.69 |
| Au (ppm) |
0.005 |
0.05 |
0.0% |
0.017 |
0.005 |
0.05 |
0.6% |
0.197 |
| Blank failure = > 5x the detection limit or expected value +3 standard deviation (µ) |
| Cells in grey = indicative value only |
TABLE 11-11: BLANKS QAQC RESULTS SUMMARY (GOLD PULP COMPOSITES)
| |
Skyline |
| |
OREAS 46 (24 blanks) |
OREAS 260 (26 blanks) |
| |
expected value |
value > threshold |
Max value
reported |
expected
value |
value > threshold |
Max value
reported |
| Au (ppm) |
0.005 |
0.05 |
0.0% |
0.0025 |
0.005 |
0.05 |
0.0% |
0.02 |
| |
ALS |
| |
OREAS 46 (27 blanks) |
OREAS 260 (28 blanks) |
| |
expected value |
value > threshold |
Max value
reported |
expected
value |
value > threshold |
Max value
reported |
| Au (ppm) |
0.005 |
0.05 |
0.0% |
0.027 |
0.005 |
0.05 |
0.0% |
0.022 |
11.2.9.4 CRMS QAQC RESULTS
The relative bias for an element of interest is evaluated using the following equation:

where Aveo is the average assay values excluding outliers (i.e., values outside AV±3SD), and CBV is the certified best value as indicated in Table 11-9.
Based on the results presented in Table 11-12, no significant analytical biases were observed for Cu, Mo and CuSS and Au. This indicates that the biases demonstrated by these CRMs could be an artifact of the low Ca content, and that the reported Ca values at ALS are acceptable. No significant biases were observed in the CRMs for the gold pulp samples at either Skyline or ALS (Table 11-13).
The quality of the sulfur data analyzed at Bureau Veritas during previous campaigns (Hudbay Minerals Inc., 2022), was reassess based on the existing QAQC data. The analyzed standards cover a wide range of S values from close to the LLD at Bureau Veritas (0.1% by ICP), up to 1.7%, but in all cases, there seems to be a systematic issue with reporting the data for these standards, even at levels above the lab LLD (Table 11-14). Random values and systematic biases were not observed at ALS or Skyline for the same standards, especially when considering the standards with high S contents, and the S results are comparable between ALS and Skyline.
TABLE 11-12: CRM QAQC RESULTS SUMMARY (2021-2022 DRILLING)

TABLE 11-13: CRM QAQC RESULTS SUMMARY (GOLD PULP COMPOSITES)

There were 175 samples analyzed at Bureau Veritas for which total sulfur data was obtained using both LECO and ICP. For this data subset, 82 samples with results below the limit of detection by ICP were replaced by half the lower limit of detection (0.05%). These samples for the most part corresponded to values of 0.01% (the LLD of S by LECO), with 26 values between 0.02% and 0.08%. A regression analysis for the available sulfur data by LECO and ICP indicated that for all 175 of the available samples, the data showed a good degree of correlation, with some deviation towards LECO at values above ~2.5% S (Figure 11-1a). For values above the LLD by ICP, excluding the two outliers (n=91), the degree of correlation between the two methods improves (Figure 11-1b). It was concluded that the total sulfur data by LECO and ICP were comparable within analytical uncertainty, but with a minor deviation toward the LECO data. This deviation, upon removal of the two outliers, is in the order of <10%, and mainly at values above 2.5% sulfur. Given that LECO is a more accurate analytical technique, it therefore implies that the Bureau Veritas ICP data slightly underestimates the %S. These results are consistent with the findings of the standards discussed above. Based on the findings, a correction protocol was proposed for the existing Bureau Veritas sulfur data (see section 11.2.10 below).
FIGURE 11-1: COMPARISON BETWEEN SULFUR BY LECO & ICP AT BUREAU VERITAS

TABLE 11-14: CRM QAQC RESULTS SUMMARY FOR SULFUR FROM BUREAU VERITAS (PRE-2021 DRILLING)

11.2.9.5 COARSE PREPARATION DUPLICATES
A total of 1192 coarse preparation duplicates were analyzed by the commercial laboratories: 625 at Skyline, and 567 at ALS (Table 11-15). This represents an insertion rate of 4%. Coarse preparation duplicates represented two splits of the same sample after crushing. Each split was pulverized, independently labelled with consecutive numbers, and analyzed immediately after its original pair.
The evaluation of coarse duplicate assay results is based on the hyperbolic method developed by AMEC (Simón, 2004). If the failure rate is less than 10% of sample duplicates, the precision is considered acceptable. Overall, the preparation and sub sampling procedures at the various labs can be regarded as satisfactory.
TABLE 11-15: COARSE DUPLICATES QAQC RESULTS SUMMARY (2022-2023 DRILLING)

11.2.10 EXTERNAL CHECKS
A total of 680 existing pulp samples previously analyzed at four different primary laboratories were reclaimed and dispatched to two secondary Umpire laboratories: 130 from SGS to Skyline, 100 from ALS to Skyline, 285 from Bureau Veritas to ALS, and 165 from Skyline to ALS (Table 11-16). The analytical protocols used by the Umpire laboratories were analogous to the protocols used by the primary laboratory. This represents an overall insertion rate of 2.2% since Oct 12, 2021. Along with the check samples for each secondary laboratory, a suite of CRMs, blanks, and prep duplicates were inserted in the sample stream, and prepared and analyzed following the same protocols used for monitoring the performance of the primary laboratory (the overall results of the CRMs, blanks and duplicate data indicate that both Skyline and ALS achieved good levels of precision and accuracy).
The evaluation of the duplicate pulps assay results was based on a Reduced-to-Major-Axis regression ("RMA") method (Kermack & Haldane, 1950). The RMA regression calculates an unbiased fit for values that are independent of each other, where both the X and Y variables have an implicit analytical error. The coefficient of determination (R2) is used to assess the variance explained by the linear relationship between the pairs. The bias is calculated as: Bias (%) = 1 - RMAS, where RMAS is the slope of the RMA regression.
The overall RMA regression analysis, however, indicates the accuracy (i.e., analytical bias) achieved for copper, soluble copper, sulfur, and gold between Bureau Veritas, ALS, SGS, Skyline, and their respective secondary laboratories was of good quality and was reproducible within analytical uncertainty. Some differences were related to a nominal number of outlier samples (e.g., for Cu, S) with higher grades than most of the samples. The accuracy for molybdenum and silver between ALS, SGS and Skyline was lower, indicating that the overall analytical performance at Skyline with respect to the analysis of Mo and Ag was not optimal.
TABLE 11-16: EXTERNAL CHECK ASSAY RESULTS SUMMARY (2020-2021 DRILLING)

11.2.10.1 SULFUR CORRECTION FOR THE PRE-2021 BUREAU VERITAS SULFUR DATA
A randomly selected subset of 374 samples from the 2020-2021 drilling campaigns was analyzed at Bureau Veritas, ALS, and SGS. An RMA analysis for sulfur between the data for ALS & SGS, regarding the data from Bureau Veritas, indicated sulfur underestimation of about 11 to 16% at Bureau Veritas, with ALS and SGS displaying similar results (Table 11-17). Given the similar level of accuracy in sulfur determination between ALS and SGS, combining the ALS and SGS data and comparing it to the Bureau Veritas data indicates an overall (-) bias of 13.7% (Figure 11-2a). About 1/3 of the sulfur data has been reported at <LLD, causing a significant departure from linearity at uncertain sulfur levels below the limit of detection (0.1%). Reassessing the sulfur data for values above the LLD (0.1%) causes the level of correlation to improve and indicates an overall bias of 10% (Figure 11-2b). The data for the available interlaboratory check assays from the 2020 – 2021 campaign thus confirms a systematic negative bias at Bureau Veritas, as was initially observed with the data from the OREAS standards. Based on the above results, a linear equation obtained from the Regression Analysis (y = 1.1083x + 0.0501, R² = 0.9719) can used to level the Bureau Veritas sulfur data form the 2014 – 2015 and 2020 – 2021 drilling campaigns, with respect to the combined data from ALS & SGS. This equation minimized the effect of values below the limit of detection at Bureau Veritas (0.1%), and was applied to S > 0.1%, providing a correction factor of 10%.
TABLE 11-17: EXTERNAL CHECK ASSAY FOR SULFUR AT BUREAU VERITAS, ALS & SGS
(2020-2021 DRILLING)
| Lab1 |
Lab2 |
No. of
Samples |
RMA Regression |
Bias |
| R2 |
Slope |
Intercept |
| BV |
ALS |
125 |
0.9912 |
0.8371 |
0.04194 |
16.3% |
| SGS |
125 |
0.9635 |
0.8889 |
0.1358 |
11.1% |
| SGS |
BV |
124 |
0.9964 |
1.1488 |
0.000122 |
-14.9% |
FIGURE 11-2: COMPARISON BETWEEN SULFUR ANALYSIS AT BUREAU VERITAS VS ALS & SGS

11.2.10.2 GOLD PULPS ASSAY VALIDATION
Once Skyline started the gold assays on individual pulp samples, no QAQC material was inserted. This was an involuntary omission at Skyline during the transition from analyzing composite samples to individual pulps. Therefore, to validate the Skyline gold data, a 5% (149 samples) randomly selected subset of pulps was sent to ALS for re-analysis.
Together with the check pulp samples, a suite of standards (9), blanks (12), and prep duplicates (1) were inserted in the sample stream to monitor the performance at ALS. The overall results indicated that ALS achieved good levels of precision and accuracy.
An RMA analysis for gold between the original data at Skyline and the re-analysis at ALS indicates an overall bias of 6% at Skyline with regard to ALS. (y = 0.9396x + 0.0013, R² = 0.8927) (Figure 11-3a). Most samples, however, have gold values below 125 ppb, with more significant discrepancies at higher gold values. Thus, excluding three far outliers above 125 ppb, the bias decreases to 0.2% (y = 0.998x + 0.0006, R² = 0.934) (Figure 11-3b), indicating that there is no statistically significant difference between the ALS and Skyline datasets, and the gold data from Skyline can be accepted with confidence.
FIGURE 11-3: COMPARISON BETWEEN GOLD ANALYSIS AT ALS VS SKYLINE

11.2.11 CONCLUSION
In the opinion of the author, the QAQC results from the drill campaigns that were completed between the beginning of 2020 and the effective date of this Technical Report demonstrate that the precision and accuracy of the assay results are of adequate quality and can be used for resource estimation purposes.
12 DATA VERIFICATION
Data verification and validation was conducted under the supervision of the author and Qualified Person, Olivier Tavchandjian, P. Geo., Hudbay's Senior Vice President, Exploration and Technical Services. Data verification performed prior to 2017 was reviewed and documented in the 2017 Technical Report. The following section provides a summary of the material information in relation to the work performed prior to 2017 and describes the data verification and validation for the 2021 - 2022 drilling campaigns, built upon Hudbay's 2022 PEA report which highlighted the data verification and validation for the 2020 - 2021 drilling.
12.1 SUMMARY OF EARLIER WORK (1956 -2017)
TABLE 12-1: SUMMARY OF VERIFICATION PRIOR TO 2020-2021 CAMPAIGN
|
|
Anaconda
(1956-1964)
|
Anamax
(1973-1985)
|
Asarco
(1988-2004)
|
Augusta
(2006-2012)
|
Hudbay
(2014-2015)
|
Hudbay
(2020-2021)
|
|
Collar surveys
|
Local grid converted to NAD83 UTM zone 12N by Augusta in 2005.12 historical holes were re-surveyed via differential GPS to validate the converted coordinates
|
Differential GPS
|
Differential GPS
|
Estimated based on surveyed & certified pad outlines.
|
|
Downhole surveying method
|
3 holes have single shot downhole survey data - survey method for 6 additional incline holes is unknown. All other holes are vertical
|
18 holes have gyroscope downhole survey data - survey method for 35 additional incline holes is unknown. All other holes are vertical
|
No downhole survey available - all holes are vertical
|
Reflex EZ-Shot with measurement every 500 ft
|
Reflex EZ-Shot every 200 ft while drilling and gyroscope (gyro tracer) every 50 ft before closing the holes
|
Reflex EZ-GYRO™ or SPINT-IQ™ every 100 ft
|
|
Procedures
|
n/a
|
n/a
|
n/a
|
Written procedures for logging & sampling
|
|
Drillhole database
|
paper
|
paper
|
paper
|
Microsoft Access
|
FileMaker Pro database
|
|
Data security
|
n/a
|
n/a
|
n/a
|
Samples kept in locked storage, closed-circuit video surveillance (2005-2008) and 24 hours-per-day site security (2011-2012) & Database manager with secured drive and server
|
Samples kept in locked storage, 24 hours-per-day site security & Database manager with secured drive and server
|
Samples kept in locked storage, 24 hours-per-day site security & Database manager with secured drive and server
|
|
Assay results verification
|
n/a
|
n/a
|
n/a
|
Re-logging and re-assaying program to validate the quality of the historical analysis (5 Anaconda DHs, 4 Anamax DHs and 1 Asarco DH)
|
Re-created the full historical database from scans of the original paper certificate (via Orix Geoscience)
|
Original assays were periodically verified (independently by the database manager and a senior geologist) by comparing the results entered in the database against the original PDF certificates provided by the various analytical labs.
|
12.2 DRILL COLLAR & DRILL PAD SETUP
Drill collar locations and orientations were planned using Leapfrog Geo. Hudbay field personnel guided the drill supervisor or lead driller to the correct locations. Similar protocols continued throughout 2021 - 2022, where azimuth guidelines were marked with spray paint directly on the pad for the drill rigs to line up. Also, Hudbay continued using TN14 rig alignment tool in conjunction with IMDEX HUB-IQ™ online Hub to set and record drill hole orientations, rig alignments, and downhole surveys.
12.3 COLLAR SURVEY
All collars from the 2020 program were surveyed by differential GPS. Most collar locations from 2021 through to 2022 were estimated based on surveyed and certified pad outlines. 124 collars in late 2022 had surveys taken directly over the marked collar location after drilling using high precision GPS. All the 2021 and 2022 collar locations were visually checked against surveyed roads and pads to confirm their locations were reasonably within the drill pads. Given the shallow depth of the mineralization, its 3D continuity, and the proposed mining method (i.e., open pit), the accuracy of collar locations being set to the approximate center of surveyed drilling pads will not cause a material issue for the mineral resource estimates.
12.4 DOWNHOLE SURVEY METHOD
During 2021 & 2022, drill holes continued to be surveyed either via a Reflex EZ-GYRO™ or a SPRINT-IQ™ downhole survey tool at 100-foot (30 m) intervals. A limited number of diamond drillholes did not have downhole survey data either because the hole had to be abandoned before the survey (eight DDHs), or the data was lost (seven DDHs). Holes without surveys were not used for the mineral resource estimate, except for a few very short vertical holes.
12.5 PROCEDURES FOR GEOLOGISTS & TECHNICIANS
Written procedures from the 2014 - 2015 Hudbay drill campaigns were the same ones followed during the 2020 - 2022 logging and sampling program. Geologists who worked on the previous campaigns trained the new geologist in 2021 and 2022. Geologists and technicians were supervised by more experienced staff until proven proficient. Daily task tracking and periodic review ensured procedures were being followed.
12.6 INSPECTION OF LABORATORIES BY HUDBAY PERSONNEL
All the laboratories used for recent drill campaigns were visited by Hudbay personnel at various times between 2020 and 2023. The purpose of these visits was to review the procedures, quality controls, and general housekeeping of the facilities.
12.7 DRILL HOLE DATABASE
Hudbay used Filemaker Pro to store all the drilling, logging, sampling, sample dispatching, assaying, and QAQC information. This database contains all the validated historical drilling information as well as the Augusta Resources drilling and Hudbay drilling, including the information from the 2014 - 2015 and 2020 - 2022 drilling campaigns.
12.8 DATA SECURITY
The assay database continues to be administered by the database manager, with working copies kept on the local drive of a secure computer, and backups placed in a secure location on a Hudbay server. Any edits to the database are requested directly of the database manager who updates all the copies and ensures data consistency among the various electronic storage devices. All the laboratory assay certificates and logs are stored on the Hudbay server.
12.9 ASSAY RESULTS VERIFICATION
In 2020, Hudbay hired Orix Geoscience to perform a validation of the existing historical drilling data for Broadtop Butte, the West, and Peach-Elgin deposits. The objective of this validation was to perform checks on a minimum of 20% of the samples from these drilled areas, by comparing the results entered in the database against the original certificates. Overall, approximately 1% of the data were found to have errors, mostly due to unavailable pdf logs or assays results at the time of initial data entry and validation. The error rate was the highest for the West deposit attaining 11%, but primarily affecting Ag values. Historical drilling in the West deposit represents approximately only 25% of the sample composites used for grade estimation in this zone.
Furthermore, 5% of the 2014 - 2015 assay results in the main database were validated by Hudbay against the original assay certificates. The original certificates were downloaded from the Bureau Veritas WebAccess system and imported into a clean database to create the validation set. No differences were found. During the 2020 - 2022 drilling campaigns, original assays were periodically verified (independently by the database manager and a senior geologist) by comparing the results entered in the database against the original PDF certificates provided by the various analytical labs. No issues with the database based on such visual inspections of the original certificates against the database were found, indicating an accurate correspondence of the data.
In 2021 Hudbay performed a test over the East deposit with the objective of assessing if the historical drilling results had a grade bias when compared to the more recent drilling results. Given the fact that there are no true twin holes, a pair analysis on blocks interpolated by nearest neighbors from historical drillholes (i.e., pre-Augusta) and holes drilled by Augusta & Hudbay was conducted.
Based on this analysis, no significant grade bias on copper was observed on the blocks both interpolated from historical and "new" drillholes. A grade difference ranging from 1% to 4% was observed depending on the distance subset used (respectively 200 feet and 100 feet [60 m and 30 m]).
The same test was conducted at the Peach satellite deposit, comparing the block interpolated via the churn drillholes (historical data) and the diamond drillholes drilled by Hudbay in 2020 - 2021. In this case also, there was no significant grade difference observed between the two data sets.
12.10 SITE VISITS
Hudbay personnel have visited the Project area to conduct site inspections, become familiar with the conditions on the property, observe the geology and mineralization, perform drill core reviews, and verify the work completed on the property as part of the mineral resource estimation and technical report process since 2014, through 2020 to 2023.
12.11 CONCLUSION
Based on these data verification procedures, the author's opinion is that the data is of adequate quality for the purposes used in this Technical Report.
13 MINERAL PROCESSING & METALLURGICAL TESTING
13.1 METALLURGICAL TESTING PROGRAMS
Historical metallurgical testing of the East Deposit (previously Rosemont), conducted by previous owners of the property, includes programs initiated by Anamax Mining Company (1974-1975) and by Augusta Resource Corporation (2005 - 2013). Between 2005 and 2013, Augusta completed a series of metallurgical test programs to support the preparation of the 2007 (M3 Engineering and Technology Corporation, 2007), 2009 (M3 Engineering and Technology Corporation, 2009) and 2012 (M3 Engineering and Technology Corporation, 2012) NI 43-101 technical reports. These historical test programs were predominately carried out by Mountain States R&D International Inc. (MSRDI), SGS and G&T Metallurgical Laboratories (G&T). These test programs are described in length in past technical reports, mostly focused on comminution and flotation of the mineralization, and are therefore only summarized in this Technical Report.
Following the acquisition of the Project in 2014, Hudbay undertook a series of drilling, sampling and metallurgical programs focused on the East Deposit. The objective of the testing campaign was to improve the correlation between mineralogy and/or geology and metallurgical characteristics, considering mineral processing through flotation. Metallurgical and mineralogical tests were primarily performed by XPS Consulting & Test Work Services (XPS); with SGS undertaking the comminution testing. In 2015, Base Met Laboratory (BML) was engaged to perform confirmation testing and additional process optimization. Bench scale testing was performed for additional metallurgical and project engineering data. This work was to support the 2017 NI 43-101 technical report (Hudbay Minerals Inc., 2017).
Following the discovery of additional deposits on the Western side of the Copper World Project in 2021, Hudbay engaged Kappes, Cassiday & Associates (KCA), Laboratorio Metalúrgico Chapi (Chapi) and SGS to perform mineralogical and metallurgical testing on Peach, Elgin, Broadtop Butte, and East Deposit mineralization. This work was to support the 2022 NI 43-101 technical report with the objective of understanding each deposit's mineralogy and metallurgical response to both leaching and flotation.
In 2022, Hudbay contracted AMinpro, TailPro Consulting (TailPro), McClelland Laboratories, Inc. (McClelland), Blue Coast Research (BCR), SGS, and Glencore Technology. Each performed various aspects of a more comprehensive test program designed to validate findings and assumptions from the 2022 technical report (Hudbay Minerals Inc., 2022), establish project engineering data and better understand the mineralogy of the various mineralization zones at Copper World and how they relate to metallurgical response.
13.2 SAMPLES & REPRESENTATIVITY
The first metallurgical testing on the East Deposit from 1974 - 1975 by Anamax Mining Company, was performed on eight different intervals from two diamond drill holes. The work performed to support Augusta's NI 43-101 technical reports tested deposit composites (lithological and a period composites) and variability samples. Bulk surface samples were also taken for column leach tests. The samples were considered to fairly represent the East Deposit in Augusta's technical reports. However, they often had poor spatial representativity and are made up of sample interval sequences from a limited number of holes.
The XPS and Base Met test programs studied production period (Base 1, 2 and 3) and geometallurgical subtype (elevated copper oxide ore, swelling clay rich ore, magnesium clay rich ore and hard sulfide ore) composite samples from East Deposit, as well as variability samples. All samples were diamond drill core samples and are considered representative of East Deposit.
The 2021 test program included composite samples from Peach ("Peach Pit"), Elgin ("Elgin Pit"), Broadtop Butte ("Broadtop Transitional"), and East Deposit ("East Transitional"). The composite samples were formed by combining randomly selected and spatially distributed 30 - 50 ft (9 - 15 m) intervals of half-core. Peach and Elgin samples were representative of the entire mineral deposits and not separated by oxide and sulfide portions, whereas the Broadtop Butte and East Deposit composites were mostly representative of transitional/oxide mineralization (copper present primarily as secondary copper sulfides and copper oxides). The program also included testing of randomly selected and spatially distributed variability samples.
The 2022 test program included a composite sample from each of Peach-Elgin ("Peach-Elgin Mill"), Broadtop Butte - Bolsa ("Broadtop Mill") and two production period composite samples from the East Deposit ("East Pit" and "East Pit Future"). These samples were formed by combining randomly selected and spatially distributed 50 ft (15 m) intervals of half-core which were designated as potential mill feed as per the mine plan used in the 2022 technical report. Additionally, variability samples were tested, which were randomly selected and spatially distributed across the Copper World Project. For oxide leach test work bulk surface samples were collected along with randomly selected variability samples from each deposit. These samples were selected to capture the variation in acid consuming gangue and acid soluble copper content expected as oxide leach feed as per the 2022 PEA mine plan.
Although composite samples in all the above test programs are no longer accurate when referenced to the current mine plan, the vast number of composite and variability samples that have been tested has allowed for a comprehensive understanding of the variety of mineralization conditions within the Copper World Project. Where possible, recovery estimates and design criteria are correlated to mineralogy and are typically based on variability testing.
13.3 MINERALOGY
Prior to Hudbay's acquisition of the Project mineralogical characterization was limited. Augusta contracted MSRDI to characterize five East Deposit samples representing different lithologies. They examined two samples from the Horquilla formation and one from each of the Earp, Colina and Epitaph formations. The general conclusions from this work, which remained valid across future more extensive test programs, were:
- The main copper sulfide minerals are chalcopyrite, bornite and chalcocite/covellite. The deportment of copper between these minerals is variable.
- Copper sulfide minerals liberate at coarse sizes, and mineralogy suggests a primary grind size coarser than 150 μm is feasible.
- Low pyrite content combined with the metallurgically favorable blend of copper sulfide minerals suggests the potential to produce high grade flotation concentrates.
To gain a better understanding of the mineralogical characteristics of the East Deposit, Hudbay undertook an extensive test program at XPS Consulting & Testwork Services (XPS). The test program characterized variability and composite samples using X-ray diffraction (XRD) with Rietveld Refinement, Cation Exchange Capacity (CEC), near-infrared spectroscopy (NIR), Quantitative Evaluation of Minerals by Scanning Electron Microscopy (QEMSCAN) and Electron Probe Micro-analysis (EPMA). Results of the composite sample mineralogy are given in Table 13-1. Additional mineralogy, employing SEM-EDX and XRD, was performed at BML on production period composites which validated the conclusions drawn from the XPS test program. The following generalizations with respect to the East Deposit were made:
- Copper deportment between sulfide copper species is variable, however there is an increasing proportion of Cu carried in chalcopyrite at depth.
- Copper oxide content is variable and continues at depth.
- Widespread clay presence is observed with Mg clay content increasing with depth.
- The primary gangue minerals are quartz, feldspar, andradite, and calcite. Calcite content increases with depth while quartz, feldspar, and andradite decrease.
TABLE 13-1: QEMSCAN & TIMA MODAL ABUNDANCE OF XPS EAST DEPOSIT COMPOSITE SAMPLES
| Mineral |
Base 1 |
Base 2 |
Base 3 |
Elevated
Copper Oxide |
Elevated
Swelling Clay |
Elevated
Mg Clay |
Hard |
| Chalcopyrite |
0.4 |
0.9 |
1.0 |
0.3 |
0.7 |
1.0 |
0.7 |
| Bornite |
0.2 |
0.2 |
0.1 |
0.1 |
0.1 |
0.3 |
0.3 |
| Chalcocite/Covellite |
0.1 |
0.2 |
0.1 |
0.2 |
0.4 |
0.0 |
0.1 |
| 2nd Cu-Silicates-Oxides |
0.1 |
0.3 |
0.1 |
0.8 |
0.1 |
0.1 |
0.1 |
| Pyrite |
0.4 |
0.5 |
0.2 |
0.1 |
0.3 |
0.7 |
0.3 |
| Mg Clays |
2.2 |
3.4 |
6.4 |
1.3 |
2.6 |
18.7 |
0.9 |
| Muscovite |
0.5 |
0.9 |
1.0 |
0.8 |
3.4 |
0.5 |
2.4 |
| Chlorite |
1.7 |
2.6 |
1.8 |
2.7 |
4.0 |
3.0 |
2.0 |
| Quartz |
23.3 |
15.4 |
7.1 |
25.5 |
24.5 |
0.3 |
19.1 |
| K-Feldspar |
7.0 |
8.4 |
3.1 |
9.2 |
13.6 |
0.4 |
21.7 |
| Andradite |
24.2 |
16.5 |
14.6 |
21.7 |
8.5 |
5.8 |
11.0 |
| Calcite |
17.9 |
26.9 |
39.5 |
23.3 |
14.6 |
40.5 |
6.4 |
| Other |
22.0 |
23.8 |
25.0 |
14.0 |
27.2 |
28.7 |
35.0 |
| Total |
100.0 |
100.0 |
100.0 |
100 |
100 |
100 |
100 |
| CEC |
7.1 |
9.5 |
5.9 |
6.3 |
10.6 |
6.1 |
8.3 |
| Liberation1 of Cu Sulfides |
64 |
60 |
70 |
55 |
69 |
54 |
67 |
1Greater than 80% by area
From 2021-2023 extensive mineralogical work has been carried out by SGS on all of the Copper World deposits. Variability and composite samples were characterized by TESCAN Integrated Mineral Analyzer (TIMA) and EPMA. XRD with Rietveld Refinement, CEC and NIR were employed to define clay content. The test program was established to develop a comprehensive mineralogical understanding of all Copper World deposits, with a focus on copper mineral speciation and copper deportment. A summary of the TIMA modal abundance and the copper deportment data from the composite samples analyzed are given in Table 13-2 and
Table 13-3, respectively. The following simplifications of mineralogical variability within the Copper World can be made:
- Copper deportment to secondary copper sulfide species (bornite, chalcocite, and covelite) is more prevalent in the East Deposit than the other Copper World deposits.
- Copper mineralization includes significant contribution from chrysocolla, malachite, Cu-goethite, and wad (manganese oxides/hydroxides). This is particularly the case in transitional zones but is widespread throughout. Cu-goethite and wad minerals are typically low in Cu content and their recovery would negatively impact the grade of the concentrate.
- Widespread clay presence is observed across all deposits.
- Quartz, feldspar, andradite, and calcite are the primary gangue minerals across all deposits. Gangue mineralization follows similar trends at Broad Top as those observed at East Deposit. The other deposits show increased quartz content and decreased calcite content at depth; with feldspar and andradite being variable.
TABLE 13-2: TIMA MODAL ABUNDANCE OF COPPER WORLD COMPOSITE SAMPLES
| Mineral |
East
Transitional |
East
Pit |
East Pit
Future |
Broadtop
Transitional |
Broadtop
Mill |
Elgin
Pit |
Peach
Pit |
Peach
Elgin Mill |
| Chalcopyrite |
0.2 |
0.5 |
0.5 |
0.2 |
0.8 |
0.3 |
0.3 |
0.5 |
| Bornite |
0.1 |
0.2 |
0.1 |
0 |
0 |
0 |
0.1 |
0 |
| Chalcocite/Covellite |
0.2 |
0.2 |
0.3 |
0.2 |
0.1 |
0 |
0 |
0 |
| 2nd Cu-Silicates-Oxides |
1.5 |
0.8 |
0.5 |
1.4 |
0.6 |
0.4 |
1.1 |
0.4 |
| Cu Wad |
0.5 |
0.1 |
0.1 |
0.4 |
0.2 |
0.2 |
0.6 |
0.2 |
| Pyrite |
0.3 |
1.1 |
0.9 |
0.2 |
0.6 |
0.5 |
0.3 |
1.8 |
| Talc |
0.8 |
0.4 |
1.3 |
1.5 |
0.7 |
1.3 |
0.8 |
0.2 |
| Muscovite |
1.6 |
0.4 |
0.6 |
4.3 |
2.1 |
2.7 |
1.5 |
1.4 |
| Chlorite |
1.5 |
0.5 |
0.7 |
0.9 |
0.9 |
1.1 |
1.1 |
1.1 |
| Quartz |
24.8 |
16.2 |
16 |
39 |
28.2 |
30.7 |
22.6 |
31.7 |
| K-Feldspar |
21 |
8.8 |
7.6 |
29.2 |
19.4 |
20.7 |
7.9 |
21.8 |
| Andradite |
20.2 |
31.4 |
29.5 |
4.9 |
17.6 |
11.4 |
33.8 |
10.7 |
| Calcite |
6.4 |
10 |
9.9 |
4.2 |
4.3 |
8.7 |
5.1 |
7.1 |
| Other |
20.8 |
29.3 |
32.1 |
13.8 |
24.5 |
22 |
24.6 |
23.1 |
| Total |
100 |
100 |
100 |
100 |
100 |
100 |
100 |
100 |
| CEC |
3 |
|
|
1.8 |
|
3.6 |
3.9 |
|
TABLE 13-3: COPPER DEPORTMENT IN COPPER WORLD COMPOSITE SAMPLES
| Mineral |
East
Transitional |
East
Pit |
East Pit
Future |
Broadtop
Transitional |
Broadtop
Mill |
Elgin
Pit |
Peach
Pit |
Peach
Elgin Mill |
| Sulfide |
Chalcopyrite |
20.1 |
35.6 |
32.1 |
19.9 |
76 |
55.2 |
41.1 |
60.8 |
| Chalcocite |
32.2 |
30.3 |
44.7 |
40 |
10.7 |
14.8 |
11.3 |
6.5 |
| Bornite |
20.7 |
27 |
18.4 |
3.5 |
5.8 |
13.1 |
13 |
11.6 |
| Enargite |
0 |
0 |
0 |
0 |
0 |
0.1 |
0 |
0 |
| 2nd Cu-Silicates-Oxides |
Copper Oxide (CuO) |
5 |
0 |
0.2 |
0.2 |
0 |
0 |
0.1 |
0 |
| Malachite |
0.6 |
0.9 |
0.8 |
2.5 |
0.5 |
2 |
2.2 |
11.8 |
| Chrysocolla |
1.4 |
0.7 |
0.3 |
15.3 |
0.7 |
1.5 |
6.7 |
1.5 |
| Chrysocolla (Cu-deficient) |
0.1 |
0 |
0 |
0.4 |
0.1 |
0.3 |
0.8 |
0.2 |
| Cu-(high)-goethite |
1.4 |
0.6 |
0.1 |
2 |
0.3 |
2.2 |
2.7 |
0.4 |
| Cu-goethite |
6.2 |
2.5 |
1.5 |
5.6 |
2.5 |
2.3 |
3 |
1.6 |
| Cu-goethite (high Si) |
2.6 |
0.6 |
0.5 |
2.6 |
0.9 |
2.6 |
5.2 |
1.4 |
| Wad |
Pitch Copper Wad (Mn) |
0.7 |
0.2 |
0 |
0.6 |
0.2 |
1.3 |
2.4 |
0.6 |
| Pitch Copper Wad (Mn, Fe) |
1.3 |
0 |
0 |
0.1 |
0.1 |
0.3 |
1.5 |
0.3 |
| Cu-MnO |
0.1 |
0 |
0 |
0 |
0 |
0.1 |
0.1 |
0 |
| Cu-Mn-Chlorite |
1.3 |
0.1 |
0.1 |
0.3 |
0.1 |
0.2 |
0.5 |
0.2 |
| Cu-Chlorite |
0.2 |
0 |
0 |
0.4 |
0.1 |
0.3 |
0.3 |
0.3 |
| Low-Cu-Chlorite |
4 |
0.4 |
0.6 |
5.3 |
1.4 |
2.3 |
5.4 |
1.7 |
| Fe-Al-Silicate-low Cu |
1.1 |
0.2 |
0.2 |
0.9 |
0.5 |
1.1 |
3.2 |
1.1 |
| Other |
1.1 |
0.8 |
0.3 |
0.5 |
0 |
0.3 |
0.4 |
0.1 |
| Total |
100 |
100 |
100 |
100 |
100 |
100 |
100 |
100 |
| Sulfides |
73 |
92.9 |
95.2 |
63.4 |
92.5 |
83.2 |
65.4 |
79 |
| 2nd Cu-Silicates-Oxides |
17.3 |
5.3 |
3.5 |
28.5 |
5 |
10.8 |
20.8 |
16.9 |
| Wad |
8.7 |
1 |
1 |
7.6 |
2.4 |
5.6 |
13.5 |
4 |
13.4 COMMINUTION
The first detailed feed grindability characterization studies carried out on the East Deposit were by Augusta. Drill core samples were tested at SGS and Hazen Research, Inc. for CEET Crusher Index (Ci), SAG Power Index (SPI®), as well as Bond crusher (CWi), rod mill (RWi) and ball mill (BWi) work indices. 65 samples were characterized.
Since acquiring the Project in 2014, an additional 506 variability samples have been tested from the Copper World deposits. Across the various test programs, samples have been characterized via JK drop-weight (DWT), SMC Test®, SPI®, SAG Grindability Index (SGI), BWi and Bond Abrasion Index (Ai). Testing was performed at SGS, Chapi and AMinpro.
The combined statistics from all samples tested across Copper World are summarized globally in Table 13-4 then separated by deposit in
Table 13-5. SGI and BWi values were corrected using the results of an internal round-robin and QAQC program. The mineralization demonstrated a high degree of variability across all hardness parameters. The 75th percentile parameters were chosen as the basis for design of the comminution circuit. Work to develop geochemical and mineralogical correlations to hardness is ongoing and planned to be completed for the future Feasibility Study.
13.5 FLOTATION
The first known flotation test work was conducted on selected diamond drill core samples from East Deposit in 1974 and 1975 by MSRDI on behalf of Anamax. Eight composite samples were studied to understand their response to a flotation protocol employing AP-238 (a dithiophosphate) as collector. The impact of grind size was also examined. The test work found that sulfide copper recoveries greater than 90% were achievable. It was noted that copper recovery benefited from finer grinding and elevated reagent quantities. Poor recoveries were observed in samples elevated in copper oxides.
Augusta tested various composites (lithology and period based) as well as variability samples, across several test programs conducted by MSRDI, SGS and G&T. Various reagent suites were established from 2006 - 2013, however, ultimately a simple xanthate and fuel oil protocol was adopted. Across the various test programs and composite samples tested copper and molybdenum recoveries averaged 89% and 69%, respectively. Much like the Anamax testing, the best flotation results occurred with a relatively fine primary grind size of 80% passing 105 μm, and elevated reagent dosages. Xanthate consumption on the order of 45-60 g/t was typical. The recovery of oxide copper species was typically low.
The XPS flotation program was developed to study the impact of key geometallurgical variables (copper oxide content, swelling clays, magnesium clays and feed hardness) on copper flotation response using traditional sulfide copper flotation reagents. Test work included variability rougher kinetic flotation tests, as well as kinetic flotation tests, on production year and geometallurgical subtype composites to evaluate the effect of primary grind size, collectors, pH modifiers, dispersants, and rougher and cleaner pulp densities. These were run in parallel with open circuit and locked cycle testing. Additional batch and locked cycle test work was undertaken by BML to validate the XPS findings and for further process optimization. The findings can be summarized as follows:
- A simple reagent scheme including sodium isobutyl xanthate (SIBX) and AP-3894 (a thionocarbamate) as copper collectors and fuel oil as molybdenum collector was effective. Like previous studies elevated copper collector dosages were employed (40g/t SIBX, 5g/t AP-3894). AP-3894 was not shown to offer any appreciable benefit but it was decided at the time to retain the co-collector based on the principle that the use of co-collectors is generally acknowledged to be a beneficial practice.
TABLE 13-4: SUMMARY OF COMMINUTION DATA ACROSS ALL DEPOSITS
| Statistic |
DWT / SMC Test® |
SMC Test® |
Ci |
SGI/SPI
(min) |
CWi
(kWh/ton) |
RWi
(kWh/ton) |
BWi
(kWh/ton) |
Ai (g) |
Relative
Density |
A x b |
ta |
Relative
Density |
Mia |
Mih |
Mic |
| Samples Tested |
55 |
55 |
55 |
22 |
22 |
22 |
22 |
97 |
559 |
12 |
11 |
570 |
177 |
| Average |
2.84 |
50.5 |
0.53 |
2.84 |
16.5 |
12 |
6.2 |
17.7 |
99 |
4.9 |
10.9 |
11.6 |
0.282 |
| Standard Deviation |
0.19 |
21.1 |
0.28 |
0.21 |
4.7 |
4.2 |
2.2 |
10.1 |
57 |
1 |
2.8 |
2.4 |
0.166 |
| Minimum |
2.52 |
18.7 |
0.14 |
2.52 |
7.4 |
4.4 |
2.3 |
1 |
14 |
3.7 |
6.5 |
5.6 |
0.002 |
| Median |
2.85 |
46.7 |
0.47 |
2.85 |
16.8 |
12.1 |
6.3 |
16 |
91 |
4.7 |
10.7 |
11.8 |
0.285 |
| 75th Percentile |
2.94 |
56.3 |
0.62 |
2.93 |
19.4 |
14.4 |
7.5 |
21.4 |
121 |
5.8 |
12.9 |
13 |
0.415 |
| 90th Percentile |
3.08 |
75.6 |
0.83 |
3.09 |
21.7 |
16.7 |
8.6 |
32.9 |
173 |
5.9 |
14.5 |
14.8 |
0.514 |
| Maximum |
3.42 |
133.1 |
1.49 |
3.42 |
26.5 |
21.3 |
11 |
48.5 |
401 |
6.7 |
15 |
19.7 |
0.631 |
TABLE 13-5: 75TH PERCENTILE VALUE OF COMMINUTION DATA ACROSS EACH DEPOSIT
| Statistic |
DWT / SMC Test® |
SMC Test® |
Ci |
SGI/SPI
(min) |
CWi
(kWh/ton) |
RWi
(kWh/ton) |
BWi
(kWh/ton) |
Ai (g) |
Relative
Density |
A x b |
ta |
Relative
Density |
Mia |
Mih |
Mic |
| East Deposit |
| Samples Tested |
38 |
38 |
38 |
5 |
5 |
5 |
5 |
64 |
323 |
12 |
11 |
331 |
47 |
| 75th Percentile |
2.95 |
54.5 |
0.6 |
3.05 |
19.6 |
14.4 |
7.5 |
17.1 |
139 |
5.8 |
12.9 |
13.6 |
0.319 |
| Broadtop Butte |
| Samples Tested |
5 |
5 |
5 |
5 |
5 |
5 |
5 |
16 |
119 |
|
|
119 |
95 |
| 75th Percentile |
3.09 |
47.9 |
0.39 |
3.09 |
19.5 |
14.4 |
7.5 |
20.7 |
111 |
|
|
12.5 |
0.452 |
| West Deposit |
| Samples Tested |
5 |
5 |
5 |
5 |
5 |
5 |
5 |
8 |
32 |
|
|
32 |
18 |
| 75th Percentile |
2.85 |
70.8 |
0.71 |
2.85 |
21.9 |
16.9 |
8.7 |
31.9 |
67 |
|
|
12.4 |
0.322 |
| Peach - Elgin |
| Samples Tested |
7 |
7 |
7 |
7 |
7 |
7 |
7 |
9 |
75 |
|
|
74 |
17 |
| 75th Percentile |
2.91 |
86.9 |
0.82 |
2.91 |
16.2 |
11.5 |
6 |
35.7 |
65 |
|
|
12.2 |
0.241 |
- There was a strong relationship between copper recovery and the content of oxide copper (as determined by acid soluble copper assay) in the feed (Figure 13-1). Oxide copper species were poorly recovered but did not interfere with the flotation of sulfides, which averaged 90% recovery to the cleaner concentrate (97% rougher recovery and 93% cleaner recovery).
- Saleable concentrate grades (≥ 28%) were achieved.
- Analysis of the impact of grind size on recovery indicated a 0.6% decrease in recovery per 10 μm increase in primary grind, within the P80 range of 104 - 265 μm.
- Elevated swelling clay content did not have a large effect on rougher performance but did cause grade to decline in the cleaners as recirculating clays built up.
- Elevated magnesium clay was more toxic to flotation. High rougher mass pulls and depressed recoveries in both the rougher and the cleaners were experienced when floating samples with high magnesium clay content. Lowering the cleaner density was beneficial, but this was not tested in closed circuit where high recirculating loads may limit the degree to which low density could be maintained.
FIGURE 13-1: COMPARISON OF VARIABILITY TESTING WITH & WITHOUT CPS
COPPER RECOVERY VS. ACID SOLUBLE COPPER/TOTAL COPPER

To develop an understanding of the flotation response of Peach and Elgin, as well as Broadtop Butte and East Deposit transitional zone mineralization, batch scale rougher kinetic tests were performed by KCA on composite samples. KCA conducted flotation tests to investigate the effect of sulfide specific ion electrode (SIE) potential [controlled potential sulfidation (CPS)], primary grind size, collector (SIBX) concentration, and pH on the four composite samples. The program aimed to improve the recovery of copper oxide species.
Following the KCA test program, AMinpro and BCR were engaged to test the same KCA composite samples for validation of the results as well as to generate bulk concentrates for concentrate leach test work. Bench scale tests confirmed the results of the KCA test program. Rougher kinetic parameters of sulfide and oxide copper are summarized in Table 13-6.
Additional composite samples which were more representative of mill feed from each of the Copper World deposits were also tested at AMinpro. The effect of SIE potential (CPS), primary grind size, collector (SIBX) concentration, co-collectors, pH, and pulp density on rougher flotation were examined. In all cases, grinding finer than 150 μm, increasing the collector dosage above 10 g/t, or adjusting the pH did not significantly alter the rougher performance. The addition of NaHS to a SIE potential between -300mV to -400mV offered significant improvements in both copper oxide and sulfide recovery. Further increases in NaHS/SIE potential resulted in depression of copper sulfide minerals. The chosen rougher flotation protocol is as follows:
- SIBX 10 g/t
- Fuel Oil 20 g/t
- Natural pH
- Primary grind P80 150 μm
- SIE potential -300 mV to -400 mV
- 30 - 35% solids
TABLE 13-6: SUMMARY OF ROUGHER & CLEANER FLOTATION KINETIC PARAMETERS
| Mineralization Zone |
Rougher |
Cleaner |
| SCu |
CuSS |
SCu |
CuSS |
| k |
Rmax |
k |
Rmax |
k |
Rmax |
k |
Rmax |
| East Transitional |
1.9 |
96 |
0.3 |
64 |
|
|
|
|
| East Pit |
2 |
93 |
0.6 |
69 |
1 |
96 |
0.3 |
92 |
| East Pit Future |
2.2 |
92 |
0.6 |
73 |
1.3 |
95 |
0.5 |
79 |
| Broadtop Transitional |
1.7 |
86 |
0.3 |
57 |
|
|
|
|
| Broadtop Mill |
2.1 |
94 |
0.7 |
65 |
0.8 |
96 |
0.3 |
92 |
| West Mill |
1.9 |
89 |
0.5 |
69 |
0.8 |
96 |
0.6 |
87 |
| Elgin Pit |
3.4 |
96 |
0.5 |
72 |
|
|
|
|
| Peach Pit |
1.5 |
85 |
0.3 |
50 |
|
|
|
|
| Peach-Elgin Mill |
2.3 |
95 |
0.4 |
69 |
1.5 |
98 |
0.3 |
78 |
Following the batch rougher flotation program AMinpro produced a bulk rougher concentrate from each sample for cleaner floatation test work via a small-scale pilot setup. The effect of regrind size, percent solids, pH and collector concentration on cleaner flotation were then examined. The tests indicated similar cleaner performance for regrind size between 20μm and 38μm. All samples did require relatively elevated dosages of collector which may suggest the samples had oxidized or the collector used in the rougher stage had degraded. Rougher and cleaner kinetic parameters of sulfide and oxide copper are summarized in Table 13-6. These tests were performed in parallel to locked cycle tests for which the results are summarized in Table 13-7. Locked cycle cleaner stages were not optimized, and the cleaner scavenger tails were not recycled to the rougher. The chosen cleaner flotation protocol is:
- SIBX 1 g/t (with respect to rougher feed)
- Natural pH
- Regrind P80 38 μm
- SIE potential -300 mV to -400 mV
- 15 - 20% solids
In parallel to some of the composite flotation test work, variability samples from across the Copper World deposits have also been tested at KCA, AMinpro and BCR. Samples were floated employing CPS with a target SIE potential between -300mV and -400mV. Much like the XPS flotation work, rougher flotation recovery remained correlated with the oxide (acid soluble) copper content. But, when comparing the data to that from the XPS campaign, an increase in copper recovery was observed with significantly lower collector requirements and coarser grind size (Figure 13-1). Additional variability samples are being tested at AMinpro to validate the recovery model.
TABLE 13-7: SUMMARY OF LOCKED CYCLE TEST RESULTS
| Stream |
SCu |
CuSS |
Mo |
Ag |
Au |
| Dist. |
Grade |
Dist. |
Grade |
Dist. |
Grade |
Dist. |
Grade |
Dist. |
Grade |
| East Pit |
| Feed |
100 |
0.42 |
100 |
0.07 |
100 |
0.01 |
100 |
6.55 |
100 |
0.02 |
| Concentrate |
84 |
23.7 |
20 |
0.53 |
26 |
0.15 |
68 |
205 |
58 |
1.17 |
| Cleaner Tail |
6 |
0.21 |
40 |
0.12 |
22 |
0.01 |
16 |
5.25 |
12 |
0.03 |
| Rougher Tail |
10 |
0.05 |
40 |
0.12 |
52 |
0.01 |
16 |
1.3 |
30 |
0.01 |
| East Pit - Future |
| Feed |
100 |
0.39 |
100 |
0.06 |
100 |
0.02 |
100 |
5.57 |
100 |
0.04 |
| Concentrate |
86 |
23.4 |
30 |
0.63 |
27 |
0.39 |
43 |
194 |
62 |
1.1 |
| Cleaner Tail |
5 |
0.12 |
35 |
0.07 |
20 |
0.03 |
10 |
4.29 |
12 |
0.02 |
| Rougher Tail |
9 |
0.04 |
35 |
0.02 |
53 |
0.01 |
46 |
3.1 |
25 |
0.01 |
| Broadtop Mill |
| Feed |
100 |
0.32 |
100 |
0.04 |
100 |
0.02 |
100 |
2.18 |
100 |
0.03 |
| Concentrate |
82 |
22.7 |
18 |
0.44 |
44 |
0.54 |
60 |
122 |
26 |
0.38 |
| Cleaner Tail |
12 |
0.23 |
44 |
0.08 |
30 |
0.03 |
24 |
3.69 |
29 |
0.02 |
| Rougher Tail |
6 |
0.03 |
38 |
0.02 |
26 |
0.01 |
17 |
0.5 |
45 |
0.03 |
| West Mill |
| Feed |
100 |
0.33 |
100 |
0.09 |
100 |
0.02 |
100 |
1.65 |
100 |
0.02 |
| Concentrate |
77 |
18.9 |
15 |
0.69 |
10 |
0.14 |
25 |
66.8 |
42 |
0.28 |
| Cleaner Tail |
8 |
0.14 |
42 |
0.15 |
40 |
0.05 |
16 |
3.06 |
34 |
0.02 |
| Rougher Tail |
15 |
0.06 |
43 |
0.05 |
50 |
0.01 |
59 |
1.2 |
24 |
0 |
| Peach-Elgin Mill |
| Feed |
100 |
0.27 |
100 |
0.05 |
100 |
0.02 |
100 |
1.48 |
100 |
0.02 |
| Concentrate |
86 |
14.7 |
18 |
0.43 |
53 |
0.51 |
56 |
58.2 |
52 |
0.39 |
| Cleaner Tail |
8 |
0.1 |
39 |
0.09 |
22 |
0.02 |
20 |
1.67 |
19 |
0.01 |
| Rougher Tail |
6 |
0.02 |
43 |
0.03 |
25 |
0.01 |
24 |
0.5 |
28 |
0.01 |
The primary difference between the current and previously selected flotation protocols is the use of CPS. Flotation results to date have indicated that copper sulfide mineral surfaces are oxidized. This is likely what caused the need to grind finer (105 μm) than mineralogy would suggest is required, as well as the relatively high collector dosage requirements (> 45 g/t). After employing CPS, increasing the collector concentration above 10 g/t in the rougher and grinding finer than 150 μm did not offer any appreciable benefit. With sulfidization, bisulfide (HS-) acts as an activator for copper oxide and oxidized copper sulfide species by re-sulfurizing their surfaces improving their ability to float.
13.5.1 COPPER-MOLYBDENUM SEPARATION
At this stage copper-molybdenum separation test work is limited. Preliminary tests from the XPS and BML East Deposit test campaigns have indicated successful separation of copper-molybdenum. Recovery of molybdenum into the rougher concentrate exceeded 97%. The molybdenum concentrates contained 2 - 4% copper after three stages of cleaning, however, concentrate grades remained low due to high levels of magnesium clays. Additional test work will be included in the next phase of work, with a particular focus on understanding the occurrence of magnesium clays in the deposits and the potential effects on molybdenum production.
13.5.2 CONCENTRATE QUALITY
East deposit production period concentrates produced from locked cycle tests during the BML test program were analyzed by ICP to indicate the presence of deleterious elements. Fluorine was the primary element of concern, with concentrate levels ranging from 300 ppm to over 1000 ppm. Fluorine levels were shown to be inversely proportional to copper concentrate grade and were more elevated in concentrates formed from mineralization which would appear beyond the life of the mine presented for this Pre-Feasibility Study. Aside from fluorine, concentrates were relatively free of any other minor elements that would impede marketing of the concentrate. However, it was recommended lead (755 - 1120 ppm), zinc (0.8 - 1.6%), arsenic (42 - 167 ppm) and bismuth (27 - 267 ppm) levels be monitored in future test programs as they were somewhat elevated in some concentrates.
Concentrates produced from locked cycle tests (Table 13-7) at AMinpro were analyzed by ICP. Much like the BML production period concentrates, fluorine appears to be the only element of concern with levels ranging between 270 - 820 ppm, with the most elevated concentrations occurring in the East Deposit Future concentrate. The lead, zinc, arsenic, and bismuth content were low in Peach-Elgin, West Deposit, Broad Top Butte-Bolsa and East Deposit Future concentrates. East Deposit concentrates contained more elevated concentrations of lead (2400 ppm) and zinc (3.65%) while bismuth (< 50 ppm) and arsenic (< 100 ppm) content were low.
It is noted that the elevated fluorine content present in East Deposit concentrates is primarily hosted in fluorite, muscovite, apatite, and biotite. These minerals are not hydrophobic and typically report to concentrates through entrainment. It is expected that employing concentrate wash water would improve rejection of these minerals and mitigate any concerns with the ability to market concentrate.
13.5.3 FLOTATION RECOVERY ESTIMATES
13.5.3.1 COPPER
The vast amount of flotation testing to date has demonstrated a strong relationship between copper recovery and the ratio of acid soluble copper and total copper (Figure 13-1). A single global rougher recovery equation for the Copper World Project was developed using the variability test data from KCA and AMinpro. Cleaner recovery is assumed as 97%. The copper recovery equation is:

13.5.3.2 MOLYBDENUM
There has been limited work to date to optimize molybdenum recovery. Molybdenum recovery estimates to the bulk rougher concentrate are based on variability tests and are a function of oxidation, for which the ratio of acid soluble copper and total copper is used as a proxy (Figure 13-2). Molybdenum recovery to the cleaner concentrate is assumed to be 90%. The ability to fully characterize molybdenum recoveries in copper molybdenum separation are hampered due to the limited testing. The XPS and Base Met test work demonstrated that copper-molybdenum separation was achievable, but target grade (> 50%) was not reached. Due to the limited amount of molybdenum flotation work to date, the recovery of molybdenum in copper molybdenum separation is based on industry benchmarking and assumes 90% recovery to a 50% molybdenum concentrate. The next stage of testing will validate this assumption.

FIGURE 13-2: MO RECOVERY VS. ACID SOLUBLE COPPER/TOTAL COPPER

13.5.3.3 SILVER
Silver recovery is forecast as a function of the ratio of acid soluble copper and total copper as per variability flotation tests (Figure 13-3). Recovery from the bulk rougher concentrate to the final copper concentrate is assumed to be 90%. The recovery function is:

FIGURE 13-3: AG RECOVERY VS. ACID SOLUBLE COPPER/TOTAL COPPER

13.5.3.4 GOLD
Gold recovery is also forecast as a function of the ratio of acid soluble copper and total copper as per variability flotation tests (Figure 13-4). Recovery from the bulk rougher concentrate to the final copper concentrate is assumed to be 90%. The recovery function is:

FIGURE 13-4: AU RECOVERY VS. ACID SOLUBLE COPPER/TOTAL COPPER

13.6 CONCENTRATE LEACHING
A test work program was commissioned to determine the amenability of concentrate samples to the Albion Process™ (Albion), as well as low and high temperature pressure oxidation (LT-POX and HT-POX). The test work was conducted by SGS with the Albion work overseen by Glencore Technology. Copper World deposit concentrates generated by AMinpro and BCR (Peach Pit, Elgin Pit, Broadtop Transitional and East Transitional) were tested. Due to sample requirements and mass limitations, concentrates were of relatively low grade. One approximately 10% Cu concentrate sample from each of the composites, as well as a second higher grade sample from East Transitional (20% Cu) and Elgin Pit (16% Cu) were tested. Additionally, concentrates from Stall and New Britannia (Canada), as well as Constancia (Peru) were tested to assess the amenability of each process to treating a variety of different concentrates.
Albion and POX test conditions and results are summarized Table 13-8 and Table 13-9, respectively. In the Albion tests, multiple samples exhibited significant foaming which resulted in a proportion of solids entrained in foam, limiting opportunity for oxidation and leaching. Results were therefore corrected using the following equation to adjust for solids entrained within foam:

The tests indicated comparably high Cu extraction across all samples in Albion and HT-POX, whereas LT-POX resulted in relatively poor extraction. Albion was selected as the preferred concentrate leach technology as it is simpler to operate (Albion combines ultra-fine grinding followed by oxidation at atmospheric pressure and temperatures < 100°C; POX combines high temperatures of 200 - 225°C and high pressures). It is also more flexible to scale the plant and has significantly lower acid neutralization requirements; sulfur is predominantly fixated in elemental sulfur which offers a saleable biproduct.
TABLE 13-8: ALBION, LT-POX & HT-POX TEST CONDITIONS
|
Metric
|
Units
|
Albion
|
LT-POX
|
HT-POX
|
|
Average Temp
|
°C
|
95
|
150
|
225
|
|
Initial Slurry Density
|
%wt./wt.
|
5 - 10
|
8 - 20
|
8 - 20
|
|
P80
|
μm
|
10
|
10
|
As is (50 - 150)
|
|
Test Duration
|
hr.
|
72
|
1
|
1
|
TABLE 13-9: COPPER EXTRACTION IN ALBION, LT-POX & HT-POX
|
Mineralization Zone
|
Conc Cu
Grade (%)
|
Albion (%)
|
Albion Foam
Adjusted (%)
|
LT-POX (%)
|
HT-POX (%)
|
|
East Transitional 1
|
11
|
99
|
99
|
85
|
97
|
|
East Transitional 2
|
20
|
98
|
99
|
-
|
99
|
|
Broadtop Transitional
|
10
|
98
|
99
|
89
|
98
|
|
Elgin Pit 1
|
10
|
97
|
99
|
96
|
97
|
|
Elgin Pit 2
|
16
|
97
|
97
|
-
|
99
|
|
Peach Pit
|
10
|
94
|
96
|
93
|
97
|
|
Constancia 1
|
22
|
75
|
97
|
74
|
100
|
|
Constancia 2
|
25
|
65
|
98
|
98
|
89
|
|
Stall
|
21
|
87
|
98
|
87
|
96
|
|
New Britannia
|
18
|
48
|
85
|
63
|
95
|
After adjusting for foaming, Albion resulted in very high copper extractions of 97% to 99% for all samples, apart from New Britannia. The mineralogy of the New Britannia concentrate does not indicate any minerals that may contribute to poor copper leaching. A repeat of this test including measurement of PSD and CSI via laser sizer is recommended to understand whether this concentrate yields consistently poor recovery, or whether this was a one-off spurious result. Current Cu extraction estimates are 98%.
Leaching kinetics are depicted in Figure 13-5. All samples reached complete extraction between 24 and 48 hours. The design residence time was chosen to be 48 hours but there exists significant potential to reduce this as no optimization work was completed and only one of the samples tested (East Deposit Transitional 2) did not reach complete extraction within 36 hr.
Further optimization work is to be completed in the next phase of testing to optimize conditions and improve process performance. This work will focus on the following:
- Optimization of grind size through dedicated grind sensitivity leach test work
- Optimization of the metals dissolution rates to achieve high copper recoveries by targeting raffinate composition and reduced leaching residence time once an optimal grind size target is selected.
- Further testing under a modified test protocol to investigate stronger defoamers to minimize foaming during the oxidative leaching stage.
- Validation testing
FIGURE 13-5: SOLUTION COPPER TENORS OVER TIME

13.7 SULFUR PURIFICATION & BURNING
13.7.1 SULFUR FLOTATION
The purpose of a sulfur flotation stage is to remove elemental sulfur generated during Albion leaching from the solid leach discharge. The resultant sulfur product can be further upgraded via the sulfur melting purification process and ultimately sent to a roaster to create sulfuric acid or sold as molten sulfur.
Sulfur flotation test work at this stage is preliminary. A single test was performed on a 50:50 combined sample from New Britannia and Stall Albion residues to determine the suitability of concentrating elemental sulfur. Sufficient mass was not available from other samples. The tests consisted of three stages of rougher flotation, with the concentrates produced from the first two stages also subjected to a single stage of cleaning. The results are summarized in Table 13-10.
The tests were characterized by high mass recoveries. The New Britannia and Stall samples exhibited the most foaming during the oxidative leach stage, and therefore unoxidized sulfides remain readily flotable. The results do, however, suggest high sulfur, silver, and gold recoveries from the flotation concentrate. The recovery of precious metals from this concentrate would allow for production of a sulfur concentrate and a precious metals concentrate following sulfur melting and purification. The precious metals concentrate could be further processed to create doré or sold as a concentrate.
Additional testing is required to develop a robust understanding of the response of sulfur and precious metals to flotation. The current elemental sulfur and precious metals recovery assumptions to a sulfur flotation concentrate are 97% and 90%, respectively.
TABLE 13-10: SULFUR FLOTATION RESULTS

13.7.2 SULFUR MELTING
Sulfur melting testing is included in the next stage of testing. Current recovery assumptions 98% elemental sulfur to a 99.9% sulfur concentrate.
13.7.3 SULFUR BURNING
No sulfur burning test work has been completed to date. The conversion of sulfur to acid is benchmarked and assumes 98% efficiency. This will be validated in the next stage of testing.
13.8 PRECIOUS METALS RECOVERY
Precious metals recovery test work is included in the next stage of testing. The precious metals circuit would treat the combination of the sulfur flotation tails (after an iron precipitation step) and the sulfur melting residue. If sufficient recovery of precious metals were possible from the sulfur flotation concentrate, the flotation tails could be rejected without an additional treatment. Precious metals recovery following an oxidative leach, such as the Albion Process, is typically > 90%. The recovery of gold in silver in the precious metals plant is assumed to be 90%.
13.9 ROM LEACHING
Although considered during the 2022 PEA, the ROM leaching processing route was abandoned for the PFS. Additional testing indicated lower copper recoveries than estimated during the 2022 Preliminary Economic Analysis (PEA) (Figure 13-6), with recovery ultimately being driven by the concentration of acid consuming gangue. Additional testing is ongoing to identify a processing route suitable for treating this material which is still deemed potentially economic to mine and process through heap leaching although for the purpose of this Pre-Feasibility study it was deemed preferable from an economic standpoint to simply sell the sulfuric acid produced from the Albion process on the local market than to use it to leach oxides with high calcium content. In addition, approximately 45% of the mineralization which was designated as ROM leach feed in the 2022 PEA has been redirected to the mill in the mine plan in this PFS.
FIGURE 13-6: PFS VS 2022 PEA CU ROM LEACH RECOVERY

13.10 TAILINGS DEWATERING
East Deposit tailings samples generated by XPS were tested by Andritz, Bilfinger, FLSmidth (FLS), Outotec and Pocock for water separation and recovery. As expected, clay content and size distribution had a significant effect on tailings dewatering. Samples with lower clay content generally achieved the highest thickener underflow densities. On average, the high compression thickener tests achieved underflow densities 3% to 4% higher than the high-rate thickening tests. Generally, high-rate thickeners could be expected to achieve an underflow density of 65% for lower clay content mineralization, while high compression thickeners could be expected to achieve these densities even for higher clay content mineralization.
Testing of other Copper World deposits, as well as additional East Deposit testing is currently ongoing at TailPro. The test work detailed above has been used to size dewatering equipment.
13.11 CONCLUSIONS & RECOMMENDATIONS
Based on the test work discussed above the following conclusions and recommendations can be made:
- The mineralization hardness is variable throughout the deposits. A SGI of 121 min and a BWi of 13.0 kWh/ton are chosen as the basis for the design of the comminution circuit.
- Flotation test work has indicated that CPS can be used to improve the recovery of copper oxides and oxidized/tarnished copper sulfides via flotation, while also enabling a reduction in reagent consumption and a coarser primary grind size. Additional variability testing should be completed to validate the recovery estimates.
- Preliminary copper-molybdenum separation test work has indicated successful separation of copper and molybdenum is possible, however, low molybdenum concentrate grades due to the presence of talc needs to be addressed.
- Oxidative leach testing has demonstrated that Albion and HT-POX are both able to achieve high extraction of Cu from various concentrates, with Albion chosen as the preferred process. Additional process optimization work is recommended.
- The tailings properties for East Deposit have been characterized to size the dewatering equipment. Additional work is ongoing to test tailings from other Copper World deposits and validate the selection of dewatering equipment.
14 MINERAL RESOURCE ESTIMATES
Hudbay prepared a resource model using Leapfrog® version 2022.1 and MineSight® version 15.80-07, two industry-standard, commercial geological and mining software packages. The construction of this 3D resource model and the estimation of mineral resources were performed by Hudbay personnel following Hudbay procedures in compliance with best industry standards and the CIM guidelines (CIM, 2019). The work was conducted under the supervision of Mr. Olivier Tavchandjian, P. Geo., Senior Vice President, Technical Services, Exploration and Geology at Hudbay, Qualified Person, and author of the present report.
14.1 DRILLING DATABASE
1,738 drill holes totaling approximately 1,157,441 feet (352,788 m) were drilled on the Copper World property since the mid 1950's. These drillholes were imported in Leapfrog® and MineSight® from .csv files with a cut-off date for mineral resource estimate purposes of February 14th, 2023. Table 14-1 presents the drillhole breakdown by company and drilling type.
TABLE 14-1: DRILL HOLE SUMMARY FOR THE COPPER WORLD PROPERTY

From these drillholes, 1,277 holes have intersected copper mineralization and were used to define the Copper World deposits along with the East deposit. Table 14-2 presents the drillholes breakdown by deposits.
TABLE 14-2: DRILL HOLE SUMMARY PER DEPOSIT

From a total drilled length of 170,643m (559,853ft) in these 1,277 holes, approximately 515,794 feet (157,214 m) were analyzed for copper (Cu), 376,644 feet (114,801 m) for soluble copper (CuSS), 470,278 feet (143,341 m) for molybdenum (Mo), 440,668 feet (134,316 m) for silver (Ag), and 304,210 feet (92,723 m) for gold (Au), while density (specific gravity) was measured in laboratory in 1,805 samples. In addition, core box weight was systematically collected from Hudbay drilling campaigns and constitutes the main source of data for density estimation at the Copper World deposits.
14.2 MODELING OF THE MINERALIZED ENVELOPES
The lithogeochemical classification and 3D interpretation described in Section 7 was used as the basis to construct smooth and continuous 3D solids of the mineralized domains in Leapfrog using also a 0.1% copper cut-off as a natural marker and general guide. (Figure 14-1).
The shallow and closely spaced drilling conducted by Hudbay over the Copper World deposits since the publication of the 2022 Preliminary Economic Assessment (PEA) has confirmed the previous spatial distribution of the main metals of economic interest, in particular copper. The only difference since the 2022 PEA was to group the footwall zones from the East and Bolsa deposits (Envelope 5 in Table 14-3).
Table 14-3 presents the envelope code equivalency that will be referred to through the remaining part of this section.
TABLE 14-3: MINERALIZED ENVELOPES CODE EQUIVALENCY

FIGURE 14-1: GENERAL VIEW OF THE COPPER WORLD 0.1% GRADE SHELLS

Note: East in green, Peach-Elgin in blue, West in red, Broadtop Butte in orange, and the Backbone fault in gray.
Figure 14-1 presents a general view of the 0.1% Cu grade shells for the four deposits while Figures 14-2 to 14-6 present more detailed views of the envelopes used as hard boundaries for grade interpolation purposes for each deposit. These four deposits are from the Northwest to the Southeast:
- Peach-Elgin deposit hosting both skarn and porphyry mineralization
- West deposit (previously referred to as Copper World) hosting skarn mineralization located in the hanging wall of the Backbone fault.
- Broadtop Butte hosting mineralization in both a porphyry and skarn mineralization
- East deposit hosting skarn porphyry mineralization (now combined with the Bolsa deposit)
FIGURE 14-2: CROSS SECTION OF THE MINERALIZED DOMAINS AT EAST DEPOSIT

Note: Backbone fault trace = steeply dipping white line and Low Angle fault = shallow dipping white line
FIGURE 14-3: PEACH-ELGIN MINERALIZED ENVELOPES

Note: Peach-Elgin skarn mineralization in green (mix of sulfides and oxides) and porphyry mineralization in blue
FIGURE 14-4: WEST MINERALISED ENVELOPE

Note: West skarn mineralization in red hosts a mix of sulfides and oxides. Backbone fault in gray.
FIGURE 14-5: BROADTOP BUTTE MINERALISED ENVELOPES

Note: Broadtop Butte skarn sulfide mineralization in green and porphyry oxidized mineralization in blue
The envelopes and the drillhole traces were loaded into MineSight® to ensure proper tagging of the solids to actual drillhole locations. The mineral envelopes were used as a hard boundary in all cases for grade interpolation purposes, to prevent spreading of mineralization into the barren zone and vice-versa.
14.3 DENSITY FOR THE EAST DEPOSIT
The regression formulas used to calculate Specific Gravity (SGPR) from measured values by weight in air/weight in water are based on the 1,700 specific gravity data collected by Hudbay in and around the vicinity (i.e., barren zones bounding the deposit) of the East mineralized envelope.
Multi-regression models for Hudbay ICP-MS data set were developed using grouping of the units based on their genetic affinities and their similar level of alterations. Exempt from this are the granodiorite, the andesite and the QMP which are geologically too distinct from the other lithologies. Figure 14-6 presents a typical cross section of the East deposit with the sub grouping used to predict density.
FIGURE 14-6: TYPICAL CROSS SECTION OF EAST DEPOSIT WITH GEOLOGICAL UNITS
LOOKING NORTH

Table 14-4 presents a summary of the inputs used along with the results obtained from the Hudbay data set without specific gravity measurements.
TABLE 14-4: REGRESSION MODELS, FORMULAS, & STATISTICS

Note: Predicted density above and Measured density below and between ( ).
A hybrid field in the drillhole file was populated with measured density and predicted density (measured always truncate predicted). Samples without measured or predicted value from the historical holes were attributed with the average density value of the subgroup.
14.4 DENSITY FOR THE COPPER WORLD DEPOSITS
1179 measurements of specific gravity have been conducted for samples taken at random from the 2020-2022 drilling program at the Copper World deposits. This data includes:
- 857 measurements by pycnometer from pulps at the SGS and ALS laboratories to be used at a later stage of the project to correlate with geochemistry.
- 323 measurements on 6 inch (15 cm) whole core samples, 64 of which were on samples without wax coating at the Skyline lab.
- 259 measurements on samples with wax coating at the Bureau Veritas and SGS laboratories.
Specific gravity measurements from competent pieces of core may not necessarily reflect in-situ density during the mining operation in unconsolidated ground with natural voids. To quantify the potential for correction and validate the core box weight as a more accurate measure of in-situ density, the sources of information were compared where available.
The prudent approach of assigning an average in-situ density by mineralized domain in the resource model of the Copper World deposits using core box weight estimates continued for this update of the resource model.
For this purpose, all the samples located inside the various mineralization domains from each deposit were selected from the 2020-2022 drilling campaign. A quality control process was conducted on the selected samples to remove erroneous box weight measurements. These errors occurred when the core boxes were not placed properly on the weigh scale. Only density values between 1.8 and 4.5 g/cm3 were retained. A total of 107,011 feet (32,617 m) of core box weights located within the 6 mineral envelopes were retained following this quality control check.
Table 14-5 summarizes the average adjusted densities for the core box estimates by deposit. The average in-situ value derived from these core box weight measurements will be used for resource estimation and mine planning purposes until sufficient pycnometer measurements have been obtained and correlated with geochemistry.
TABLE 14-5: SUMMARY OF CORE BOX WEIGHT MEASUREMENTS
FOR THE COPPER WORLD DEPOSITS

14.5 COMPOSITING
Assay intervals were regularized by compositing drillhole data within the interpreted geological and mineralized envelopes. The drillholes were typically assayed on intervals of 5 feet (<1.5 m) and a composite length of 25 feet (7.6 m) was selected as more appropriate to conduct interpolation into the 50 x 50 x 50 ft (15 x 15 x 15 m) block size selected to account for the proposed mining method (front loading shovels). The compositing process was validated by comparing total length, density, and length weighted average grade for each metal of the composites to the original assays.
14.6 EXPLORATORY DATA ANALYSIS
Exploratory data analysis (EDA) includes basic statistical evaluation of the assays and composites for Cu, CuSS, Mo, Ag, and Au. The EDA was conducted separately for each mineralized envelope. The composite statistics for Cu, CuSS, Mo, Ag, and Au are summarized in Table 14-10 and Table 14-11 of the block model validation section.
It is worth nothing that Fe, Mg, Mn, Pb, Zn, As, Ca, Na, P, and K were all interpolated and validated in each of the deposits. However, to be succinct, only the economic metals are detailed in this Technical Report.
14.7 GRADE CAPPING
The deciles analysis (Parrish, 1997) method was used to define high-grade outliers, and to assess the need for grade capping. It was conducted on the composites in the mineralized envelope. This method considers capping when the last decile of the population contains more than 40% of the metal and the last percentile contains more than 10% of the metal. Based on this analysis, gold, silver, and molybdenum were capped as detailed in Table 14-6. These capping values were selected to limit the weight of the high-grade outliers on the overall population.
TABLE 14-6: CAPPING THRESHOLDS

14.8 VARIOGRAPHY
Down-hole and directional pairwise relative variograms for all elements were created for each individual mineral envelope using MineSight Sigma software. The major, semi-major, and minor axes were built from variogram maps. A combination of nugget and two-nested spherical models were adjusted in all cases. Once generated, a systematic visual check was conducted to ensure that the search ellipsoid would be correctly oriented with respect to the geometry of the mineral envelopes. Table 14-7 and Table 14-8 present the variogram parameters for all the interpolation domains.
TABLE 14-7: EAST DEPOSIT VARIOGRAM PARAMETERS

TABLE 14-8: COPPER WORLD DEPOSITS VARIOGRAM PARAMETERS

14.9 GRADE ESTIMATION & INTERPOLATION METHODS
The block model consists of regular blocks 50 ft along strike by 50 ft across strike by 50 ft vertically (15 x 15 x 15 m). The block dimensions were selected to match the expected smallest mining unit (SMU) for the East deposit and Copper World satellites.
Where a block was intersected by more than one interpolation domain, the domain wireframes were used to assign the percentage of the block that belongs to each domain. Figure 14-7 presents an example of the ore percentage model with 70% of the block is inside ENVLP 5 and 30% is within ENVLP 6.
FIGURE 14-7: ORE PERCENTAGE EXAMPLE

In all cases, both nearest neighbor (NN) and ordinary kriging (OK) grade interpolations were completed on the uncapped and capped grades using a strict composite and block matching code by mineralized envelope, and three passes with increasing minimum information requirements (Table 14-9).
The search passes were selected to ensure the best local estimates recognizing that OK has a smoothing effect, but making no attempt during interpolation to reduce this smoothing as it would negatively impact the quality of the local estimates. Over-smoothing is addressed through the post-processing of the model described in sub section "smoothing assessment".
TABLE 14-9: SEARCH ELLIPSE PARAMETERS

14.10 GRADE ESTIMATION VALIDATION
The grade estimation process was validated for each mineralized envelope to ensure appropriate honoring of the input data and subsequent unbiased resource reporting through the following steps:
- Visual checks of appropriate honoring of the input data but acknowledging that some natural smoothing should occur between samples as the grade of a sample in the middle of a block is not the average grade of the block.
- Absence of global bias by comparing the mean grade estimated by kriging to the original composite average grade and to a declustered grade obtained from a nearest neighbor interpolation.
- Assessment of the level of smoothing in the kriged model and correction for over-smoothing as per variogram model assumptions by domain of consistent drilling density and statistical properties.
14.11 VISUAL INSPECTION
Visual inspection of block grade versus composited data was systematically conducted in section view. This check confirmed a good reproduction of the data by the model. As an example, cross sections (looking north) are presented in Figure 14-8 to Figure 14-12.
FIGURE 14-8: EAST DEPOSIT - OK MODEL & COPPER GRADE COMPOSITES
E-W SECTION VIEW

FIGURE 14-9: PEACH-ELGIN DEPOSIT - OK MODEL & COPPER GRADE COMPOSITES
E-W SECTION VIEW

FIGURE 14-10: COPPER WORLD DEPOSIT - OK MODEL & COPPER GRADE COMPOSITES
E-W SECTION VIEW

FIGURE 14-11: BROADTOP BUTTE DEPOSIT - OK MODEL & COPPER GRADE COMPOSITES
E-W SECTION VIEW

FIGURE 14-12: BOLSA AREA (PART OF EAST DEPOSIT) - OK MODEL & COPPER GRADE COMPOSITES
E-W SECTION VIEW

14.12 GLOBAL BIAS CHECKS
This validation step consists of comparing the global average grade of each element between the composites, the nearest neighbor and the kriged block estimates.
A nearest neighbor interpolation is equivalent to the declustered statistics of the composites based on weighting each composite by its polygon of influence. The average grade obtained from this method is a useful benchmark, but not a perfect one, as it fails to incorporate the nugget effect measured by the variogram.
A global check was performed to verify that the kriged mean block estimate did not present any bias when compared to the composites and the nearest neighbor model. Differences between the composites, the NN and OK grades were acceptable. The comparison of the mean and variance for each metal between the DDHs, the composites, the NN and OK models are summarized in Table 14-10 and Table 14-11.
TABLE 14-10: GLOBAL STATISTICS OF THE EAST DEPOSIT

TABLE 14-11: GLOBAL STATISTICS OF THE COPPER WORLD DEPOSITS

14.13 SMOOTHING ASSESSMENT
The visual validation conducted in section view confirmed that the block grade interpolation is consistent with the supporting composite data. The larger number of composites used for grade estimation in the block model significantly improves the individual block grade estimates, but at the same time results in a much smoother model, requiring a careful assessment and in many cases a post-processing of the OK estimates.
The extent of grade 'over-smoothing' in the model was investigated based on material differences in grade distribution and/or drilling density. The mean and variance of the kriged estimates were compared to the variance of the composites after declustering. The expected true variance between SMUs was calculated from the variogram models summarized in Table 14-7 and Table 14-8.
Over-smoothing is a normal outcome of a sound interpolation method when the drill spacing is not sufficient to address the short-range variability in the metal grade distribution. Smoothing will gradually reduce as additional infill drilling is performed during the definition drilling phases.
14.14 SMOOTHING CORRECTION
Using the smoothed OK estimates results in an erroneous grade-tonnage curve, and reporting resources or reserves at a cut-off grade different than 0% would produce biased estimates, usually over-estimating tonnes, and under-estimating grade.
An indirect log-normal correction was used to perform a change of support on the kriged models to obtain unbiased grade tonnage curves. This correction is only valid globally and provides poorer local estimates than the smoothed OK model. However, it does not materially alter the global average grade within each zone and provides the correct grade-tonnage curve for the variogram models fitted on the drillhole data. It is an appropriate method to predict the recoverable tonnage and grade, such as the mined volume over three months of production, which should be a realistic aim for a long-term reserve model based on exploration drilling.
For some of the elements, the correction did not fully attain the targeted variance, reflecting that the log-normal model does not perfectly fit these elements. However, the targeted variance was reached within very close limits in most cases, as illustrated in Table 14-12 and Table 14-13.
TABLE 14-12: SUMMARY OF SMOOTHING CORRECTION FOR THE EAST DEPOSIT

TABLE 14-13: SUMMARY OF SMOOTHING CORRECTION FOR THE COPPER WORLD DEPOSITS

14.15 CLASSIFICATION OF MINERAL RESOURCE
During the interpolation process, several control parameters were recorded for each block. These included number of samples, number of holes, the distance to the nearest sample, and the average distance to all the samples used for the interpolation, as well as the number of quadrants with samples, the kriging variance, and the regression slope of kriging for each individual block estimate.
The regression slope values obtained from the kriging of copper and soluble copper grade estimates were used as the primary criteria for resource classification with 80% and 60% regression slope thresholds respectively used to separate "Measured" from "Indicated" and "Inferred" resources. From detailed reserves to mill reconciliations exercises conducted by Hudbay at its operating mines, these criteria were found to be a reliable first pass measure of quarterly and annual performance in tonnes and grade prediction.
The block-by-block coding assignation was then smoothed to remove isolated blocks of one category within another. Globally, proportions of "Measured", "Indicated" and "Inferred" category blocks were not changed significantly by this process. Figure 14-13 illustrates the classification before and after smoothing, while Table 14-14 presents the classification proportion before and after smoothing.
In some portions of the Peach-Elgin and Broadtop Butte deposits, skarn mineralization occurs as a thin, undulating shape wrapping around a porphyry, and as such, using a traditional search in a Cartesian coordinates reference system has most blocks classified as inferred based on the kriging slope of regression, while drilling density is similar to areas classified as indicated elsewhere in the same deposit (Figure 14-13). Hudbay worked jointly with WSP to confirm that the use of unfolding in such mineralized areas with an undulating shape would result in an improved kriging slope of regression without altering the mineral resource estimates. Based on the work conducted, and the drilling density in this area, there is a higher level of confidence in the resource model than initially indicated by the slope of regression without the use of unfolding, and as a result the resource classification was locally upgraded from inferred to indicated and Hudbay intends to perform grade interpolation using an unfolding algorithm for the next stage of the Project in these areas with an undulating mineralized envelope.
FIGURE 14-13: WSP MODEL OF SKARN MINERALIZATION & COMPOSITES
BROADTOP BUTTE ZONE - PLAN VIEW

TABLE 14-14: RESOURCE CLASSIFICATION PROPORTION PRE & POST PROCESSING
| Classification |
Block by Block |
Smoothed |
| Measured |
58.4% |
56.3% |
| Indicated |
13.3% |
22.3% |
| Inferred |
28.3% |
21.4% |
FIGURE 14-14: RESOURCE CLASSIFICATION AT THE EAST & COPPER WORLD DEPOSITS

Note: block by block classification (left) and smoothed classification (right)
14.16 REASONABLE PROSPECTS FOR ECONOMICS EXTRACTION & MINERAL RESOURCE ESTIMATES
The component of the mineralization within the block model that meets the requirements for reasonable prospects of economic extraction was based on the application of the Lerchs-Grossman algorithm. The mineral resources are therefore contained within a computer-generated open pit geometry.
TABLE 14-15: MINERAL RESOURCE STATEMENT (INCLUSIVE OF MINERAL RESERVES)

(1) Totals may not add up correctly due to rounding.
(2) Mineral resources are estimated as of 1 July 2023
(3) Tons and grades constrained to a Lerchs-Grossman revenue factor 1 pit shell or inside reserve pit.
(4) Using a 0.1% copper cutoff grade and an oxidation ratio lower than 50% for flotation material
(5) Using a 0.1% soluble copper cutoff grade and an oxidation ratio higher than 50% for leach material
(6) Mineral resources are not mineral reserves as they do not have demonstrated economic viability.
(7) Mineral resource estimates are inclusive of mineral reserves and have been calculated using assumed long-term metal prices of $3.75 per pound copper, $12 per pound molybdenum, $22 per ounce silver, and $1,650 per ounce gold.
Table 14-16 summarizes the mineral resource estimates exclusive of the measured and indicated mineral resources that were converted to mineral reserve estimates. These mineral resource estimates includes resource estimates in all categories located inside a pit shell with revenue factor of 1.0 and outside of the mineral reserve pit, as well as mineral resource estimates located within the mineral reserve pit but not processed within the mine life of the PFS and as such excluded from the mineral reserve estimates but still deemed to have potential for economic extraction with additional infill drilling and/or additional metallurgical test work.
TABLE 14-16: MINERAL RESOURCE STATEMENT (EXCLUSIVE OF MINERAL RESERVES)

(1) Totals may not add up correctly due to rounding.
(2) Mineral resources are estimated as of 1 July 2023
(3) Tons and grades constrained to a Lerchs-Grossman revenue factor 1 pit shell or inside reserve pit.
(4) Using a 0.1% copper cutoff grade and an oxidation ratio lower than 50% for flotation material
(5) Using a 0.1% soluble copper cutoff grade and an oxidation ratio higher than 50% for leach material
(6) Mineral resources are not mineral reserves as they do not have demonstrated economic viability.
(7) Mineral resource estimates are exclusive of mineral reserves and have been calculated using assumed long-term metal prices of $3.75 per pound copper, $12 per pound molybdenum, $22 per ounce silver, and $1,650 per ounce gold.
Table 14-17 presents a comparison of the historical mineral resource estimates (inclusive of mineral reserve estimates) presented in the 2022 Preliminary Economic Assessment, and the 2023 mineral resource estimates. Overall, there are minimal changes between the 2022 and 2023 mineral resource estimates inclusive of the mineral reserve estimates.
TABLE 14-17: COMPARISON OF 2022 VS 2023 MINERAL RESOURCE ESTIMATES
(1) Totals may not add up correctly due to rounding.
(2) 2023 mineral resource estimates are inclusive of mineral reserve estimates.
(3) 2022 mineral resource estimates include both flotation and leach material and were based on metals prices and other assumptions set forth in the 2022 PEA.
14.17 CONCLUSION
The mineral resource estimation is well-constrained by three-dimensional wireframes representing geologically realistic volumes of mineralization. Exploratory data analysis has demonstrated that the wireframes are suitable domains for mineral resource estimation. Grade estimation has been performed using an interpolation plan designed to minimize bias, and over-smoothing has been addressed to estimate the correct tonnes and grades of the deposits.
Mineral resources are constrained and reported using economic and technical criteria such that the mineral resource has reasonable prospects of economic extraction. The estimated mineral resources for the Project conform to the requirements of 2014 CIM Definition Standards for Mineral Resources and Mineral Reserves (CIM, 2014), and requirements in Form 43-101F1 of NI 43-101, Standards of Disclosure for Mineral Projects (CIM, 2011).
15 MINERAL RESERVE ESTIMATES
The mineral reserves estimate for the Project is based on a LOM which uses the block model described in Section 14, with economic value calculation per block (NSR in $/ton), mining, processing, and engineering detail parameters.
This mineral reserve estimate has been determined and reported in accordance with NI 43-101. The classification adopted by CIM Council in November 2014. NI 43-101 defines mineral reserves as "the economically mineable part of measured and indicated mineral resources."
The mineral reserves estimate for the Project presented in this Technical Report was prepared by Hudbay under the supervision of Olivier Tavchandjian, P. Geo., Hudbay's Senior Vice President, Exploration and Technical Services.
This Technical Report includes refinements of certain aspects of the Project's mine plan. While consistency with issued and pending environmental permits and analysis related thereto has always been a key requirement for this effort, updates to the original mine plan will be necessary. To the extent that any regulatory agency concludes that the current plan requires additional environmental analysis or modification of an existing permit, the intent will be to work with that agency to either complete the required process or to adjust the current mine plan as necessary.
15.1 PIT OPTIMIZATION
Pit optimization of multi-element deposits can either be performed on a grade equivalent of all the revenue generating elements expressed in terms of the predominant metal (copper in this case), or in terms of a Net Smelter Return (NSR). A copper grade equivalent optimization model is simpler to implement than a NSR model but is not able to adequately represent the many variables used in the calculation of revenues in the way a NSR model can. Hudbay has therefore decided to use a NSR optimization model, despite its additional complexity, to optimize the processing method that maximizes NPV for each mining block extracted from the open pits.
15.2 BLOCK MODEL
The Block Model used for the mineral reserves estimation has the original mineral resources estimation described in Section 14 as a base, which has a Selective Mining Unit ("SMU") of 50 ft x 50 ft x 50 ft.
The optimized models, which were created to simulate the actual mining practice by utilizing the SMU block sizes, were diluted reflecting the assumption that mining could not be conducted selectively to the contact mineralization but would also require mining of all the waste included in a SMU.
An economic subroutine was developed to compute a NSR value for each block in the deposit model. This computer algorithm incorporates diluted block grades, expected smelting/refining contracts (i.e., payables and deductions), metallurgical recoveries, and projected market prices for each metal (Cu, Mo, and Ag) to yield a net revenue value expressed in terms of US Dollars per ton. The subroutine also applies to mining, mineral processing, and general/administration costs to calculate a net dollar value per block, which includes adjustments for surface topography. Concurrently, a NSR value in $ per ton is computed and stored in the block model.
15.2.1 METALLURGICAL RECOVERIES
Metal recoveries were derived from metallurgical test work conducted by KCA. These tests included grinding and flotation test work. The metallurgical test work is fully described in Section 13.
Based on results from this test work, the metallurgical formula to recover copper, which is solely a function of the ratio of copper in oxides, is represented by the following equation:

Table 15-1 presents metallurgical recoveries for the other metals used in the Lerchs-Grossmann evaluations, and subsequent mineral reserve estimation. The metals copper, molybdenum, silver, and gold were modeled and used in the revenue calculations. Recovery of molybdenum, silver and gold was set to a constant value for the mixed and oxidized portions of the mineralization.
TABLE 15-1: OTHER RECOVERIES FOR MILL PROCESS
| Metal |
Oxide Mineralization |
Sulfide Mineralization |
Mixed Mineralization |
| Molybdenum |
- |
63.0% |
30.0% |
| Silver |
- |
75.5% |
38.0% |
| Gold |
- |
60.0% |
30.0% |
15.2.2 ECONOMIC PARAMETERS
Lerchs-Grossman analyses were conducted using a combined diluted resource model of all the deposits to determine the ultimate pit limits and best extraction sequence. Table 15-2 summarizes the most important economic parameters and offsite costs used in the base-case Lerchs-Grossman runs. The assumed process plant recoveries for Lerchs-Grossman evaluations are detailed in Section 17 of this document, and more details on the final economic criteria used for mine planning can be found in Section 22.
TABLE 15-2: LERCHS-GROSSMAN ECONOMIC PARAMETERS
| Parameter |
Unit |
Value |
| Metal Price |
| Copper |
$/lb. |
3.45 |
| Molybdenum |
$/lb. |
11.0 |
| Gold |
$/oz |
1,500.0 |
| Silver |
$/oz |
20.0 |
| Mining Cost |
$/ton mined |
1.20 |
| Incremental Cost by Bench |
| Up |
$/ton mined |
- |
| Down |
$/ton mined |
0.010 |
| Royalties |
| Royalties |
% of NSR |
3.0% |
| Flotation |
| Payable Contained Metal |
| Copper |
% |
96.5% |
| Molybdenum |
% |
99.0% |
| Silver |
% |
90.5% |
| Gold |
% |
90.5% |
| Concentrate Grades |
| Copper |
% |
30% |
| Molybdenum |
% |
50.0% |
| Concentrate Moisture Content |
| Copper Concentrate |
% |
8.0% |
| Molybdenum Concentrate |
% |
8.0% |
| Smelting Charges |
| Smelting charges - Cu conc (dry) |
$/ton Cu conc |
77.65 |
| Roasting charges - Mo conc (dry) |
$/lb. Mo conc |
1.50 |
| Selling Cost |
| Concentrate Transport Cu (dry) |
$/ton conc |
137.55 |
| Concentrate Transport Mo (dry) |
$/ton conc |
185.21 |
| Refining Charges |
| Payable Cu |
$/lb. Cu |
0.08 |
| Payable Mo |
$/lb. Mo |
1.20 |
| Payable Ag |
$/oz. Ag |
0.50 |
| Payable Au |
$/oz. Au |
5.00 |
| S+T+R cost |
$/lb. Cu |
0.45 |
| G & A Cost |
| Mill feed |
$/ton milled |
1.00 |
| Process Cost |
| Sulfide |
$/ton milled |
4.70 |
| Mixed |
$/ton milled |
4.70 |
| Oxide |
$/ton milled |
4.70 |
15.2.3 NET SMELTER RETURN
The revenue, recovery and cost input parameters used for pit optimization are shown in Table 15-1 to Table 15-2.
In-situ Net Smelter Return (NSR) is the net value of metals contained in a concentrate produced from a mineralized block after smelting and refining. The value is first calculated and coded into each block of the model to allow the pit optimization to be carried out. The following procedure was developed to achieve the NSR calculation:
-
Using the concentrator recovery of the metals together with the grade of the concentrate produced, the mass pull of each block in the resource model is first estimated, then expressed in terms of tons of concentrate per ton processed.
-
The value of the payable metals in the concentrate is then calculated based on agreed payable metal content, subject to deductions from smelters, refineries, and roasters.
-
In the case of copper concentrate, the payable precious metals gold and silver are added to the value of the payable copper.
-
For molybdenum concentrate, only the molybdenum metal is payable.
-
The selling costs, including marketing, transportation, insurance, shipping costs, and port, and smelting charges, expressed in $/dry metric tonne of concentrate, are deducted to obtain the gross concentrate NSR value (before royalties). Other deductions like refining charges and price participation (if applicable) expressed in $/payable metal are also assessed at this stage.
-
Applicable royalties are deducted from the gross concentrate NSR value to obtain the net concentrate NSR value (after royalty). The concentrate NSR value calculations described above are applied for both the copper and molybdenum concentrates.
-
The concentrate NSR values after royalty for the copper and molybdenum concentrates are then each multiplied by their respective mass pull, expressed in tons of concentrate produced per tonne processed, to obtain the contribution of each metal in the concentrate to the in situ NSR value.
-
The in-situ NSR of each block in the normalized resource model is the sum of the in-situ NSR value from the copper concentrate and the molybdenum concentrate.
Only Measured and Indicated Resource model block categories with NSR values greater than their processing costs are considered potential mill feed, while blocks which have NSR values less than their processing costs are considered waste.
Process plant recoveries, throughput, operating costs, and concentrate grades vary by mineralization type. Consistent with mineral reserve reporting guidelines, only measured and indicated mineral resources are coded to generate revenues in the NSR model. Inferred mineral resources are coded and reported as waste.
Processing metal recoveries for copper is calculated by formula while gold, silver and molybdenum are fixed numbers depending on the oxidation state.
15.3 MINERAL RESERVES
The mineral reserves estimation is based only on the measured and indicated mineral resource estimates. Therefore, the inferred mineral resource estimates within the ultimate pit are reported as waste, as they currently do not meet the economic and mining requirements to be categorized as mineral reserves. It cannot be assumed that all or any part of inferred mineral resources will ever be upgraded to a higher category.
FIGURE 15-1: PROJECT PIT SHELL SENSITIVITY ANALYSIS, BY REVENUE FACTOR

FIGURE 15-2: PLAN VIEW OF SELECTED LERCHS-GROSSMAN PIT

15.3.1 MINERAL RESERVE DEFINITION PARAMETERS
The base-case price and operating cost estimates presented in Table 15-2 are used as the economic envelope to define the mineral reserve estimates.
15.3.2 MATERIAL DENSITIES
Bulk material densities, which vary by rock type, were read from values stored in the resource block model. These assignments are described in more detail in Section 14. Generally, rock tonnage factors range between 11.7 ft3/ton and 12.4 ft3/ton, with an average of 12.10 ft3/ton for the rock contained within the ultimate pit.
15.3.3 DILUTION
The Copper World deposits are polymetallic skarn deposits with large zones of modeled mineralization grading higher than the anticipated cut-off grade. With the planned bulk mining method, external dilution was included within each SMU to reflect that mining would not be selective enough to stop extraction at the mineralized contacts.
The resource block model dimensions are 50 x 50 x 50 ft. When the Project commences operations, the mill feed will be delineated by implementing a detailed blasthole sampling program. Drill blast patterns will be smaller (i.e., 30 x 30 ft) than the resource block dimensions, thereby providing a better definition than from the resource model. This new definition will be provided by a new block model constructed with assays from blasthole projects, and the dynamic or short-range block model, which is a common practice at current Hudbay operations.
The author has confirmed that enough geological dilution is already incorporated in the resource model due to the smoothing effect of kriging, and the internal dilution added along the contacts of the mineralized envelopes. Based on experience in similar types of skarn deposits, and the scale of the operation, it is reasonable to use the tonnage and grade from the individual 50 x 50 x 50 ft blocks from the resource model without any additional adjustment for mining losses or dilution.
15.3.4 MINERAL RESERVES STATEMENT
Proven and probable mineral reserve estimates for the Copper World deposits are summarized in Table 15-3. Proven and probable mineral reserves within the designed final pit total 385.1 million tonnes of material, grading 0.54% Cu, 0.01% Mo, 6.0 g/tonne Ag, and 0.03 g/tonne Au. The total material excavated from the pit is 1,203 million tonnes. 41 million tonnes grading 0.16% Cu are left in a low grade stockpile at the end of the 20 years mine life due to lack of disposal space for tailings. This material, classified as measured and indicated resources, remains an upside opportunity should Hudbay secure additional surface rights for tailings disposal.
The mineral reserves estimate presented in this Technical Report is dependent on market prices for the contained metals, metallurgical recoveries and mineral processing, mining, and general/administration cost estimates. Mineral reserve estimates in subsequent evaluations of the Copper World deposits may vary according to changes in these factors. As of the effective date of this Technical Report, there are no other known mining, metallurgical, infrastructure or other relevant factors that may materially affect the mineral reserve estimates.
The vast majority of the mineral reserve estimates in the East deposit ultimate pit shape are classified as Proven. From the mineral reserves shown in Table 15-3, 74% corresponds to the East Pit, 14% to Broadtop, 7% to West Pit, and 5% to Peach-Elgin. All the mineral reserve estimates reported are contained in the mineral resource estimates presented in Section 14.
TABLE 15-3: PROVEN & PROBABLE MINERAL RESERVES TOTAL - FINAL PITS

(1) Totals may not add up correctly due to rounding.
(2) Mineral Reserve estimates are as at 1 July 2023.
(3) Mineral Reserve estimates are limited to the portion of the measured and indicated resource estimates scheduled for milling and included in the financial model of this PFS.
(4) Mineral reserves have been calculated using assumed long-term metal prices of $3.75 per pound copper, $12 per pound molybdenum, $22 per ounce silver, and $1,650 per ounce gold.
15.3.5 FACTORS THAT MAY AFFECT THE MINERAL RESERVE ESTIMATE
Areas of uncertainty that may materially impact the mineral resource estimate include:
- Long-term commodity price assumptions.
- Operating cost assumptions.
- Metal recovery assumptions used, and changes to the metallurgical recovery assumptions due to new metallurgical test work.
- Changes to the tonnage and grade estimates may vary with more drilling, new assay results, or tonnage factor information.
15.4 PERCENT MODEL TO FULL BLOCK MODEL
To use the Lerchs-Grossman algorithm to generate pit shells, the block model interpolations were first validated, then the percent block model was combined into a full block model. This conversion was performed using a script to complete the calculation:

After this post processing, the final grade items and tonnage factors represent the values of the full blocks rather than the original two distinct proportions and values.
16 MINING METHODS
16.1 MINE OVERVIEW
The mine will be a traditional open pit shovel and truck operation with bench heights of 50 and 100 foot, with 255-ton capacity haul trucks for material and waste movement.
Mining operations will use large-scale mine equipment including: 10-5/8-in. diameter rotary blast hole drills, 44 yd3 class hydraulic shovels, 36 yd3 front-end loaders, and 255-ton capacity off-highway haul trucks.
The Project includes the East, Broadtop, West and Peach-Elgin pits. The Peach-Elgin, Broadtop and West pits will measure 4,000 ft on average in diameter with an average depth of 500 ft, while the final East pit size will measure approximately 5,100 ft in diameter and have a depth of approximately 2,400 ft. Other facilities that support the Project are the Process Plants, Waste Rock Facility (WRF), and Tailings Storage Facility (TSF).
The mining sequence considers the exploitation pits requiring only state and local permits at the anticipated time of operation and all waste, tailings, and leach pads will also be disposed of within the limits of Hudbay's private land property.
The mine production plan contains 469.5 million tons of measured and indicated mineral resources amenable to economic recovery through flotation, out of which only 424.5 million tons are processed during the mine life of the Project as presented in this Pre-Feasibility Study (due to limited tailings capacity), and approximately 856 million tons of waste, yielding a life of mine stripping ratio of 2.12 (including pre-stripping material). The mine has a 20-year life (including one-year of pre-stripping), with economic material to be delivered to a processing flotation plant. Mine operations are scheduled for 24 hours per day, 365 days per year. Annual throughput at the mill facility will begin with a ramp up of 19.4 million tons (53,000 tpd) in the first year, achieving 21.9 million tons (60,000 tpd) for the second year.
During the first year of the mining activity (pre-stripping), the planned annual mining rate is 60.0 million tons, increasing to 80.0 million tons for the second year and achieving 99.0 million tons from Year 3 to Year 9. From Year 10 onwards of production the mining rate gradually decreases.
The final configuration of the proposed pits and associated facilities for waste rock (WRF), and tailings (TSF) is illustrated in Figure 16-1.
16.2 MINE PHASES
16.2.1 DESIGN CRITERIA
Mine phases and ultimate pit shape for the Project are designed for large-scale mining equipment (specifically, 44 yd3 class hydraulic shovels and 255-ton haulage trucks) and are derived from the selected Lerchs-Grossman pit shells described in Section 15. The key parameters used in the design of the mine pit phases are summarized in Table 16-1.
FIGURE 16-1: PROJECT MINE PLAN SITE LAYOUT
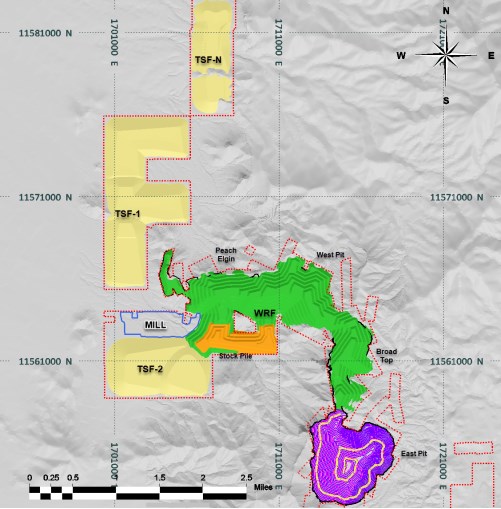
TABLE 16-1: OVERALL PIT DESIGN PARAMETERS
|
Parameters
|
East Pit
|
Other Pits
|
|
Bench height
|
50 -100 ft
|
50 ft
|
|
Bench face angle
|
55 -70°
|
65°
|
|
Cat bench interval
|
25 - 50 ft
|
28.5 ft
|
|
Road width (including ditch & safety berm)
|
110 ft
|
110 ft
|
|
Nominal road gradient
|
10%
|
10%
|
|
Minimum pushback width
|
250 ft
|
250 ft
|
16.2.2 PIT SLOPE GUIDANCE
Call and Nicholas, Inc. (CNI) completed a feasibility-level pit slope geotechnical study for the 2017 Feasibility Study (Call & Nicholas, Inc. (CNI), January 2016) stated to supersede previous pit slope geotechnical reports. Those Pit designs assumed that the operations were not restricted to the currently proposed pit size. CNI's report documented design recommendations for life of mine (LOM) pit slopes for a pit approximately 6,000 feet by 6,000 feet at the pit crest, and with a maximum slope height of approximately 2,900 feet. It was based on the latest available geotechnical model and data for the East (formerly Rosemont) deposit through 2014.
The slope design recommendations provided by CNI were reviewed and considered to be appropriate and acceptable for the East Pit.
TABLE 16-2: EAST PIT DESIGN PARAMETERS BY SECTOR
|
Sector
|
Bench (ft)
|
BFA°
|
IRA°
|
Catch (ft)
|
OSA°
|
|
1
|
100
|
70
|
50
|
48
|
48
|
|
2
|
100
|
65
|
46
|
50
|
44
|
|
3
|
100
|
65
|
48
|
44
|
45
|
|
4
|
100
|
65
|
48
|
44
|
45
|
|
5
|
50
|
65
|
46
|
25
|
43
|
|
6
|
50
|
65
|
44
|
29
|
41
|
|
7
|
50
|
55
|
39
|
27
|
38
|
|
8
|
50
|
55
|
39
|
27
|
38
|
FIGURE 16-2: GEOTECHNICAL SECTORS OF EAST PIT

During 2022, Wood PLC (Wood) completed a review of the CNI report and agreed that the slope design recommendations appear to be generally reasonable. The rock mass characterization, slope stability analyses, conclusions and recommendations provided by CNI (2016) could be used as the basis of Wood's evaluation of the constrained East Pit. In addition, Wood developed Pre-feasibility level pit slope design recommendations for the Peach-Elgin, Broadtop and West pits.
The proposed recommended pit slope configuration for each geotechnical sector identified at the East pit is shown in Table 16-2. For the three other deposits, the pits were designed using a fixed bench height of 50 ft, a bench face angle of 65 degrees, and an inter-ramp angle of 44 degrees only considering one sector for each pit (Table 16-1).
For the East pit design, the targeted minimum mining width is 250 ft and the wall slope design provided by CNI and Hudbay will be employed. Table 16-2 lists the configuration of the recommended pit slope configuration for each sector, and Figure 16-2 shows the Ultimate Pit Slope Design with the corresponding Geotechnical Sectors.
16.2.3 MINE PHASES & ULTIMATE PIT
Thirteen mining phases define the extraction sequence for the four pits. The development strategy consists of extracting the higher metal grades along with minimum strip ratios during the initial years of production, while enabling smooth transitions in waste stripping throughout the life of the mine to ensure enough exposure for a continuous mill feed. Figure 16-3 illustrates the designed phases for the various pits. while Figure 16-4 to Figure 16-7 show cross sections of the mine phases. These cross sections highlight the low strip ratio in the Peach-Elgin, West and Broadtop Butte deposits which make them highly attractive for the early years of mining until sufficient mineralization is exposed in the higher-grade East pit.
FIGURE 16-3: PLAN VIEW OF THE PROJECT WITH MINE PHASES

16.2.3.1 PEACH-ELGIN, WEST, & BROADTOP BUTTE PHASES
Peach-Elgin has four phases, Broadtop Butte three, and West pit has two phases. Satellite phases will expose 137 million tons of mineral reserves with an average grade of 0.44% Cu and a strip ratio of 1.24.
FIGURE 16-4: SECTION B-B' - BROADTOP BUTTE PIT MINE PHASES

FIGURE 16-5: SECTION C-C' - WEST PIT MINE PHASES

FIGURE 16-6: SECTION D-D' - PEACH-ELGIN PIT MINE PHASES

16.2.3.2 EAST PIT PHASES
There are four phases for the East deposit, all of them to be mined within private or state land at the time of mining.
FIGURE 16-7: SECTION A-A' - EAST PIT MINE PHASES

Phase 01 is in the western part of the deposit. Mining will proceed from north to south to allow development of the access road to the facilities (Crusher, WRF, etc.) as well as to the other phases. Phase 01 will develop approximately 67 million tons of mineral reserves at an average grade of 0.60% Cu and a strip ratio of 2.21.
Phases 02 and 03 will expand the pit to the south-east using the main access road from phase 01 to connect with the processing and tailings facilities. These phases will develop approximately 77 and 83 million tons of reserves respectively, at an average grade of 0.49% Cu and a strip ratio of 1.72.
Phase 04 is the final phase and will expand the pit to the east. It will develop approximately 103 million tons of reserves at an average grade of 0.55% Cu and a strip ratio of 1.67.
Table 16-3 summarizes the mining production by mining phase and by pit.
TABLE 16-3: MINING PRODUCTION BY MINE PHASE

16.3 MINE SCHEDULE & PRODUCTION PLAN
16.3.1 PRODUCTION SCHEDULING CRITERIA
The production schedule uses the operating criteria outlined in Table 16-4 to develop the mining sequence plans. It considers allowances for downtime and weather delays for mine equipment and manpower estimates. A mill ramp-up period for concentrator start-up has been considered for the first year of operation (feed reduced to 19.3 million tons).
An important constraint on the mine production schedule is the limited space for disposing of waste rock and tailings while remaining on private land. In addition, some of the waste rocks can only be disposed of after mining has been completed. These important constraints result in a sub-optimum mining sequence from a strict economic standpoint but allow the mine to operate in a sustainable manner.
TABLE 16-4: MINE PRODUCTION SCHEDULE CRITERIA
|
Parameter
|
Year 01
|
Year 02 to Year 20
|
|
Annual Throughput Base Rate (Tons)
|
19,350,000
|
21,900,000
|
|
Daily Throughput Base Rate (Tons)
|
53,000
|
60,000
|
|
Operating Hours per Shift
|
12
|
12
|
|
Operating Shifts per Day
|
2
|
2
|
|
Operating Days per Week
|
7
|
7
|
|
Scheduled Operating Days per Year
|
365
|
365
|
|
Number of Mine Crews
|
4
|
4
|
16.3.2 MILL FEED CUT-OFF GRADE STRATEGY
NSR values are calculated for each block in the resource model to represent the net Cu, Mo, Ag and Au metal values for flotation processing. The mineral resources included in the mill production profile are based on a cut-off with an NSR value of $5.70/ton. This is the minimum value for the material fed to the plant to cover the processing and G&A costs. However, high-grade material with a NSR value above $12.00/ton will be prioritized. The lower-grade material with a NSR value between $5.70 and $12.00/ton will be fed as needed or will otherwise be stockpiled to be reclaimed at the end of the mine life.
The mine production schedule has been smoothed to match mill capacity, tailings capacity, fleet size, and to minimize re-handling.
FIGURE 16-8: ANNUAL MATERIAL MOVEMENT PLAN

FIGURE 16-9: PLANT FEED MILL TONNAGES BY YEAR

16.3.3 MINE PLAN
Mining sequence plans have been developed on an annual basis from pre-production through to the end of mine life. Mining rates during the pre-production stage reach 60 million tons total material, with a ramp up achieving 80 million tons during the first year of production. During the mine life of approximately 20 years of production, the mine plan achieves peak mining rates of 271,232 tons per day of total material in Year 3 until Year 9.
Table 16-5 and Table 16-6 present the production profile in both imperial and metric units respectively.
Figure 16-10 illustrates the production profile by source of material for the life of the mine. During the first 3 years (including the year of pre-stripping) 100% of the mine's production is extracted from the Peach-Elgin, West and Broadtop Butte pits. The East pit becomes a contributor from Year 3 of production onwards.
FIGURE 16-10: MINE PRODUCTION FROM THE FOUR PITS OVER LIFE OF MINE

Figure 16-11 to Figure 16-19 illustrate the evolution in the configuration of the four pits and their associated infrastructures over the life of the mine at selected key milestones.
TABLE 16-5: MINE PLAN (IMPERIAL UNITS)

TABLE 16-6: MINE PLAN (METRIC UNITS)

FIGURE 16-11: MINE PLAN IN PRE-STRIPPING

FIGURE 16-12: MINE PLAN IN YEAR 1

FIGURE 16-13: MINE PLAN IN YEAR 2

FIGURE 16-14: MINE PLAN IN YEAR 3

FIGURE 16-15: MINE PLAN IN YEAR 4

FIGURE 16-16: MINE PLAN IN YEAR 5

FIGURE 16-17: MINE PLAN IN YEAR 10

FIGURE 16-18: MINE PLAN IN YEAR 15

FIGURE 16-19: MINE PLAN FINAL CONFIGURATION AT END OF MINE LIFE

16.4 MINE FACILITIES
16.4.1 WASTE ROCK FACILITY & TAILINGS STORAGE FACILITY
Overburden and other waste rock exposed during mining will be placed into the Waste Rock Facility (WRF) located to the west of the West pit (on private land), once Peach-Elgin, Broadtop Butte, and the West pits are exhausted. The design criteria for the WRF and associated haul roads are summarized in Table 16-7.
TABLE 16-7: WRF DESIGN CRITERIA
|
Parameter
|
Value
|
|
Angle of Repose
|
37°
|
|
Average Tonnage Factor (with swell)
|
16.02 ft3/ton
|
|
Overall Slope Angle
|
2.2H:1V
|
|
Total Height
|
600 ft
|
|
Haul Road
|
120 ft
|
|
Max Elevation
|
5700 ft (amsl)
|
The WRF loading plan will consist of haul trucks end-dumping waste rock in 100-foot lifts at the angle of repose (approximately 37°) (Figure 16-20). The WRF crests will be set back to allow simple dozing of the crests down to meet the target re-graded slope angles to support concurrent reclamation. For the Tailings Storage Facility (TSF) construction, the lift height is 19 ft.
FIGURE 16-20: WASTE & TAILING LOADING PLAN

16.5 MINE EQUIPMENT
16.5.1 LARGE EQUIPMENT OPERATING PARAMETERS
Large mine equipment was selected based on the production requirements shown in Figure 16-21.
Table 16-8 shows the equipment requirements including the pre-production stage. The hydraulic shovels will be used for stripping during mine development phase and will then feed the crusher from the pit phases. The loader will be used in the rehandling activities and during mine phase opening activities.
The mine will operate two 12-hour shifts per day, for 365 days a year. No significant weather delays are expected, and the mine will not be shut down for holidays. The craft work schedule will consist of a standard four-crew rotation.
FIGURE 16-21: MINE EQUIPMENT REQUIREMENTS (MILLION TONS)

16.5.2 MINE EQUIPMENT CALCULATION
The mine equipment requirements were developed based on the annual tonnage movement projected by the mine production schedule, with bench heights of 50 feet, two 12-hour shifts per day, 365 days per year operation, with manufacturer machine specifications and material characteristics specific to the deposit.
Specific manufacturer's models used in this study are only intended to represent the size and class of equipment selected. The final equipment manufacturer selection will be done as required to meet delivery dates and needs of the operation.
A summary of fleet requirements by production year for major mine equipment is shown in Table 16-8. In addition, Figure 16-22 illustrates the haulage fleet evolution by year over the life of the mine, and Table 16-9 depicts equipment KPI's, based on benchmarking from Constancia (Hudbay's mine) experience and other operations. This represents the equipment necessary to perform the following mine tasks:
- Mine site clearing, and topsoil salvage and stockpiling.
- Construction of the main haul roads.
- Production and pre-split drilling.
- Loading and hauling of sulfides and oxides to the primary crusher; and waste rock to WRF and TSF areas.
- Maintaining mine haulage and access roads.
- Maintaining WRF, TSF, berms, and re-grading of slopes and final surfaces.
FIGURE 16-22: HAULAGE FLEET PER YEAR

TABLE 16-8: MINE EQUIPMENT FLEET BY YEAR

TABLE 16-9: MAJOR EQUIPMENT KPI & PRODUCTIVITY

16.6 MINE OPERATIONS
16.6.1 DRILLING & BLASTING
Controlled blasting should be assumed for all final rock slopes. Controlled blasting techniques may include trim and buffer blasting, or pre-split blasting. The goal of the blast design should be to limit disturbance of the rock mass remaining in the final pit slope.
16.6.2 SLOPE MONITORING
The current state of practice for slope monitoring in open pit mines in North America is based on a multi-tiered system, which may include the following:
- Visual inspections.
- Theodolites (robotic or manual) and a network of survey prisms.
- Mobile or fixed slope stability radar equipment.
- Wire extensometers and inclinometers piezometers.
Considering the proposed size of the four open pits, multiple robotic theodolites would be required to survey the pit slopes. Depending on the number of active mining fronts, two or three slope stability radar systems may also be required. This quantity of equipment is comparable to existing large open pit operations, including Hudbay's Constancia operation.
16.6.3 LOADING
Major loading equipment consists of four 44 yd3 class hydraulic shovels and one 36 yd3 front-end loader. On average, 82% of total material movement will be handled by the hydraulic shovels and 18% by the front-end loader.
The equipment was selected to work a 50-foot bench height and load 255 ton-class trucks. For this study, the 255-ton class trucks were chosen based on economics, but the loading fleet is sized for the larger trucks to give the operator flexibility in fleet selection at a later date.
Loading 255-ton trucks with a 44 yd3 class shovel requires four passes (5 in mineralization), at 38 seconds per cycle, 25 second spot and queuing for a total load time of 3.5 minutes per truck (4.1 minutes in mineralization). Finally, 255-tonne trucks loaded with a 36 yd3 FEL require five passes at 45 seconds per pass, a 40-second spot time and queuing time, for a total load time of 5.4 minutes.
Loading equipment production rates vary during equipment start up, and operator training and experience.
16.6.4 HAULING
The 255-ton class truck was chosen as best suited for the envisaged production rate. The main factors influencing the study were fuel burn, tire costs and repair costs. Truck fleet requirements vary from 14 units at the start of pre-production to a maximum of 46 units by Year 6, then maintaining that maximum until Year 10 where fleet size requirements start to drop as mining production decreases.
16.6.5 SUPPORT EQUIPMENT
Major support equipment includes mine equipment that is not directly responsible for production, but which is scheduled on a regular basis to maintain in-pit and ex-pit haul roads, pit benches, WRF and TSF, and to perform miscellaneous construction work as needed. Equipment operating requirements were estimated for this equipment based on the major mine equipment support requirements. Equipment in the mine support fleet includes:
- crawler dozers
- rubber-tire dozers
- motor graders
- water trucks
In general, the rubber-tired dozers will be used in the pit to clean up around the primary loading units, with the track dozers used for haul road construction, pit development, WRF and TSF, and final re-grading requirements. The graders and water trucks will be used to maintain roads and control dust.
16.7 MINING ENGINEERING
WSP was contracted by Hudbay to provide geotechnical recommendations for the slope angles of the open pit development of the Copper World deposits. The current and previous work included geologic and geotechnical mapping, drilling, rock strength testing and slope stability analysis to determine pit slope design criteria that is consistent with industry norms for safety and cost effectiveness. WSP provided a report in December 2022 - Pre-feasibility level pit slope design study, Copper World. In this Technical Report, the previous report by CNI from May 2016 (Feasibility-Level Geotechnical Study for The East deposit) was considered as a basis for the continuation of the investigation, and addition of the satellite pits.
16.7.1 GEOTECHNICAL PROGRAM - SATELLITE PITS
16.7.1.1 PHOTO LOGGING
WSP personnel logged RQD from core photographs for 18 historic exploration diamond drillholes from the 2020 campaign by Hudbay. The aim was to provide additional geotechnical information that could be used as a reference in comparing the major geotechnical units within the Satellite pit areas to those of the East Pit.
The focus of the photo logging was to evaluate the similarity of the fracture intensity and rock mass quality of the major geotechnical units in the Satellite pits to those of the East Pit. The holes selected for RQD logging were those that were drilled into or close to the slopes of the preliminary Satellite pit designs. Photo logging was performed using the program PicSure™ (BasRock, 2021), which allows for scaling of digital photographs of core boxes so that measurements can be performed on the images to obtain RQD.
In the available geologic logging of the exploration holes from the East Pit, approximately half of the core did not have a lithologic unit assignment. WSP classified the core from core photo examination into three high-level geotechnical units; Granodiorite, Paleozoic Sedimentary, and QMP.
16.7.1.2 GEOTECHNICAL DRILLING
The locations of the nine vertical, geotechnical drillholes were selected by Hudbay with input from Hudbay's hydrogeological consultant, Piteau Associates Inc. (Piteau) for hydrogeological testing and instrumentation installation. The holes were not mechanically oriented and televiewer surveys were not performed. Geotechnical core logging was performed by WSP at Hudbay's core shack after the core was boxed and transported to the core shack by Hudbay. Samples were submitted to Advanced Terra Testing (ATT) in Lakewood, Colorado for geomechanical testing.
16.7.1.3 POINT LOAD TESTING
Point load tests are used to provide an estimate of the Uniaxial Compressive Strength (UCS) of intact rock. These tests are simple and inexpensive and are performed on a greater number of core samples than laboratory UCS tests. Point load tests were performed on core from the geotechnical holes approximately every 20 feet. Data collected for each test included sample depth, lithology, dimensions, failure load, and a description of the induced failure surface. The size-corrected point load strength index (Is50) was calculated for each test according to the International Society for Rock Mechanics (ISRM) Suggested Method for Determining Point Load Strength (ISRM, 1985). In total, 196 samples from the eight geotechnical drillholes were tested.
16.7.1.4 LABORATORY TESTING
Core samples representative of the major rock units and fault gouge were collected during the 2021 geotechnical core drilling program. Each sample was described, photographed, and packaged in hard plastic coolers for shipping. Testing was completed by ATT in Lakewood, Colorado. The main tests performed where uniaxial compressive strength, Brazilian tensile strength, triaxial compressive strength, direct shear on rock joint, and direct shear.
16.7.2 GEOTECHNICAL RESULTS & MINE PLANNING
Based on the WSP report, Hudbay developed an optimized mine planning strategy by combining the geotechnical engineering input as well as pit design, mine planning and the operational constraints. With regards to geotechnical engineering and pit design, the following aspects were considered:
-
For use in pit slope optimization programs, the recommended inter-ramp angle (IRA) should be reduced three to five degrees to account for the reduction in overall slope angle from haul roads.
-
Blasting includes trim and buffer rows at the final wall to protect IRA.
-
Effective pre-split for double benching.
-
Mining sequence, by phases and periods:
With respect to the general mine development sequence, Hudbay has adopted the following strategy:
-
Dewatering will be required for operations and pit water management. A reliable hydrogeologic model and prediction of groundwater drawdown during pit development is necessary to evaluate and identify slope stability risks due to excess groundwater.
-
Piezometers around the final pit crests should be installed as part of the next design phase.
-
Pre-stripping will expose several geological faults identified during the geotechnical study, allowing for better definition, exact location, geotechnical properties, and behavior.
-
The strategy will remain the same as the mine progresses and other faults are encountered. Mine development will include specific design parameters to minimize the unintended structural issues, specifically:
- Inter ramp angle controls and review for optimization (wall phases)
- Bench face angles
- Control wall damage with blasting analyses
- Blasting control (VPP)
- Ground control (survey, water level)
- Slope monitoring system
No new geotechnical data for the East Pit was available for this study, and therefore, the rock mass characterizations reported by CNI (2016) were used as the basis for the analyses performed on the East Pit. Characterization of the rock mass for the other pits is based on site visit observations, geotechnical core logging, laboratory testing reported by CNI (2016), and available laboratory testing completed on core from the 2021 geotechnical drilling program. The mechanical characteristics of the geotechnical units in the satellite pits are similar to those of the East Pit as indicated by RQD and point load testing.
Important conclusions from the geotechnical investigation, rock mass characterization, and engineering analyses for the Satellite Pits include:
-
Rock mass stability analyses in the Satellite Pits indicate a high factor of safety for deep-seated shear through rock mass; therefore, rock mass strength is not indicated to be a control of overall stability.
-
Where slope designs are not limited by large-scale stability, they will be limited by a bench configuration that can be reliably and safely achieved.
-
Subsurface structural data in the Satellite Pits is not available. However, based on the surface structural mapping and geologic model, adverse structural conditions are not indicated.
-
Dewatering will be required for operations and pit water management. A reliable hydrogeologic model and prediction of groundwater drawdown during pit development is necessary to evaluate and identify slope stability risks due to excess groundwater pressures locally, for the Satellite Pits and the constrained East Pit.
Recommendations from WSP for the pit slope of the satellite pits are summarized in Table 16-10.
TABLE 16-10: PIT SLOPE RECOMMENDATIONS FOR SATELLITE PITS

16.7.3 HYDROGEOLOGY MINE PLANNING
Piteau Associates was contracted by Hudbay to provide a hydrogeological study. Piteau provided a report in January 2023 - Copper World Complex Project Operational Closure and Water Management Study (Piteau Associates, 2023). The study includes the Project water supply, open pit dewatering systems and groundwater related compliance and containment infrastructure. Based on this report, Hudbay developed an optimized strategy to combine pit dewatering, pit design, mine planning, and operational constraints. The preliminary engineering design of dewatering integrates standard pit dewatering infrastructure (wells and horizontal drains) with the open pit scale hydrogeological framework, and the sequenced open pit mine plan. The dewatering plan includes 13 dewatering wells and four replacement dewatering wells for the East Pit. Horizontal drains will also be needed for the satellite pits and the East pit. For the mining areas west of the ridgeline (Peach-Elgin Pit), there is very minimal bedrock groundwater. Proactive dewatering measures are not anticipated to support mining operations.
The following general strategy has been considered:
-
Monitoring wells focused on dewatering.
-
Active and passive depressurization verification according to mining advance
-
Updating the areas indicating high and low conductivity
-
Establishing an operational correlation between the geological, geotechnical, and hydrogeological parameters
Table 16-11 summarizes the location, construction details, timing, and planned flow rate for these wells, using the criteria described above.
-
In some instances, the mine plan criteria governing the placement of wells based on the mine plan required local flexibility. In other words, for PFS purposes, it is assumed that small and local mine plan modifications may be possible to accommodate well locations.
-
Well locations and collar elevations are preliminary and will ultimately need 'field fitting' based on mine plan updates and results of pilot hole drilling and testing.
-
The top of screen for each well was nominally assumed 50 to 100 ft below the collar for planning and costing purposes.
-
The bottom of the screen was set to either:
- The bottom of the pit (4100 ft amsl) less 100 feet, or
- The bottom of model layer 6 (one layer beneath the lowest pit layer) to aid in model evaluation of the last stages of dewatering.
TABLE 16-11: EAST PIT DEWATERING WELLS
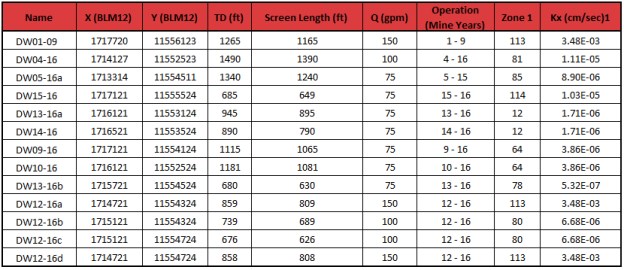
17 RECOVERY METHODS
17.1 OVERVIEW
The current plant design is updated from the 2022 Copper World Preliminary Economic Assessment by considering the additional test work conducted by various laboratories in 2022/23, along with process optimization based on both Hudbay's and the equipment vendor's benchmark databases.
The processing plant consists of a sulfide concentrator and a concentrate leach facility, with the concentrate leach facility to be built in stages starting in year four. The process plant will operate two 12-hour shifts per day, 365 days a year, with an overall plant availability of 92%. The sulfide concentrator will have an installed capacity of 60,000 tons per day process via a primary crushing circuit, and a grinding circuit configured in semi-autogenous mill and ball mill (SAB) configuration. This is followed by a bulk flotation of a copper and molybdenum concentrate, and the subsequent separation of the copper and molybdenum concentrate via a reverse flotation stage. Bulk flotation tailings are thickened before sands/slime separation and discharged to the tailing's storage facility.
The concentrate leach facility, based on the Glencore Technologies Albion Process (Glencore Technology, 2022), will operate two 12-hours shifts per day, 365 days a year with an overall plant availability of 95%. The leach facility will be built in stages with the final configuration capable of processing 735 tons per day of copper concentrate and plating 211 tons per day of copper cathode. The concentrate is first re-pulped in raffinate and ground to P80 of 10 µm via an Isamill. This is followed by the sulfide oxidation stage where the ground concentrate leaches for 48 hours at 203˚F. The product of the oxidation tanks reports to a sulfur flotation stage where sulfur and unreacted sulfides are recovered via flotation cells, with the concentrate reporting to the sulfur purification stage and the flotation tailings to the iron removal circuit. The sulfur concentrates are purified via a melting process with the purified sulfur either sold directly as a product or further refined onsite to sulfuric acid. The solid residues of the purification process are returned to the concentrate re-pulp for secondary recovery of the unreacted sulfide minerals.
The iron removal circuit precipitates the iron from solution as goethite via pH adjustment with lime. The purified pregnant leach solution is separated from the leach residue and treated via a standard solvent extract and electrowinning circuit to produce finished copper cathodes. The leach residues will be treated via a cyanide leach and counter current decantation to separate the pregnant leach solution from the barren residue, with the pregnant solution treated via a Merrill Crowe process to produce doré. The barren residue is combined with the mill flotation tailings and discharged to the tailing's storage facility.
The process plant circuits will produce the following products with the annual quantities based on the installed capacity and utilization of the concentrate leach facility; copper concentrate, molybdenum concentrate, copper cathode, elemental sulfur, sulfuric acid, and silver-gold Doré.
The sulfide concentrator and concentrate leach process flowsheets are shown in Figure 17-1 and Figure 17-2 respectively.
17.2 PROCESS FLOWSHEET
The sulfide concentrator area of the process plant will consist of the following unit operations:
• Primary gyratory crusher
• Coarse feed stockpile
• SAG and Ball mill grinding:
o Primary grinding using an open circuit semi-autogenous grinding mill; and
o Secondary grinding using a closed-circuit ball mill.
• Bulk Copper Molybdenum flotation.
• Copper and Molybdenum separation flotation.
• Thickening, filtration and loading of copper and molybdenum concentrates.
• Tailings thickening and disposal.
FIGURE 17-1: PROCESS PLANT FLOWSHEET - SULFIDE CONCENTRATOR

The concentrate leach area of the process plant will consist of the following unit operations:
• Concentrate re-pulp and ultrafine grinding using an open circuit Isamill.
• Albion leach reactors
• Sulfur flotation and purification
• Acid Plant
• Iron removal and solid liquid separation
• Solvent extraction and electrowinning
• Residue Lime Boil
• Cyanide leach and CCD
• Merrill Crowe zinc precipitation circuit
• Cyanide Destruction
FIGURE 17-2: PROCESS PLANT FLOWSHEET - CONCENTRATE LEACH FACILITY

17.3 PROCESS DESIGN CRITERIA
TABLE 17-1: PROCESS DESIGN CRITERIA - OVERVIEW
|
Criteria
|
Unit
|
Value
|
|
Plant Design Capacity
|
|
Sulfide Concentrator
|
ton/a
|
21,900,000
|
|
ton/d
|
60,000
|
|
Concentrate Leach
|
ton/a
|
255,000
|
|
ton/d
|
735
|
|
Operating Availability
|
|
Crushing
|
%
|
75
|
|
Grinding, Flotation, and tailings
|
%
|
92
|
|
Concentrate Dewatering
|
%
|
84
|
|
Concentrate Leach, Iron Removal, and SXEW
|
%
|
95
|
|
Sulfur Recovery, Purification, and Acid Plant
|
%
|
95
|
|
Precious Metals Leach
|
%
|
95
|
|
Sulfide Concentrator capacity, nominal @ 92% availability
|
ton/hr.
|
2,720
|
|
Concentrate Leach capacity, nominal @ 95% availability
|
ton/hr.
|
32
|
|
ROM Specific Gravity
|
-
|
2.7 - 2.9
|
|
Plant Feed Grades - Design Max
|
|
Copper - Total
|
%
|
0.680
|
|
Copper - Acid Soluble
|
%
|
0.120
|
|
Copper - Sulfide
|
%
|
0.600
|
|
Molybdenum
|
%
|
0.020
|
|
Silver
|
g/ton
|
6.350
|
|
Plant Feed Grades - LOM Average
|
|
Copper - Total
|
%
|
0.540
|
|
Copper - Acid Soluble
|
%
|
0.120
|
|
Copper - Sulfide
|
%
|
0.420
|
|
Molybdenum
|
%
|
0.011
|
|
Silver
|
g/ton
|
5.440
|
TABLE 17-2: SULFIDE CONCENTRATOR COMMINUTION DESIGN CRITERIA
|
Criteria
|
Unit
|
Value
|
|
Crushing (Single Stage)
|
|
Availability
|
%
|
|
|
Primary Crusher
|
Type
|
Gyratory Crusher
|
|
Crushing Feed Size, 80% Passing
|
Inch
|
6.6 - 9.3
|
|
Crushing Circuit Product, 80% Passing
|
Inch
|
2.5 - 4.0
|
|
Grinding
|
|
Availability
|
%
|
92
|
|
Circuit Type
|
Type
|
SAB
|
|
Pebble Recycle Rate, Design
|
%
|
30
|
|
SAG Power Index, Design
|
Min
|
121
|
|
Bond Ball Mill Work Index, Design
|
kwh/ton
|
13.0
|
|
Bond Abrasion Index, Design
|
g
|
0.22
|
|
Feed Particle Size, F80
|
inch
|
2.5 - 4.0
|
|
Product Particle Size, P80
|
µm
|
150 - 180
|
|
Regrind Circuit Product Size, 80% Passing
|
µm
|
25 - 35
|
TABLE 17-3: SULFIDE CONCENTRATOR FLOTATION DESIGN CRITERIA
|
Criteria
|
Unit
|
Value
|
|
Feed Rate
|
ton/hr.
|
2,720
|
|
Bulk Flotation
|
|
Cell Type
|
Type
|
Jameson Cells
|
|
Number of Cells
|
#
|
6
|
|
Stage Recovery to concentrate, mass
|
% Float Feed
|
8
|
|
Stage Recovery, Copper (Sulfide)
|
%
|
95
|
|
Stage Recovery, Copper (Acid Soluble)
|
%
|
60
|
|
Stage Recovery, Molybdenum
|
%
|
75
|
|
Concentrate Grade, Copper
|
%
|
3.00
|
|
Bulk Regrind Mill
|
|
Mill Type
|
Type
|
Isamill
|
|
Installed Power
|
HP
|
4,023
|
|
Feed Rate, Design
|
ton/hr.
|
217
|
|
Feed Particle Size, F80
|
µm
|
127
|
|
Product Particle Size, P80
|
µm
|
25 - 35
|
|
Specific Grinding Energy
|
kWh/ton
|
11.7
|
|
Bulk Cleaner Flotation
|
|
Cell Type
|
Type
|
Jameson Cells
|
|
Number of Cells
|
#
|
3
|
|
Stages of Cleaning
|
#
|
2
|
|
Stage Recovery to concentrate, mass
|
% Float Feed
|
1.5
|
|
Stage Recovery, Copper (Sulfide)
|
%
|
97
|
|
Stage Recovery, Copper (Acid Soluble)
|
%
|
90
|
|
Stage Recovery, Molybdenum
|
%
|
90
|
|
Concentrate Grade, Nominal - Copper
|
%
|
25.00
|
|
Concentrate Grade, Design - Copper
|
%
|
18.00
|
|
Molybdenum Flotation
|
|
Cell Type
|
Type
|
Jameson Cells
|
|
Number of Cells
|
#
|
5
|
|
Stages of Cleaning
|
#
|
3
|
|
Circuit Recovery to concentrate, mass
|
% Float Feed
|
0.012
|
|
Circuit Recovery, Molybdenum
|
%
|
90
|
|
Concentrate Grade, Design - Molybdenum
|
%
|
50.00
|
|
Concentrate Grade, Design - Copper
|
%
|
1.00
|
TABLE 17-4: SULFIDE CONCENTRATOR CONCENTRATE DEWATERING DESIGN CRITERIA
|
Criteria
|
Unit
|
Value
|
|
Bulk Concentrate Thickener
|
|
Number of Units
|
#
|
1
|
|
Type
|
|
High-Rate
|
|
Unit Area for Thickening Rate, Design
|
ft/ton/d
|
2
|
|
Thickener Underflow Density, Design
|
% Solids (w/w)
|
60
|
|
Copper Concentrate Thickener
|
|
Number of Units
|
#
|
1
|
|
Type
|
|
High-Rate
|
|
Unit Area for Thickening Rate, Design
|
ft/ton/d
|
2
|
|
Thickener Underflow Density, Design
|
% Solids (w/w)
|
60
|
|
Copper Concentrate Filtration
|
|
Number of Units
|
#
|
2
|
|
Type
|
|
Pressure
|
|
Filtration Rate, Design
|
lb./ft2/h
|
98
|
|
Nominal Filter Cake Moisture
|
% (w/w)
|
9
|
|
Molybdenum Concentrate Thickener
|
|
Number of Units
|
#
|
1
|
|
Type
|
|
High-Rate
|
|
Unit Area for Thickening Rate, Design
|
ft/ton/d
|
4.1
|
|
Thickener Underflow Density, Design
|
% Solids (w/w)
|
60
|
|
Molybdenum Concentrate Filtration
|
|
Number of Units
|
#
|
1
|
|
Type
|
|
Pressure
|
|
Filtration Rate, Design
|
lb./ft2/h
|
72
|
|
Nominal Filter Cake Moisture
|
% (w/w)
|
<15
|
|
Molybdenum Concentrate Dryer
|
|
Number of Units
|
#
|
1
|
|
Type
|
|
Holoflite
|
|
Nominal Filter Cake Moisture
|
% (w/w)
|
5
|
TABLE 17-5: CONCENTRATE LEACH DESIGN CRITERIA
|
Criteria
|
Unit
|
Value
|
|
Concentrate Regrind
|
|
Number of Units
|
#
|
1
|
|
Mill Type
|
Type
|
Isamill
|
|
Installed Power
|
HP
|
4,023
|
|
Power Draw
|
kWh/ton
|
22.5
|
|
Product Particle Size, P80
|
µm
|
10
|
|
Product Particle Size, P100
|
µm
|
20
|
|
Albion Leach Train
|
|
Parallel Trains
|
#
|
1
|
|
Tanks per Train
|
#
|
8
|
|
Residence Time (total)
|
Hr.
|
48
|
|
Operating Temperature
|
˚F
|
203
|
|
Operating Pressure
|
Psi
|
Atmospheric
|
|
Oxygen Utilization
|
%
|
90
|
|
Extraction, Copper
|
%
|
>98
|
|
Sulfur Flotation
|
|
Cell Type
|
Type
|
Jameson Cells
|
|
Number of Cells
|
#
|
2
|
|
Stage Recovery, Elemental Sulfur
|
%
|
96
|
|
Concentrate Grade, Elemental Sulfur
|
%
|
95
|
|
Sulfur Concentrate Purification
|
|
Concentrate Filter Type
|
Type
|
Pressure
|
|
Nominal Filter Cake Moisture
|
% (w/w)
|
30
|
|
Purification Operating Temperature
|
˚F
|
273 - 293
|
|
Extraction, Sulfur
|
%
|
88
|
|
Product Purity, Sulfur
|
%
|
>99
|
|
Sulfur Burner Acid Plant
|
|
Acid Plant Type
|
Type
|
Double Contact
|
|
Product Acid Grade
|
%w/w H2SO4
|
98
|
|
Iron Precipitation
|
|
Parallel Trains
|
#
|
1
|
|
Tanks per Train
|
#
|
3
|
|
Residence Time
|
Hr.
|
6
|
|
Feed Acidity
|
pH
|
<1.0
|
|
Product Acidity
|
pH
|
2.0 - 2.5
|
|
Iron Precipitation Product
|
Type
|
Goethite
|
|
Feed Solution Grade, Fe
|
mg/l
|
20
|
|
Production Solution Grade, Fe
|
mg/l
|
<5
|
|
Residue Dewatering
|
|
Reside Thickener Type
|
Type
|
High Rate
|
|
Unit Area for Thickening Rate, Design
|
ft/ton/d
|
41
|
|
Thickener Underflow Density, Design
|
% Solids (w/w)
|
50
|
|
Residue Filter Type
|
Type
|
Pressure
|
|
Residue Filter Wash Efficiency
|
%
|
98.5
|
|
Residue Filter Cake Moisture
|
%
|
<25
|
|
Solvent Extraction
|
|
Circuit Configuration
|
Stages
|
E1, E2, W, S
|
|
Pregnant Solution Grades, Copper
|
mg/l
|
25
|
|
Pregnant Solution Grades, Iron
|
mg/l
|
<5
|
|
Pregnant Solution Grades, H2SO4
|
mg/l
|
<5
|
|
Solvent Extraction Efficiency, Copper
|
%
|
95
|
|
Extraction Stages
|
#
|
3
|
|
Washing Stages
|
#
|
1
|
|
Stripping Stages
|
#
|
1
|
|
Rich electrolyte Grade, Copper
|
mg/l
|
50
|
|
Rich electrolyte Grade, Copper
|
mg/l
|
35
|
|
Electrowinning
|
|
Cathode Capacity
|
ton/a
|
77,000
|
|
Cathode Quality
|
Grade
|
LME Grade A
|
|
Current Efficiency
|
%
|
90
|
|
Operating Voltage
|
V
|
2.0
|
|
Harvest Cycle
|
Days
|
7
|
|
Starter Cathode Type
|
|
Stainless Steel
|
|
Cathode Harvesting
|
Method
|
Semi-Automatic
|
TABLE 17-6: CONCENTRATE LEACH PRECIOUS METAL PLANT DESIGN CRITERIA
|
Criteria
|
Unit
|
Value
|
|
Lime Boil
|
|
Number of Units
|
#
|
3
|
|
Residence Time
|
hr.
|
4
|
|
Operating Temperature
|
˚F
|
194
|
|
Operating Alkalinity
|
pH
|
10.5
|
|
Leaching
|
|
Parallel Trains
|
#
|
1
|
|
Tanks per Train
|
#
|
3
|
|
Residence Time
|
hr.
|
24
|
|
Operating Alkalinity
|
pH
|
10.5
|
|
Extraction, Silver
|
%
|
97
|
|
Counter Current Decantation
|
|
Parallel Trains
|
#
|
1
|
|
Thickeners per Train
|
#
|
4
|
|
Thickener Type
|
Type
|
High Rate
|
|
Wash Ratio
|
ton/ton solids
|
4.5
|
|
Wash Source
|
-
|
MC Barren
|
|
Thickener Underflow Density
|
% Solids (wt./wt.)
|
50
|
|
Cyanide Destruction
|
|
System Type
|
Type
|
SO2/O2
|
|
Number of Stages
|
#
|
2
|
|
Residence Time per stage
|
Min
|
60
|
|
Merrill Crowe
|
|
Clarification Filters
|
#
|
2
|
|
Filter cycle frequency, design
|
Days
|
2
|
|
Deaeration dissolved O2, design
|
ppm
|
<1.0
|
|
Zn addition rate, design
|
lb./d
|
600
|
|
Precipitation Filters
|
#
|
2
|
|
Filter cycle frequency, design
|
Days
|
1
|
17.4 PLANT DESCRIPTION
17.4.1 CRUSHING PLANT
The run of mine feed is delivered by haul trucks to a primary crusher operating in open circuit. The nominal and design crusher feed rates are 3,333 tph and 3,833 tph respectively, based on a crusher runtime of 75%. Trucks discharge directly into the crusher, which is set in a dump pocket designed to allow two trucks to dump simultaneously. The crusher reduces the feed from a design F80 of 9 inches and F100 of 25 inches to a P80 of 3.0 inches. The crusher discharges by gravity into the surge pocket. An apron feeder withdraws crushed feed from the surge pocket onto a short sacrificial conveyor. This conveyor discharges onto the coarse feed stockpile feed conveyor which transports the crushed feed to the coarse feed stockpile.
The primary crusher is serviced by a fixed hydraulic crane and a rock breaker. The crushing facility is also equipped with a dust suppression system to control any dust that is generated during crushing, material loading and related operations.
Major Equipment in the crushing circuit will include:
- One single gyratory crusher, installed power 1,428 HP.
- One stockpile feed conveyor, installed power 1,000 HP.
- One apron feeder, installed power 150 HP.
17.4.2 COARSE FEED STOCKPILE
The coarse feed stockpile has two reclaim chambers, a total capacity of 150,000 tons, and a live capacity of 60,000 tons. Reclaim of the feed from the stockpile will be accomplished using two reclaim feeders at a nominal rate of 1.360 tph per feeder. Reclaimed material from the apron feeders will be discharged onto the SAG mill feed conveyor.
Major Equipment in the coarse feed stockpile area will include:
- Two apron feeders, unit installed power 75 HP.
17.4.3 GRINDING & CLASSIFICATION
The grinding circuit will consist of a SAG followed by a ball mill arranged in a closed circuit with a cyclone cluster. The nominal feed throughput of the grinding circuit will be 2,720 tph. The SAB circuit will reduce the reclaimed feed from a F80 of 3.0 inches to a P80 of 150 to 180 µm, feed source dependent. The circuit will be configured to allow for the future addition of a pebble crusher should it be required.
The SAG mill will be a grate discharge with pebble ports, with the SAG mill product discharging to a vibrating screen deck. The screen oversize will be conveyed back to the SAG mill feed conveyor and the screen undersize will gravitate to the cyclone feed pump box. As required, steel media will be added to the SAG mill to maintain mill throughput.
The ball mill discharge will gravitate to the cyclone feed pump box, where it will combine with the SAG mill discharge prior to feeding the cyclone cluster. Process water will be added to the SAG mill feed chute, ball mill feed chute and cyclone feed pump box as required to maintain target slurry densities. The cyclone underflow will gravitate to the ball mill feed chute and the cyclone overflow will gravitate to the flotation feed conditioning tank. The circuit will be configured to allow for a portion of the cyclone underflow to gravitate to the SAG mill feed chute as required to maintain power balance within the circuit. The ball mill design circulating load will be 350%.
Major Equipment in the grinding and classification area will include:
- One SAG mill, 40 ft in diameter by 26 ft EGL, installed power 37,500 HP.
- One Ball mill, 26 ft in diameter by 40.7 ft EGL, installed power 22,000 HP.
- On cyclone feed pump, installed power 2,500 HP.
- One cyclone cluster.
17.4.4 BULK FLOTATION
The cyclone overflow will gravitate to the bulk rougher conditioning tanks where the mineral collectors, frother and sulfurization reagents will be added. The conditioned slurry will undergo rougher flotation in Jameson cells for recovery of copper, molybdenum, silver, and gold.
The bulk rougher concentrate will be reground in a 4,023 HP regrind Isamill configured in an open circuit with cyclones ahead of the mill. The bulk rougher concentrate regrind cyclone will remove the minus 35 µm particles, with the cyclone underflow discharging to the Isamill feed hopper. Water will be added to the Isamill feed hopper to maintain Isamill feed below 40% solids by volume. The bulk concentrate regrind circuit will produce a product P80 of 35 µm prior to being upgraded in the cleaner circuit. The bulk rougher tailings will gravitate to the final tailings sands slimes cyclone area.
The bulk regrind product will be first conditioned with mineral collectors, pH modifiers, frother and sulfurization reagents. The conditioned slurry will be discharged to the cleaner. The cleaner tails will gravitate to the cleaner scavenger for scavenging of the residual copper, molybdenum, silver, and gold. The cleaner scavenger concentrate will be pumped back to the cleaner conditioning tank and the tailings will be pumped back to the rougher conditioning tanks. The cleaner concentrate will gravitate to the recleaner which will produce the final bulk concentrate. The recleaner tailings will be pumped back to the cleaner conditioning tank. All cleaning will be performed in Jameson cells.
Major Equipment in the Bulk Flotation area will include:
- Two rougher conditioning tanks, unit installed power 50 HP.
- One cleaner conditioning tank, installed power 50 HP.
- Six rougher Jameson cells, unit model B8500/12.
- Three cleaner Jameson cells, unit model B5400/18.
- One regrind Isamill, M10,000, installed power 4,023 HP.
17.4.5 MOLYBDENUM FLOTATION
The bulk concentrate thickener underflow will be pumped to the molybdenum-copper separation flotation conditioning tank, where sodium hydrosulfide and carbon dioxide will be added to suppress the copper minerals. The conditioned slurry will undergo rougher flotation in Jameson cells for selective recovery of molybdenum from the bulk concentrate.
The molybdenum rougher concentrate will be further upgraded in three stages of cleaner flotation to produce a final molybdenum concentrate that will report to the molybdenum thickener. The tailings from the molybdenum roughers will be pumped to the copper thickener. All cleaning will be performed in Jameson cells.
Major Equipment in the Molybdenum Flotation area will include:
- One bulk concentrate thickener, installed power 20 HP.
- One rougher conditioning tanks, unit installed power 10 HP.
- Two rougher Jameson cells, unit model E2514/3.
- Three cleaner Jameson cells, unit model Z1200/1.
17.4.6 COPPER CONCENTRATE DEWATERING
The copper concentrate will be pumped to a high-rate thickener. The thickener overflow water will be re-used in the bulk and molybdenum flotation circuits. The copper concentrate thickener underflow will be pumped to an agitated concentrate stock tank prior to the filtration process. The final filtration cake design moisture is 9%. The copper concentrate will be discharged into a stockpile, from which front end loaders will load into concentrate storage bays ahead of the concentrate leach process, or prior to sale to a third party. The copper filter filtrate will return to the copper thickener.
Major Equipment in the Copper Concentrate Dewatering area will include:
- One copper concentrate thickener, installed power 20 HP.
- Two copper concentrate stock tanks, unit installed power 60 HP.
- Two copper concentrate filters, vertical plate filters.
17.4.7 MOLYBDENUM CONCENTRATE DEWATERING
The molybdenum concentrate will be pumped to a high-rate thickener. The thickener overflow water will be re-used in the molybdenum flotation circuits. The molybdenum concentrate thickener underflow will be pumped to an agitated concentrate stock tank prior to the filtration process. The filtration cake design moisture is 15% and is further dried in a holoflite dryer to a final cake moisture of 5%. The molybdenum concentrate will be loaded into 2200 lb. bags and sold to a third party.
Major Equipment in the Molybdenum Concentrate Dewatering area will include:
- One molybdenum concentrate thickener, installed power 3 HP.
- One molybdenum concentrate stock tank, installed power 3 HP.
- One molybdenum concentrate filters, vertical plate filters.
- One molybdenum concentrate dryer, Holoflite, installed power 3 HP.
- One molybdenum bagging system, installed power 35 HP.
17.4.8 COPPER CONCENTRATE LEACHING
The copper concentrate produced onsite as well as third-party concentrates, spare capacity dependent, will be processed onsite to produce finished LME Grade A copper cathodes, along with various byproducts. The concentrate leach facility will be built in stages and the process description below outlines the final, full capacity facility.
17.4.8.1 ALBION LEACH (OXIDATION)
The copper concentrate will be loaded from the concentrate storage area into the concentrate re-pulp feeder and slurried to the target density in raffinate ahead of ultrafine grinding. The re-pulped copper concentrate will be reground in a 2,562 HP regrind Isamill to a product P80 of 10 µm prior to the Albion leach tanks.
The reground copper concentrate will be oxidized in the Albion leach tanks utilizing 95% oxygen at atmospheric pressure and 203°F for 48 hours, to achieve copper extraction to solution greater than 98%, and sulfide oxidation of greater than 75%. No external heating will be required as the oxidation process is autothermal.
Major Equipment in the Copper Concentrate Dewatering area will include:
- One copper concentrate regrind Isamill, M7,500 Isamill, installed power 2,562 HP.
- Sixteen leach tanks, unit installed power 400 HP.
- One oxygen plant, installed power of 10,728 HP.
17.4.8.2 SULFUR RECOVERY AND PURIFICATION
The oxidized copper concentrate will be discharged from the Albion leach tanks and will undergo flotation in two Jameson cells for the recovery of the elemental sulfur created in the prior stage. Any unreacted sulfides from the Albion leach stage will also be recovered into the concentrate. The sulfur concentrate will be filtered to a moisture below 30% and will undergo further upgrading via the sulfur melting purification process. The sulfur concentrate filter filtrate will be combined with the sulfur flotation tailings and will be pumped to the iron removal stage.
The sulfur concentrate filter cake will be purified by heating the concentrate to a temperature range of 273 to 293°F causing elemental sulfur to convert to the liquid phase. The molten sulfur will be filtered, separating the clean, molten sulfur from the solid material. The molten sulfur will then be further processed onsite to create sulfuric acid or will be sold as molten sulfur. The retained solids will be returned to the Albion Leach circuit.
Major Equipment in the Sulfur Recovery and Purification area will include:
- Two Sulfur Flotation Jameson cells, unit model E2514/3.
- One Sulfur Concentrate Melting Tank, installed power 25 HP.
- One Sulfur Concentrate Storage Tank, installed power 25 HP.
- One Sulfur Concentrate Filter
- One Clean Molten Sulfur Filter
17.4.8.3 IRON REMOVAL
The sulfur flotation tailings will be pumped to the iron removal stage. Limestone will be added, and the pH controlled to precipitate the iron, arsenic, and other deleterious dissolved elements from the pregnant leach solution. Oxygen will be injected throughout the process to convert ferrous iron to ferric iron prior to precipitation as goethite. The slurry from the iron removal tanks will be pumped to the residue thickener with the thickener overflow discharging to the pregnant leach solution pond. The residue thickener underflow will be dewatered further via filtration. To increase recovery of the pregnant leach solution, the residue solids will be washed during the filtration process, with the filtrate discharging to the residue thickener, and the filter cake repulped and pumped to the precious metal recovery plant.
Major Equipment in the Iron Removal area will include:
- Five Iron Precipitation tanks, unit installed power 150 HP.
- One Residue Thickener, installed power 10 HP.
- Two Residue Filters
17.4.8.4 SOLVENT EXTRACTION & ELECTROWINNING
The pregnant leach solution, separated from the leach residue in the iron removal stage, will be pumped from the pregnant leach solution pond to the solvent extraction circuit. The solvent solution circuit will consist of a single train of mixer settlers; three extraction, one washing, and one stripping. The solution copper will be transferred from the pregnant leach solution to the organic phase in the extraction stages.
The loaded organic will be pumped to the washing stage, where iron is scrubbed away to increase the electrolyte purity, with the barren raffinate pumped to the raffinate pond for re-use in the Albion leach stage to recycle the regenerated acid. The washed, loaded organic phase will be stripped by the return lean electrolyte from the electrowinning stage, with the barren organic recycled back to the extraction stage and the rich electrolyte discharging to the electrowinning stage.
The rich electrolyte will be recirculated through the electrowinning tank house, where the copper will be plated onto permanent stainless-steel starter sheets. The loaded starter sheets will be harvested on a seven-day cycle with the copper cathode stripped from the stainless-steel starter sheet via an automatic stripping, bundling, and staking machine. The lean electrolyte is recycled back to the solvent extraction stripping stage.
Major Equipment in the Solvent Extraction and Electrowinning area will include:
- Three Extraction mixer settlers, unit installed power 100 HP.
- One washing mixer settler, installed power 100 HP.
- One stripping mixer settler, installed power 100 HP.
- Reagent Tank Farm
- Pregnant leach solution pond pumps, installed power 1,400 HP.
- Raffinate leach solution pond pumps, installed power 1,400 HP.
- Electrowinning Tankhouse, Rectifier installed power 40,585 HP.
- Two Electrowinning Isle Cranes, unit install power 215 HP.
17.4.8.5 PRECIOUS METALS PLANT
The solid residue from the iron removal stage will be pumped to the lime boil stage, where the slurry will be heated to 194°F and lime added to unlock the silver from the leach residue. The lime boiled residue will then be discharged into the cyanide leach tanks, where the residue slurry will be leached for 24 hours to extract the silver and gold. The leached residue will then undergo solid-liquid separation and washing in the counter-current decantation circuit. The pregnant leach solution will be pumped to the Merrill Crowe circuit for precious metal recovery. The unreacted solid residue will be subjected to the SO2/O2 cyanide destruction process, combined with the flotation tailings and discharge to the tailing's storage facility.
The pregnant leach solution will be clarified in leaf filters pre-coated with diatomaceous earth. The filtrate will have the residual oxygen removed by passing the solution through a vacuum de-aeration column. The treated solution will then have the Zinc dust added which will precipitate the contained silver and gold. The precipitate will be filtered, with the filter cake fluxed and smelted to produce the silver-gold Doré. The barren solution will be recycled to the first leach tank and used as wash solution on the final stage of the counter-current decantation.
Major Equipment in the Precious Metals Plant will include:
- Three Lime Boil tanks, unit installed power 75 HP.
- Four Leach tanks, unit installed power 75 HP.
- Four Counter-current Decantation thickeners, unit installed power 10 HP.
- Merrill Crowe Zn Precipitation circuit
17.4.9 ACID PLANT
The acid will be a double-contact double-absorption process. The molten sulfur will be pumped from the molten sulfur storage tanks to the sulfur furnace where it will be mixed with high pressure air to atomize the sulfur, and dry combustion air to burn it. To remove any moisture in the air prior to combustion, the air will be drawn in from the atmosphere by the main blower through an air filter and drying tower. In the drying tower, moisture will be removed through absorption in sulfuric acid. Off-gas, containing SO2, is cooled by passing through a waste heat boiler. The SO2 will then be catalytically converted to SO3 in a four-bed converter with vanadium pentoxide as the catalyst. Between each of the four converter beds, heat exchangers and economizers will be used to regulate the temperature.
After passing the first three converter beds the hot SO3 gas will be cooled in the cold interpass exchanger and economizer before reaching the interpass adsorption tower, where it is absorbed into strong sulfuric acid. The outlet gas from the interpass tower will be reheated using heat exchangers before entering the fourth converter bed, where the remaining SO2 gas will be converted to SO3. The SO3 gas feeds the final absorption tower to absorb the formed SO3 into H2SO4.
Steam produced from cooling the sulfur burner is superheated and will be used for process heating in the sulfur purification process, lime boil and acid making sulfur preheating circuits. The remaining steam will be used to create electrical power in a steam turbine generator. Low-pressure steam used to start up the sulfur burner is generated by a start-up/emergency electrical boiler.
17.4.10 TAILINGS
The flotation tailings will be directed to the sands-slime separation cyclones where the flotation tailings will undergo two stages of cyclone classification to generate a fines deficient sands stream suitable for constructing the tailings storage facility embankments. The fines deficient cyclone underflow will be pumped via positive displacement pumps and dedicated pipelines to the tailing's storage facility for placement on the facility's embankments. The cyclone overflow will discharge to the tailing's thickener. The tailings thickener underflow will be pumped via a five-stage pumping system to the tailings storage facility.
The tailings thickener is sized to handle 100% of the tailings volume, with all the tailings reporting to the tailings thickener when fines deficient tailings sand is not required for embankment construction.
The residue from the concentrate leach process will always discharge to the tailing's thickener.
Major Equipment in the Tailings area will include:
- One Tailings Thickener, installed power 60 HP.
- Five thickener underflow pumps, five stage configuration, stage installed power 1,250 HP.
- Tailings cyclone clusters feed pumps, unit installed power 2,250 HP.
- Tailings Storage Facility reclaim water pumps, unit installed power 2,000 HP.
- Process water pumps, unit installed power 2,250 HP.
- Two Cyclone sand charge pumps, unit installed power 1,000 HP.
17.4.11 REAGENTS & CONSUMABLES
Various chemical reagents will be added to the processing circuit to modify the mineral particles, to either enhance mineral floatability or chemically break them down and extract the contained elements to the solution phase. The reagents onsite will be prepared and stored in separate, self-contained areas inside the process plant, and delivered to the required processing circuits via dedicated metering pumps. Where reagent mixing is required, fresh water shall be used.
17.4.11.1 COLLECTORS
Sodium isobutyl Xanthate (SIBX) in pellet form will be shipped to the mine site in bulk bags. The SIBX will be diluted to a 20% solids w/w solution strength in a mixing tank and stored in a holding tank, before being dosed to the bulk flotation circuit via metering pumps.
Diesel in liquid form will be shipped to site in standard road tankers and stored in the mine bulk fuel storage area. The plant requirement of diesel will be transferred via fuel truck from the bulk fuel storage to a holding tank, before being dosed to the flotation circuits via metering pumps.
17.4.11.2 FROTHER
MIBC frother will be received as a liquid in IBC totes. The reagent will be used at the supplied solution strength. Metering pumps will deliver the frother to the flotation circuits.
17.4.11.3 SODIUM HYDROSULFIDE
Sodium hydrosulfide (NaHS) will be delivered to site as a 40% solution in standard road tankers. The NaHS will be offloaded into NaHS storage tanks and will be used at the supplied solution strength. Metering pumps will deliver the NaHS to the flotation circuits.
17.4.11.4 FLOCCULANT
Flocculant powder will be delivered to the site in standard 20-ton bulk road transport carriers. The flocculant will be pneumatically transferred to the dry flocculant storage silo and will be mixed on demand to 1% solids w/w solution strength. The mixed flocculant solution will be held in a storage tank ahead of metering to the site thickeners.
17.4.11.5 QUICKLIME
The quicklime will be delivered to the site in standard 20-ton bulk road transport carriers. The quicklime will be pneumatically transferred to the dry quicklime storage silo and will be slaked on demand. The slaked quicklime will be held in a storage tank ahead of metering to the flotation circuits and the precious metals plant.
17.4.11.6 LIMESTONE
The limestone will be delivered to the site in standard 20-ton bulk road transport carriers. The limestone will be pneumatically transferred to the dry limestone storage silo and will be slaked on demand. The slaked limestone will be held in a storage tank ahead of metering to the iron precipitation circuit.
17.4.11.7 OTHER REAGENTS
Sodium Cyanide (NaCN), Copper Sulfate, and Cobalt Sulfate will be supplied in powder/crystal form and will be dissolved and diluted in fresh water. The strength of these reagents will be approximately 15 to 30% solids w/w.
The solvent extraction reagents will be delivered to site in either IBC totes or standard 20-ton bulk road transport carriers, depending on the individual quantities required. The reagents will be held in storage tanks and will be metered to their respective circuit via metering pumps.
17.4.12 WATER SUPPLY
Fresh water will be sourced from wells located on the western side of the Santa Rita Mountains and pumped through a series of booster tanks and pumps to the freshwater tank. From the storage tank, water will be pumped around the plant for use in reagent mixing, slurry pump gland seals, and as required for mill lubrication system cooling.
Process water will be sourced from the tailings and concentrate thickener overflows, tailings storage facility reclaim and seepage ponds, and from the freshwater tank as required. Process water will be stored in the process water pond. Process water pond pumps transfer water from the storage pond to the process water tank. Excess water in the process water tank overflows back to the process water pond. The tailings thickener overflow streams will discharge directly to the process water tank for immediate distribution and use.
17.4.13 AIR SUPPLY
Three separate plant air compressors will provide air service throughout the process plant. The instrument air will be dried using a refrigeration drier and stored in dedicated receivers distributed throughout the plant. The plant air will be fed directly to dedicated plant air receivers distributed throughout the plant.
Each filtration stage in the processing plant will come with a dedicated high pressure air supply and receiver. The acid plant will come with its own dedicated high pressure and low-pressure air supply system.All flotation cells in the process plant are self-aspirated and no low-pressure air is required for this duty.
17.4.14 ASSAY LABORATORY
The assay laboratory will be provided by a third-party onsite under contract to provide all required assay analytical services required by both mine and process plant.
18 PROJECT INFRASTRUCTURE
This section addresses the infrastructure facilities that will support the Project, and its associated processing facilities. The infrastructure will include the access roads into the plant site, electrical power source and distribution, fresh water and water distribution, tailings storage, transportation and shipping, communications, and mobile equipment.
18.1 ACCESS ROADS, PLANT ROADS, & HAUL ROADS
Access to the Project area is through South Santa Rita Road, at the point between South Nogales Highway and South Country Club Road on East Sahuarita Road in the Town of Sahuarita, Pima County, Arizona. The Project's Primary Access Road will intersect Santa Rita Road and give entrance to the in-plant roads which extend from the plant entrance both through and around the perimeter of the process facilities. A Utility Maintenance Road will be built which parallels Santa Rita Road; Right-of-Way easements have been obtained. The Utility Maintenance Road will be used as access to the transmission powerline and the waterline pipeline.
18.2 PROCESSING PLANTS
The Concentrator Plant has a capacity of 60,000 tons per day and will process sulfide mineralization through conventional crushing, grinding, flotation, molybdenum separation, concentrate dewatering and tailings thickening. The facility also includes a two-stage cyclone station used to produce the sand for dam construction of the TSF.
The processing plant will be expanded in Year 5 of operations to include a Concentrate Leach facility. This facility includes concentrate re-pulp and ultrafine grinding, leach reactors, sulfur flotation, acid plant, SX/EW, and a Merrill Crowe circuit for precious metals.
FIGURE 18-1: GENERAL PLANT SITE ARRANGEMENT

18.3 POWER SUPPLY & DISTRIBUTION
Tucson Electric Power (TEP) will provide the electrical power supply for the Project, including the process facilities. TEP will provide service via a 138 kV transmission line connected at the proposed Toro Switchyard which will be located on a private land parcel (Sanrita South) approximately 3 miles (5 km) south of Sahuarita Road and 3.5 miles (5.6 km) east of I-19 near the Country Club Road and Corto Road alignments.
The system will be designed for both the Concentrator Plant and the expansion of the Concentrate Leach Facility. Table 18-1 provides a breakdown of installed and operating power per area and includes provisions for the Concentrate Leach expansion.
TABLE 18-1: SUMMARY OF POWER SUPPLY BY AREA
|
WBS
|
Area
|
Installed (kW)
|
Operating (kW)
|
|
3100
|
Primary Crushing
|
2,760
|
2,163
|
|
3200
|
Copper Plant
|
72,079
|
59,631
|
|
3300
|
Molybdenum Flotation
|
1,231
|
868
|
|
3400
|
Reagents
|
1,375
|
854
|
|
3500
|
Plant Services
|
13,733
|
9,308
|
|
5600
|
Tailings Storage Facility
|
8,400
|
4,373
|
|
3700
|
SX/EW
|
32,478
|
26,903
|
|
3525
|
Oxygen Plant
|
8,000
|
6,737
|
|
3800
|
Concentrate Leach
|
730
|
433
|
|
3830
|
Precious Metal Leach
|
0
|
0
|
|
3842
|
Precious Metal Plant
|
898
|
634
|
|
3900
|
Neutralization, Concentrate Leach
|
22,073
|
18,270
|
|
4100
|
Site ponds
|
9,779
|
7,690
|
|
Total
|
173,536
|
137,865
|
18.4 WATER SUPPLY & DISTRIBUTION
The primary source of water supply identified for the Project is groundwater in the basin-fill deposits of the upper Santa Cruz Basin, which lies west of the Project and the Santa Rita Mountains. Copper World, Inc. has a permit to withdraw groundwater for mineral extraction and metallurgical processing in the amount of 6,000 acre-feet per year for 20 years. This amount may change when the engineering studies are finalized. Water will be provided to a potable water system, freshwater system, process water system, and fire water system.
The mass and water balance for the proposed process flows is based on a design plant throughput of 60 ktpd at a design copper head grade of 0.54% CuT for the sulfide concentrator.
The fresh water and makeup water required for operation of the sulfide concentrator is on average 5,100 acre-feet (variable through the years).
The freshwater tank contains a dedicated firewater reserve with a minimum capacity of 186,000 gallons (704 m3). Fire water is pumped from the fresh/fire water storage to fire hydrants, hose reels and fire suppression sprinklers via a dedicated fire water ring main.
Fresh water is transferred to a dedicated gland seal water and distributed where needed. Additionally, fresh water is treated in a water treatment facility to produce potable water for the site buildings, process plant, and mine infrastructure areas. A potable water tank provides storage capacity of 48 hours at average consumption. Potable water is pumped around the site and supplies the plant safety shower system.
Process Water stored in the process water tank is for general use and is sourced from tailings thickener overflow and supplemented with plant site run-off collected in stormwater and/or process pond.
Cooling water is used in the SAG mill and ball mill. Chilled water is supplied from a closed-loop chiller system. Water from the cooling water tank is pumped through the chiller to the heat exchangers in the grinding circuits. Warm water is returned to the cooling water tank and recirculated.
18.5 COMMUNICATIONS
High bandwidth routers and switches will be used to segment the ethernet network and to provide the ability to monitor and control traffic over the network. A voice-over Internet Protocol (VoIP) phone system will be part of the office network, and VoIP handsets will be used for voice communication. Mobile radios will be used by the mine and plant operation personnel for daily control and communications while outside the offices.
The process control system (PCS) is an integrated plant-wide design, enabling the start-up, monitoring and control and shutdown of equipment from the plant control rooms.
The process plant is monitored and controlled from one main control room located in the plant administration and change house building.
A closed-circuit television (CCTV) system is used to assist control room operators in monitoring the operation of the plant and equipment. The CCTV system provides real-time monitoring with archived recording for a nominal period. Camera types include fixed cameras and cameras with remote pan-tilt and/or zoom (PTZ) functions accessible by the control room operators.
18.6 AIR SERVICES
Plant air service for use in the process areas will be supplied by two main compressors in the grinding area, and two main compressors in the concentrate handling area. These compressors will provide filtered compressed air to individual plant air receivers in each area where compressed plant air is required.
These four main compressors will also be the source for the instrument air systems. This air will be dried prior to entering the distribution network. Each area will have its own dedicated instrument air receiver to ensure reliable operation of all local area instruments.
In addition to these four air compressors, the copper and molybdenum concentrate filters will have their own dedicated air systems which will include compressors and receivers. These air systems will be sized to accommodate only the needs of these specific pieces of equipment.
18.7 TAILINGS STORAGE FACILITY
The Project includes the construction of three Tailings Storage Facilities: TSF-1, TSF-2, and TSF-N. A conventional tailings deposition is planned for the Project (Figure 18-2).
FIGURE 18-2: INFRASTRUCTURE ARRANGEMENTS

18.7.1 TAILINGS STORAGE FACILITY DESIGNS
The Tailings Storage Facilities (TSFs) have been designed to receive tailings from the processing plant at a nominal rate of 60,000 tons per day. The design criteria and objectives included:
- Provisions storage of a minimum of 440 million tons, including TSF-1 (231 million tons), TSF-2 (139 million tons), and TSF-N (70 million tons), which is sufficient for the material to be mined and processed during the 20 years of mine life.
- Designs in accordance with the requirements of the Arizona Department of Environmental Quality (ADEQ) and Arizona Mining Best Available Demonstrated Control Technology ("BADCT") Guidance Manual.
- Site-specific design criteria based on hydrological and geotechnical studies that included regional climate data, drilling and testing programs, and laboratory characterization of subsurface and tailings samples.
- Establishment of an effective and efficient reclamation program, with a focus on concurrent reclamation.
The tailings facility TSF-N is considered a tailings facility in the mine plan described in this Technical Report and supporting financial models. However, it is considered optional at this time and noted as such on Figure 18-2. In the current mine plan, this location would not be utilized for tailings storage until Year 15 of operations. Hudbay believes that a preferable alternative location for tailings storage can be secured by that time.
The tailings facilities will consist of multiple cells. For each cell, a TSF starter dam (start phase) will first be constructed using locally borrowed soil and waste rock; the main starter dam along the downgradient edge of each cell will be raised by centerline construction methods, and in some areas followed by the upstream construction methods until the final dam configuration is achieved.
The subgrade areas of the TSF starter dam embankments, and the area of impoundment for the discharge control treatment, will be stripped of existing vegetation, debris, and other deleterious materials. Areas designated to receive embankment fill will be further prepared by the removal of any loose alluvial or colluvial soils. Benches will be wide enough to accommodate compaction and earth moving equipment, and to allow the placement of horizontal lifts of fill.
18.7.2 STABILITY ANALYSIS
Geotechnical investigations and laboratory testing were completed as part of the design process and supplemented with historical data to form the basis of the design. In addition to the field and laboratory investigation, samples of potential borrow materials were collected and tested from within the Project area for the construction of the TSFs.
The slope stability analyses performed by WSP to assess the slope stability of the TSFs designed to support the Project were as follows:
- Both static and pseudo-static analyses were performed using the Slide2 (Rocscience, 2021) computer program to perform limit equilibrium slope stability tests using the Morgenstern-Price's method of slices.
- Earthquake-induced slope displacements were estimated to evaluate the potential impact on the public and human life using an empirical method by Bray & Travasarou (2007) and considering an MCE.
Site characteristics were assessed during geotechnical investigations in 2021 and 2022 using test pits, drill holes, and laboratory and in-situ testing completed by WSP. A total of 6 borings and 15 test pits were performed within the footprints of TSF-1 and TSF-2. In 2022, an additional 7 test pits were performed in the footprint of TSF-N.
Critical cross sections were selected to evaluate the stability of TSF-1 and TSF-2. The selected sections are along the maximum heights and representative configurations of the tailing's dams at different cells at in different locations. Moreover, two more sections (TSF-1B and TSF-2B) were selected to evaluate potential impact on the public accesses and human life under an extreme earthquake event, such as the MCE. Stability analyses were performed for these sections to evaluate the slope stability of the TSFs during and after construction. The stability analyses included construction stage analyses with both static and pseudo-static analyses performed.
The foundation material consists, in general, of alluvium (including GP, SP, and SW soil types), highly to completely weathered rock, and moderately to slightly weathered rock. To simplify the model assumptions and material properties, the foundation material was conservatively considered to be an alluvial/colluvial soil for the entire foundation depth evaluated, consistent with the past designs of the TSF. All factors of safety meet or exceed the minimum design criteria for static and pseudo-static loading conditions per ADEQ - BADCT guidance manual.
To support stability analyses, steady-state seepage analyses of the critical sections were completed to assess the water and pore-water pressure conditions during the construction of the tailings dam and to evaluate dam stability at a maximum pool condition. The seepage analysis results confirmed that a phreatic surface does not develop through the embankments at any stage of construction. Based on these results, the downstream slope of the embankment is not affected by the phreatic surface. Simplified and representative piezometric surfaces were developed based on the results of seepage analysis and used for stability modeling.
18.8 WASTE ROCK FACILITY
The Waste Rock Facility (WRF) will receive waste rock from all the pits, starting from the west side area. The WRF will be large enough to contain the estimated 856 million tons of waste rock generated from within the proposed limits of the pits. (Figure 18-2).
The WRF will be constructed with maximum lifts of 100 ft, stacked at the angle of repose, with benching to create an overall slope of 2.2 horizontal to 1 vertical (2.2H:1V) and inter-lift slope of about 2H:1V. The foundation materials range from weathered rock to 80 ft of alluvial or colluvial soils overlying weathered rock. These materials are dense and dry enough that the possibility of liquefaction of the foundation or waste rock is very low given the tectonic environment of the Project area.
The stability analysis concepts, and material properties were developed from an evaluation of the proposed waste rock properties. Drained analysis (ESA) was performed based on the assumption that excess pore pressures will not be generated by the shearing process. This analysis method is appropriate for the coarse material that will compose the WRF.
The design of the WRF considered field and laboratory test data from the geotechnical investigation. Stability analyses were completed using critical cross-sections of the facility side slopes, using the principles of limit equilibrium, and assessed under static and pseudo-static conditions. For the failure mechanisms considered in the analyses, slope stability was evaluated using limit equilibrium methods based on Morgenstern-Price's method of analysis. Furthermore, stability analyses were performed for circular and non-circular surfaces using a variety of search methods. These methods provide powerful algorithms in which the search for the lowest safety factor is refined as the analysis progresses. An iterative approach is used, so that the results of one iteration are used to narrow the search area on the slope in the next iteration. These stability analyses considered the end of the mine life when the material depositions are at their respective final configurations.
18.9 SITE WATER MANAGEMENT
The site water management strategy considers the protection of the groundwater and recognizes surface water resources.
18.9.1 STORMWATER MANAGEMENT FACILITIES
The stormwater management facilities will divert clean runoff from the Project site, to minimize the amount of water that must be managed or treated, via a system of designed diversion channels and collection galleries. The construction of these surface water control structures will start during the initial construction of the Project. Diversion channels will convey water either to a natural drainage or to a stormwater collection gallery to handle runoff from a 100-year, 24-hour storm event. Two stormwater ponds are proposed (HLF North Stormwater Pond and HLF South Stormwater Pond). The two stormwater ponds will be single lined since these will primarily be for stormwater and/or contain process solutions for a short period of time during upset conditions.
18.9.2 TAILINGS STORAGE WATER MANAGEMENT
Stormwater management will be required prior to the start of the TSFs construction and will include stormwater collection galleries and stormwater diversions. To ensure the stormwater and seepage from the TSFs are not mixed in the stormwater collection galleries, the side of the stormwater collection gallery that is adjacent to the TSFs in both the upstream and downstream galleries will be lined with an 80-mil geomembrane.
For the conventional impoundment design, seepage within the TSFs will be collected in an underdrain collection system that will report flow to several seepage collection trenches located at the downgradient toe of the TSFs. Solution captured in the seepage collection trenches will be pumped to the Primary Settling Pond and recycled into the process.
18.9.3 WASTE ROCK WATER MANAGEMENT
The waste rock material has been identified as non-acid generating (NAG) material and therefore does not pose a threat for the formation of acid mine drainage. During the first year of the construction, the waste rock material will be placed within the footprint of the process area and will be used for road construction. During the operation, waste rock material will also be used to backfill three satellite pits: Peach-Elgin, West, and Broadtop Butte. The waste rock facilities will be constructed with a slight grade to promote runoff from the top and benches, and the compacted surface will also promote runoff. Runoff will be conveyed by benches to a low point in the natural topography, where stormwater runoff will be collected in a temporary or permanent WRF sediment basin; and a small amount of runoff will flow into the pits to be recovered into the existing pits water management system.
18.10 MINE & OTHER INFRASTRUCTURE
18.10.1 MINE INFRASTRUCTURE
The mine buildings and support facilities are located to the east of the process plant area off the main haul road and include the following:
- Explosive Magazine: will consist of an enclosed building constructed on concrete pads or self-container units specifically designed for explosives storage.
- Mine Truck Shop/Mine Services Facility: activities carried out at the truck shop will consist of preventive maintenance and corrective maintenance. Major components will be removed and installed but repaired off-site. The truck shop will be an enclosed steel building, constructed on a concrete pad to eliminate any possibility of discharge. The Mine truck shop will be a single facility that encompasses the mine maintenance office, warehouse, and mine office. The truck wash and the tire workshop facilities will be combined in a separate single facility.
- Heavy Equipment Fuel Storage and Dispensing: will consist of storage tanks and associated pipelines, located within a concrete secondary containment structure.
- Light Vehicle Fuel Station: will consist of storage tanks and associated pipelines within a concrete secondary containment structure.
- Truck Wash Bay: will consist of an open concrete pad and be designed so that all fluids will be recirculated. Water storage (tanks) will be used to hold recycled water for the facility.
- Lube Bay: will be an enclosed steel building constructed on a concrete pad. A tank farm for the various lubrication oils and antifreeze, as well as used oil and used antifreeze, will be located adjacent to the lube bay.
18.10.2 PLANT MAINTENANCE SHOP, WAREHOUSE, & PLANT ADMINISTRATION
The plant maintenance shop, warehouse, and plant administration building will be located on the plant site. The plant maintenance area and warehouse constitute one building located to the north of the crushed feed stockpile and east of the concentrate handling area. Access to this facility will be from the main site access road.
The plant administration building will be located just to the east of the plant site entrance and guard house. This building will contain administration offices and facilities, change houses, and the control room. This will also be the location of the primary parking lot for site operations staff and visitors, with an overflow lot to be located on the west side of Santa Rita Road adjacent to the guard house.
Other facilities to support the process plant operations include:
- a security gate house, which is a modular building with a boom gate for vehicle access.
- a truck scale, located within the concentrate loadout area.
- laboratory
- a laydown yard.
- all internal plant access roads.
19 MARKETING
19.1 COPPER CONCENTRATE
100% of the copper produced at Copper World during the first four years will be in the form of concentrate, and sold externally. Global copper concentrate fundamentals are expected to be strong in the medium/longer term. Smelters globally will seek to maximize metal production to attempt to satisfy unprecedented demand driven by the green energy megatrend.
However, smelters' ability to do so will be constrained by a shortage of mine production. Global markets are expected to compete aggressively for concentrate supply, providing a keen market for offshore sales of Copper World concentrate prior to full implementation of the Concentrate Leach Facility.
These market fundamentals are expected to exert downward pressure on treatment charges, both benchmark and spot, relative to current market conditions. While Copper World's sales profile has not yet been determined given the stage of the Project, it is assumed that some combination of benchmark and spot sales will ultimately be achieved. The balance of the commercial terms assumed are considered to be consistent with the general market.
Concentrate from Copper World is expected to be clean, with no major impurities impacting marketability.
FIGURE 19-1: GLOBAL COPPER PRODUCTION & PRIMARY DEMAND (WOOD MACKENZIE, 2023)

19.2 COPPER METAL
After the initial four years of production, the majority of the copper produced and sold at Copper World will be in the form of metal. As noted above, mine production will constrain global metal production, contributing to a structural deficit in the medium/long term. This scenario is now a well-established industry consensus. In such a market, buyers are expected to compete aggressively for available units.
The US market specifically will continue to be a significant net metal importer, requiring units from Canada and South America to attempt to satisfy strong demand. The trend toward reshoring of US manufacturing capacity is expected to reinforce the US's position as a key importing market.
In such a market, Copper World's cathode production, once the concentrator leach facility is implemented, will generate strong interest. The product will be sold domestically, with significant optionality regarding the ultimate customer base.
The Copper World metal production is expected to be LME/Comex deliverable quality with broad potential consumption outlets.
FIGURE 19-2: GLOBAL COPPER MARKET FUNDAMENTALS (WOOD MACKENZIE, 2023)

BEV: battery electric vehicles, PHEV: plug-in hybrid electric vehicles, HEV: hybrid electric vehicles, FCEV: fuel cell electric vehicles, ICE: internal combustion engine
19.3 MOLYBDENUM
Medium/long term fundamentals for molybdenum are forecast to be constructive. China is expected to emerge as a net concentrate importer, supporting global markets.
Regionally, the US will continue to import molybdenum concentrate, as it does now, from locations such as South America.
Consequently, Copper World production is expected to be absorbed regionally, in part helping to satisfy growing molybdenum oxide demand related to the reshoring of the US manufacturing base.
It is expected that Copper World will sell its production on a delivered roaster basis, incurring a processing fee, and subject to a payability common amongst molybdenum roasters. These commercial terms, in conjunction with the molybdenum metal price indicated, equate to a realization of ~88% at the mine gate.
19.4 SULFUR
The global sulfur market will be fundamentally supported in the medium/longer term. Strong demand is expected from the fertilizer industry, as well as lithium producers expected to install sulfur burners. However, supply will be constrained, as the trend toward electrification of transportation reduces the requirement for gasoline, which will reduce byproduct sulfur production.
From a regional perspective, the Arizona region is expected to be an importer, sourcing units from California and Texas, amongst other locations. The logistics associated with this dynamic will result in regional prices exceeding international indexes such as Tampa.
Sulfur will be an important input for Copper World, with third-party, molten sulfur delivery complementing the internally produced sulfur for the production and sale of sulfuric acid.
In arriving at this market assessment and related price assumption, the global sulfur supply/demand balance was first considered. The regional fundamentals and dynamics were then assessed to translate this global assessment into a Copper World specific pricing assumption. Both the global and regional assessments were based on the input of highly regarded industry analysts, such as CRU. Input was also secured from various sulfur market industry participants, whose insight was deemed relevant in informing these market assumptions.
19.5 SULFURIC ACID
The global sulfuric acid market is expected to be strong in the medium/longer term, due to strong fertilizer and metal related demand. Supply will be constrained, however, due to less burnt sulfuric acid production caused by the trend toward reduced byproduct sulfur supply noted above.
The regional Arizona market is also expected to have strong fundamentals, requiring imports from Texas, Mexico, and Utah to satisfy demand. New SX/EW projects will require incremental units.
Sulfuric acid produced at Copper World is therefore expected to be well positioned, providing a new source of truck-delivered supply. Copper World will help to address the regional imbalance, displacing more expensive offshore import options.
Copper World is expected to produce a standard grade sulfuric acid, with the ability to be used in various industrial applications, including SX/EW production.
As with molten sulfur, a global sulfuric acid market view was first developed, based on the supply/demand fundamentals expected to prevail in the medium/long term. Regional-scale supply/demand balances and dynamics were assessed to derive selling price assumptions. Input from internationally recognized analysts, such as CRU, was secured, as was input from major credible industry participants. These inputs informed the pricing assumptions used.
19.6 SILVER DORE
The silver doré grade is expected to be greater than 85% silver on average. The silver doré will be shipped to and refined by a third-party refinery. This refinery will perform refining services either as a toll refiner (fee-for-service) and subsequently crediting Hudbay with outturn precious metal credits or, will refine and purchase the outturn precious metals from Hudbay. We estimate provisional payment for 95% of the metal content value upon arrival at the refiner's premises (or other predetermined destination), with financing rates of 3% or less.
Globally, there are numerous LBMA Good Delivery refiners, the majority of which reside in China and Japan. Within North America, there are several reputable refiners. Hudbay may engage one or several of these refiners at estimated refining terms that will include precious metal payabilities of 99.90%, a treatment charge of US$0.40 per gross ounce of doré and a refining charge of US$0.55 per ounce of fine gold. Transportation and freight insurance will be contracted out to one of several reputable third-party carriers.
The sale of silver produced from the mineral resources mined at the Project site is subject to a streaming agreement with Wheaton Precious metals. The sale of the silver and gold produced from external purchase of concentrate is not part of this contract.
19.7 MARKETING ASSUMPTIONS USED IN THE ECONOMIC MODEL
Table 19-1 summarizes the assumptions used for the relevant commodities to be sold and purchased, and Table 19-2 summarizes the other relevant marketing assumptions used in the economic evaluation of the Project.
TABLE 19-1: PRICE DECK SUMMARY
|
Metric
|
Unit
|
Total
|
|
Metals
|
|
Copper
|
$/lb.
|
3.75
|
|
Copper Cathode Net Premium*
|
$/lb.
|
0.02
|
|
Molybdenum
|
$/lb.
|
12.00
|
|
Gold - Offtaker
|
$/oz
|
1,650.00
|
|
Silver - Offtaker
|
$/oz
|
22.00
|
|
Gold - Stream
|
$/oz
|
450.00
|
|
Silver - Stream
|
$/oz
|
3.90
|
|
Stream Contracted Escalator
|
% per year**
|
1.00
|
|
Other
|
|
Molten Sulfur - Purchases
|
$/tonne
|
215.00
|
|
Acid - Sales
|
$/tonne
|
145.00
|
|
Electricity
|
$/kWh
|
0.071
|
|
NSR Royalty
|
%
|
3.00
|
|
*Metal premium less freight costs
|
|
**Annual escalator begins in Year 3
|
TABLE 19-2: OTHER MARKETING ASSUMPTIONS
|
Price / Rate
|
Unit
|
Long Term
|
|
Molybdenum Concentrate
|
|
Realization % (of contained value)
|
%
|
88.00
|
|
Dore
|
|
Refining Charge - Dore Bar
|
$/oz
|
0.40
|
|
Refining Charge - Au
|
$/oz
|
0.55
|
|
Payable % - Au
|
%
|
99.90
|
|
Payable % - Ag
|
%
|
99.90
|
|
Freight
|
$/oz
|
1.40
|
|
Cu Concentrate - Sales
|
|
Treatment Charge
|
$/DMT
|
75.00
|
|
Refining Charge - Cu
|
$/lb.
|
0.075
|
|
Payable % - Cu
|
%
|
96.50
|
|
Payable % - Au
|
%
|
90.00
|
|
Payable % - Ag
|
%
|
90.00
|
|
Min deduction - Cu
|
%
|
1.00
|
|
Min grade - Au
|
g/tonne
|
1.00
|
|
Min grade - Ag
|
g/tonne
|
30.00
|
|
Freight
|
$/WMT
|
173.00
|
|
Moisture
|
%
|
8.00
|
|
Cu Concentrate - Purchases
|
|
Purchase Price
|
$/tonne
|
2,100.97
|
|
Mo grade
|
%
|
0.23
|
|
Au grade
|
g/tonne
|
0.30
|
|
Ag grade
|
g/tonne
|
110.00
|
|
Zn grade
|
%
|
0.25
|
|
S grade
|
%
|
34.00
|
|
Freight Capture
|
$/DMT
|
80.00
|
The Qualified Person has reviewed the marketing assumptions used in the financial evaluation of the Project and has validated their supporting documentation and logic.
20 ENVIRONMENTAL STUDIES, PERMITTING, & SOCIAL OR COMMUNITY IMPACT
This section provides details of the following aspects of the Project:
- A summary of environmental studies.
- Project permitting requirements, the status of any permit applications, and any known requirements to post performance or reclamation bonds.
- Social or community related requirements and plans for the Project.
- Plans for waste and tailings disposal, site monitoring, and water management both during operations and post mine closure.
- Mine closure (remediation and reclamation) requirements and costs.
Permits issued for the Project will generally meet specific design and monitoring requirements. For example, the Project will meet the Arizona Department of Environmental Quality (ADEQ) Best Available Demonstrated Control Technology (BADCT) requirements (which includes the Waste Rock Facility, and Tailings Storage Facilities). Equipment specifications, such as for dust collector efficiency, will be part of the permit requirements for an air quality control permit issued by ADEQ. Monitoring and reporting requirements will be required for most of the permits associated with the Project.
20.1 ENVIRONMENTAL STUDIES
As part of both current and past Project activities, numerous surveys and studies related to the biological and cultural aspects of the site have been completed. Additionally, geochemical characterization of site materials has already been performed, along with groundwater and surface water studies. These surveys and studies are summarized below.
20.1.1 BIOLOGICAL
Biological surveys have been conducted on all portions of Hudbay's private land areas. These surveys included federally listed special status plant and animal species. In addition, Hudbay has developed a Special-Status Species Management Plan for the Project. This plan includes best management practices (BMPs) to avoid "take" of listed species while conducting ground disturbing activities on private lands prior to, and during, development of the Project. Surveys have resulted in the relocation of special-status plant species outside of activity areas and awareness and avoidance training for site personnel for all special-status plant and animal species.
20.1.2 CULTURAL
Cultural resource surveys have been conducted on all portions of Hudbay's private land areas. All historical and pre-historical sites that are eligible for inclusion in the National Register of Historic Places have been identified. Data recovery at these sites will be conducted prior to initiating ground disturbing activities in those areas.
Data recovery on portions of the eligible historical sites within Hudbay's private lands has been completed. Additionally, data recovery plans have been developed for the pre-historical sites. These sites are located both on private land and within Hudbay's right-of-way (ROW) on State land associated with the Utility Corridor. The data recovery plan for pre-historical sites on private land has been shared with one of the major local tribes, the Tohono O'odham Nation, for review and input. The Tohono O'odham Nation will also be invited to participate in data recovery efforts on these pre-historical sites.
These actions are in accordance with Hudbay's internal cultural resources protocol. This protocol describes how Hudbay will address cultural resources, including the potential discovery of human remains or funerary objects. No human burial sites are known or anticipated on lands associated with the Project.
20.1.3 GEOCHEMICAL
Geochemical characterization of the materials to be mined and placed in storage facilities has been undertaken as part of the facility design process. Material characterization was conducted as part of a previous mining plan associated with the Rosemont Copper Project located on the east side of the Santa Rita Mountains. Additional geochemical characterization has also been conducted on materials planned for mining on the west side of the mountains. A waste rock management plan was developed as part of the characterization program to mitigate against the occurrence of acid mine drainage from potentially acid-generating (PAG) or acid-generating (AG) materials. Overall, most waste rock is constituted of limestones and has been identified as non-acid generating (NAG). Therefore, the risk of forming acid rock drainage is low based on characterization of the waste rock, and active management of the materials per the management plan.
20.1.4 GROUNDWATER
A groundwater flow model has been developed as part of current permitting efforts for the Project. It is largely based on two previously developed models: the Rosemont Copper Project groundwater model for the east side, and the Tucson Aquifer Management Area model for the west side. The model provides groundwater drawdown predictions and defines the Discharge Impact Area (DIA). Groundwater monitoring will be required during operations and post-closure at select point-of-compliance (POC) monitoring locations, or other receptors.
20.1.5 SURFACE WATER
A site water management plan has been developed as part of current permitting for the Project that incorporates the following concepts:
- To the extent practicable, diversion of unimpacted (non-contact) stormwater around and/or through the facilities to downgradient drainages during operations
- On-site containment of process water (contact water)
- Routing of stormwater off and through reclaimed facilities at closure as much as practicable
- Non-degradation of surface water quality downgradient of the facilities.
Stormwater diversion channels that are temporary and only needed during operations will be sized to handle a 100-year, 24-hour storm event. Process and stormwater ponds will be sized to handle the 100-year, 24-hour event plus operational flows. Stormwater channels that will remain post-closure will be designed to handle a 1,000-year, 24-hour event.
20.2 PROJECT PERMITTING
The Project will require state, county, and local permits and/or authorizations only. No federal authorizations are required. The status of the major permits required for the Project is listed below. Many of the permits have either been issued or are in the active permitting phase. Some will require an amendment based on this Pre-Feasibility Study.
- Groundwater Withdrawal Permit (issued by ADWR)
- Arizona Mined Land Reclamation Plan (MLRP) Authorization (ASMI, issued, an amendment will be needed to match this PFS)
- Class II Air Quality Control Permit (ADEQ, application in progress, an amendment will be needed to match this PFS)
- Aquifer Protection Permit (APP) (ADEQ, application in progress, an amendment will be needed to match this PFS)
- Certificate of Environmental Compatibility (CEC) (for powerline, issued to TEP by the ACC)
- Floodplain Use Permit (FUP) (for waterline within utility corridor, issued by Pima County)
Table 20-1 summarizes these major permits, associated agency, and permit status, for the Project. The table also indicates the permit expiration and/or term limits.
TABLE 20-1: PROJECT PERMITTING STATUS
|
Permit
|
Agency
Type
|
Agency/Description
|
Status
|
Term
|
|
Groundwater Withdrawal Permit
|
State
|
Arizona Department of Water Resources (ADWR) - groundwater for mineral extraction purposes, up to 6,000 acre-feet per annum
|
Issued Jan 18, 2008
|
Twenty Years
Expires Jan 17, 2028
(Renew as needed)
|
|
Arizona Mined Land Reclamation Plan (MLRP) Authorization
|
State
|
Arizona State Mine Inspector (ASMI) - bonding for reclamation of disturbances/facilities under approved MLRP
|
Original authorization issued Oct 19, 2021
Latest update for expanded Project footprint approved Nov 1, 2022
|
Life of Facility
(Amend as needed to match this PFS)
|
|
Class II Air Quality Control Permit
|
State
|
Arizona Department of Environmental Quality (ADEQ) - protection of air quality
|
Application submitted Oct 21, 2022
|
Five Years
(Amend as needed to match this PFS)
|
|
Aquifer Protection Permit (APP)
|
State
|
Arizona Department of Environmental Quality (ADEQ) - protection of groundwater quality
|
Application for area-wide APP submitted Sept 21, 2022
|
Life of Facility
(Amend as needed to match this PFS)
|
|
Arizona Pollutant Discharge Elimination System (AZPDES) Multi-Sector General Permit (MSGP)
|
State
|
Arizona Department of Environmental Quality (ADEQ) - protection of surface waters
|
Apply for coverage when needed. Includes dev. of Stormwater Pollution Prevention Plan (SWPPP) based on detailed facility designs
|
Five Years
(Amend as needed, renew coverage every 5 years as MSGP permit is updated)
|
|
Certificate of Environmental Compatibility (CEC)
|
State
|
Arizona Corporation Commission (ACC) & the Line Siting Committee - for construction of power line (issued to Tucson Electric Power Company [TEP]
|
Issued Jun 12, 2012.
Extensions dated Sept 20, 2018 & Jun 29, 2022
|
Seven Years
(Expires 2029)
|
|
Pima County Flood Control District Permit
|
County
|
Pima County Flood Control District - floodplain use permit (FUP) for water line
|
Issued Jun 14, 2014
|
Annual renewal until constructed
|
|
Right of Way Encroachment - License Agreement
|
Local
Town/City
|
Town of Sahuarita -license agreement to construct water pipeline within town ROW
|
Issued Jun 24, 2013
|
25 Years
(Expires Jun 23, 2038)
|
Other state, county, and local permits that may be needed for the Project are listed below. The need for such permits will be based on final facility designs and will be obtained without impacting on the execution of the mine plan as proposed.
- Floodplain Use Permit(s) issued by Pima County.
- License Agreement and Right of Way Use Permits issued by Pima County (for pipeline crossings).
- Right of Way Use Permit issued by Town of Sahuarita (for pipeline construction).
- Septic Systems issued by ADEQ.
- Drinking Water System issued by ADEQ.
- Well drilling permits issued by ADWR.
- Dam safety permit(s) issued by ADWR may be needed based on final designs.
The following permits are issued and will be modified as needed during construction or pre-construction activities:
- Fugitive dust permit (ADEQ)
20.3 SOCIAL & COMMUNITY REQUIREMENTS & PLANS
Hudbay is committed to ensuring the local community benefits from the Project. This begins by soliciting input from stakeholders and understanding the challenges facing the local communities. The information acquired can then be used during the development process to protect critical values and effectively mitigate impacts that cannot be avoided.
Several of the permits described above will include opportunities for public comment where interested stakeholders will be encouraged to share their views on the Project. In addition, Hudbay intends to engage key stakeholders to directly solicit their input. This information will then be used to develop an effective mitigation plan. Specific details of that plan will be determined as the Project progresses and the community is engaged, but a cost allowance is included in the financial model for the Project.
For example, Hudbay is committed to the preservation of historical and cultural resources and has voluntarily developed an internal data recovery protocol for cultural resources. As part of this protocol, field surveys will always be conducted prior to any site disturbance, and data recovery plans will be developed for eligible sites to archive site artifacts and history. Hudbay is also actively engaged in reaching out to tribal entities that may have cultural ties to the land.
20.4 FACILITY DETAILS & MONITORING
This section provides a summary of water management associated with the major facilities, the design components of these facilities, and monitoring requirements for the Project.
20.4.1 WASTE ROCK FACILITY
Preliminary design of the Waste Rock Facility (WRF) has been completed in preparation of an Aquifer Protection Permit (APP) application to ADEQ. Additionally, geotechnical investigations and stability analyses were completed. The design incorporates temporary sediment basins to be used until the final configuration of the WRF is completed. Once each section of the WRF is finalized, permanent sediment basins will be constructed. Final WRF slopes will be seeded at closure. As much as practicable, stormwater runoff from the WRF will be released offsite through these sediment basins.
A waste rock management plan has been developed to mitigate the potential for acid generation in the waste rock material. NAG materials will be preferentially placed on the outer slopes to ensure surface water meets the required standards. The waste rock management plan was part of the APP application for the Project.
20.4.2 TAILINGS STORAGE FACILITY
Geotechnical investigations, stability analyses, and laboratory testing were completed as part of the design process and were supplemented with historical data to form the basis of design. The design is in accordance with ADEQ's Arizona Mining Best Available Demonstrated Control Technology (BADCT) Guidance Manual (ADEQ 2004).
Tailings storage facilities (TSFs) will all have a conventional impoundment design. Water management for the TSFs includes the capture of drain-down solution (seepage) in an underdrain collection system for reuse in the process. Impacted stormwater is also captured and pumped to the process circuit. Unimpacted stormwater is released to downgradient drainages.
The seepage collection system for the TSFs will be operated throughout the life of the facility and into closure. In addition to managing seepage at closure, stormwater will be managed. A growth media cover will be placed on the surface and side slopes of the TSFs and revegetated. The top surface will be graded as needed to route stormwater off the facility and into natural drainages. This will limit the potential for infiltration of precipitation events into the tailings. The use of sulfate treatment cells is also anticipated in the post-closure period.
20.4.3 OPEN PITS
The Project will involve mining four open pits. These pits, from west to east, include Peach-Elgin, West, Broadtop Butte, and East pits. Current plans outline the backfilling of the West and Broadtop Butte pits with waste rock at closure, as well as the Peach-Elgin pit. The East pit will remain open at closure.
Dewatering will be conducted as needed during operations for the open pit areas. Water from dewatering wells will generally be used in processing or for general dust control. Stormwater collected in pit sumps will be used for dust control within the pit shells or be pumped to the processing circuit.
Site investigations and pit slope stability analyses were conducted to demonstrate adherence to recommended slope safety factors.
20.4.4 PROCESS PLANT
The Plant site area will contain four lined ponds, three of which are considered process ponds: Primary Settling Pond, Reclaim Pond, and Raffinate Pond. The fourth pond (Process Area Stormwater Pond) is a stormwater pond that will receive runoff from the Plant site area during storm events.
The Plant site pond designs include the following BADCT components:
- A double-lined composite liner system for the process solution ponds with a leak collection and removal system (LCRS)
- A single-lined composite liner system for the stormwater pond.
The remaining Plant site's operational and maintenance facilities will be designed and constructed as a non-discharge facility to meet exemptions listed in Arizona Revised Statute (A.R.S.) §49-250(B).
Facilities will be removed at closure, including the plant area ponds.
20.4.5 MONITORING & INSPECTIONS
The following monitoring and inspections will be performed during operations:
- Fugitive dust and stack emissions monitoring
- PM10 station monitoring (dust particulates)
- Meteorological station monitoring (wind speed, rain fall, etc.)
- Air pollution control equipment testing
- Stormwater sampling at outfalls
- Groundwater level and water quality monitoring (at POC or other monitoring wells)
- Waste rock testing and monitoring of material placement.
- Inspection of pond liner integrity and general pond function
- Monitoring of pond leak collection and recovery system (LCRS) where applicable
- Inspections of waste rock and tailings slope stability
- Pit slope stability/ground control monitoring
- Inspection of conveyance channels
- Moisture content of tailings
- Fresh water pumping volume
20.5 SOCIAL & ENVIRONMENTAL BENEFITS OF THE PROJECT
Once in operation, the "Made in America" copper cathodes produced at the Copper World Project are expected to be sold entirely to domestic U.S. customers, thereby reducing the operation's greenhouse gas ("GHG") and sulfur (SO2) emissions by reducing overseas shipping, smelting and refining activities relating to copper concentrate (Figure 20-1). The concentrate leach facility will refine 58% of the total processed copper into finished cathodes, with these GHG reduction benefits, the remainder will be sold as copper concentrate.
The company estimates that the total GHG emissions of the Project will be reduced by more than 14% when compared to a design that only produces copper concentrates for overseas smelting and refining. This reduction is comprised of both ocean freight shipping reductions, and overseas smelter energy usage and direct emissions reductions. Hudbay is targeting further reductions in the Project's GHG emissions as part of the company's specific emissions reduction targets at its existing operations to align with the global 50% by 2030 climate change goal. Hudbay has integrated GHG reduction initiatives as part of its design for the Copper World Project, and the company expects to further reduce GHG emissions through advancing many green opportunities. Constructing the full 100% capacity concentrate leach facility at inception would reduce total GHG emissions by 25%.
There are several emission reduction strategies for Scope 1 and 2 emissions the company is evaluating, including:
- Alternative fuels: moving from diesel to transition fuels like biodiesel for trucks, excavators, and drills, as well as shifting to green hydrogen for haulage trucks.
- Equipment electrification: introducing hybrid haul trucks utilizing an electrified trolley system for key haulage routes; trolley assist, using electricity to move the loaded haul trucks out of the open pit reduced diesel consumption by 90% at our Copper Mountain operation for the trolley segment of the process, and increased the haul truck speed by 80% enabling higher daily production rates per truck.
- Decarbonized electricity through carbon free purchase power agreements
- Installation of wind and/or solar farms at the Copper World site.
- Reductions in general carbon sourced power mix at the power provider. Tucson Electric Power, the local distributor of power to Copper World, has a published plan to provide more than 70 percent of its power from wind and solar resources as part of a cleaner energy portfolio that will reduce carbon emissions 80 percent by 2035.
If Hudbay can secure additional private land to improve the tailings configuration, there is the potential to adopt the dry stack tailings deposition approach that was part of the 2017 Feasibility Study, which would reduce water consumption.
FIGURE 20-1: REDUCING ENERGY CONSUMPTION & GHG EMISSIONS FROM SULFIDE & OXIDE LEACHING


The Copper World Project is expected to generate significant benefits for the community and local economy in Arizona. Over the anticipated 20-year life of the operation, the company expects to contribute more than $856 million in U.S. taxes, including approximately $168 million in taxes to the state of Arizona and $247 million in property taxes that directly benefit local communities. Hudbay also expects the Copper World Project to create more than 750 construction jobs, 430 permanent operating jobs and up to 3,000 indirect jobs within Arizona.
20.6 RECLAMATION & CLOSURE
Copper World assumes responsibility for reclamation of surface disturbances that are attributed to the Project. Reclamation and closure of non-federal lands is regulated by ADEQ and ASMI. Reclamation of surface facilities is covered under a Mined Plan Reclamation Plan (MLRP) approved by ASMI. A Conceptual Closure Plan was part of the APP application to ADEQ for the closure of discharging facilities. The MLRP and area-wide APP will be amended as needed over time as the Project develops, including any as-needed updates to the closure and reclamation costs. Closure and reclamation bonding will be apportioned amongst the agencies as applicable.
20.6.1 RECLAMATION & CLOSURE CONCEPTS
The proposed reclamation/closure design elements for the Project include concurrent reclamation for some of the facilities, to the extent practicable. In general, the following concepts apply to reclamation and closure of the facilities:
- Post-mining land use to include ongoing ranching and wildlife habitats. The top surfaces of the post-mining reclaimed facilities will be used for grazing once vegetation is established.
- Placement of materials in their final configuration throughout the life of the Project, where possible. Facility slopes will be constructed at final reclamation slopes. Final reclaimed facility surfaces will consist of either suitable waste rock or salvaged soil materials.
- Facility grading and stormwater controls will be designed to route as much stormwater runoff away from the reclaimed surfaces as practicable.
- Building facilities within the Plant site will be removed and the area regraded to route stormwater runoff to downgradient drainages. Reclaimed areas will be covered with growth media as needed (i.e., soil salvaged from the facility footprints) and revegetated.
- Reclamation of the Utility Corridor includes the removal of facilities (such as the water and power lines and pump stations) and the regrading and revegetation of disturbed areas.
- Perimeter fencing will remain, especially around pit areas. Some of the pits will also be backfilled.
Additionally, the following post-closure site monitoring and activities are anticipated:
- Management of drain-down solutions tailings facilities (active management followed by passive management)
- Groundwater monitoring at point of compliance (POC) wells
- Surface water monitoring at outfall locations
- Reclamation success monitoring and maintenance, including stormwater conveyance monitoring and maintenance (includes erosion monitoring and maintenance)
Drain-down solution management will be variable for the facilities and could be up to 30-years for the TSFs. Reclamation success monitoring and maintenance is anticipated to occur for 5-years once final covers and/or reclamation activities occur. Reclamation will be staged as needed.
20.6.2 CLOSURE COSTS
For the purposes of this PFS, the estimated closure and reclamation costs attributable to ADEQ and to ASMI are approximately $105.5 million and $27.0 million, respectively.
20.6.3 FINANCIAL ASSURANCE
Certain permits require financial assurance to ensure the success of mitigation, while others are solely to ensure that adequate funds are available at closure. The requisite bonds for the Project are expected to be obtained from the surety market with an estimated annual bond fee of 1.00% of the bond's notional value.
Bonds will be required for ADEQ (closure of discharging facilities) and for ASMI (reclamation of disturbances, including the removal of facilities). Bonding will cover about $105.5 million for APP-related closure costs and about $27.0 million for ASMI-related reclamation costs at an annual premium of 100 basis points. Full bonding of the entire closure costs is assumed from the start of Project construction.
21 CAPITAL & OPERATING COSTS
21.1 CAPITAL COSTS SUMMARY
Total life of mine capital costs of $2,595M consist of $1,690M growth, $542M sustaining, and $362M deferred stripping costs. Growth capital includes two stages of construction; the first stage is the mine, Concentrator Process Plant and related infrastructure totaling $1,323M to be incurred during the 10 quarters prior to commercial production. The second stage is the expanded industrial complex, comprising the Concentrate Leach facility and including solvent extraction and electrowinning (SX/EW), precious metals, sulfur burner, and acid plant facilities totaling $367M that will be incurred during the fourth year of production. Sustaining capital of $542M is primarily mining related costs of the waste rock facility, tailings facility, major repairs and overhauls, and haul roads, as well as plant and general administrative facilities sustaining costs. Deferred stripping of $362M is composed of capitalized mine operating costs for stripping applicable to the portion of the annual strip ratio in excess of the life of mine strip ratio.
TABLE 21-1: CAPITAL COSTS SUMMARY
|
Metric
|
Unit
|
Concentrator Process Plant
|
Concentrate Leach Facility
|
Total
|
|
Growth - EPCM
|
$M
|
$833
|
$364
|
$1,197
|
|
Growth - Owner's Costs
|
$M
|
$490
|
$4
|
$494
|
|
Growth - Subtotal
|
$M
|
$1,323
|
$367
|
$1,690
|
|
Sustaining
|
$M
|
$542
|
$0
|
$542
|
|
Deferred Stripping
|
$M
|
$362
|
$0
|
$362
|
|
Total
|
$M
|
$2,227
|
$367
|
$2,595
|
21.2 GROWTH CAPITAL COSTS
Growth capital costs are detailed in Table 21-2 to Table 21-3 and are split between the Engineering, Procurement, Construction and Management (EPCM) contractor and Hudbay's owner's costs.
The Concentrator Process plant EPCM costs arise primarily from the construction of the processing plant and related infrastructure, plus indirect costs, and contingency. The costs are based on a 60,000 tons per day throughput including comminution, copper, and molybdenum flotation, concentrate handling, and tailings storage, producing copper and molybdenum concentrates over a 20-year mine life. The Concentrate Leach Facility EPCM costs will be incurred in Year 4 of production and include construction of a copper concentrate leach (Albion) circuit, precious metals plant, sulfur burner, acid plant, and a SX/EW plant.
Hudbay's owner's costs include purchase of mining fleet, pre-stripping, tailings facility, earthworks and roads, indirect costs, contingency, and all G&A costs capitalized prior to start of production (ten quarters of construction for the Concentrator Process Plant and four quarters of construction for the Concentrate Leach Facility). The capital costs for mining are based on conventional open pit equipment as described in Section 16. Support equipment includes track dozers, graders, rubber-tired dozers, and additional ancillary equipment.
21.2.1 EPCM GROWTH CAPITAL COSTS
Table 21-2 details the EPCM cost estimates by category while Table 21-3 provides a summary of the basis and level of engineering by category.
TABLE 21-2: GROWTH CAPITAL EPCM COSTS DETAILS
|
Metric
|
Unit
|
Concentrator Process Plant
|
Concentrate Leach Facility
|
Total
|
|
Sitewide
|
$M
|
$22
|
$0
|
$22
|
|
Mining
|
$M
|
$34
|
$0
|
$34
|
|
Primary Crushing
|
$M
|
$31
|
$0
|
$31
|
|
Sulfide Plant
|
$M
|
$270
|
$0
|
$270
|
|
Molybdenum Plant
|
$M
|
$21
|
$0
|
$21
|
|
Reagents
|
$M
|
$10
|
$3
|
$14
|
|
Plant Services
|
$M
|
$12
|
$0
|
$12
|
|
Acid Plant
|
$M
|
$0
|
$79
|
$79
|
|
Concentrate Leach SXEW
|
$M
|
$0
|
$28
|
$28
|
|
Precious Metal
|
$M
|
$0
|
$7
|
$7
|
|
Leach Plant (Albion)
|
$M
|
$0
|
$140
|
$140
|
|
Site Services and Utilities
|
$M
|
$4
|
$0
|
$4
|
|
Internal Infrastructure
|
$M
|
$52
|
$0
|
$52
|
|
External Infrastructure
|
$M
|
$112
|
$0
|
$112
|
|
Common Construction
|
$M
|
$33
|
$13
|
$46
|
|
Other
|
$M
|
$98
|
$37
|
$134
|
|
Contingency
|
$M
|
$134
|
$57
|
$191
|
|
Total
|
$M
|
$833
|
$364
|
$1,197
|
TABLE 21-3: BASIS FOR PLANT COSTS ESTIMATE

Estimated costs for major mechanical equipment (taken from the mechanical equipment list) were based on budgetary quotes mainly from equipment vendors: Metso Outotec, and Glencore Technology, Air Liquide, Metso, Noram and Ausenco engineering firm's database. Installation costs have been developed by applying unit manhours based on recent contractor's price submissions from a similar project in the southwestern United States and applying average craft crew hourly rates provided by Sundt Construction. Freight costs were factored based on the mechanical equipment supply cost.
Each line item of the estimate is developed initially at bare cost only. A growth allowance has then been allocated to each element of those line item costs to reflect the level of definition of design (Quantity Maturity) and pricing strategy (Cost Maturity). The purpose of estimate growth is to cater for items such as accuracy of quantity take-offs, labor hours, productivity expectations, and bulk material budget pricing. Where an allowance has been used, no growth has been applied.
The capital cost estimate accuracy is gauged by meeting, as a minimum, the guidelines and standards set out in this basis of estimate. This capital cost estimate will be deemed with an accuracy range of -15% to +20%, according to Hudbay's Class 4 estimate requirements.
21.2.1.1 CIVIL & STRUCTURAL WORKS
Concrete works allows for all concrete work in the process plant and relevant on-site facilities. Material take-offs have been prepared by engineering and are based on calculations derived from general arrangement drawings and sketches. The basis for the development of installed concrete is the product of concrete material supply and installation costs based on a similar recent project in the southwestern United States. Labor costs include the necessary consumables, reinforcement bar, and formwork.
Structural steel quantities and rates were prepared similarly to concrete, and include the supply of USA steel, fabrication, shop detailing and painting of bulk steel products graded as light, medium, and heavy structural steel designations, and miscellaneous steel including rails, grating and handrail.
Building footprint quantities were prepared using current general arrangement drawings and site plant. Pricing is based on supply and install rates on a cost per square footage from contractor's rates of a recent project in the southwestern United States. Overhead cranes are separate, as part of the mechanical equipment list.
21.2.1.2 MECHANICAL & PLATEWORK
Platework has been factored on the total installed Cost (TIC) of mechanical equipment by WBS level 3 process areas. The factors allow for chutes, launders, hoppers bins, liners and major field-erected tanks and silos.
21.2.1.3 PIPING
The process plant piping has been factored on the installed Cost (TIC) of mechanical equipment by WBS level 3 process areas. The factors allow for pipe, fittings, supports, valves, paint, special pipe items and flanges. Overland pipelines (i.e., tailings sands, fresh water, reclaim water, etc.), supply, and installation pricing are based on unit pipe supply rates received from contractors on similar recent projects in the southwestern United States.
21.2.1.4 ELECTRICAL & INSTRUMENTATION
Supply pricing for major electrical equipment items has been sourced from vendors. Items not vendor sourced, were priced using recent historical data. Installation rates of placement are based on recent contractor's rates from a similar project in the southwestern United States.
Electrical bulks were factored on the total installed cost (TIC) of mechanical equipment by WBS Level 3 process areas. The bulk factors allow for all MV and LV cabling, cable tray, terminations, lighting, grounding, and receptacles. The PCS system has been priced and included in the estimate. The balance of instrumentation has been developed by factoring in the supply costs of the mechanical equipment.
Infrastructure costs include a tap-off of the main utility power line, a switchyard, a substation, and a new transmission line to be built (13 miles), an on-site electrical substation, and distribution throughout the mine, and the facility buildings including guardhouse, administration, truck shop, maintenance, laboratory, truck wash bay, fueling station and weigh scale. This category also includes access road improvements to the facility, as well as roadways throughout the plant and mine facilities, a fresh water well field, water line to plant site (13 miles), and a booster station.
21.2.1.5 INDIRECT
The indirect costs are factored percentages. These factors were applied to Project direct costs. The indirect costs include Common Construction Facilities and Services (Temporary Construction Facilities, support, commissioning, vendor, first fill, spares) as well as engineering costs from the EPCM contractor.
21.2.1.6 CONTINGENCY
Contingency cost has been applied to direct capital costs at a percentage of 20% and determined using a deterministic approach by applying contingency percentages to each of the different commodities aligned to its perceived risk profile.
21.2.2 OWNER'S GROWTH CAPITAL COSTS
The owner's cost includes one year of mine pre-stripping using the mining fleet of the Project.
TABLE 21-4: GROWTH CAPITAL OWNER'S COSTS DETAILS
|
Metric
|
Unit
|
Concentrator Process Plant
|
Concentrate Leach Facility
|
Total
|
|
Mining Fleet & Equipment
|
$M
|
$218
|
$0
|
$218
|
|
Less: Equipment Financing
|
$M
|
-$167
|
$0
|
-$167
|
|
Pre-stripping
|
$M
|
$89
|
$0
|
$89
|
|
Tailings Storage
|
$M
|
$84
|
$0
|
$84
|
|
Earthworks & Roads
|
$M
|
$26
|
$0
|
$26
|
|
G&A and Other
|
$M
|
$149
|
$4
|
$153
|
|
Indirects & Contingency
|
$M
|
$90
|
$0
|
$90
|
|
Total
|
$M
|
$490
|
$4
|
$494
|
The mining fleet equipment is based on heavy and light equipment requirements estimated during the optimization of the mine plan and detailed in section 16 of this document, and includes assembly, labor, and operational readiness. Costs were estimated from budgetary quotes from Empire-CAT, and in comparisons with previous proposals from Komatsu and Empire-CAT. The mining fleet is assumed to be financed at 85% of the equipment value for five years at 7% interest.
The cost of the earthworks for roads, haul roads, waste rock facilities, stockpiles, tailings storage facilities, ponds, process plants areas and water management has been estimated by Hudbay and Wood Engineering from designs at a conceptual and advanced engineering levels including cost estimates from: Wood Engineering, Rango (current contractor), and Hudbay technical personnel.
Indirect costs include mobilization, demobilization, temporary equipment, and infrastructure as well as cost of labor from Hudbay personnel incurred during the construction period. Labor costs are based on the most recent Korn Ferry US mining compensation survey.
21.3 SUSTAINING CAPITAL COSTS
Table 21-5 presents a summary of the sustaining capital costs split between mining, processing, administration, and deferred stripping categories. They include mining fleet purchases, major repairs and overhauls, waste rock facility, tailings facility, haul roads, water management, process plant facilities, and administrative buildings upkeep. New mine fleet purchases are assumed 85% financed over five years at a 7% interest rate.
TABLE 21-5: PROJECT SUSTAINING CAPITAL COSTS SUMMARY
|
Metric
|
Unit
|
Total
|
|
Mining - fleet
|
$M
|
$186
|
|
Less: equipment financing
|
$M
|
-$158
|
|
Mining - all others
|
$M
|
$422
|
|
Processing
|
$M
|
$57
|
|
Admin
|
$M
|
$37
|
|
Total
|
$M
|
$542
|
21.4 OPERATING COSTS
The unit operating costs used in this PFS are summarized in Table 21-6. Mining cost is presented on a total cost basis over tons of material moved and on an operating cost basis excluding deferred stripping. Processing cost is presented on both a per-ton of feed milled and pound of copper produced basis. Onsite G&A is presented on a per ton of feed milled basis.
TABLE 21-6: UNIT OPERATING COST SUMMARY
|
Metric
|
Unit
|
Total
|
|
Mining
|
$/tonne material moved
|
$2.48
|
|
Mining (ex. def stripping)
|
$/tonne material moved
|
$2.18
|
|
Processing
|
$/tonne processed
|
$7.65
|
|
Onsite G&A
|
$/tonne processed
|
$0.90
|
Closure costs are not reflected in Table 21-6 and have been estimated at $132.5M. They will be incurred as $36.175M per year over the two years of closure after the final year of production. Followed by $2M per year over the following 30-year post-closure period.
The unit cash costs and sustaining cash costs (net of by-product credits at stream prices) including deferred revenue over the LOM are summarized in Table 21-7. The cash costs include mining excluding deferred stripping, milling, concentrate leaching, refining, and on-site G&A costs. The cash costs are presented excluding the cost of purchasing concentrate from third parties when the SX/EW plant is not operating at capacity from material produced on-site (final two years of mine plan only). This purchase of 'external' concentrate constitutes an opportunistic strategy to maximize the available capacity of sulfide leach but remains less profitable than processing concentrates from 'internal' production. Sustaining cash costs include cash costs plus royalties and deferred stripping and sustaining capital and are similarly presented excluding purchased concentrate from third parties.
TABLE 21-7: CASH COST SUMMARY
|
Metric
|
Unit
|
Total
|
|
Cash Cost (ex. purchased concentrate)
|
$/lb. Cu prod
|
$1.47
|
|
Sustaining Cash Cost (ex. purchased concentrate)
|
$/lb. Cu prod
|
$1.81
|
Table 21-8 presents the details of the mining operating costs including labor, maintenance, diesel fuel, power, and blasting, as well as indirect costs, but excluding the deferred and pre-stripping costs. Operating mining costs were developed by Hudbay based on a bottom-up approach and utilizing budget quotes from different suppliers, Hudbay operations experience, and labor costs within the region. Site visits were conducted to other facilities currently utilizing the same mining fleet and tailings facilities to better understand the operations and maintenance requirements. Mining operating costs were validated against actual costs at Constancia, and with other similar projects/operations.
TABLE 21-8: OPERATING COST DETAILS - MINING
|
Metric
|
Unit
|
Total
|
|
Labor
|
$M
|
$773
|
|
Maintenance
|
$M
|
$877
|
|
Fuel
|
$M
|
$781
|
|
Power
|
$M
|
$18
|
|
Blasting
|
$M
|
$359
|
|
Indirect
|
$M
|
$196
|
|
Subtotal (excludes pre-stripping costs)
|
$M
|
$3,003
|
|
Deferred Stripping
|
$M
|
-$362
|
|
Total (excludes pre-stripping costs)
|
$M
|
$2,641
|
The operating costs presented in Table 21-9 were derived with a first principles approach and include bulk sulfide flotation, regrind and cleaning, molybdenum flotation, leaching through the Albion process, sulfur purification, and acid burner which covers molten sulfur purchases minus electricity credits, precious metal recovery, and solvent extraction and electrowinning.
TABLE 21-9: OPERATING COST DETAILS - PROCESSING
|
Metric
|
Unit
|
Total
|
|
Sulfide Flotation
|
$M
|
$1,456
|
|
Molybdenum Flotation
|
$M
|
$71
|
|
Concentrate Leaching
|
$M
|
$359
|
|
Precious Metal Plant
|
$M
|
$86
|
|
Acid Plant
|
$M
|
$5
|
|
Molten Sulfur Purchased
|
$M
|
$370
|
|
Tailings & Water
|
$M
|
$313
|
|
Labor
|
$M
|
$272
|
|
Other
|
$M
|
$14
|
|
Total
|
$M
|
$2,947
|
22 ECONOMIC ANALYSIS
This section presents the key financial indicators of the cash flow model supporting the PFS of the Project, as well as sensitivities of these metrics to the most important model inputs. Results are presented in real 2023 US dollars for the life of the mine. The NPV is calculated as of June 30 of Year 3 given the ten quarters of construction in an annual basis model.
22.1 SUMMARY OF RESULTS
Based on the Cash Flow Model results, the Project has an unlevered after-tax NPV8% and NPV10% of $1,100M and $771M respectively, an of 19.2%, a payback period of 6 years including Year 4 investment in the Concentrate Leach Facility, and an annual average EBITDA of $372M at a long-term copper price of $3.75/lb. of copper. The key financial metrics of the Project are summarized in Table 22-1.
TABLE 22-1: KEY METRICS OF THE FINANCIAL ANALYSIS
|
Summary of Key Metrics (at $3.75/lb Cu)
|
|
Valuation Metrics (Unlevered)1
|
Unit
|
Phase I
|
|
Net Present Value @ 8% (after-tax)
|
$ millions
|
$1,100
|
|
Net Present Value @ 10% (after-tax)
|
$ millions
|
$771
|
|
Internal Rate of Return (after-tax)
|
%
|
19.2
|
|
Payback Period
|
# years
|
5.9
|
|
Project Metrics
|
Unit
|
Phase I
|
|
Growth Capital - Concentrator Process Plant
|
$ millions
|
$1,323
|
|
Construction Length - Concentrator Process Plant
|
# years
|
2.5
|
|
Growth Capital - Concentrate Leach Facility (Year 4)
|
$ millions
|
$367
|
|
Construction Length - Concentrate Leach Facility
|
# years
|
1.0
|
|
Operating Metrics
|
Unit
|
Year 1-10
|
Year 11-20
|
Phase I
|
|
Copper Production (annual avg.)2
|
000 tonnes
|
92.3
|
77.5
|
85.3
|
|
EBITDA (annual avg.)3
|
$ millions
|
$404
|
$339
|
$372
|
|
Sustaining Capital (annual avg.)
|
$ millions
|
$33.9
|
$19.4
|
$27.1
|
|
Cash Cost4
|
$/lb. Cu
|
$1.53
|
$1.39
|
$1.47
|
|
Sustaining Cash Cost4
|
$/lb. Cu
|
$1.95
|
$1.62
|
$1.81
|
1 Calculated assuming the following commodity prices: copper price of $3.75 per pound, copper cathode premium of $0.02 per pound (net of cathode freight charges), gold stream price of $450 per ounce, silver stream price of $3.90 per ounce and molybdenum price of $12.00 per pound. Reflects the terms of the existing Wheaton Precious Metals stream, including an upfront deposit of $230 million in the first year of Phase I construction in exchange for the delivery of 100% of gold and silver produced.
2 Copper production includes copper contained in concentrate sold and copper cathode produced from the concentrate leach facility. Average annual copper production excludes partial year of production in year 20.
3 EBITDA is a non-IFRS financial performance measure with no standardized definition under IFRS. For further information, please refer to the company's most recent Management's Discussion and Analysis for the three and six months ended June 30, 2023.
4 By-product credits calculated using amortization of deferred revenue for gold and silver stream sales as per the company's approach in its quarterly financial reporting. By-product credits also include the revenue from the sale of excess acid produced at a price of $145 per tonne. Sustaining cash cost includes sustaining capital expenditures and royalties. Cash cost and sustaining cash cost are non-IFRS financial performance measures with no standardized definition under IFRS. For further details on why Hudbay believes cash costs are a useful performance indicator, please refer to the company's most recent Management's Discussion and Analysis for the three and six months ended June 30, 2023.
22.2 SENSITIVITY ANALYSIS
22.2.1 SENSITIVITY TO KEY INPUT PARAMETERS ON THE FINANCIAL MODEL
The most important model input is the copper price as copper constitutes most of the revenue mix. To assess the sensitivity, six price scenarios were examined, as illustrated in Figure 22-1. Four other parameters were considered for the sensitivity study: growth capex, discount rate, and concentrator leach plant capacity (Figure 22-2 to Figure 22-4). The sensitivity analysis demonstrates that the economics of the Project are very robust in all scenarios.
FIGURE 22-1: SENSITIVITY TO COPPER PRICE

FIGURE 22-2: SENSITIVITY TO CONCENTRATOR PROCESS PLANT GROWTH CAPEX BY 5% INCREMENTS

FIGURE 22-3: SENSITIVITY TO DISCOUNT RATE

22.2.2 SENSITIVITY TO THE ADDITION OF THE CONCENTRATE LEACH FACILITY
To further demonstrate the robustness of the Project, a scenario representing the most conservative configuration was developed based entirely on traditional processing techniques and excluding leaching of the concentrate for the entire life of Project. This "Flotation Only" scenario is based on the same mine and concentrator milling plan as the Base Case. Based on the Cash Flow Model results, Flotation Only still presents a compelling investment case with an unlevered after-tax NPV8% and NPV10% of $863M and $605M respectively, an after-tax IRR of 18.7%, a payback period of 5.3 years, and an annual average EBITDA of $296M at a long-term copper price of $3.75/lb of copper. The key financial metrics of the Project are summarized in Table 22-2.
While the base case includes the leach plant operating at 50% of its maximum capacity and the Flotation Only scenario represents the most conservative approach, additional upside cases considering a larger leaching facility were also tested. Figure 22-4 illustrates the potential to enhance the NPV as the capacity of the leaching facility increases.
FIGURE 22-4: SENSITIVITY TO CONCENTRATE LEACH PLANT CAPACITY

TABLE 22-2: KEY METRICS OF THE FINANCIAL ANALYSIS - SENSITIVITY ANALYSIS
|
Sensitivity Analysis
|
|
Copper Price
|
Unit
|
$3.25/lb.
|
$3.50/lb.
|
$3.75/lb.
|
$4.00/lb.
|
$4.25/lb.
|
$4.50/lb.
|
|
Net Present Value1 @ 8%
|
$ millions
|
$463
|
$786
|
$1,100
|
$1,409
|
$1,710
|
$2,006
|
|
Net Present Value1 @ 10%
|
$ millions
|
$227
|
$503
|
$771
|
$1,033
|
$1,289
|
$1,540
|
|
Internal Rate of Return1
|
%
|
12.7%
|
16.0%
|
19.2%
|
22.4%
|
25.5%
|
28.5%
|
|
Payback Period
|
# years
|
7.9
|
6.7
|
5.9
|
5.4
|
5.0
|
4.4
|
|
EBITDA (annual avg.)2
|
$ millions
|
288
|
330
|
$372
|
413
|
455
|
497
|
|
Concentrate Leach Facility
|
Unit
|
No Conc Leach
(Flotation Only)
|
50% Capacity in
Year 5 (Base Case)
|
50% Capacity
in Year 1
|
100% Capacity
in Year 5
|
100% Capacity
in Year 1
|
|
Net Present Value1 @ 8%
|
$ millions
|
$863
|
$1,100
|
$1,222
|
$1,302
|
$1,524
|
|
Net Present Value1 @ 10%
|
$ millions
|
$605
|
$771
|
$869
|
$922
|
$1,107
|
|
Internal Rate of Return1
|
%
|
18.7%
|
19.2%
|
19.6%
|
20.0%
|
21.0%
|
|
Payback Period
|
# years
|
5.3
|
5.9
|
5.1
|
6.0
|
4.8
|
|
EBITDA (annual avg.)2
|
$ millions
|
296
|
$372
|
389
|
413
|
441
|
|
Copper Prod (annual avg.)3
|
000 tonnes
|
85.8
|
85.3
|
85.1
|
118.0
|
124.5
|
|
Cash Cost4
|
$/lb Cu
|
$1.81
|
$1.47
|
1.39
|
$1.43
|
$1.34
|
|
Sustaining Cash Cost4
|
$/lb Cu
|
$2.15
|
$1.82
|
1.74
|
$1.78
|
$1.69
|
1 Net present value and internal rate of return are shown on an after-tax basis.
2 EBITDA is a non-IFRS financial performance measure with no standardized definition under IFRS. For further information, please refer to the company's most recent Management's Discussion and Analysis for the three and six months ended June 30, 2023.
3 Copper production includes copper contained in concentrate sold and copper cathode produced from the concentrate leach facility. Average annual copper production excludes partial year of production in year 20.
4 By-product credits calculated using amortization of deferred revenue for gold and silver stream sales as per the company's approach in its quarterly financial reporting. By-product credits also include the revenue from the sale of excess acid produced at a price of $145 per tonne. Sustaining cash cost includes sustaining capital expenditures and royalties. Cash cost and sustaining cash cost are non-IFRS financial performance measures with no standardized definition under IFRS. For further details on why Hudbay believes cash costs are a useful performance indicator, please refer to the company's most recent Management's Discussion and Analysis for the three and six months ended June 30, 2023.
22.3 KEY MODEL ASSUMPTIONS
The following subsection details the key assumptions used in the Project cash flow model.
22.3.1 VALUATION APPROACH
All inputs are real 2023 US dollars discounted at real rates of return of 8% and 10% to determine the after tax NPV. The discount rates are based on an assumed weighted average cost of capital plus a low and high case of additional premiums added to account for project specific risk factors. The annual cash flows are discounted using a mid-period assumption to the valuation date at Project start on June 30 of Year -3. No intercompany loan tax shields are included in the cash flows.
22.3.2 PROCESSING
For the first four years of the mine life, mill feed is processed into copper and molybdenum concentrates and sold to third-party smelters. Beginning in Year 5, following the construction of the Concentrate Leach Facility, 58% of the average annual production is processed further into finished cathode and sold to local or regional industrial users, such as makers of copper wire for electric vehicles. In addition, gold/silver doré bars and sulfuric acid are produced as byproducts and sold domestically. The Concentrate Leach Facility has been purposefully sized smaller than the available internal feed, and constructed several years after the concentrator process plant is built, to optimize the initial investment requirements. By building the Concentrator Leach Facility in Year 4, the Project will generate enough cumulative free cash flow in Years 1 to 3 to fully fund the construction without need for additional financing.
A value enhancing option is included in the model related to the acid plant capacity which is not filled from processing internal sources of feed. To optimize the plant capacity, third-party molten sulfur feed is assumed purchased at a delivered to mine price of $215/tonne as described in section 19. Sulfuric acid produced both internally and from external purchased sulfur feed is sold domestically at local market price.
A significant upside opportunity not included in the model relates to the capacity of the Concentrator Leach Facility. If additional Capex is invested to expand the capacity of the Concentrator Leach Facility, it would provide the needed capacity to process all the internal and third-party purchased copper concentrates, into finished cathodes. The result would be a significant increase in finished cathode production, with a small increase in initial capital and annual fixed cost, but this option has not been considered in this PFS.
22.3.3 METAL PRICE & OTHER MARKETING ASSUMPTIONS
The metal price and other marketing assumptions used in this economic evaluation have been detailed in Table 19-1 and Table 19-2 with the supporting assumptions discussed as well in section 19 of this Technical Report.
22.3.4 ROYALTY
A net smelter return (NSR) royalty of 3.0% exists on the Project and is included in the economic analysis. The calculation of the royalty includes revenues from the sale of products processed from internally mined resources, assumes gold and silver is sold at the market price, deducts offsite costs, and for finished cathodes includes customary smelter/refinery deductions for payability, treatment, refining, and freight.
22.3.5 STREAM
The Project is subject to a precious metal streaming agreement with Wheaton. Given certain ambiguities in the contract arising from the change in the development plan for the Project since the 2017 Feasibility Study, Hudbay and Wheaton have commenced discussions regarding a possible restructuring of the stream agreement based upon the new mine plan and processing plant design.
For the purposes of this PFS, the existing Stream arrangement terms have been included in the cash flow model. These terms include an upfront deposit of $230M to be received from Wheaton as the first $230M of capex is spent in exchange for delivery of 100% of the silver and gold produced from internally mined resources over the mine life. As silver and gold is delivered to Wheaton, Hudbay will receive cash payments equal to the lesser of (i) the market price and (ii) $3.90 per ounce for silver and $450 per ounce for gold, subject to a one percent contracted annual escalator after three years.
22.3.6 FEDERAL & STATE TAXES
Taxable income for federal income tax purposes is defined as cash revenues minus offsite costs, operating costs, royalties, tax depreciation, depletion, state taxes, and net operating loss (NOL) carry forwards. Taxable income is multiplied by the prevailing federal tax rate of 21% and state tax rate of 4.9% to determine cash taxes payable. Cash taxes are assumed paid in the year incurred. Tax depreciation rates are shown below in Table 22-3.
TABLE 22-3: INCOME TAX DEPRECIATION RATES
|
Year
|
Mine Dev
|
Project
|
Sustaining
|
Capital Explor
|
Infrastructure
|
|
1
|
73.00%
|
10.71%
|
7.14%
|
5.00%
|
5.00%
|
|
2
|
6.00%
|
19.13%
|
14.29%
|
10.00%
|
9.50%
|
|
3
|
6.00%
|
15.03%
|
14.29%
|
10.00%
|
8.55%
|
|
4
|
6.00%
|
12.25%
|
14.29%
|
10.00%
|
7.70%
|
|
5
|
6.00%
|
12.25%
|
14.29%
|
10.00%
|
6.93%
|
|
6
|
3.00%
|
12.25%
|
14.29%
|
10.00%
|
6.23%
|
|
7
|
-
|
12.25%
|
14.29%
|
10.00%
|
5.90%
|
|
8
|
-
|
6.13%
|
7.14%
|
10.00%
|
5.90%
|
|
9
|
-
|
-
|
-
|
10.00%
|
5.91%
|
|
10
|
-
|
-
|
-
|
10.00%
|
5.90%
|
|
11
|
-
|
-
|
-
|
5.00%
|
5.91%
|
|
12
|
-
|
-
|
-
|
-
|
5.90%
|
|
13
|
-
|
-
|
-
|
-
|
5.91%
|
|
14
|
-
|
-
|
-
|
-
|
5.90%
|
|
15
|
-
|
-
|
-
|
-
|
5.91%
|
|
16
|
-
|
-
|
-
|
-
|
2.95%
|
Federal and State NOL carry forwards are included in the model related to past operating losses incurred and deductible from future taxable income. Similarly, tax pool balances arising from project development activities to the end of 2022 are included as opening balances and depreciated according to applicable income tax depreciation rates (Table 22-3).
State severance and property taxes are calculated using applicable rates shown below in Table 22-4. Property tax is modeled utilizing the cost approach, for the first and last five years of the mine life, and a 50/50 pro rata split between income and cost approaches for the intervening years.
TABLE 22-4: OTHER TAX ASSUMPTIONS
|
Metric
|
Unit
|
Rate
|
|
Federal Income Tax
|
|
Income Tax Rate
|
%
|
21.00
|
|
Depletion - Federal Rate - Cu, Au, Ag
|
%
|
15.00
|
|
Depletion - Federal Rate - Acid
|
%
|
23.00
|
|
Depletion - Federal Rate - Mo
|
%
|
22.00
|
|
Depletion - Net Income Limitation
|
%
|
50.00
|
|
State Income Tax
|
|
Income Tax Rate
|
%
|
4.90
|
|
Basis Rate
|
%
|
50.00
|
|
Severance Tax Rate
|
%
|
2.50
|
|
Property Tax
|
|
Discount Rate
|
%
|
13.06
|
|
Assessment Ratio
|
%
|
15.00
|
|
Estimated Primary Tax Rate
|
%
|
13.74
|
|
Income Taxes Allowed
|
%
|
21.00
|
|
Capex Deduction per Year
|
%
|
10.00
|
|
Opening Balance - NOLs
|
|
Federal
|
$M
|
203
|
|
State
|
$M
|
164
|
|
Opening Balance - Tax Pools
|
|
Mine Development
|
$M
|
277
|
|
Capitalized Exploration
|
$M
|
32
|
|
Mineral Property
|
$M
|
170
|
22.3.7 WORKING CAPITAL CHANGES
Working capital for accounts receivable and accounts payable will vary over the mine life based on revenue, operating costs, and capital costs. The turnover rate is 30 days for accounts receivable and 60 days for accounts payable, based on a five-year average of actual results at our North American business units adjusted to account for expected accelerated payments to prime contractors under the Arizona Prompt Pay Act. Finished goods inventory turnover is not modeled as production is assumed to equal sales.
All the working capital is assumed to be recaptured by the end of the mine life and the closing value of the accounts is zero. First fills of consumables and other operating supplies are included in Project capital.
22.4 PRODUCTION PROFILE & COST OF PRODUCTION
Figure 22-5 shows the total copper production from internally mined mill feed and to a small extent from third-party sources during the last 2 years of the Project, as well as the cash cost and the sustaining cash cost per pound of copper. The Project produces 83,000 tonnes of copper annually, including copper in concentrate sold and copper cathodes, on average in a consistent manner. An exception to this is in Year 6, due to initial high grade from mining the East deposit. Production averages at a cash cost and sustaining cash cost of $1.47/lb. and $1.82/lb. of copper respectively, excluding purchased external concentrate. Purchases of third-party copper concentrates are made in the final two years of the mine life to optimize the processing capacity as the mine plan winds down.
Figure 22-6 shows the cash and sustaining cash costs per pound of copper produced on an annual basis (excluding purchases of third-party copper concentrate). The benefit of equipment financing on fleet purchases in sustaining capex is not included.
FIGURE 22-5: PRODUCTION PROFILE (KTONNES)

FIGURE 22-6: SUSTAINING CASH COSTS

22.5 DETAILS OF THE ECONOMIC MODEL & CASH FLOW PROFILE
A summary of the annual cash flows, Capex and cumulative cash balance is presented in Figure 22-7, and the details of the cash flow model are presented in Table 22-5 and Table 22-6.
The life of mine cash flow shows that the Project generates on average $252M in annual net cash flow from Years 1 to 20, a pay back after 6 years including the construction of the Concentrate Leach Facility in Year 4, and a cash balance of US$4 billion at the end of the mine life.
At the end of the mine life, a low-grade stockpile containing 40.9 million tonnes grading 0.16% Cu, 0.01% Mo, 2.1g/t Ag, and 0.01 g/t Au remains unprocessed due to lack of available land to deposit more tailings. This material is classified as measured and indicated mineral resources and retains potential for economic extraction should Hudbay secure additional surface rights in the future. This stockpile explains the difference between the tonnage reported as 'ore mined' and the tonnage milled in Table 22-5.
Year 25 includes the present value of mine post-closure costs discounted at 10% expected to be incurred from Year 26 to Year 52.
FIGURE 22-7: LOM CASH FLOW PROFILE

TABLE 22-5: CASH FLOW MODEL - PHYSICALS

TABLE 22-6: CASH FLOW MODEL - UNITS COSTS

TABLE 22-7: CASH FLOW MODEL - CASH FLOWS

23 ADJACENT PROPERTIES
The author is not of any relevant work on properties immediately adjacent to the Project.
24 OTHER RELEVANT DATA & INFORMATION
There are no other data or relevant information material to the Project that is necessary to make this Technical Report not misleading.
25 INTERPRETATION & CONCLUSIONS
25.1 RECENT HISTORY OF THE PROJECT
Hudbay previously completed a Preliminary Economic Assessment contemplating the joint development plan of all the deposits at Copper World in a two-stage approach and published the results in its 2022 Technical Report of the Copper World project. The first phase of the proposed mine plan in the 2022 PEA extended for 16 years and was limited to mining and disposing waste and tailings on land expected to require only state or local permits. A second phase extended the mine life to 44 years through an expansion onto federal land to mine the entire deposits and would require federal permits.
Since the PEA was published in May 2022, Hudbay has conducted infill drilling, new metallurgical testing work, as well as additional engineering for process plant design, and for the mine's and tailings infrastructures within the land limits expected to require only state and local permits.
This Technical Report describes the latest resource model, mine plan, current state of metallurgical testing, operating cost, and capital cost estimates supporting a Pre-Feasibility study for the combined development of this first phase of the Copper World project and supersedes and replaces the 2022 PEA. Mineral reserve estimates include the measured and indicated mineral resource estimates mined and processed within the 20-year mine life considered for this Pre-Feasibility study. This Report also includes an update of the mineral resource estimates exclusive of the mineral reserve estimates, including the substantial mineral resource that was part of the second phase of the 2022 PEA. These mineral resource estimates retain potential for economic extraction subject to additional drilling, positive results from heap leaching tests and securing the required permits to expand the operation on lands requiring Federal permits.
25.2 OPEN PIT MINING
The mining sequence considers the exploitation of the pits and their associated infrastructure over a footprint expected to require only state and local permits for 20 years (plus one year of pre-stripping). During this period, all waste, tailings, and low-grade stockpiles are also disposed of within the limits of Hudbay's private land properties. The open pits are mined in a sequence consisting of 11 mining phases for a total lifetime of 20 years, plus one additional year of pre-stripping.
Through the life of mine 426 million tonnes of concentrator feed and approximately 777 million tonnes of waste will be extracted, yielding a life of mine stripping ratio of 1.8 (including pre-stripping material). Out of this 426 million tonnes of concentrator feed, only 385.1 million tonnes are actually processed in this PFS over the 20 year of the Project due to a lack of space for tailings deposition.
An important constraint on the mine production schedule is the limited space for disposing of waste rocks, tailings, and low-grade stockpiles, resulting in a sub-optimum mining sequence from a strict economic standpoint. However, the current mine plan allows the mine to operate in a sustainable manner for 20 years. Securing federal permits earlier would unlock significant benefits to the project by removing these important constraints on the mining schedule and likely allow more tons and/or better grades to be mined earlier than currently planned.
25.3 METALLURGY & PROCESSING
Following the acquisition of the Project in 2014, Hudbay undertook a series of metallurgical programs focused on the East deposit. The objective of the testing campaigns was to improve the correlation between mineralogy and the metallurgical characteristics, considering mineral processing through flotation only.
After the discovery of the Copper World deposits in 2020, Hudbay has engaged several laboratories and consultants to perform additional mineralogical and metallurgical testing on these new mineral deposits. Since the original test work was focused only on the flotation recovery of sulfide copper and did not employ CPS potential (controlled potential sulfidization), recent test work was also used to update flotation recovery on a deposit-by-deposit basis. Limited test work has also been conducted to establish the molybdenum and silver and gold recoveries as well as leaching of the copper concentrate and for the flotation of sulfur.
The processing facilities include a concentrate leach and solvent extraction and electro-winning (SX/EW) facility, a sulfide concentrator, and an acid plant. The capacity of the sulfide concentrator is 60,000 tons per day.
The mill consists of conventional crushing, grinding, flotation, molybdenum separation, concentrate dewatering and tailings dewatering. The copper concentrate produced in the mill is further processed in the concentrate leach facility to produce a pregnant leach solution (PLS) which is treated by SX/EW to produce copper cathode. The SX/EW facility follows a conventional process involving solvent extraction and electrowinning. Along with the Albion Process™, the concentrate leach facility comprises sulfur flotation, dewatering and purification to produce a sulfur concentrate which is processed through an acid plant to produce sulfuric acid. The solids residue from the Albion Process™ is further treated in a precious metals recovery step.
The proposed process plant design for the Project is expected to deliver valuable optionality and meaningful environmental and social benefits, as described below.
25.4 ENVIRONMENTAL STUDIES, PERMITTING, & SOCIAL OR COMMUNITY IMPACT
Studies and surveys that have been completed for the Project include biological and cultural surveys and groundwater, surface water, and geochemical studies. Studies and surveys that have been completed for the Project include cultural and biological surveys for all the affected areas. Geochemical, groundwater and surface water studies have also been performed in support of design and permitting.
The Project is expected to require only state, county, and local permits and/or authorizations. Many of the permits have either been issued, are in the active permitting phase, or are in the process of amendment.
Hudbay is committed to the preservation of historical and cultural resources as well as the protection of endangered and other protected species.
The development plan proposed for the Copper World Project in this PFS will yield many benefits based on the redesign of the project. Copper cathode production, commencing in year 5, has the potential to be sold 100% for the US domestic market to strategically reduce reliance on imports, while at the same time reducing greenhouse gas and sulfur emissions with the proposed flowsheet due to elimination of shipping, smelting and metal refining. The use of a sulfur burner to produce acid used for leaching the oxide mineralization will also contribute to reducing emissions.
The Project will also bring significant benefits for the local stakeholders. In addition to creating employment and opportunities to develop and/or sustain local businesses, property taxes over the 20 years of operation will total to an estimated $856 million in U.S. taxes, including approximately $168 million to the state of Arizona, and $247 million in property taxes which will directly support local taxpayers for more than four decades.
25.5 ECONOMIC ANALYSIS
Based on the Cash Flow Model results, the Project has an unlevered after-tax NPV8% and NPV10% of $1,100M and $771M respectively, an after-tax IRR of 19.2%, a payback period of 6 years including Year 4 investment in the Concentrate Leach Facility, and an annual average EBITDA of $372M at a long-term copper price of $3.75/lb. of copper. The Project development options are sufficiently understood, and the Project shows positive economics to support a decision to proceed to a Feasibility Study.
25.6 RISKS & UNCERTAINTIES
This PFS contains several assumptions and expectations that constitute forward-looking information within the meaning of applicable Canadian and United States securities legislation. Forward looking information includes, but is not limited to, Hudbay's expectations with respect to the cost, permitting requirements and design of the Project, the technical and economic viability of the Project, the renegotiation of the streaming agreement in respect to the Project, and the sale of mineral products from the Project, legal challenges with respect to the Project, and the potential to advance and further improve the Project. Please refer to the Cautionary Statements at the beginning of this Technical Report for further information regarding the assumptions, risks and uncertainties associated with all such forward-looking information presented in this Technical Report.
26 RECOMMENDATIONS
26.1 DRILLING & RESOURCE MODELING UPDATES
Future drilling programs should focus on converting as much as possible of the mineral resource estimate included in the first 6 years of the mine plan to the measured category to support a feasibility study. The objective would be to increase confidence for the estimated payback period of the Project.
26.2 FEASIBILITY ENGINEERING WORK
Hudbay has developed a thorough Feasibility Study "FS" scope and detailed budget for commencement of the feasibility work for the Project. Hudbay estimates that in addition to the budget for the infill drilling recommended above, a FS will cost approximately $85-90 million to complete. Hudbay has the required funding in place to complete the FS work in 2024/2025 and may consider seeking a joint venture partner before proceeding with the investment.
The following subsections provide some detail on some of the components of the FS.
26.2.1 GEOTECHNICAL INVESTIGATION & DESIGN
Geotechnical investigations are needed for the main infrastructure to be developed: Pits, WRF, TSF, and Process plants. This investigation will be complementary to the geotechnical investigation already carried out for the main infrastructure. The investigation will consist of: Drilling, logging, mapping, field testing, instrumentation, laboratory testing, and geotechnical analysis.
The objectives of the geotechnical investigation include:
- Foundation works for the main infrastructure: Process plants, TSF, and WRF
- Stability Analysis for this main infrastructure
- Geotechnical model development based on geotechnical units and structural domains for obtaining geotechnical domains.
- Slope stability design and optimization for all the pits
- Instrumentation and monitoring plan
- Geotechnical recommendations for construction and operation
- Corrosion study, and electrical resistivity
Based on the geotechnical results, confirmation/updated facility designs will be completed for:
- Pits design and slope configurations
- Waste Rock Facility design, foundations, and slopes
- Tailings Storage Facility design and methodology, foundations, slopes, and elevation.
- Tailings construction sequence
- Tailings deposition plan
- Water management plan
- Process Plants foundation and platforms
- Bulk density model
26.2.2 SURVEYS
Topographic surface surveys will be completed to include more details about the land, including surface features that might have been altered during the prefeasibility survey, and to establish terrain and elevations for the design.
26.2.3 HYDROGEOLOGY INVESTIGATION & STUDY; GROUNDWATER MODEL & PIT DEWATERING
Hydrogeological investigation and studies will be carried out for both east and west areas. As a result of this study, an integrated hydrology and hydrogeology model will be updated to a feasibility level.
As part of this study, a groundwater model will also be updated and verified. This includes:
- Field hydro investigation on the east and west areas
- Updated integrated hydrology and hydrogeology models.
- Regional hydrogeological model
- Baseline calibration model
- Predictive mining phases and closure models
- Particle transport and mitigation
- Hydrogeological model
- Groundwater study
- Pit dewatering
- Water balance
26.2.4 GEOCHEMICAL IMPACT ASSESSMENT
A complementary geochemical impact assessment will be developed to complete:
- Potential acid material and non-acid material analysis
- Facilities predictive seepage predictive geochemistry
- Pit backfill predictive geochemistry.
- Pit lake predictive geochemistry
26.2.5 MINING
The following work will need to be completed:
- Geologic and resource modeling
- Life of Mine plan
- Mine surface infrastructure design
- Open Pit slope stability design and pit dewatering plan
- Waste rock management: geochemistry, risk assessment, detail plans, and schedule
- Tailings management of the different tailings storage facilities
- Equipment selection with detailed sizing
- Capex for the owner's cost
- Opex cost for mining (drilling, blasting, loading, haulage, and indirect)
- Sustaining Capital Cost for mining equipment, and maintenance
26.2.6 WATER MANAGEMENT
Water management includes the management plan and site wide water balance. A water quality and quantity model would be updated with the latest information. A preliminary reverse osmosis design will be required to provide potable water.
26.2.7 METALLURGY & PROCESSING
Additional metallurgical characterization of the deposit is recommended as follows:
- Comminution testing: variability will need to be completed.
- Flotation testing: variability will need to be completed.
- Concentrate filtration testing.
- Thickener settling testing.
- Tailings sand cyclone testing.
- Concentrate leach variability needs to be completed.
- Metallurgical simulation
- Metallurgical balance will be detailed.
- Product quality confirmation
- As an option, a pilot plant
The FS study requires certain deliverables to be completed to support the capital cost estimate and design. These deliverables include:
- Basic engineering to be optimized and complete (total engineering 30% complete). All design trade-offs completed, and final configuration to be frozen.
- Process Design: flow diagrams frozen, mass balance, water balance, process calculations, plant equipment sizing, surge capacity and reagent list. Key piping and instrumentation diagrams to be prepared.
- Detailed general arrangements: site layout, detailed plot plans, locations of all process areas and site buildings, advanced 3-D model.
- Design standards established, general specifications completed, and process design criteria set.
- Requisite infrastructure and project utilities fully identified.
- Operating and control philosophy for all systems to be detailed.
- Mechanical and Piping: equipment data sheet for major equipment, equipment specifications detailed, mechanical equipment list, design criteria, and detailed list of all process pipelines, valve, and materials specifications.
- Civil Work: semi detailed topographical maps, detail loadings and quantities, and water features defined.
- Structural Concrete: design criteria, erosion control, and material take-offs.
- Electrical and Instrumentation: design criteria, load list, electrical equipment list, and single line diagrams to be completed, electrical control rooms designed, power requirements confirmed, pole locations mapped, and unit costs sourced from power company.
- Information system with details on key systems: communication system defined and designed.
- Risk Study: A formal risk analysis to be completed including a HazOp.
26.2.8 INFRASTRUCTURE & SITE LAYOUT
Additional testing and data are required to further define the infrastructure and site layout requirements, and associated costs in these areas:
- Trico and TEP contract established.
- TEP grid analysis/power study
- TEP feasibility study on high voltage line and switchyard.
- Hydrogeology and water quality testing on water sources surrounding the mine site to determine the volumes and quality of water available to support the mill and services infrastructure.
26.2.9 LOGISTICS & PROCUREMENT
Detailed logistic plans will need to be developed, as well as transportation plans. The FS study will have a material and equipment sourcing plan outlined, and warehousing for construction and operations identified. Key long-lead items will be investigated for early procurement as a strategy.
26.2.10 WASTE & WATER MANAGEMENT
A complete hydrogeological review of water in the mining area needs to be undertaken. This entails both quantity and quality sufficient for operation of the process plant and mine, as well as confirming the water availability, and designing ground wells. In addition, the precipitation and drainage areas need to be determined for proper estimating of diversion dam/ditches to minimize the contact of fresh water with mining areas.
The tailings management facility and waste rock management facility areas need to have complete hydrological feasibility evaluations completed for surface runoff, ground water, and seepage.
ARD and metal leaching test work needs to be developed and completed for proper waste rock characterization and development of storage options.
26.2.11 WORKFORCE & SCHEDULE
The FS will identify the Project management staffing requirements, including the owner's project management team roles, and organization charts will be established. Pre-construction services will be consulted as part of the development of the FS. This will aid in constructability analysis, construction labor force estimates, and productivity rate estimates.
The following schedules will be developed during the FS:
- Mine development plan: detailed schedule
- Project Master Schedule: Level 3 schedule with logic including major milestones, deliverables, and procurement activities.
- Construction Schedule: Semi complete schedule with critical path activities
- Commissioning and ramp-up: monthly critical path developed.
26.2.12 ENVIRONMENTAL, PERMITTING, SOCIAL, & SUSTAINABILITY
Hudbay's permitting plan for the Project is to continue the work to obtain the necessary permits that are expected to be required, as further discussed in Section 20. Applicable permit conditions will be consolidated and incorporated into the feasibility design. Facility changes resulting from the feasibility level design effort will be evaluated against current permit layouts/conditions. Future permit modifications/amendments are anticipated based on final feasibility level designs. A modification to the Mined Land Reclamation Plan (MLRP) is anticipated, along with amendments to the air quality control permit and the aquifer protection permit.
Hudbay has been engaging with tribal communities that have a cultural heritage link to the Project site in general, and specifically to the Santa Rita Mountains. These interactions are anticipated to continue throughout the feasibility study timeline and will result in the incorporation of mitigation measures that fall under the Cultural Resources category. Mitigation measures could include the salvage and planting of culturally important plants. Additionally, Hudbay is actively planning for data recovery at cultural sites located on private land within the footprint of the Copper World Project, including both historical and prehistorical sites. Local tribes have been invited to participate in data recovery at prehistorical sites since they are linked to their history. Early site preparation activities, such as data recovery of eligible cultural sites, will provide clarity in construction planning during the feasibility phase.
Other site preparation plans that will be developed include, but are not limited to, the following:
- Building demolition planning (including asbestos surveys)
- Plant salvage (plants such as saguaros, in addition to tribal plant collections)
- Well and septic tank abandonment.
Basic data collection will continue covering a wide range of diverse subjects, including weather, water flows, vegetation, wildlife, and socio-economic considerations. A comprehensive program will need to be established to collect the required information necessary to comply with the respective agency permit application requirements and associated with the mini-EIS components listed above.
A local community impact assessment will be completed, and regular meetings with the community and stakeholders will continue.
As part of sustainability, studies will be concluded to ensure a net positive outcome regarding the Toward Sustainable Mining (TSM) considerations.
REFERENCES
Anzalone, S., 1995. The Helvetia Area Porphyry Systems, Pima County, Arizona. In: Pierce, F.W. &. Bolm, J.G. ed. Porphyry Copper Deposits of the American Cordillera: Arizona Geological Society Digest 20.
Augusta Resource Corp., 2012. NI 43-101 Technical Report: Updated Feasibility Study, Pima County, Arizona USA.
Barra, F., Ruiz, J., Valencia, V.A., Ochoa-Landin, L., Chesley, J.T., &. Zurcher, L., 2005. Laramide porphyry Cu-Mo mineralization in northern Mexico: Age constraints from Re-Os geochronology in molybdenite. Economic Geology, 100(8), pp. 1605-1616.
Bray, J. & Travasarou, T., 2007. Simplified Procedure for Estimating Earthquake-Induced Deviatoric Slope Displacements. Journal of Geotechncal & Geoenvironmental Engineering, 133(4), pp. 381-392.
Briggs, D.F., 2014. History of Helvetia-Rosemont Mining District, Pima County, Arizona. Arizona Daily Independent, 15-17 March.
Briggs, D.F., 2020. Helvetia-Rosemont, Arizona's Hardscrabble Mining Camp. Contributed Report CR-20-A:Arizona Geologic Survey.
Call & Nicholas, Inc. (CNI), January 2016. 2015 Pit Slope Feasibility Evaluation For The Rosemont Deposit: Revision 02.
CIM, 2011. NI 43-101 Standards of Disclosure for Mineral Projects, Form 43-101F1 Technical Report and Related Consequential Amendments. [Online]
Available at: https://mrmr.cim.org/media/1017/national-instrument-43-101.pdf. [Accessed 5 May 2023].
CIM, 2014. Definition Standards for Mineral Resources & Mineral Reserves. [Online]
Available at: https://mrmr.cim.org/media/1128/cim-definition-standards_2014.pdf. [Accessed 5 May 2023].
CIM, 2019. Estimation of Mineral Resources & Mineral Reserves Best Practice Guidelines. [Online]
Available at: https://mrmr.cim.org/media/1146/cim-mrmr-bp-guidelines_2019_may2022.pdf
[Accessed 5 May 2023].
Drewes, H., 1971. "Miscellaneous Geologic Investigations MAP I-613: Geologic Map of the Sahuarita Quadrangle, Southeast of Tucson, Pima, County, Arizona: United States Geologic Survey.
Glencore Technology, 2022. Personal Communication.
Hudbay Minerals Inc., 2017. NI 43-101 Technical Report - Feasibility Study: Updated Mineral Resource, Mineral Reserve and Financial Estimates, Rosemont Project, Pima County, Arizona USA.
Hudbay Minerals Inc., 2022. Preliminary Economic Assessment: Copper World Complex, Pima County, Arizona USA.
ISRM, 1985. Suggested Method for Determining Point Load Strength. In: The Complete ISRM Suggested Methods for Rock Characterization, Testing and Monitoring: 1974-2006.
Kermack, K.A. & Haldane, J.B.S., 1950. Organic Correlation and Allometry. Biometrika, 37(1/2), pp. 30-41.
M3 Engineering and Technology Corporation, 2007. NI 43-101 Technical Report for the Rosemont Copper Project, Feasibility Study, Pima County, Arizona, USA.: Prepared for: Augusta Resource Corporation.
M3 Engineering and Technology Corporation, 2009. NI 43-101 Technical Report for the Rosemont Copper Project, Updated Feasibility Study, Pima County, Arizona, USA.: Prepared for: Augusta Resource Corporation.
M3 Engineering and Technology Corporation, 2012. Rosemont Copper Project: NI 43-101 Technical Report, Updated Feasibility Study, Pima County, Arizona, USA.: Prepared for Augusta Resource Corporation.
Maher, D.J., 2008. Reconstruction of middle Tertiary extension and Laramide porphyry copper systems, east-central Arizona, University of Arizona: Unpublished Ph. D. Diss. thesis.
Parrish, I., 1997. Geologist's Gordon Knot: to cut or not to cut. Mining Engineering Journal, pp. 45-49.
Piteau Associates, 2023. Copper World Complex Project Operational Closure and Water Management Study,.
Ramussen, J., Hoag, C., & Horstman, K., 2012. Geology of the Northern Santa Rita Mountains, Arizona, Fall Field Trip September 15, 2012: Arizona Geological Society.
Simón, A., 2004. Evaluation of Twin and Duplicate Samples: The Hyperbolic Method., Internal document: AMEC Perú Ltda.
Wood Mackenzie, 2023. Global Copper Strategic Planning Outlook - Q2 2023.
| TO: |
British Columbia Securities Commission
Alberta Securities Commission
Financial and Consumer Affairs Authority of Saskatchewan
The Manitoba Securities Commission
Ontario Securities Commission
Autorité des marchés financiers
New Brunswick Financial and Consumer Services Commission
Nova Scotia Securities Commission
Office of the Superintendent of Securities, Prince Edward Island
Office of the Superintendent of Securities, Service Newfoundland and Labrador
Office of the Superintendent of Securities, Northwest Territories
Office of the Yukon Superintendent of Securities
Nunavut Securities Office |
Dear Sir/Madam:
Re: Technical Report titled "NI 43-101 Technical Report, Phase I Pre-Feasibility Study and Updated Mineral Resource Estimates, Copper World Project, Pima County, Arizona, USA" dated September 7, 2023, with an effective date of July 1, 2023
I, Olivier Tavchandjian, consent to the public filing of the technical report titled "NI 43-101 Technical Report, Phase I Pre-Feasibility Study and Updated Mineral Resource Estimates, Copper World Project, Pima County, Arizona, USA" dated September 7, 2023, with an effective date of July 1, 2023 (the "Technical Report") by Hudbay Minerals Inc. ("Hudbay").
Dated this 7th day of September, 2023
(signed) "Olivier Tavchandjian"
Olivier Tavchandjian P. Geo.
Senior Vice President, Exploration and Technical Services, Hudbay
OLIVIER TAVCHANDJIAN
CERTIFICATE OF QUALIFICATION
Re: NI 43-101 Technical Report, Phase I Pre-Feasibility Study and Updated Mineral
Resource Estimates, Copper World Project, Pima County, Arizona, USA
I, Olivier Tavchandjian, P.Geo., of Canmore, Alberta, do hereby certify that:
1) I am currently employed as Senior Vice President, Exploration and Technical Services with Hudbay Minerals Inc. (the "Issuer"), 25 York Street, Suite 800, Toronto, Ontario, Canada, M5J 2V5.
2) I graduated from the Université du Québec à Chicoutimi with a Ph.D. in Mineral Resources in 1996.
3) I am a member in good standing with the Association of Professional Geoscientists of Ontario, member number 0714.
4) I have practiced my profession continuously for over 30 years and have been involved in mineral exploration, project evaluation, resource and reserve evaluation, and technical support to mine operations in underground and open pit mines for base metals, precious metals and bulk commodities in the Americas, Europe, Asia, and Africa.
5) I have read the definition of "qualified person" set out in National Instrument 43-101 ("NI 43-101") and certify that by reason of my education and affiliation with a professional association and past relevant work experience, I fulfil the requirements to be a "qualified person" for the purpose of NI 43-101.
6) I am responsible for the preparation of the Technical Report titled "NI 43-101 Technical Report, Phase I Pre-Feasibility Study and Updated Mineral Resource Estimates, Copper World Project, Pima County, Arizona, USA" (the "Technical Report"), dated September 7, 2023, with an effective date of July 1, 2023.
7) I last visited the Copper World Project in October 2022, for a duration of approximately eleven (11) days. I also visited the Project several times prior to that date, as described further in the Technical Report.
8) As of the date of this certificate, to the best of my knowledge, information and belief, the Technical Report contains all scientific and technical information that is required to be disclosed to make the Technical Report not misleading.
9) I am not independent of the Issuer. Since I am an employee of the Issuer, a producing issuer, I fall under subsection 5.3(3) of NI 43-101 where "a technical report required to be filed by a producing issuer is not required to be prepared by or under supervision of an independent qualified person".
10) I have been involved with the Copper World Project, which is the subject of the Technical Report, continuously since June 2018.
11) I have read NI 43-101 and Form 43-101F1, and the Technical Report has been prepared in compliance with NI 43-101 and Form 43-101F1.
12) I consent to the public filing of the Technical Report with any stock exchange, securities commission or other regulatory authority and any publication by them, including electronic publication in the public company files on their websites accessible by the public, of the Technical Report.
* * *
[Signature page follows]
Dated as of the 7th day of September, 2023.
Original signed by:
(signed) "Olivier Tavchandjian"
Olivier Tavchandjian, P.Geo
HudBay Minerals (NYSE:HBM)
Historical Stock Chart
Von Apr 2024 bis Mai 2024

HudBay Minerals (NYSE:HBM)
Historical Stock Chart
Von Mai 2023 bis Mai 2024
