UNITED STATES
SECURITIES AND EXCHANGE COMMISSION
Washington, D.C. 20549
FORM 6-K
REPORT OF FOREIGN PRIVATE ISSUER
PURSUANT TO RULE 13A-16 OR 15D-16 OF
THE SECURITIES EXCHANGE ACT OF 1934
For the month of December 2023
Commission File Number: 001-34244
HUDBAY MINERALS INC.
(Translation of registrant’s name into English)
25 York Street, Suite 800
Toronto, Ontario
M5J 2V5, Canada
(Address of principal executive offices)
Indicate by check mark whether the registrant files or will file annual reports under cover of Form 20-F or Form 40-F.
Form 20-F [ ] Form 40-F [X]
Indicate by check mark if the registrant is submitting the Form 6-K in paper as permitted by Regulation S-T Rule 101(b)(1): [ ]
Indicate by check mark if the registrant is submitting the Form 6-K in paper as permitted by Regulation S-T Rule 101(b)(7): [ ]
Indicate by check mark whether the registrant by furnishing the information contained in this Form is also thereby furnishing the information to the Commission pursuant to Rule 12g3-2(b) under the Securities Exchange Act of 1934.
Yes [ ] No [X]
If “Yes” is marked, indicate below the file number assigned to the registrant in connection with Rule 12g3-2(b): 82- _____________________________
EXPLANATORY NOTE
On December 5, 2023, Hudbay Minerals Inc. (“Hudbay”) filed on the Canadian Securities Administrators’ System for Electronic Document Analysis and Retrieval (SEDAR) website at www.sedarplus.ca the following documents: (1) News Release - December 5, 2023, (2) Copper Mountain Mine NI 43-101 Technical Report, (3) Consent of Qualified Person, (4) Certificate of Qualified Person.
Copies of the filings are attached to this Form 6-K and incorporated herein by reference, as follows:
-
Exhibit 99.1 — News Release - December 5, 2023
-
Exhibit 99.2 — Copper Mountain Mine NI 43-101 Technical Report
-
Exhibit 99.3 — Consent of Qualified Person
-
Exhibit 99.4 — Certificate of Qualified Person
2
SIGNATURE
Pursuant to the requirements of the Securities Exchange Act of 1934, the registrant has duly caused this report to be signed on its behalf by the undersigned, thereunto duly authorized.
| |
HUDBAY MINERALS INC. |
| |
(registrant) |
| |
|
|
| |
By: |
/s/ Mark Haber |
| |
Name: |
Mark Haber |
| |
Title: |
Executive Director, Legal and Corporate Secretary |
Date: December 6, 2023
3
EXHIBIT INDEX
The following exhibits are furnished as part of this Form 6-K:
4
 |
TSX, NYSE - HBM
2023 No. 26
|
| |
|
25 York Street, Suite 800
Toronto, Ontario
Canada M5J 2V5
tel 416 362-8181
fax 416 362-7844
hudbay,com |
News Release |
| |
|
| |
|
Hudbay Releases Copper Mountain Technical Report and Advances Mine Stabilization Plans
- Average annual copper production of 46,500 tonnes over the first five years with cash costs of $1.89i per pound, and 45,000 tonnes over the first 10 years with cash costs of $1.72i per pound.
- Represents an approximate 90% increase over 2022 production levels and 50% decrease from 2022 cash costs as a result of the implementation of Hudbay's operational efficiencies as part of its stabilization and optimization plans.
- Mine plan reflects Hudbay's plans to stabilize the operation by remobilizing idle haul trucks, opening additional mining faces and accelerating stripping over the next three years, optimizing ore feed to the plant and implementing plant improvement initiatives.
- On track to deliver more than $20 million in targeted annual operating efficiencies and $10 million in corporate synergies over the next three years.
- Efficient capital utilization with minimal capital investment required to expand the mill throughput to the permitted limit of 50,000 tonnes per day.
- Copper Mountain is expected to increase Hudbay's annual copper production by approximately 50% after 2025ii.
- Copper Mountain provides additional leverage to gold with approximately 49,500 ounces of annual gold production on average over the next 10 years.
- Mineral reserve estimates of 367 million tonnes at a copper grade of 0.25% and gold grade of 0.12 grams per tonne support a 21-year mine life and position Copper Mountain as the longest life producing asset in Hudbay's portfolio.
- Additional 140 million tonnes of measured and indicated resources at 0.21% copper and 0.10 grams per tonne gold and 370 million tonnes of inferred resources at 0.25% copper and 0.13 grams per tonne gold, exclusive of mineral reserves, provide significant upside potential for reserve conversion and extending mine life, with infill drilling planned for 2024.
- The technical report represents Hudbay's base case mine plan after acquisition and there are numerous technical studies underway to further enhance the production profile, reduce mining costs and continue process optimization.
Toronto, Ontario, December 5, 2023 - Hudbay Minerals Inc. ("Hudbay" or the "company") (TSX, NYSE: HBM) today announced that it has completed a National Instrument 43-101 technical report in respect of its 75%-owned Copper Mountain mine in British Columbia, Canada. This is Hudbay's first technical report for the Copper Mountain mine since acquiring Copper Mountain Mining Corporation ("CMMC") in June 2023. All dollar amounts are in US dollars, unless otherwise noted.
"We are pleased to release our first mine plan for Copper Mountain which demonstrates the meaningful copper production this long-life asset brings to our operating platform and the unique opportunity we have to leverage our efficient operating capabilities to drive value," said Peter Kukielski, Hudbay's President and Chief Executive Officer. "We have applied our proven reserve and resource estimation methodology to develop a prudent and reliable mine plan and are now positioned to implement several operating enhancements to transform Copper Mountain into a stable cash flow generator for our business. With the addition of Copper Mountain, we expect to maintain annual consolidated copper production above 150,000 tonnes through to the end of the decade and are better positioned to achieve our deleveraging objectives and deliver on future copper growth. This increased scale and diversification enhances the company's ability to prudently advance our organic growth pipeline of brownfield expansion and greenfield development opportunities in tier-one mining jurisdictions."
Mine Plan Summary
The Copper Mountain mine is located 21 kilometres south of the town of Princeton and 304 kilometres east of Vancouver, as shown in Figure 1. The operations include a series of open pits, an ore processing plant, a waste rock facility, a tailings management facility and other ancillary facilities that support the operations. Please refer to Figure 2 for a site layout map. All claims are controlled by Copper Mountain Mine (BC) Ltd., a joint venture held 75% by Hudbay and 25% by Mitsubishi Materials Corp.
The mine plan contemplates average annual copper production of 46,500 tonnes in the first five years, 45,000 in the first ten years and 37,000 tonnes over the 21-year mine life. Average cash costs and sustaining cash costs over the mine life are expected to be $1.84 and $2.53 per pound of copperi, respectively. The updated mine plan represents an approximate 90% increase in average annual copper production and a 50% decrease in cash costs over the first 10 years compared to 2022.
As shown in Figure 3, Copper Mountain increases Hudbay's expected consolidated annual copper production by approximately 50% and maintains the 150,000 tonne per year level beyond 2025.
A summary of key production and cost details can be found below. For further details, please refer to the detailed mine plan table in Exhibit 1.
| |
2024 |
2025 |
2026 |
2027 |
2028 |
2024-
2028
Avg. |
2029-
2033
Avg. |
2034-
2038
Avg. |
2039-
2043
Avg. |
LOM
Total |
| Contained Metal in Concentrate |
| Cu production |
tonnes
(000s) |
37 |
40 |
49 |
50 |
56 |
47 |
43 |
39 |
26 |
783 |
| Au production |
ounces
(000s) |
21 |
36 |
26 |
44 |
47 |
35 |
64 |
60 |
26 |
935 |
| Ag production |
ounces
(000s) |
378 |
334 |
500 |
434 |
477 |
425 |
235 |
213 |
226 |
5,590 |
| Capital Expenditures |
| Sustaining capital (after capitalized stripping)1 |
US$ millions |
$63 |
$122 |
$91 |
$59 |
$94 |
$86 |
$67 |
$55 |
$13 |
$1,106 |
| Discretionary capitalized stripping2 |
US$ millions |
$22 |
$42 |
$21 |
- |
- |
$17 |
- |
- |
- |
$85 |
| Growth capital |
US$ millions |
$3 |
$41 |
$69 |
$6 |
$7 |
$25 |
- |
- |
- |
$126 |
| Cash Costs |
| Cash costs, net of by-product credits3 |
US$/lb Cu |
$2.69 |
$1.89 |
$1.89 |
$1.90 |
$1.36 |
$1.89 |
$1.53 |
$1.75 |
$2.31 |
$1.84 |
| Sustaining cash costs, net of by-product credits (excl. discretionary stripping)3,4 |
US$/lb Cu |
$3.49 |
$3.40 |
$2.74 |
$2.45 |
$2.13 |
$2.76 |
$2.26 |
$2.46 |
$2.58 |
$2.53 |
Note: Totals may not add up correctly due to rounding. "LOM" refers to life-of-mine total.
1 Sustaining capital includes capitalized stripping.
2 Discretionary capitalized stripping relates to a portion of accelerated stripping activities over 2024-2026 to access higher grade ore but could be reduced or deferred to a later date based on further geotechnical evaluation and other considerations.
3 By-product credits calculated using the following commodity prices and foreign exchange assumptions: gold price of $1,940 per ounce for 2024, $1,900 per ounce for 2025, $1,800 per ounce for 2026, $1,764 per ounce for 2027, $1,725 per ounce for 2028 and $1,700 per ounce long-term; silver price of $24.00 per ounce for 2024, 2025 and 2026, $23.75 per ounce for 2027, $23.38 per ounce for 2028 and $23.00 per ounce long-term; C$/US$ exchange rate of 1.35 in 2024 and 1.33 in 2025 onwards.
4 Sustaining cash costs incorporate all costs included in cash costs plus sustaining capital expenditures, capitalized stripping, payments on capital leases, royalties and accretion and amortization of decommissioning obligations, and excludes discretionary capitalized stripping. Cash costs and sustaining cash costs are non-IFRS financial performance measures with no standardized definition under IFRS. For further details on why Hudbay believes cash costs are a useful performance indicator, please refer to the company's most recent Management's Discussion and Analysis for the period ended September 30, 2023.
Hudbay's Stabilization Plans
Since completing the acquisition of CMMC in June 2023, Hudbay has been focused on advancing its plans to stabilize the Copper Mountain mine over the next few years to improve reliability and drive sustainable long-term value. The technical report reflects Hudbay's base case stabilization plan including many elements as described further below.
Increased Mining Activities
The company has commenced a fleet ramp-up plan which remobilizes idle haul trucks. The fleet ramp up plan entails a ramp-up from 14 trucks to 26 trucks by the end of 2023, with 23 trucks ramped up to-date. Once the fleet ramp up plan is complete, Copper Mountain is expected to have improved flexibility in the mine with additional mining faces.
Accelerated Stripping to Access Higher Grades
As reflected in the technical report, the company is planning a campaign of accelerated stripping over the next three years to enable access to higher grade ore and to mitigate the substantially reduced stripping undertaken by Copper Mountain over the four years prior to completion of the acquisition (please refer to Figure 4). The accelerated stripping program is also expected to improve operating efficiencies and lower unit operating costs. A portion of the accelerated capitalized stripping costs is considered discretionary and could be reduced or deferred to a later date based on further geotechnical evaluation and other considerations.
Improved Mill Throughput and Recoveries
Hudbay's mine plan for Copper Mountain assumes a mill ramp up to its nominal capacity of 45,000 tonnes per day in 2025. An expansion to the permitted capacity of 50,000 tonnes per day is planned in 2027. The mine plan assumes approximately $23 million in growth capital spending over 2025 and 2026 in connection with the mill expansion. The company also plans to improve mill recoveries with a more consistent ore feed grade, changes to the flotation reagents and replacement of key pumps.
Operating Efficiencies and Corporate Synergies
Hudbay's stabilization plans as reflected in the technical report are expected to generate more than $20 million in annual operating efficiencies over the next three years, compared to Copper Mountain's performance in 2022, through improvements in copper recovery, higher throughput rates and lower combined unit operating costs. In addition, Hudbay has realized approximately $9 million of the targeted $10 million in annual corporate synergies and is on track to exceed the target. A full comparison of Hudbay's plan versus Copper Mountain's 2022 performance is presented in the following table.
|
|
Copper Mountain
2022A1
|
2024-2028
Avg.
|
Change
|
|
Mill throughput
|
tonnes per day
|
34,814
|
46,851
|
+12,037
|
|
Copper recovery
|
%
|
79.1%
|
84.5%
|
+5.4%
|
|
Corporate G&A
|
C$ millions
|
$17
|
$4
|
-$13
|
|
Total unit operating costs (after capitalized stripping)2
|
C$/tonne milled
|
$23.95
|
$17.06
|
-$6.89
|
|
Cash costs, net of by-product credits2
|
US$/lb Cu
|
$3.53
|
$1.89
|
-$1.64
|
|
Sustaining cash costs, net of by-product credits (excl. discretionary stripping)2,3
|
US$/lb Cu
|
$4.78
|
$2.76
|
-$2.02
|
1 2022 actuals as disclosed by CMMC on March 27, 2023. CMMC Financial Statements and Management's Discussion & Analysis for the applicable periods are available under CMMC's SEDAR+ profile at www.sedarplus.ca. 2022 total unit operating costs includes direct mining and milling costs, employee compensation and benefits, transportation costs and corporate and mine site administration expenses.
2 Cash costs, sustaining cash costs and unit operating costs are non-IFRS financial performance measures with no standardized definition under IFRS. For further details on why Hudbay believes cash costs and unit operating costs are useful performance indicators, please refer to the company's most recent Management's Discussion and Analysis for the period ended September 30, 2023.
3 By-product credits calculated using the following commodity prices and foreign exchange assumptions: gold price of $1,940 per ounce for 2024, $1,900 per ounce for 2025, $1,800 per ounce for 2026, $1,764 per ounce for 2027, $1,725 per ounce for 2028 and $1,700 per ounce long-term; silver price of $24.00 per ounce for 2024, 2025 and 2026, $23.75 per ounce for 2027, $23.38 per ounce for 2028 and $23.00 per ounce long-term; C$/US$ exchange rate of 1.35 in 2024 and 1.33 in 2025 onwards. Sustaining cash costs incorporates all costs included in cash costs plus sustaining capital expenditures, capitalized stripping, payments on capital leases, royalties and accretion and amortization of decommissioning obligations, and excludes discretionary capitalized stripping.
Mineral Reserve and Resource Estimates
The mine plan is based on a revised resource model and was constructed using the same methods applied at the Constancia, Copper World and Mason deposits. The mineral reserve estimates total 367 million tonnes at a copper grade of 0.25% and a gold grade of 0.12 grams per tonne, supporting a 21-year mine life. An additional 140 million tonnes of measured and indicated resources at 0.21% copper and 0.10 grams per tonne gold and 370 million tonnes of inferred resources at 0.25% copper and 0.13 grams per tonne gold, exclusive of mineral reserves, provide significant upside potential for reserve conversion and extending mine life. Infill drilling is planned for 2024 to target reserve conversion.
The current mineral reserve and resource estimates for Copper Mountain (effective as of December 1, 2023) are summarized below.
Copper Mountain Mine
Mineral Reserve and Resource
Estimates1,2,3,4 |
Tonnes |
Cu Grade
(%) |
Au Grade
(g/t) |
Ag Grade
(g/t) |
CuEq Grade
(%) |
| Reserves |
| Proven |
195,037,000 |
0.27 |
0.12 |
0.78 |
0.35 |
| Probable |
171,943,000 |
0.22 |
0.11 |
0.59 |
0.30 |
| Total proven and probable |
366,980,000 |
0.25 |
0.12 |
0.69 |
0.33 |
| Resources |
| Measured |
41,198,000 |
0.21 |
0.09 |
0.73 |
0.27 |
| Indicated |
96,615,000 |
0.21 |
0.11 |
0.68 |
0.29 |
| Total measured and indicated |
137,814,000 |
0.21 |
0.10 |
0.69 |
0.28 |
| Inferred |
371,319,000 |
0.25 |
0.13 |
0.61 |
0.34 |
Note: totals may not add up correctly due to rounding.
1 Mineral resource estimates are exclusive of mineral reserves. Mineral resources are not mineral reserves as they do not have demonstrated economic viability.
2 Mineral reserve estimates have been calculated using assumed long-term metal prices of $3.75 per pound copper, $1,650 per ounce gold and $22.00 per ounce silver. Mineral resource estimates have been calculated using assumed long-term metal prices of $4.00 per pound copper, $1,650 per ounce gold and $22.00 per ounce silver.
3 Mineral resource estimates tonnes and grades constrained to a Lerch Grossman revenue factor 1 pit shell.
4 Mineral reserves have an effective date of December 1, 2023, but were generated excluding the measured and indicated mineral resource estimates planned to be mined and milled in the month of December 2023. Mineral reserves are reported using an NSR cut-off value of $5.67 that meet a minimum 0.10% Cu grade.
Consistent with the expectations disclosed in the company's news release on November 7, 2023, the 2023 mineral reserve and mineral resource estimates are consistent with historical estimates published by CMMC until 2019, after adjusting for mining depletion and a re-classification of some of the indicated mineral resources to the inferred category, as well as incorporating high grade resources added through exploration since 2019. Hudbay's new 2023 resource estimates are closely aligned with production with both tonnage and grade reconciling positively within 3% to 4% of the credited mine production by the mill over the past three years.
Project Optimization and Upside Opportunities
There are several opportunities to further increase production, improve costs and extend mine life for Copper Mountain. While these opportunities have not been considered in the technical report as they are not yet at the level of required engineering, the company is advancing studies to evaluate the potential for these to be reflected in future mine plans.
- Conversion of Inferred Resources to Reserves - there is a significant amount of high-grade mineralization in the inferred category that has the potential to be converted to reserves, which would increase production, improve head grades over the next 10 years and extend mine life beyond 21 years. The company has plans for infill drilling in 2024 to target reserve conversion.
- Lower Stripping Costs - the company will carry out additional geotechnical investigations and pit slope stability tests in the area of Pit 3 to identify opportunities to maximize the use of double benching and reduce waste stripping that is currently classified as discretionary.
- Evaluation of Mining Technologies - Hudbay will pursue technology trade-offs between trolley assist haul trucks and conveying systems for ore and waste movement in an effort to reduce mining costs, improve mining productivity, and reduce greenhouse gas emissions.
- Continued Process Optimization - Hudbay continues to conduct metallurgical testing and simulations to optimize mill throughput and recoveries.
- Renewable Diesel - Hudbay is evaluating the application of renewable diesel at Copper Mountain, which has the potential to reduce costs, lower greenhouse gas emissions and be eligible for additional federal tax credits under Canada's Clean Fuel Regulations.
- Green Opportunities - the company plans to install a mast to collect wind data to be able to evaluate the potential for site renewable energy generation. This initiative is in addition to the existing net-zero initiatives already underway, including trolley assist haulage and a new electric shovel, which favourably position Copper Mountain in the lowest quartile of the greenhouse gas emissions curve for copper mines.
Non-IFRS Financial Performance Measures
Cash cost and sustaining cash cost per pound of copper produced are shown because the company believes they help investors and management assess the performance of its operations, including the margin generated by the operations and the company. Unit operating costs are shown because these measures are used by the company as a key performance indicator to assess the performance of its mining and processing operations. These measures do not have a meaning prescribed by IFRS and are therefore unlikely to be comparable to similar measures presented by other issuers. These measures should not be considered in isolation or as a substitute for measures prepared in accordance with IFRS and are not necessarily indicative of operating profit or cash flow from operations as determined under IFRS. Other companies may calculate these measures differently. For further details on these measures, please refer to page 45 of Hudbay's management's discussion and analysis for the period ended September 30, 2023 available on SEDAR+ at www.sedarplus.ca and EDGAR at www.sec.gov.
Cautionary Note Regarding NI 43-101
The scientific and technical information contained in this news release has been approved by Olivier Tavchandjian, P. Geo, Hudbay's Senior Vice-President, Exploration and Technical Services. Mr. Tavchandjian is a qualified person pursuant to Canadian Securities Administrators' National Instrument 43-101 - Standards of Disclosure for Mineral Projects ("NI 43-101").
A copy of the NI 43-101 technical report will be made available on Hudbay's SEDAR+ profile at www.sedarplus.ca and on Hudbay's EDGAR profile at www.sec.gov. This technical report is the current technical report in respect of the Copper Mountain mine and shall supersede and replace all prior technical reports relating to the Copper Mountain mine.
Cautionary Note to United States Investors
This news release has been prepared in accordance with the requirements of the securities laws in effect in Canada, which differ from the requirements of United States securities laws. Canadian reporting requirements for disclosure of mineral properties are governed NI 43-101.
For this reason, information contained in this news release in respect of the Copper Mountain mine may not be comparable to similar information made public by United States companies subject to the reporting and disclosure requirements under the United States federal securities laws and the rules and regulations thereunder. For further information on the differences between the disclosure requirements for mineral properties under the United States federal securities laws and NI 43-101, please refer to the company's annual information form, a copy of which has been filed under Hudbay's profile on SEDAR+ at www.sedarplus.ca and the company's Form 40-F, a copy of which has been filed under Hudbay's profile on EDGAR at www.sec.gov.
Cautionary Note Regarding Forward-Looking Information
This news release contains forward-looking information within the meaning of applicable Canadian and United States securities legislation. All information contained in this news release, other than statements of current and historical fact, is forward-looking information. Often, but not always, forward-looking information can be identified by the use of words such as "plans", "expects", "budget", "guidance", "scheduled", "estimates", "forecasts", "strategy", "target", "intends", "objective", "goal", "understands", "anticipates" and "believes" (and variations of these or similar words) and statements that certain actions, events or results "may", "could", "would", "should", "might" "occur" or "be achieved" or "will be taken" (and variations of these or similar expressions). All of the forward-looking information in this news release is qualified by this cautionary note.
Forward-looking information includes, but is not limited to, production, operating cost, capital cost and cash cost estimates, project design, including processing and tailings facilities, metal recoveries, mine life and production rates for the Copper Mountain mine, the potential to further enhance the economics of the project and optimize the design, the impact and effects of Hudbay's optimization and stabilization initiatives, statements regarding permitting matters, the relationships with the First Nations groups, local communities of interest, regulatory agencies and other key stakeholders, the expectations and plans for New Ingerbelle, the renegotiation of the participation agreements with the Upper Similkameen Indian Band and Lower Similkameen Indian Band, the costs associated with planned stripping, and the conceptual mine closure and reclamation plan. Forward-looking information is not, and cannot be, a guarantee of future results or events. Forward-looking information is based on, among other things, opinions, assumptions, estimates and analyses that, while considered reasonable by the company at the date the forward-looking information is provided, inherently are subject to significant risks, uncertainties, contingencies and other factors that may cause actual results and events to be materially different from those expressed or implied by the forward-looking information.
The material factors or assumptions that Hudbay identified and were applied by the company in drawing conclusions or making forecasts or projections set out in the forward-looking information include, but are not limited to:
• the company's ability to stabilize and optimize the Copper Mountain mine operations;
• the success of exploration and development activities at the Copper Mountain mine, including New Ingerbelle;
• the accuracy of geological, mining and metallurgical estimates;
• anticipated metals prices and the costs of production;
• the supply and demand for metals Hudbay produces;
• the supply and availability of all forms of energy and fuels at reasonable prices;
• no significant unanticipated operational or technical difficulties;
• the availability of additional financing, if needed;
• the availability of personnel for the company's exploration, development and operational projects and ongoing employee relations;
• maintaining applicable and necessary permits;
• maintaining good relations with the First Nations groups, local communities of interest, regulatory agencies and other key stakeholders, including the neighbouring communities and local governments in British Columbia;
• no significant unanticipated challenges with stakeholders at the Copper Mountain mine;
• no significant unanticipated events or changes relating to regulatory, environmental, health and safety matters;
• no contests over title to Hudbay's properties, including as a result of rights or claimed rights of Indigenous peoples or challenges to the validity of its unpatented mining claims;
• no offtake commitments in respect of production from the Copper Mountain mine, other than those contemplated herein;
• certain tax matters, including, but not limited to the mining tax regime in British Columbia; and
• no significant and continuing adverse changes in general economic conditions or conditions in the financial markets (including commodity prices and foreign exchange rates).
The risks, uncertainties, contingencies and other factors that may cause actual results to differ materially from those expressed or implied by the forward-looking information may include, but are not limited to, risks generally associated with the mining industry and the current geopolitical environment, such as economic factors (including future commodity prices, currency and interest rate fluctuations, energy and consumable prices, supply chain constraints and general cost escalation in the current inflationary environment), risks related to product delivery and financing, risks related to the ability for the company to successfully maintain all applicable and necessary permits, risks related to changes in government and government policy, risks related to changes in law, risks in respect of community relations, including but not limited to the relationships with First Nations groups, local communities of interest, regulatory agencies and other key stakeholders, risks related to contracts that were entered into in respect of the Copper Mountain mine, including but not limited to the renegotiation of the participation agreements with the Upper Similkameen Indian Band and Lower Similkameen Indian Band, risks related to the conceptual mine closure and reclamation plan, uncertainties related to the geology, continuity, grade and estimates of mineral reserves and resources, and the potential for variations in grade and recovery rates, as well as the risks discussed under the heading "Risk Factors" in the company's most recent annual information form and under the heading "Financial Risk Management" in the company's most recent management's discussion and analysis.
Should one or more risk, uncertainty, contingency or other factor materialize or should any factor or assumption prove incorrect, actual results could vary materially from those expressed or implied in the forward-looking information. Accordingly, you should not place undue reliance on forward-looking information. The company does not assume any obligation to update or revise any forward-looking information after the date of this news release or to explain any material difference between subsequent actual events and any forward-looking information, except as required by applicable law.
About Hudbay
Hudbay (TSX, NYSE: HBM) is a copper-focused mining company with three long-life operations and a world-class pipeline of copper growth projects in tier-one mining-friendly jurisdictions of Canada, Peru and the United States.
Hudbay's operating portfolio includes the Constancia mine in Cusco (Peru), the Snow Lake operations in Manitoba (Canada) and the Copper Mountain mine in British Columbia (Canada). Copper is the primary metal produced by the company, which is complemented by meaningful gold production. Hudbay's growth pipeline includes the Copper World project in Arizona, the Mason project in Nevada (United States), the Llaguen project in La Libertad (Peru) and several expansion and exploration opportunities near its existing operations.
The value Hudbay creates and the impact it has is embodied in its purpose statement: "We care about our people, our communities and our planet. Hudbay provides the metals the world needs. We work sustainably, transform lives and create better futures for communities." Hudbay's mission is to create sustainable value and strong returns by leveraging its core strengths in community relations, focused exploration, mine development and efficient operations.
For further information, please contact:
Candace Brûlé
Vice President, Investor Relations
(416) 814-4387
investor.relations@hudbay.com
______________________________
i Cash costs and sustaining cash costs are non-IFRS financial performance measures with no standardized definition under IFRS. For further details on why Hudbay believes cash costs are a useful performance indicator, please refer to the company's most recent Management's Discussion and Analysis for the period ended September 30, 2023.
ii Based on copper production from most recent technical reports for Hudbay's Constancia, Snow Lake and Copper Mountain operations.
Exhibit 1: Detailed Mine Plan Information
| |
2024 |
2025 |
2026 |
2027 |
2028 |
2024-
2028
Avg. |
2029-
2033
Avg. |
2034-
2038
Avg. |
2039-
2043
Avg. |
LOM
Total |
| Mining |
| Ore mined |
tonnes
(000s) |
18,983 |
22,363 |
14,020 |
20,710 |
21,096 |
19,434 |
20,411 |
18,460 |
4,180 |
312,425 |
| Waste mined |
tonnes
(000s) |
82,832 |
91,637 |
86,480 |
63,290 |
48,904 |
74,629 |
47,589 |
44,940 |
6,154 |
866,559 |
| Strip ratio |
waste:
ore |
4.36 |
4.10 |
6.17 |
3.06 |
2.32 |
3.84 |
2.33 |
2.43 |
1.47 |
2.77 |
| Processing |
| Ore milled |
tonnes
(000s) |
15,008 |
16,425 |
17,520 |
18,250 |
18,300 |
17,101 |
18,260 |
18,260 |
18,260 |
366,980 |
| Daily ore milled |
tonnes
per day |
41,118 |
45,000 |
48,000 |
50,000 |
50,137 |
46,851 |
50,027 |
50,027 |
50,027 |
47,877 |
| Cu grade |
% |
0.30% |
0.29% |
0.33% |
0.32% |
0.36% |
0.32% |
0.27% |
0.24% |
0.17% |
0.25% |
| Au grade |
g/t |
0.07 |
0.10 |
0.07 |
0.11 |
0.12 |
0.10 |
0.16 |
0.15 |
0.07 |
0.12 |
| Ag grade |
g/t |
1.12 |
0.90 |
1.27 |
1.07 |
1.17 |
1.11 |
0.60 |
0.54 |
0.55 |
0.69 |
| Cu recovery |
% |
82.5% |
84.0% |
84.0% |
85.6% |
85.5% |
84.5% |
86.7% |
86.4% |
85.1% |
85.7% |
| Au recovery |
% |
65.0% |
65.0% |
65.0% |
67.9% |
67.8% |
66.5% |
69.6% |
69.0% |
66.0% |
68.3% |
| Ag recovery |
% |
70.0% |
70.0% |
70.0% |
69.2% |
69.2% |
69.6% |
66.5% |
67.1% |
69.7% |
68.5% |
| Contained Metal in Concentrate |
| Cu production |
tonnes (000s) |
37 |
40 |
49 |
50 |
56 |
47 |
43 |
39 |
26 |
783 |
| Au production |
ounces
(000s) |
21 |
36 |
26 |
44 |
47 |
35 |
64 |
60 |
26 |
935 |
| Ag production |
ounces
(000s) |
378 |
334 |
500 |
434 |
477 |
425 |
235 |
213 |
226 |
5,590 |
| Capital Expenditures (US$ millions)1 |
| Sustaining capital |
$46 |
$63 |
$50 |
$45 |
$36 |
$48 |
$27 |
$22 |
$13 |
$549 |
| Capitalized stripping |
$17 |
$59 |
$41 |
$14 |
$57 |
$38 |
$41 |
$33 |
- |
$558 |
| Sustaining capital (after capitalized stripping) |
$63 |
$122 |
$91 |
$59 |
$94 |
$86 |
$67 |
$55 |
$13 |
$1,106 |
| Discretionary capitalized stripping2 |
$22 |
$42 |
$21 |
- |
- |
$17 |
- |
- |
- |
$85 |
| Growth project capital |
$3 |
$41 |
$69 |
$6 |
$7 |
$25 |
- |
- |
- |
$126 |
| Total capital expenditures |
$88 |
$205 |
$181 |
$65 |
$101 |
$128 |
$67 |
$55 |
$13 |
$1,317 |
| Unit Operating Costs (C$ per tonne milled)3 |
| Mining4 |
|
$15.30 |
$16.33 |
$13.84 |
$12.06 |
$11.92 |
$13.78 |
$11.73 |
$11.32 |
$4.82 |
$10.21 |
| Milling |
|
$7.41 |
$6.77 |
$5.94 |
$5.70 |
$5.69 |
$6.25 |
$5.70 |
$5.70 |
$5.70 |
$5.85 |
| G&A |
|
$1.48 |
$1.35 |
$1.27 |
$1.22 |
$1.18 |
$1.29 |
$1.17 |
$1.14 |
$0.87 |
$1.13 |
| Total operating costs (before cap. stripping) |
$24.19 |
$24.45 |
$21.05 |
$18.98 |
$18.79 |
$21.32 |
$18.60 |
$18.16 |
$11.39 |
$17.19 |
| Total operating costs (after cap. stripping) |
$20.68 |
$16.27 |
$16.31 |
$17.96 |
$14.61 |
$17.06 |
$15.64 |
$15.73 |
$11.39 |
$14.86 |
| Cash Costs and Sustaining Cash Costs (US$/lb Cu) |
| Copper production |
million
lbs |
81.6 |
87.9 |
108.4 |
110.6 |
124.0 |
102.5 |
95.1 |
85.1 |
58.4 |
1,726.4 |
|
Cash costs3,5
|
|
$2.69
|
$1.89
|
$1.89
|
$1.90
|
$1.36
|
$1.89
|
$1.53
|
$1.75
|
$2.31
|
$1.84
|
|
Sustaining cash costs3,5 (excl. discretionary stripping)
|
$3.49
|
$3.40
|
$2.74
|
$2.45
|
$2.13
|
$2.76
|
$2.26
|
$2.46
|
$2.58
|
$2.53
|
|
Sustaining cash costs3,5 (incl. discretionary stripping)
|
$3.77
|
$3.87
|
$2.94
|
$2.45
|
$2.13
|
$2.93
|
$2.26
|
$2.46
|
$2.58
|
$2.58
|
Note: LOM refers to life-of-mine total.
1 Sustaining capital includes capitalized lease payments.
2 Discretionary capitalized stripping relates to a portion of accelerated stripping activities over 2024-2026 to access higher grade ore but could be reduced or deferred to a later date based on further geotechnical evaluation and other considerations.
3 Cash costs, sustaining cash costs and unit operating costs are non-IFRS financial performance measures with no standardized definition under IFRS. For further details on why Hudbay believes cash costs and unit operating costs are useful performance indicators, please refer to the company's most recent Management's Discussion and Analysis for the period ended September 30, 2023.
4 Mining cost before the impact of capitalized stripping.
5 By-product credits calculated using the following commodity prices and foreign exchange assumptions: gold price of $1,940 per ounce for 2024, $1,900 per ounce for 2025, $1,800 per ounce for 2026, $1,764 per ounce for 2027, $1,725 per ounce for 2028 and $1,700 per ounce long-term; silver price of $24.00 per ounce for 2024, 2025 and 2026, $23.75 per ounce for 2027, $23.38 per ounce for 2028 and $23.00 per ounce long-term; C$/US$ exchange rate of 1.35 in 2024 and 1.33 in 2025 onwards. Sustaining cash costs incorporates all costs included in cash cost plus sustaining capital expenditures, capitalized stripping, payments on capital leases, royalties and accretion and amortization of decommissioning obligations.
Figure 1: Copper Mountain Mine Location
The Copper Mountain mine is located in British Columbia, Canada, 21 kilometres by road south of the town of Princeton and 304 kilometres by road east of Vancouver.

Figure 2: Copper Mountain Site Layout
The operations consist of the Copper Mountain pit, the New Ingerbelle pit, an ore processing plant, a waste rock facility, a tailings management facility and other associated site infrastructure that support the operations.
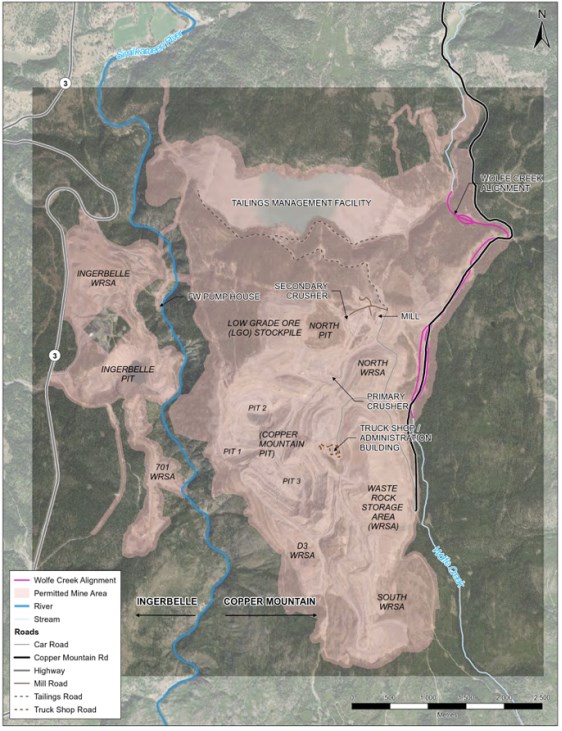
Figure 3: Hudbay Consolidated Production Profile Graph
Copper Mountain is a meaningful contributor to Hudbay's consolidated copper production profile. The impact is significant after 2025 with increases of up to 50% in annual copper production to maintain the 150,000 tonnes per year level.

Source: Based on Hudbay previously issued copper production guidance for 2023 to 2025. Copper production in the years 2026 to 2028 is sourced from Hudbay's Constancia NI 43-101 technical report dated March 2021, Snow Lake NI 43-101 technical report dated March 2021 and Copper Mountain NI 43-101 technical report dated December 4, 2023. Production profile excludes potential future production from the Copper World project.
Figure 4: Copper Mountain Mine Performance
Hudbay's mine plan incorporates accelerated stripping activities to help mitigate the impacts of substantially reduced stripping undertaken by Copper Mountain over the past four years. The accelerated stripping is expected to enable access to higher grade ore and improve the efficiency of the mine. Hudbay expects sustained improvements in mill throughput to achieve the design capacity of 45,000 tonnes per day and an expansion to the permitted limit of 50,000 tonnes per day in 2027.

Source: CMMC historical annual disclosure for the years 2018 to 2022 and Hudbay's Copper Mountain NI 43-101 technical report dated December 4, 2023 for the years 2024 to 2028.

CAUTIONARY NOTES
Cautionary Note Regarding Forward Looking Information
This Technical Report contains "forward-looking statements" and "forward-looking information" (collectively, "forward-looking information") within the meaning of applicable Canadian and United States securities legislation. All information contained in this Technical Report, other than statements of current and historical fact, is forward-looking information. Often, but not always, forward-looking information can be identified by the use of words such as "plans," "expects," "budget," "guidance," "scheduled," "estimates," "forecasts," "strategy," "target," "intends," "objective," "goal," "understands," "anticipates" and "believes" (and variations of these or similar words) and statements that certain actions, events or results "may," "could," "would," "should," "might" "occur" or "be achieved" or "will be taken" (and variations of these or similar expressions). All of the forward-looking information in this Technical Report is qualified by this cautionary note.
Forward-looking information includes, but is not limited to, production; operating cost; capital cost and cash cost estimates; project design, including processing and tailings facilities, metal recoveries, mine life and production rates for the Copper Mountain Mine; the potential to further enhance the economics of the project and optimize the design; the impact and effects of our optimization and stabilization initiatives; statements regarding permitting matters; the relationships with the First Nations groups, local communities of interest, regulatory agencies, and other key stakeholders; the expectations and plans for New Ingerbelle; the renegotiation of the participation agreements with the Upper Similkameen Indian Band and Lower Similkameen Indian Band; the costs associated with planned stripping; and the conceptual mine closure and reclamation plan. Forward-looking information is not, and cannot be, a guarantee of future results or events. Forward-looking information is based on, among other things, opinions, assumptions, estimates, and analyses that, while considered reasonable by Hudbay at the date the forward-looking information is provided, are inherently subject to significant risks, uncertainties, contingencies, and other factors that may cause actual results and events to be materially different from those expressed or implied by the forward-looking information.
The material factors or assumptions that Hudbay identified and were applied by Hudbay in drawing conclusions or making forecasts or projections set out in the forward-looking information include, but are not limited to:
-
Hudbay's ability to stabilize and optimize the Copper Mountain Mine operations
-
The success of exploration and development activities at the Copper Mountain Mine, including New Ingerbelle
-
The accuracy of geological, mining, and metallurgical estimates
-
Anticipated metals prices and the costs of production
-
The supply and demand for metals Hudbay produces
-
The supply and availability of all forms of energy and fuels at reasonable prices
-
No significant unanticipated operational or technical difficulties
-
The availability of additional financing, if needed
-
The availability of personnel for Hudbay's exploration, development, and operational projects and ongoing employee relations
-
Maintaining applicable and necessary permits
-
Maintaining good relations with the First Nations groups, local communities of interest, regulatory agencies and other key stakeholders, including the neighbouring communities and local governments in British Columbia
-
No significant unanticipated challenges with stakeholders at the Copper Mountain Mine
-
No significant unanticipated events or changes relating to regulatory, environmental, and health and safety matters
-
No contests over title to Hudbay's properties, including as a result of rights or claimed rights of Indigenous peoples or challenges to the validity of its unpatented mining claims
-
No off-take commitments in respect of production from the Copper Mountain Mine, other than those contemplated herein
-
Certain tax matters, including, but not limited to the mining tax regime in British Columbia
-
No significant and continuing adverse changes in general economic conditions or conditions in the financial markets (including commodity prices and foreign exchange rates).
The risks, uncertainties, contingencies, and other factors that may cause actual results to differ materially from those expressed or implied by the forward-looking information may include, but are not limited to, risks generally associated with the mining industry and the current geopolitical environment, such as economic factors (including future commodity prices, currency and interest rate fluctuations, energy and consumable prices, supply-chain constraints and general cost escalation in the current inflationary environment); risks related to product delivery and financing; risks related to the ability for Hudbay to successfully maintain all applicable and necessary permits; risks related to changes in government and government policy; risks related to changes in law; risks in respect of community relations, including but not limited to the relationships with First Nations groups, local communities of interest, regulatory agencies, and other key stakeholders; risks related to contracts that were entered into in respect of the Copper Mountain Mine, including but not limited to the renegotiation of the participation agreements with the Upper Similkameen Indian Band and Lower Similkameen Indian Band; risks related to the conceptual mine closure and reclamation plan; uncertainties related to the geology, continuity, grade, and estimates of Mineral Reserves and Mineral Resources, and the potential for variations in grade and recovery rates; as well as the risks discussed under the heading "Risk Factors" in Hudbay's most recent Annual Information Form (AIF) and under the heading "Financial Risk Management" in Hudbay's most recent Management Discussion and Analysis (MD&A).
Should one or more risk, uncertainty, contingency, or other factor materialize, or should any factor or assumption prove incorrect, actual results could vary materially from those expressed or implied in the forward-looking information. Accordingly, the reader should not place undue reliance on forward-looking information. Hudbay does not assume any obligation to update or revise any forward-looking information after the date of this technical report or to explain any material difference between subsequent actual events and any forward-looking information, except as required by applicable law.
Cautionary Note Regarding NI 43-101
The scientific and technical information contained in this Technical Report has been approved by Olivier Tavchandjian, P.Geo, Hudbay's Senior Vice-President, Exploration and Technical Services. Mr. Tavchandjian is a Qualified Person pursuant to Canadian Securities Administrators' National Instrument (NI) 43-101-Standards of Disclosure for Mineral Projects.
This technical report is the current technical report in respect of all the mineral properties that form part of the Copper Mountain Mine and shall supersede and replace all prior technical reports relating to the Copper Mountain Mine.
Non-IFRS Financial Performance Measures
Cash cost and sustaining cash cost per pound of copper produced are shown because Hudbay believes they help investors and management assess the performance of its operations, including the margin generated by the operations and Hudbay. Unit operating costs are shown because Hudbay uses these measures as a key performance indicator to assess the performance of its mining and processing operations. These measures do not have a meaning prescribed by the International Financial Reporting Standards (IFRS) and are therefore unlikely to be comparable to similar measures presented by other issuers. These measures should not be considered in isolation or as a substitute for measures prepared in accordance with IFRS and are not necessarily indicative of operating profit or cash flow from operations as determined under IFRS. Other companies may calculate these measures differently. For further details on the non-IFRS performance measures Hudbay uses, please refer to page 45 of Hudbay's management's discussion and analysis for the period ended September 30, 2023 (available on SEDAR+ at www.sedarplus.ca and EDGAR at www.sec.gov).
Cautionary Note to United States Investors
This Technical Report has been prepared in accordance with the requirements of the securities laws in effect in Canada, which differ from the requirements of United States securities laws. Canadian reporting requirements for disclosure of mineral properties are governed by NI 43-101.
For this reason, information contained in this Technical Report in respect of the Copper Mountain Mine may not be comparable to similar information made public by United States companies subject to the reporting and disclosure requirements under the United States federal securities laws and the rules and regulations thereunder. For further information on the differences between the disclosure requirements for mineral properties under the United States federal securities laws and NI 43-101, please refer to Hudbay's AIF, a copy of which has been filed under Hudbay's profile on SEDAR+ at www.sedarplus.ca and Hudbay's Form 40-F, a copy of which has been filed on EDGAR at www.edgar.com.
SIGNATURE PAGE
This Technical Report titled NI 43-101 Technical Report Updated Mineral Resources & Reserves Estimate, Copper Mountain Mine, Princeton, British Columbia, and dated December 4, 2023, with an effective date of December 1, 2023, was prepared under the supervision and signed by the following author:
| Original Signed and Sealed |
|
Olivier Tavchandjian, Ph.D., P.Geo.
Senior Vice President, Exploration and Technical Services
Hudbay Minerals Inc. |
|
Contents
| 1 Summary |
1-1 |
| |
|
| 1.1 Property Description and Location |
1-1 |
| |
|
| 1.2 Accessibility, Climate, Local Resources, Infrastructure, and Physiography |
1-3 |
| |
|
| 1.3 History |
1-3 |
| |
|
| 1.4 Geological Setting and Mineralization |
1-4 |
| |
|
| 1.5 Deposit Types |
1-4 |
| |
|
| 1.6 Exploration |
1-5 |
| |
|
| 1.7 Drilling |
1-5 |
| |
|
| 1.8 Sample Preparation, Analyses, and Security |
1-6 |
| |
|
| 1.9 Data Verification |
1-6 |
| |
|
| 1.10 Mineral Processing and Metallurgical Testwork |
1-7 |
| 1.10.1 Comminution |
1-7 |
| 1.10.2 Flotation |
1-7 |
| 1.10.3 Concentrate Characterization |
1-8 |
| |
|
| 1.11 Mineral Resource Estimate |
1-8 |
| |
|
| 1.12 Mineral Reserve Estimate |
1-10 |
| |
|
| 1.13 Mining Methods and Production Schedules |
1-11 |
| |
|
| 1.14 Recovery Methods |
1-15 |
| |
|
| 1.15 CMM Infrastructure |
1-15 |
| |
|
| 1.16 Market Studies and Contracts |
1-16 |
| |
|
| 1.17 Environmental Studies, Permitting, and Social or Community Impacts |
1-16 |
| 1.17.1 Permitting |
1-16 |
| 1.17.2 Environmental, Social Setting, and Community Engagement |
1-17 |
| 1.17.3 Conceptual Mine Closure and Reclamation |
1-17 |
| |
|
| 1.18 Capital and Operating Costs |
1-17 |
| 1.18.1 Capital Costs |
1-17 |
| 1.18.2 Operating Costs |
1-19 |
| |
|
| 1.19 Economic Analysis |
1-19 |
| |
|
| 1.20 Conclusions |
1-20 |
| |
|
| 1.21 Recommendations |
1-20 |
| |
|
| 2 Introduction |
2-1 |
| |
|
| 2.1 Qualified Person |
2-1 |
| |
|
| 2.2 Source of Information |
2-1 |
| |
|
| 2.3 Unit of Measure Abbreviations Used in Report |
2-2 |
| |
|
| 3 Reliance on Other Experts |
3-1 |
| |
|
| 4 Property Description and Location |
4-1 |
| |
|
| 4.1 Location |
4-1 |
| |
|
| 4.2 Land Use, Mineral Tenure, and Surface Rights |
4-2 |
| |
|
| 4.3 Environmental Property Liabilities |
4-7 |
| 4.4 Royalties |
4-7 |
| |
|
| 5 Accessibility, Climate, Local Resources, Infrastructure, and Physiography |
5-1 |
| |
|
| 5.1 Accessibility |
5-1 |
| |
|
| 5.2 Climate |
5-1 |
| |
|
| 5.3 Local Resources |
5-1 |
| |
|
| 5.4 Infrastructure |
5-1 |
| |
|
| 5.5 Physiography |
5-3 |
| |
|
| 6 History |
6-1 |
| |
|
| 6.1 Copper Mountain Mine Area and Mining History |
6-1 |
| |
|
| 6.2 Exploration and Mineral Resource Estimates History |
6-3 |
| |
|
| 7 Geological Setting and Mineralization |
7-1 |
| |
|
| 7.1 Regional Geology |
7-1 |
| |
|
| 7.2 CMM Geology |
7-1 |
| 7.2.1 Lithologies |
7-4 |
| 7.2.2 Structure |
7-5 |
| 7.2.3 Geochronology |
7-6 |
| |
|
| 7.3 Deposit Geology |
7-7 |
| 7.3.1 Alteration |
7-7 |
| 7.3.2 Mineralization |
7-7 |
| 7.3.3 Weathering |
7-9 |
| |
|
| 8 Deposit Types |
8-1 |
| |
|
| 8.1 Alkalic Porphyry Deposits |
8-1 |
| |
|
| 9 Exploration |
9-1 |
| |
|
| 9.1 Geological and Geochemical Mapping |
9-1 |
| |
|
| 9.2 Geophysics |
9-1 |
| 9.2.1 Airborne Surveys |
9-1 |
| 9.2.2 Ground Surveys |
9-1 |
| |
|
| 9.3 Exploration Potential |
9-3 |
| |
|
| 10 Drilling |
10-1 |
| |
|
| 10.1 Drill Summary |
10-1 |
| |
|
| 10.2 Drilling Methods |
10-5 |
| |
|
| 10.3 Geological Logging |
10-6 |
| |
|
| 10.4 Recovery |
10-6 |
| |
|
| 10.5 Collar Surveys |
10-6 |
| |
|
| 10.6 Downhole Surveys |
10-6 |
| |
|
| 10.7 RC and Percussion Drilling |
10-7 |
| |
|
| 10.8 Geotechnical and Hydrological Drilling |
10-7 |
| |
|
| 10.9 Drill Coverage |
10-8 |
| |
|
| 10.10 Comments on Drilling |
10-8 |
| 11 Sample Preparation, Analyses, and Security |
11-1 |
| |
|
| 11.1 Sampling Methods |
11-1 |
| 11.1.1 Historical Drilling |
11-1 |
| 11.1.2 Diamond and Reverse-Circulation Drilling |
11-1 |
| |
|
| 11.2 Density (Specific Gravity) Determinations |
11-2 |
| |
|
| 11.3 Analytical and Test Laboratories |
11-3 |
| 11.3.1 Laboratory Accreditation |
11-4 |
| |
|
| 11.4 Sample Preparation and Analysis |
11-4 |
| |
|
| 11.5 Quality Assurance and Quality Control |
11-4 |
| 11.5.1 Historical Data (Pre-2007) |
11-6 |
| 11.5.2 2007-2023 QA/QA Control Program |
11-6 |
| |
|
| 11.6 Check and Re-Assay Programs |
11-11 |
| 11.6.1 Check Assays |
11-11 |
| 11.6.2 External Check-Assays Results |
11-12 |
| 11.6.3 Re-Assays |
11-12 |
| |
|
| 11.7 Sample Security |
11-13 |
| |
|
| 11.8 Sample Storage |
11-13 |
| |
|
| 11.9 Comments on Sample Preparation, Analyses, and Security |
11-14 |
| |
|
| 12 Data Verification |
12-1 |
| |
|
| 12.1 Internal Verification |
12-1 |
| 12.1.1 Collars |
12-2 |
| 12.1.2 Downhole Surveys |
12-2 |
| 12.1.3 Assays |
12-3 |
| 12.1.4 Database Corrections |
12-4 |
| 12.1.5 Data Security |
12-5 |
| 12.1.6 Site Visits |
12-5 |
| |
|
| 12.2 Comments on Data Verification |
12-5 |
| |
|
| 13 Mineral Processing and Metallurgical Testing |
13-1 |
| |
|
| 13.1 Comminution |
13-1 |
| 13.1.1 Copper Mountain Main and North Pit |
13-1 |
| 13.1.2 New Ingerbelle |
13-1 |
| |
|
| 13.2 Flotation |
13-2 |
| 13.2.1 Copper Mountain Main and North Pit |
13-2 |
| 13.2.2 New Ingerbelle |
13-3 |
| 13.2.3 Precious Metal Recoveries |
13-5 |
| |
|
| 14 Mineral Resource Estimates |
14-1 |
| |
|
| 14.1 Drilling Database |
14-1 |
| |
|
| 14.2 Density |
14-7 |
| |
|
| 14.3 Gold and Silver Regressions |
14-8 |
| |
|
| 14.4 Compositing |
14-8 |
| |
|
| 14.5 Exploratory Data Analysis |
14-8 |
| |
|
| 14.6 Grade Capping |
14-9 |
| |
|
| 14.7 Variography |
14-9 |
| |
|
| 14.8 Grade Estimation and Interpolation Methods |
14-10 |
| 14.9 Grade Estimation Validation |
14-11 |
| |
|
| 14.10 Visual Inspection |
14-11 |
| |
|
| 14.11 Global-Bias Checks |
14-14 |
| |
|
| 14.12 Smoothing Assessment |
14-16 |
| |
|
| 14.13 Smoothing Correction |
14-16 |
| |
|
| 14.14 Classification of Mineral Resource |
14-18 |
| |
|
| 14.15 Post-Processing of Dykes, Mined-Out Areas, and Backfill |
14-19 |
| |
|
| 14.16 Reasonable Prospects for Economic Extraction and Mineral Resource Estimates |
14-19 |
| |
|
| 14.17 Reconciliation |
14-20 |
| |
|
| 14.18 Conclusion |
14-22 |
| |
|
| 15 Mineral Reserve Estimates |
15-1 |
| |
|
| 15.1 Dilution and Mining Recovery |
15-1 |
| |
|
| 15.2 Geotechnical Considerations |
15-1 |
| |
|
| 15.3 Pit Optimization |
15-2 |
| |
|
| 15.4 Mineral Reserve Statement |
15-2 |
| |
|
| 15.5 Factors that may Materially Affect Mineral Reserves |
15-2 |
| |
|
| 16 Mining Methods |
16-1 |
| |
|
| 16.1 Mining Overview |
16-1 |
| |
|
| 16.2 Pit and Waste-Rock Storage Area Design Criteria |
16-1 |
| |
|
| 16.3 Pit Dewatering |
16-5 |
| |
|
| 16.4 Life-of-Mine Production Schedule and Sequence |
16-5 |
| 16.4.1 Sequence, Dilution, and Mill-Feed Cut-Off Strategy |
16-5 |
| 16.4.2 Dilution and Mill-Feed Cut-Off Strategy |
16-5 |
| 16.4.3 New Ingerbelle Development |
16-6 |
| 16.4.4 Production Schedule |
16-7 |
| |
|
| 16.5 Mine Equipment |
16-9 |
| |
|
| 17 Recovery Methods |
17-1 |
| |
|
| 17.1 Process Plant Description |
17-1 |
| 17.1.1 Crushing Circuit |
17-1 |
| 17.1.2 Grinding and Classification |
17-3 |
| 17.1.3 Flotation Circuit |
17-3 |
| 17.1.4 Copper-Concentrate Dewatering |
17-4 |
| 17.1.5 Reagents and Consumables |
17-4 |
| |
|
| 17.2 50 kt/d Debottlenecking |
17-5 |
| 17.2.1 Comminution Circuit |
17-6 |
| 17.2.2 Flotation Circuit |
17-6 |
| |
|
| 18 Infrastructure |
18-1 |
| |
|
| 18.1 Power Supply |
18-3 |
| 18.1.1 Copper Mountain Mine Power Reticulation |
18-4 |
| |
|
| 18.2 Water Supply and Management |
18-4 |
| 18.2.1 Existing Water Management Systems |
18-5 |
| |
|
| 18.3 Other Services |
18-6 |
| 18.3.1 Process Plant Maintenance |
18-6 |
| 18.3.2 Fleet Maintenance |
18-7 |
| 18.3.3 Fuel Storage and Distribution |
18-7 |
| 18.3.4 Administration Facilities |
18-7 |
| 18.3.5 Warehousing |
18-7 |
| 18.3.6 Waste Rock Facility |
18-7 |
| 18.3.7 Tailings Management Facility |
18-8 |
| |
|
| 18.4 New Ingerbelle Pit Activation |
18-8 |
| 18.4.1 New Ingerbelle Maintenance Services |
18-8 |
| 18.4.2 New Ingerbelle Pit Access |
18-8 |
| 18.4.3 New Ingerbelle Power Reticulation |
18-10 |
| 18.4.4 New Ingerbelle Water-Management Installations |
18-12 |
| 18.4.5 New Ingerbelle Waste Rock Facility |
18-12 |
| |
|
| 19 Market Studies and Contracts |
19-1 |
| |
|
| 19.1 Copper Concentrate |
19-1 |
| |
|
| 19.2 Related Contracts |
19-1 |
| |
|
| 19.3 Logistics |
19-2 |
| |
|
| 20 Environmental Studies, Permitting, and Social or Community Impact |
20-1 |
| |
|
| 20.1 Permitting |
20-1 |
| 20.1.1 Existing Major Permits |
20-1 |
| 20.1.2 Other Potential Permits |
20-3 |
| |
|
| 20.2 Environmental Studies and Monitoring Programs |
20-4 |
| 20.2.1 Meteorology |
20-4 |
| 20.2.2 Air Quality and Greenhouse Gas Emissions |
20-4 |
| 20.2.3 Hydrology, Hydrogeology, and Water Quality |
20-4 |
| 20.2.4 Waste Rock Geochemistry |
20-5 |
| 20.2.5 Fish and Aquatics |
20-5 |
| 20.2.6 Wildlife and Vegetation |
20-6 |
| 20.2.7 Archaeology |
20-6 |
| 20.2.8 Environmental Disclosure |
20-6 |
| |
|
| 20.3 Social and Community |
20-6 |
| 20.3.1 Employment and Economy |
20-7 |
| 20.3.2 Land Use |
20-8 |
| 20.3.3 Engagement |
20-10 |
| |
|
| 20.4 Conceptual Mine Closure and Reclamation |
20-11 |
| |
|
| 21 Capital and Operating Costs |
21-1 |
| |
|
| 21.1 Capital Costs |
21-1 |
| 21.1.1 Project Capital |
21-1 |
| 21.1.2 Sustaining Capital and Capitalized Stripping |
21-2 |
| |
|
| 21.2 Operating Costs |
21-4 |
| 22 Economic Analysis |
22-1 |
| |
|
| 23 Adjacent Properties |
23-1 |
| |
|
| 24 Other Relevant Data and Information |
24-1 |
| |
|
| 25 Interpretation and Conclusions |
25-1 |
| |
|
| 26 Recommendations |
26-1 |
| |
|
| 27 References, Abbreviations, and Units of Measure |
27-1 |
| |
|
| 27.1 References |
27-1 |
| |
|
| 27.2 Abbreviations and Units of Measure |
27-9 |
Tables
| Table 1-1: Copper Mountain Mineral Resource Estimates Inclusive of Mineral Reserves Effective as of December 1, 2023 |
1-9 |
| Table 1-2: Copper Mountain Mineral Resource Estimates Exclusive of Mineral Reserves Effective as of December 1, 2023 |
1-9 |
| Table 1-3: Reconciliation between the 2019, 2022, and 2023 Copper Mountain Mineral Resource Estimates |
1-10 |
| Table 1-4: Copper Mountain Mine Mineral Reserves, Effective as of December 1, 2023 |
1-11 |
| Table 1-5: Copper Mountain LOM Mine Schedule-2024-2044 |
1-14 |
| Table 1-6: Production Ramp-Up Schedule |
1-15 |
| Table 1-7: Major Permits at Copper Mountain Mine |
1-16 |
| Table 1-8: Copper Mountain Mine-Summary of LOM Capital Cost ($ 000s) |
1-18 |
| Table 1-9: Copper Mountain Mine-Summary of LOM Operating Costs ($/t) |
1-19 |
| Table 1-10: Operating Costs and Sustaining Costs per Pound (US$/lb) |
1-19 |
| Table 3-1: Reliance on Other Experts |
3-1 |
| Table 4-1: Crown Grants |
4-4 |
| Table 4-2: Mineral Claims |
4-5 |
| Table 4-3: Mining Leases |
4-7 |
| Table 6-1: Reconciliation between the 2019, 2022, and 2023 Copper Mountain Mineral Resource Estimates |
6-4 |
| Table 10-1: Summary of Historical Drill Hole Data for the Copper Mountain Project |
10-2 |
| Table 10-2: Summary of Recent Drill Hole Data for the Copper Mountain Project |
10-3 |
| Table 11-1: Sample Preparation and Analytical Laboratories |
11-3 |
| Table 11-2: Laboratory Location and Accreditation |
11-4 |
| Table 11-3: Summary of CMM QA/QC from 2007 to 2023 |
11-5 |
| Table 11-4: Blank and CRM Insertion Procedures from 2007 to 2023 |
11-7 |
| Table 11-5: CRMs Used from 2007-2023 |
11-8 |
| Table 11-6: Summary of CRM Performance for Drill Programs 2007-2023 |
11-9 |
| Table 11-7: Summary of Blank Performance for Drill Programs 2007-2023 |
11-10 |
| Table 11-8: Summary of CRM Performance for Copper Mountain Mine Laboratory 2012-2022 |
11-11 |
| Table 11-9: Summary of External Check Assays 2012-2022 for Cu% by AA Method |
11-12 |
| Table 11-10: Summary of Half-Core Duplicate Check-Assays 2021-2022 for Cu% by AA Method |
11-13 |
| Table 12-1: Summary of Survey by Hole Type |
12-3 |
| Table 12-2: Survey Type in Recent Drill Holes (2007-2023) |
12-3 |
| Table 12-3: Assay Database Summary by Element, Period, and Laboratory |
12-4 |
| Table 13-1: Main and North Pit Hardness |
13-1 |
| Table 13-2: New Ingerbelle Hardness Testwork Results |
13-1 |
| Table 13-3: Historical Ingerbelle Flotation Performance |
13-4 |
| Table 14-1: Drill-Hole Summary |
14-1 |
| Table 14-2: Drill-Hole Summary per Deposit |
14-2 |
| Table 14-3: Mineralized Envelopes Code Equivalency |
14-2 |
| Table 14-4: Specific Gravity by Mineralization Domains |
14-7 |
| Table 14-5: Copper Mountain and New Ingerbelle Capping Thresholds |
14-9 |
| Table 14-6: East Deposit Variogram Parameters |
14-9 |
| Table 14-7: Search Ellipse Parameters |
14-10 |
| Table 14-8: Global Statistics |
14-15 |
| Table 14-9: Summary of Smoothing Correction |
14-17 |
| Table 14-10: Resource Classification Proportion Pre- and Post-Processing |
14-19 |
| Table 14-11: Copper Mountain Mineral Resource Estimates Inclusive of Mineral Reserves Effective as of December 1, 2023 |
14-20 |
| Table 14-12: Copper Mountain Mineral Resource Estimates Exclusive of Mineral Reserves Effective as of December 1, 2023 |
14-20 |
| Table 14-13: December 2020 to October 2023 Mineral Reserve Estimates vs. Plant Reconciled Results |
14-21 |
| Table 14-14: Reconciliation between the 2019, 2022, and 2023 Copper Mountain Mineral Resource Estimates |
14-21 |
| Table 15-1: Copper Mountain Mine Mineral Reserves, December 1, 2023 |
15-3 |
| Table 16-1: Pit Wall Slope Parameters |
16-3 |
| Table 16-2: Copper Mountain Mine WRF Design Criteria |
16-4 |
| Table 16-3: Copper Mountain Mine Planning Parameters |
16-5 |
| Table 16-4: Copper Mountain LOM Mine Schedule-2024-2044 |
16-8 |
| Table 16-5: Copper Mountain Mine Pit Equipment Fleet, Peak Production |
16-9 |
| Table 17-1: Production Ramp-Up Schedule |
17-5 |
| Table 17-2: Process Design Criteria |
17-7 |
| Table 18-1: Site Power Demand Summary |
18-4 |
| Table 20-1: Major Permits at Copper Mountain Mine |
20-1 |
| Table 21-1: LOM Capital Projects Expenditures ($ 000s) |
21-1 |
| Table 21-2: LOM Sustaining Capital and Capitalized Stripping Expenditures ($ 000s) |
21-3 |
| Table 21-3: On-Site Operating Costs ($/t Milled) |
21-4 |
| Table 21-4: Operating Costs-Mining/Activity ($/t Moved) |
21-4 |
| Table 21-5: Operating Costs-Mining/Components ($/t Moved) |
21-5 |
| Table 21-6: Operating Costs-Milling and G&A ($/t Milled) |
21-5 |
| Table 21-7: Operating Costs and Sustaining Costs per Pound (US$/lb) |
21-6 |
Figures
| Figure 1-1: Copper Mountain Mine Land Tenure |
1-2 |
| Figure 1-2: Copper Mountain and New Ingerbelle Ultimate Pits |
1-12 |
| Figure 4-1: Copper Mountain Mine Location |
4-1 |
| Figure 4-2: Copper Mountain Mine Land Tenure |
4-3 |
| Figure 5-1: Copper Mountain Mine Site |
5-2 |
| Figure 6-1: Locations and Names of Historical and Current Mining Zones and Areas |
6-2 |
| Figure 7-1: Terranes of British Columbia Showing the Copper Mountain Deposit Location |
7-2 |
| Figure 7-2: Geology of the Copper Mountain Area |
7-3 |
| Figure 7-3: Schematic Representation of a Geological SW-NE Cross-Section Across Copper Mountain |
7-4 |
| Figure 7-4: Contoured Blastholes in the CM Main Pit at November 2019 Mining Surface |
7-9 |
| Figure 9-1: Total Magnetic Intensity |
9-2 |
| Figure 9-2: Location of IP Survey Lines |
9-3 |
| Figure 10-1: Isometric View of Drill Hole in the CM Main and CM North Zones |
10-5 |
| Figure 13-1: Monthly Copper Recovery |
13-2 |
| Figure 13-2: Rougher Flotation Co-Collector Testwork on Copper Mountain Main Pit Samples |
13-3 |
| Figure 13-3: Rougher Flotation Testwork on New Ingerbelle Composites |
13-4 |
| Figure 13-4: Monthly Gold Recovery |
13-5 |
| Figure 13-5: Monthly Silver Recovery |
13-6 |
| Figure 14-1: Plan View of the Geological Model |
14-3 |
| Figure 14-2: Plan View of the Mineralized Domains |
14-4 |
| Figure 14-3: New Ingerbelle Mineralization |
14-4 |
| Figure 14-4: Copper Mountain North Mineralization |
14-5 |
| Figure 14-5: Copper Mountain Central East Mineralization |
14-5 |
| Figure 14-6: Copper Mountain Central Mineralization |
14-6 |
| Figure 14-7: Copper Mountain South Central Mineralization |
14-6 |
| Figure 14-8: Copper Mountain South Mineralization |
14-7 |
| Figure 14-9: Ore Percentage Example |
14-10 |
| Figure 14-10:New Ingerbelle-OK Model and Copper Grade Composites N-S Section View |
14-11 |
| Figure 14-11:Copper Mountain North-OK Model and Copper Grade Composites N-S Section View |
14-12 |
| Figure 14-12:Copper Mountain Central East-OK Model and Copper Grade Composites N-S Section View |
14-12 |
| Figure 14-13:Copper Mountain Central and South Central-OK Model and Copper Grade Composites N-S Section View |
14-13 |
| Figure 14-14:Copper Mountain South-OK Model and Copper Grade Composites N-S Section View |
14-13 |
| Figure 14-15:Resource Classification at the CMM Deposits |
14-18 |
| Figure 14-16:Copper Mountain 2022 Block Model vs. Hudbay Grade Shells |
14-22 |
| Figure 16-1: Copper Mountain and New Ingerbelle Ultimate Pits |
16-2 |
| Figure 16-2: Geotechnical Zones |
16-4 |
| Figure 16-3: Annual Material Movement |
16-9 |
| Figure 17-1: Process Plant 45 kt/d Flowsheet |
17-2 |
| Figure 18-1: BC Hydro Transmission Map |
18-3 |
| Figure 18-2: Overall 25 kV Distribution System |
18-5 |
| Figure 18-3: Site Water Management Schematic |
18-6 |
| Figure 18-4: Proposed Equipment Bridge Crossing the Similkameen River |
18-9 |
| Figure 18-5: New Ingerbelle Proposed Power Supply and Reticulation |
18-11 |
| Figure 19-1: Global Copper Production and Primary Demand |
19-1 |
| Figure 20-1: Copper Mountain Permitted Mine Area |
20-2 |
| Figure 20-2: Community Boundaries and Setting in Relation to Copper Mountain Mine |
20-7 |
| Figure 20-3: Ingerbelle Land Tenure |
20-9 |
1 Summary
This Technical Report has been prepared for Hudbay Minerals Inc. (Hudbay) to support the public disclosure of updated Mineral Resource and Mineral Reserve estimates and an updated life-of-mine (LOM) plan for the Copper Mountain Mine (CMM). This Technical Report conforms to National Instrument (NI) 43-101 Standards of Disclosure for Mineral Projects.
Hudbay acquired Copper Mountain Mining Corporation (CMMC) in June 2023 and indirectly holds a 75% interest in Copper Mountain Mine (BC) Ltd. (CMML) and the CMM. The remaining 25% interest in CMML and the CMM is held by Mitsubishi Materials Corp. (MMC).
Hudbay is an integrated Canadian mining company with assets in North and South America, principally focused on the discovery, production, and marketing of base metals and precious metals. Hudbay's objective is to maximize shareholder value through efficient operations, organic growth, and accretive acquisitions while maintaining its financial strength.
Hudbay's operations at the CMM include a series of open pits, an ore processing plant, waste rock facilities (WRF), a tailings management facility (TMF), and other ancillary facilities that support the operations.
After 15 years of care and maintenance, CMMC restarted operations at the CMM in mid-2011. Operations have continued since 2011 without major interruptions. As of the date of this Technical Report, the CMM is in steady-state production.
The Qualified Person (QP) who supervised the preparation of this Technical Report is Hudbay's Olivier Tavchandjian, P.Geo., Senior Vice-President, Exploration and Technical Services.
Unless the context suggests otherwise, references to "Hudbay" refer to Hudbay Minerals Inc. and its direct and indirect subsidiaries, including but without limitation, CMML.
1.1 Property Description and Location
The CMM is 21 km by road south of Princeton and 180 km east of Vancouver, British Columbia (B.C.). The CMM property consists of 135 Crown-granted mineral claims, 145 located mineral claims, 14 mining leases, 12 fee simple properties, and 7 cell claims, which together cover 6,354 ha (63.5 km2). All claims are controlled by CMML, a joint venture held 75% by Hudbay and 25% by MMC. The claims straddle the Similkameen River, with New Ingerbelle on the river's west side and the Copper Mountain Main (CM Main) and Copper Mountain North (CM North) Pits on the east. The Hope-Princeton Highway (Highway 3) passes immediately west of the property (Figure 1-1).
Figure 1-1: Copper Mountain Mine Land Tenure

Source: CMMC (2022).
1.2 Accessibility, Climate, Local Resources, Infrastructure, and Physiography
Almost all the CMM property area is accessible by highway, with the site served by a paved access road, local gravel roads (remaining either from previous mining or logging), and those used for current mining. Electrical power from the provincial grid is connected to the property. Supplemental water for operations, in addition to water recycled from the TMF, is pumped from the Similkameen River. Property elevations range from approximately 770 m above sea level (masl) to 1,300 masl. The CMM area has a relatively dry climate, typical of B.C.'s southern interior. Summers are warm and dry, and winters are cool, with minor precipitation.
The Town of Princeton connects to the mine by way of an 18.4 km-long paved road, and a gravel road approximately 2.6 km long. The town has a population of approximately 3,000 and a diversified economy driven by mining, ranching, forestry, and tourism. The CMM operation is the predominant employer in the area. Princeton has services typical of its size; however, the mine's proximity to Vancouver, Kamloops, and other larger centres ensures that almost all the services required by mine operations are easily obtainable.
1.3 History
Initial exploration at the Copper Mountain area dates to around 1884. Underground mining began in 1923, when Granby Consolidated Mining, Smelting and Power Company (Granby) acquired the property and built a milling facility in Allenby (adjacent to Princeton). Between 1927 and 1957, Granby extracted around 31.5 Mt of economic mineralization with an estimated head grade of 1.08% Cu, as well as significant amounts of gold and silver, mostly from its underground operations. In 1972, Newmont began open pit mining operations at the Ingerbelle Pit, and in 1979, development on the east side of the Similkameen River commenced with the installation of a new primary crusher and conveyor system across the Similkameen River. This helped feed the Ingerbelle mill, which was expanded from 13 kt/d to over 20 kt/d. In 1988, Newmont sold the entire property to Cassiar Mining Corporation, which later became Princeton Mining Corporation. Mining operations ceased in 1996.
In 2006, the property was acquired by a joint venture held 75% by CMMC and 25% by MMC. Following extensive exploration and engineering studies, construction was initiated in early 2010, and the current phase of open pit mining began in 2011. The mill was initially designed to process 35 kt/d. Additional equipment has since been added to increase the nominal capacity to 45 kt/d, including a secondary crusher and a third ball mill. The current permit allows the mill to run at 50 kt/d.
Hudbay acquired CMMC and a 75% interest in the CMM in June 2023.
CMMC has published two technical reports since 2020 to support a future expansion of the mill to 65 kt/d (Holbek et al., 2020) and to report significant increases in Mineral Resource and Mineral Reserve estimates (Redmond et al., 2022). Hudbay did not endorse the Mineral Resource and Mineral Reserve estimates and mine plans that CMMC previously published. The present technical report supports the first Mineral Resource and Mineral Reserve estimates and LOM plan prepared under Hudbay's ownership and is more consistent with the assumptions used in CMMC's 2019 technical report (Holbek et al., 2019).
1.4 Geological Setting and Mineralization
The CMM porphyry copper deposit lies near the southern end of the Quesnel Terrane-an allochthonous composite crustal fragment consisting of Paleozoic and Mesozoic volcanic, sedimentary, and plutonic rocks. The southern Quesnel Terrane is dominated by the late Triassic Nicola Group, a subaqueous island-arc assemblage composed of volcanic and sedimentary rocks that make up the Nicola Volcanic Arc. At CMM, the Nicola Group is cut by a suite of intrusive rocks including the composite Copper Mountain Stock (CMS), the Voigt Stock, and the slightly younger, polyphase, Lost Horse Intrusive Complex (LHIC).
The bulk of the known copper-gold mineralization at CMM occurs in a northwesterly trending belt of Nicola Group rocks, approximately 5 km long and 2 km wide, bounded in the south by the CMS and in the west by the northerly trending Boundary Fault system. Copper-gold mineralization postdates the CMS and is temporally and spatially associated with the LHIC. Host rocks and mineralization in the mine area are cut by numerous late, north-south-trending felsite dykes, which are related to emplacement of the Cretaceous Verde Creek quartz monzonite, approximately 3.5 km northeast of the mine area. Sedimentary and volcanic rocks of the Eocene Princeton Group have been unconformably deposited on Nicola Group rocks and LHIC along the northern margin of the CMM and dip at about 30° to the north.
Alteration types in the CMM deposit are typical of porphyry copper deposits. Three major alteration types are observed at CMM: potassic, sodic, and propylitic. Other volumetrically minor alteration types include kaolinitic and sericite-chlorite clay. All mineralization-related hydrothermal alteration types postdate the hornfelsing of Nicola Group volcanic rocks adjacent to the CMS. Mineralization had been subdivided into four types, as follows:
- Disseminated and stockwork chalcopyrite, bornite, chalcocite, and pyrite in altered Nicola Group volcanic rocks and LHIC rocks
- Bornite-chalcopyrite associated with pegmatite-like veins (coarse masses of orthoclase, calcite, and biotite)
- Magnetite-(±hematite)-chalcopyrite replacements and/or veins
- Chalcopyrite-bearing magnetite breccias.
Due to Pleistocene glacial erosion most of the CMM deposits are characterized by a relatively fresh erosion surface, with limited surficial oxidation and no significant secondary enrichment of copper.
1.5 Deposit Types
Copper Mountain is an example of an alkalic porphyry deposit, in which copper-gold mineralization is spatially and genetically associated with multiple pulses of volumetrically restricted, and compositionally varied, alkaline porphyry intrusions. Although less common globally than calc-alkalic porphyry deposits, alkalic porphyry deposits are common in B.C., where they have been extensively studied. Well known examples of alkalic porphyry deposits in B.C. include Copper Mountain, Afton/Ajax, Mt. Milligan, Mount Polley, Lorraine, Red Chris, and Galore Creek. Alkalic porphyry deposits in B.C. have been further subdivided into two types; silica-undersaturated (e.g., Galore Creek) and silica-saturated (e.g., Copper Mountain).
Mineralization in alkalic porphyry deposits is typically hosted by potassic and/or calc-potassic alteration zones, and potassic alteration is typically more extensive spatially than copper-gold mineralization. Alkalic porphyry deposits in general are characterized by a relative scarcity of phyllic (sericitic) alteration, and an almost total lack of clay alteration. Sulphides in alkalic porphyry deposits are typically zoned from a bornite-rich core to bornite + chalcopyrite and then pyrite + chalcopyrite zones, with an outer barren zone where pyrite is the dominant sulphide. Overall, the sulphide content, especially pyrite content, is low compared to calc-alkalic porphyry deposits.
1.6 Exploration
The CMM has a long history of exploration and mining. Historical soil sampling and rock chip sampling were carried out, but there is limited information available on these historical geochemical surveys, and the surficial data are not relevant to the current Mineral Resource estimate.
Airborne geophysical surveys were flown within the CMM area in 1993 and 2014. A Titan induced polarization (IP)/resistivity/magnetotelluric survey, covering the CM Main and CM North Zones, was carried out in 2007; it consisted of seven lines totalling 22.8 line km. Another IP/resistivity survey was carried out in 2017, consisting of seven geophysical survey lines totalling 9.9 line km. Data from these geophysical surveys have been used to support geological mapping, exploration, and interpretation of the CMM deposits.
The CMM deposits remain open at depth with also a number of undrilled exploration targets generated using a combination of geophysical, geochemical, and structural geology data.
1.7 Drilling
The majority of the Copper Mountain area historical drilling (1912-2007) was diamond drilling, with some percussion holes drilled in the 1950s and reverse-circulation (RC) holes drilled in 1994. Since 2007, the majority of the drilling has been diamond drilling, with some RC drilling carried out in 2021-2022. Drilling on the CMM completed to September 1, 2023, includes 6,041 core and percussion drill holes (647,642 m) and 281 RC drill holes (45,744 m), for a total of 6,322 drill holes (693,386 m).
In 2023, Hudbay conducted global comparisons of assay results obtained from RC drilling and closely located diamond drilling in order to confirm the absence of sampling biases between the two drilling techniques.
A number of different drill-core diameters have been employed over the history of the CMM, including BX (36.6 mm core diameter for historical underground), NQ (47.6 mm core diameter), and HQ (63.5 mm core diameter). From 2007 onwards, the standard method of drilling was to start all holes with HQ core, then reduce to NQ core at depth. Core recoveries are typically between 90% and 100%, with local zones of lower recovery associated with fault zones.
Diamond core drill-holes have been geologically logged for lithology, structure, alteration, vein type, and mineralization. The geological logging of RC chips is recorded using a modified logging template to capture the same major characteristics as the core logging.
Historical collar surveys used industry-standard theodolite instrumentation to establish local grid control. From 2007, drill-hole collars were surveyed using either a total station instrument or differential Global Positioning System.
Downhole survey data were absent in pre-1960 drill holes. Downhole dip data, presumably by acid tests, were included in drill data from 1960 to 1987. From 1988 to 1998, downhole surveys were obtained using a Pajari instrument, which provided both azimuth and dip data. From 2007, downhole surveys were obtained using digital REFLEX instruments (or similar systems) which were compass based.
1.8 Sample Preparation, Analyses, and Security
Hudbay has no information on quality assurance and quality control (QA/QC) procedures for historical (pre-2007) drill-hole data. However, since 2007 large drilling programs that included QA/QC measures have globally validated the historical data. Historical drill-hole data are also supported by more than 12 years of reconciled copper production and operational data.
From 2007 to 2022, QA/QC data were collected and regularly monitored, and do not indicate any problems with the analytical programs. However, QA/QC submission rates varied throughout this time, and from 2021 to early 2022 QA/QC insertion rates dropped below industry-accepted standards. To address this shortcoming, a half-core re-assay program was carried out by CMMC, representing a 5% check of primary analyses of >0.1% Cu from the 2021-2022 drilling program; the results of this re-assay program showed that the original assay results are acceptable. From March 2022, QA/QC insertion rates have met industry-accepted standards.
From 2012 to 2022, sample preparation and primary analysis for copper and silver was carried out at the CMM laboratory. During this time, pulps from samples that returned >0.1% Cu in the CMM laboratory were routinely sent to a number of different independent laboratories for gold analysis, and on average 10% of these sample pulps were also analyzed for copper and silver. These check-assay results indicate that analytical data from the CCM laboratory are acceptable.
Based on a review of QA/QC data and the results of check and re-assay programs, the copper, gold, and silver data generated from drill core and RC samples are considered acceptable to support Mineral Resource and Mineral Reserve estimates.
In all, 1,673 specific gravity measurements have been made on drill core samples, representing a range of lithology, alteration, and mineralization types, using the weigh-in-air/weigh-in-water technique. These measurements have confirmed the validity of the historical tonnage conversion factor used at the CMM operations of 2.78 t/m3 for all rock types, which has also resulted in reasonable reconciliation with historical mine production.
Hudbay has no information on sample security measures prior to 2007. From 2007, samples have been stored in secure areas at the mine site. No significant security issues have been identified. CMM exploration staff continually verified data starting with the drilling programs in 2007-2008, which supported the mine restart in 2011, and continuing through the most recent 2022 drill program. Drill-hole data are also supported by more than 12 years of reconciled copper production and operational data.
1.9 Data Verification
CMMC exploration staff continually verified data starting with the drilling programs in 2007-2008, which supported the mine restart in 2011; this has continued through the most recent 2023 drill program.
There is no direct method for verifying historical (pre-2007) drill data. Although some drill cores remain on site, their condition does not allow for any systematic resampling or reanalysis. However, these historical data were obtained and compiled by major producing mining companies for mine design and production, and it is assumed that the data were acquired in the industry standard manner for their time.
In 2023, a major database migration to move all exploration project data into a cloud-based Seequent MX Deposit Database Management System has been completed. Prior to this, data were stored and managed within a Surpac Access Database on the company server. The 2023 project database has been extensively independently validated by Hudbay staff; the process included manual checks for transcription errors, data gaps, hole collar and assay interval locations, and downhole survey measurements.
Hudbay personnel working under the supervision of the Qualified Person have visited the CMM area to conduct site inspections to: become familiar with conditions on the property, observe the geology and mineralization, perform core review, and verify the work completed on the property as part of the Mineral Resource estimation and technical report process.
1.10 Mineral Processing and Metallurgical Testwork
The metallurgical characteristics of the CMM deposits have been developed through extensive mill experience and ongoing on-site- and off-site-based testing over the past decade.
1.10.1 Comminution
Feed sourced from the CM Main and North Pits is competent and hard. To predict processing throughput from these areas, a conservative set of hardness values has been used based on recent plant performance from these active mining areas. The New Ingerbelle Pit constitutes a significant percentage of the LOM Mineral Reserve estimates, with a material impact on projected throughput. Comminution testwork campaigns were completed in 2021 and 2022, with hardness results indicating that the New Ingerbelle mineralization is similar to the CM Main Pit with similar expected processing throughput.
1.10.2 Flotation
Since retained in 2012, the copper-cleaner recovery has been consistent since the beginning of operations and is expected to remain within the 96% to 98% operating range. Rougher-copper recovery is a function of the feed-ore quality and the overall operational efficiency of the comminution and flotation circuits. Without any changes to the existing circuit, inclusive of any configuration, equipment, and reagent schemes, the rougher-copper recovery would vary from 81% to 85% recovery, for a total copper recovery of 79% to 83%.
Flotation testwork has been initiated to increase the average flotation recovery via changes to the reagent scheme. The target of the programs has been the sulphide-mineral collectors and sulphurization agents. Adding a secondary co-collector has significantly increased the rougher-circuit recovery, by up to 8%, against the current scheme. In addition, two on-site lab-scale test campaigns were completed in 2023 to determine the effectiveness of improving recovery of oxide, transition, and sulphide minerals by reapplying active S− ions to the surface of the target minerals. These tests were successful, showing sulphide-copper recovery improvements of 2%, and oxide-copper recovery improvements in excess of 20%, together with silver-recovery improvements. An overall 4% improvement over three years in copper recovery has been included in the mine plan.
Testwork on New Ingerbelle Pit mineralization began in 2017. Results of the flotation tests performed on composite samples exceeded 85% rougher recovery, with many above 90%. Historical production data from the Ingerbelle mill from 1970 through 1983 indicate recovery varying between 86% and 89%. With the existing circuit, the rougher recovery from New Ingerbelle is expected to be 87% to 92%. Applying the same cleaner-copper recovery range as per the CM Main Pit, total copper recovery is expected to be in the 85% to 90% range, with an estimated 87% on average.
Gold and silver are recovered as by-products by means of flotation. Historical production data from production records indicates that both gold and silver are correlated with overall copper recovery. Based on recent production records for Main and North Pits as discussed in Section 13.2.3, and on production records available for the 1976-1979 period for New Ingerbelle, recovery targets for gold and silver have been set to a range of 65% to 70%.
1.10.3 Concentrate Characterization
There are currently no penalties associated with concentrates produced by the CMM concentrator. Moreover, there is no indication of any potential future concerns.
1.11 Mineral Resource Estimate
The CMM Mineral Resource estimate is effective as of December 1, 2023.
Following its acquisition of the CMM in June 2023, Hudbay has worked to complete a new Mineral Resource and Mineral Reserve estimate with an effective date of December 1, 2023, which constitutes the basis for the updated Mineral Resource estimate presented in this Technical Report. A total of 693,386 m representing 6,322 holes has been used to construct the resource model for the CMM deposits. When gold and silver grade were not measured, they were calculated from the copper grade using robust regression formulae, by geological domain. Density was assigned a fixed value of 2.78 g/cm3.
Resource modelling at CMM is based on integrated geological and assay interpretations of information recorded from diamond core and RC logging and assaying, and comprises the following key steps: constructing mineralized envelopes; exploratory data analysis; and modelling (composites, variography, and interpolation) and validations, including a thorough assessment of the smoothing effect occurring during grade interpolation by domain, with consistent drill spacing and statistical distributions, and correction for over-smoothing when required. This methodology was validated through reconciliation between Mineral Reserve estimates and mill-credited production.
The CMM geological model was developed from an initial interpretation of six lithological domains. This geological framework was then used to model six continuous estimation-domains hosting the mineralization grading above 0.1% Cu. Post-mineralization barren dykes cross-cutting the mineralization were assigned a grade of zero, as they host minimal metal. In addition, former underground stopes filled with caved mineralization mixed with barren rocks were assigned a density of 2.0 g/cm3 and an average grade of 0.12% Cu, and the gold and silver grade were estimated through regression formula from the copper grade. Areas that have been backfilled were assigned an average density of 1.9 g/cm3 and a zero grade for all metals.
For each mineralized envelope, resource classification is based on the kriging slope of regression, which is a function of drill spacing, mineralization continuity, and mining block geometry. Distance to closest samples was also considered, as well as the search criteria during interpolation. A first-pass coding was based on the kriged regression slope for Measured resources being >80% and between 60% and 80% for Indicated resources. These thresholds align with the classification criteria used by Hudbay for its other operating mines and projects. Some local adjustments were made to produce resource category domains that are smoother and more continuous, while also considering the number and distance of the samples used for interpolation.
The Mineral Resource estimates inclusive and exclusive of Mineral Reserve estimates are reported in Table 1-1 and Table 1-2 at a 0.10% Cu cut-off grade, and inside an economic pit shell demonstrating that they have reasonable prospects for economic extraction.
Table 1-1: Copper Mountain Mineral Resource Estimates Inclusive of Mineral Reserves
Effective as of December 1, 2023
| Resource Classification |
Tonnes
(kt) |
% Cu |
Au g/t |
Ag g/t |
CuEq % |
| Measured |
225,145 |
0.27 |
0.12 |
0.81 |
0.34 |
| Indicated |
273,304 |
0.22 |
0.11 |
0.63 |
0.39 |
| Measured+Indicated |
498,450 |
0.25 |
0.12 |
0.71 |
0.32 |
| Inferred |
371,319 |
0.25 |
0.13 |
0.61 |
0.34 |
Notes: Totals may not add up correctly due to rounding.
Mineral Resources are estimated as of December 1, 2023, and exclude those Mineral Resources expected to be mined and milled in the month of December 2023, resulting in an effective date of December 1, 2023.
Tonnes and grades constraint to a Lerch-Grossman revenue factor 1 pit shell.
Mineral Resources are not Mineral Reserves as they do not have demonstrated economic viability.
Mineral Resources are reported using long-term copper, gold, and silver prices of US$4.00/lb, US$1,650/oz, and US$22.00/oz, respectively.
Table 1-2: Copper Mountain Mineral Resource Estimates Exclusive of Mineral Reserves
Effective as of December 1, 2023
| Resource Classification |
Tonnes
(kt) |
% Cu |
Au g/t |
Ag g/t |
CuEq % |
| Measured |
41,198 |
0.21 |
0.09 |
0.73 |
0.27 |
| Indicated |
96,615 |
0.21 |
0.11 |
0.68 |
0.29 |
| Measured+Indicated |
137,814 |
0.21 |
0.10 |
0.69 |
0.28 |
| Inferred |
371,319 |
0.25 |
0.13 |
0.61 |
0.34 |
Notes: Totals may not add up correctly due to rounding.
Mineral Resources are estimated as of December 1, 2023 and exclude those Mineral Resources expected to be mined and milled in December 2023, resulting in an effective date of December 1, 2023.
Tonnes and grades constraint to a Lerch-Grossman revenue factor 1 pit shell.
Mineral Resources are not Mineral Reserves as they do not have demonstrated economic viability.
Mineral Resources are reported using long-term copper, gold, and silver prices of US$4.00/lb, US$1,650/oz, and US$22.00/oz, respectively.
Table 1-3 presents a comparison of the Measured, Indicated, and Inferred Mineral Resource tonnages inclusive of Mineral Reserve estimates, with the estimates reported by CMMC in the Holbek et al. (2019) and Redmond et al. (2022) technical reports. Table 1-3 shows a reasonable agreement with the 2019 CMMC estimates after mining depletion and considering a reclassification of some of the Indicated Mineral Resource estimates to the Inferred category, as well as some exploration successes since 2019 that have resulted in the addition of high-grade resources while the 2022 CMMC estimates are deemed to represent an anomaly with an inflated estimate of the Mineral Resources based on optimistic assumptions. Importantly, the new 2023 Mineral Resource estimates are showing close results with production with both tonnage and grade reconciling within 3% to 4% of credited mine production by the mill over the past three years.
Table 1-3: Reconciliation between the 2019, 2022, and 2023 Copper Mountain
Mineral Resource Estimates
| Categories |
CMMC 2019 PFS
(as of January 1, 2019) |
CMMC 2022 PFS
(as of August 1, 2022) |
Hudbay 2023
(as of December 1, 2023) |
Tonnes
(Mt) |
Cu
(%) |
Au
(ppm) |
Ag
(ppm) |
Tonnes
(Mt) |
Cu
(%) |
Au
(ppm) |
Ag
(ppm) |
Tonnes
(%) |
Cu
(%) |
Au (ppm)
(%) |
Ag (ppm)
(%) |
| Measured + Indicated |
549 |
0.24 |
0.11 |
0.75 |
1,080 |
0.22 |
0.09 |
0.65 |
440 |
0.25 |
0.12 |
0.73 |
| Inferred |
237 |
0.21 |
0.10 |
0.50 |
446 |
0.19 |
0.09 |
0.54 |
371 |
0.25 |
0.13 |
0.61 |
Notes: PFS = prefeasibility study.
Cut-off at 0.10% Cu.
Mineral Resources are constrained by a $3.50/lb Cu pit shell in the 2019 and 2022 and by a pit shell using long-term copper, gold, and silver prices of US$4.00/lb, US$1,650/oz, and US$22.00/oz, respectively in 2023.
1.12 Mineral Reserve Estimate
Hudbay prepared the Mineral Reserve estimates for the CMM deposits presented in this Technical Report. The QP who supervised the preparation of this Technical Report is Olivier Tavchandjian, P.Geo., Hudbay's Senior Vice-President, Exploration and Technical Services.
Hudbay has opted to use a net smelter return (NSR) optimization model considering the copper, silver, and gold grades; mill recoveries; contained metal in concentrate; deductions and payable metal values; metal prices; freight costs; exchange rate; smelting and refining charges; and royalty charges.
The 2023 Proven and Probable Mineral Reserve estimates at the CMM total 367 Mt at a copper grade of 0.25% that supports a 21 year mine life. The mine plan is based on the capacity of the process plant, which in turn relies on the grinding circuit throughput. The plant is permitted to process 50 kt/d.
Table 1-4: Copper Mountain Mine Mineral Reserves, Effective as of December 1, 2023
| Category |
Tonnes
(kt) |
Cu Grade
(% Cu) |
Au Grade
(g/t) |
Ag Grade
(g/t) |
Cu Pounds
(Mlb) |
Au Ounces
(koz) |
Ag Ounces
(koz) |
CuEq % |
| Proven |
|
|
|
|
|
|
|
|
| Mined Tonnes |
194,199 |
0.27 |
0.12 |
0.78 |
1,168 |
775 |
4,880 |
- |
| Stockpile |
838 |
0.15 |
0.05 |
0.59 |
3 |
1 |
16 |
- |
| Total Proven |
195,037 |
0.27 |
0.12 |
0.78 |
1,171 |
777 |
4,896 |
0.35 |
| Probable |
|
|
|
|
|
|
|
|
| Mined Tonnes |
118,226 |
0.25 |
0.14 |
0.65 |
659 |
524 |
2,489 |
- |
| Stockpile |
53,717 |
0.16 |
0.04 |
0.45 |
185 |
69 |
779 |
- |
| Total Probable |
171,943 |
0.22 |
0.11 |
0.59 |
844 |
593 |
3,268 |
0.30 |
| Proven + Probable |
|
|
|
|
|
|
|
|
| Mined Tonnes |
312,425 |
0.27 |
0.13 |
0.73 |
1,827 |
1,299 |
7,370 |
- |
| Stockpile |
54,555 |
0.16 |
0.04 |
0.45 |
188 |
71 |
795 |
- |
| Total |
366,980 |
0.25 |
0.12 |
0.69 |
2,015 |
1,370 |
8,164 |
0.33 |
Notes: CIM Definition Standards for Mineral Resources & Mineral Reserves (CIM, 2014) were followed for Mineral Reserves.
Mineral Reserves were estimated as of December 1, 2023, but were generated excluding the Measured and Indicated Mineral Resource estimates planned to be mined and milled in the month of December 2023.
Mineral Reserves are reported using an NSR cut-off value of US$5.67 that meets a minimum 0.10% Cu grade.
Mineral Reserves are reported using long-term copper, gold, and silver prices of US$3.75/lb, US$1,650/oz, and US$22.00/oz, respectively.
Average density is 2.78 t/m3 for hardrock material, 2.0 t/m3 for stockpiled material, and 1.90 t/m3 for material in old stopes from previous underground mining activities.
Stockpile tonnes and grade are based on historical production grade control processes.
Totals may not add due to rounding.
1.13 Mining Methods and Production Schedules
CMM employs conventional open pit mining methods composed of blasthole drilling, blasting, shovel loading, and rigid-frame rear-dump-truck haulage. The blasthole cuttings are mapped and sampled, with samples transported to the on-site analytical laboratory. Samples are pulverized and analyzed for copper. Assays are uploaded by the geology department and combined with the exploration drill database, which is then interpolated onto bench plans together with blasthole grades and geological information. Grade boundaries are selected manually, and depending on the material, the blasting details are determined. Following blasting, the dig plans are uploaded to the shovels and dispatch system to direct mining and haulage.
Hudbay uses standard steps of open pit optimization, pit design, production scheduling, and financial modelling for estimating the CMM's Mineral Reserves. Assumptions are based on operating experience and both mine and mill performance. The production model considers all operating costs, capital costs, and sustaining expenditures. Capital costs include new or used mine equipment required to achieve the production profile. Operating costs include all costs such as power, diesel fuel, parts, maintenance, grinding media and other consumables, and general and administrative (G&A) costs.
Production schedules are based on achieving a tonnage of mill feed, which is constrained by the specified mining fleet, mineralization and waste-haul profiles, and calculated productivities. The Copper Mountain Pit, New Ingerbelle Pit, and key mining infrastructure is shown in Figure 1-2.
Figure 1-2: Copper Mountain and New Ingerbelle Ultimate Pits

The mine uses an NSR cut-off value of $5.67/t with an additional constraint of 0.10% Cu. Material above the NSR cut-off can be sent directly to the crusher, to a temporary high-grade stockpile, or alternatively to a low-grade stockpile when the copper grade is between 0.10% and 0.13% Cu, depending upon production rates of the various materials over a given time. The fine-ore stockpile that feeds the mill has enough capacity for approximately five days of milling. The projected mining fleet owned by Hudbay will move an average of 94 Mt/a from 2024 though 2026. In addition to the CMM fleet, it is projected that a contract miner will move an additional 40 Mt of material from mid-2024 to mid-2026 to maximize high-grade ore exposure. Following 2026, the material movement rate will decrease over time as waste stripping demands decrease. The estimated fleet will sustain the projected mill ramp-up production to 50 kt/d by 2027. Table 1-5 shows a summary of the LOM for the CMM.
Hudbay has conducted trade-off studies between various scenarios for the LOM plan, aiming to uncover high-grade mill feed early in the mine's life. The base case selected for the LOM plan adopted in this Technical Report constitutes a conservative approach to maximizing high-grade access while adhering to known geotechnical requirements. Hudbay has identified opportunities to reduce waste stripping requirements that are not yet at the mature level of engineering required to comply with NI 43-101 requirements; however, Hudbay intends to develop and demonstrate these improvements in the coming months fully, and as such, the capitalized stripping associated to the extra 40 Mt of waste stripping is considered as a discretionary investment that could be reduced or deferred to a later date but is fully costed in this Technical Report.
Mine plans are updated on an annual basis or as required due to changing circumstances. Inferred resource blocks within the design pit have been treated as waste; however, experience suggests that a significant portion of the Inferred Mineral Resource material will be upgraded to Mineral Reserves, either with future exploration drilling or during production drilling. Similarly, within the later years of the mine plan, there will be times when low-grade stockpile material will be used as mill feed. Continued exploration may alleviate this situation, resulting in higher mill feed-grades and metal production.
Table 1-5: Copper Mountain LOM Mine Schedule-2024-2044
| Category |
Unit |
LOM Total/Avg. |
2024 |
2025 |
2026 |
2027 |
2028 |
2029-2033 |
2034-2038 |
2039-2044 |
| Ex-Pit Mining |
|
|
|
|
|
|
|
|
|
|
| Ore Mined from Pit |
kt |
312,425 |
18,983 |
22,363 |
14,020 |
20,710 |
21,096 |
102,055 |
92,300 |
20,898 |
| Waste Mined from Pit |
kt |
866,559 |
82,832 |
91,637 |
86,480 |
63,290 |
48,904 |
237,945 |
224,700 |
30,770 |
| Total Mined from Pit |
kt |
1,178,984 |
101,815 |
114,000 |
100,500 |
84,000 |
70,000 |
340,000 |
317,000 |
51,669 |
| Mined Stripping Ratio |
w:o |
2.8 |
4.4 |
4.1 |
6.2 |
3.1 |
2.3 |
2.3 |
2.4 |
1.5 |
| Stockpile Movement |
|
|
|
|
|
|
|
|
|
|
| High-Grade Stockpile Starting Balance |
kt |
- |
1,258 |
- |
- |
- |
- |
- |
- |
- |
| Material Mined to High-Grade Stockpile |
kt |
- |
0 |
- |
- |
- |
- |
- |
- |
- |
| Reclaimed to Mill from High-Grade Stockpile |
kt |
- |
1,258 |
- |
- |
- |
- |
- |
- |
- |
| High-Grade Stockpile Ending Balance |
kt |
- |
0 |
- |
- |
- |
- |
- |
- |
- |
| Low-Grade Stockpile Starting Balance |
kt |
- |
53,297 |
58,530 |
64,468 |
60,968 |
63,428 |
66,224 |
76,979 |
77,979 |
| Material Mined to Low-Grade Stockpile |
kt |
- |
6,160 |
5,938 |
0 |
2,460 |
2,796 |
10,755 |
1,000 |
0 |
| Reclaimed to Mill from Low-Grade Stockpile |
kt |
- |
927 |
0 |
3,500 |
0 |
0 |
0 |
0 |
77,979 |
| Low-Grade Stockpile Ending Balance |
kt |
- |
58,530 |
64,468 |
60,968 |
63,428 |
66,224 |
76,979 |
77,979 |
0 |
| Total Material Movement |
|
|
|
|
|
|
|
|
|
|
| Total Material Movement |
kt |
1,262,648 |
104,000 |
114,000 |
104,000 |
84,000 |
70,000 |
340,000 |
317,000 |
129,648 |
| Mill Feed |
|
|
|
|
|
|
|
|
|
|
| Mill Feed Tonnes |
kt |
366,980 |
15,008 |
16,425 |
17,520 |
18,250 |
18,300 |
91,300 |
91,300 |
98,877 |
| Copper Grade |
% Cu |
0.25 |
0.30 |
0.29 |
0.33 |
0.32 |
0.36 |
0.27 |
0.24 |
0.17 |
| Gold Grade |
g/t |
0.12 |
0.07 |
0.10 |
0.07 |
0.11 |
0.12 |
0.16 |
0.15 |
0.07 |
| Silver Grade |
g/t |
0.69 |
1.12 |
0.90 |
1.27 |
1.07 |
1.17 |
0.60 |
0.54 |
0.55 |
| Copper Recovery |
% |
85.7 |
82.5 |
84.0 |
84.0 |
85.6 |
85.5 |
86.7 |
86.4 |
85.1 |
| Gold Recovery |
% |
68.3 |
65.0 |
65.0 |
65.0 |
67.9 |
67.8 |
69.6 |
69.0 |
66.0 |
| Silver Recovery |
% |
68.5 |
70.0 |
70.0 |
70.0 |
69.2 |
69.2 |
66.5 |
67.1 |
69.6 |
| Recovered Metal |
|
|
|
|
|
|
|
|
|
|
| Copper |
Mlb |
1,726 |
82 |
88 |
108 |
111 |
124 |
475 |
425 |
313 |
| Gold |
koz |
935 |
21 |
36 |
26 |
44 |
47 |
321 |
302 |
138 |
| Silver |
koz |
5,590 |
378 |
334 |
500 |
434 |
477 |
1,174 |
1,067 |
1,225 |
Notes: LOM plan contains only Proven and Probable Mineral Reserves.
Inferred Mineral Resources are treated as waste.
Numbers may vary due to rounding.
1.14 Recovery Methods
The processing plant consists of a standard crush-grind-flotation circuit that operates two shifts 12 h/d, 365 d/a, with targeted plant availability of 92%. The process plant has an installed capacity of 45 kt/d process via a comminution circuit consisting of a primary and secondary crushing circuit reducing the feed to minus 40 mm ahead of a semi-autogenous grinding mill, ball mill, and pebble crusher grinding circuit further reducing the feed size to P80 150 µm.
The comminution circuit is followed by a sulphide flotation circuit that produces a copper-silver-gold concentrate. The flotation tailings are transported to the TMF unthickened via a gravity pipeline, with the sands and slime separation occurring on the TMF's dam walls via mobile cyclone units. The concentrate is dewatered via two pressure filters and stored on site before transport via truck to the Port of Vancouver for shipment to the final customers.
The process plant throughput is planned to be stabilized at 45 kt/d throughout 2024-2025, followed by an expansion to 50 kt/d by 2027 via minor capital upgrades targeted at removing process bottlenecks in the primary and secondary crushing circuits, enabling a finer product to be fed to the grinding circuit (Table 1-6). Adding new major equipment is not planned for this stage of debottlenecking.
Table 1-6: Production Ramp-Up Schedule
| Criteria |
Unit |
2024 |
2025 |
2026 |
2027 |
2028 |
| Throughput |
kt/d |
41.1 |
45.0 |
48.0 |
50.0 |
50.0 |
| t/oph |
1,861 |
2,038 |
2,174 |
2,264 |
2,264 |
| Cu Recovery |
% |
83 |
84 |
84 |
86 |
86 |
| Cu Concentrate Grade |
%Cu |
24 |
26 |
26 |
26 |
26 |
| Au Recovery |
% |
65 |
65 |
65 |
68 |
68 |
Note: t/oph = tonnes per operating hour.
1.15 CMM Infrastructure
The CMM was constructed between 2010 and mid-2011 on a site of previous mining activity; significant parts of the infrastructure were already in place, including power line, roads, water source, mine office building, and TMF. The key components required for the mine restart were a 35 kt/d concentrator processing facility, a power-line extension, new transformers and power distribution, a new freshwater booster station and piping to the new concentrator, new mine maintenance truck shop, and a fleet of open pit mining equipment.
Electricity is supplied from the BC Hydro Nicola substation near Merritt, along a 138 kV transmission line to the Similco Mines substation (SCO) that BC Hydro owns and maintains. The BC Hydro line can also supply power to the Princeton substation operated by FortisBC. The SCO, owned by Hudbay, supplies equipment operating on the west side of the Similkameen River, such as the freshwater pumps. A 3.3 km-long 138 kV line crossing the Similkameen River then runs from the SCO substation to the CMM substation at the CMM concentrator. This substation provides the required voltage step-downs to service all other equipment operating east of the Similkameen River.
Concentrator process water is recycled from the TMF pond, with additional make-up water pumped from the Similkameen River. Existing infrastructure installed to support the CMM operation also includes a complete 45 kt/d Cu-Au-Ag flotation plant and concentrate load-out facility; the current and historical pits and WRFs; a cyclone sand-dam TMF with seepage return pumping systems installed at the toe of the east and west dams; pumping stations; truck shop and warehouse facilities; potable and wastewater treatment facilities servicing the full allotment of operating and administration staff; laboratory; administration offices; and a 1 km trolley assist waste-hauling system.
1.16 Market Studies and Contracts
Global copper concentrate fundamentals are expected to be strong in the medium to longer term as smelters globally will seek to maximize metal production in an attempt to satisfy unprecedented demand driven by the green energy megatrend. Buyers are expected to compete aggressively for concentrate supply, exerting downward pressure on treatment charges, relative to current market conditions.
CMM concentrate quality is well established. It is a clean concentrate, attracting no penalties, and includes important by-product precious-metal credits.
Concentrate production is sold exclusively to MMC, a major Japanese smelting entity, pursuant to an offtake agreement that was entered into in connection with the joint venture. CMM incurs treatment and refining charges consistent with the global industry benchmark established by major miners and smelters
1.17 Environmental Studies, Permitting, and Social or Community Impacts
1.17.1 Permitting
Mining and processing at the CMM are authorized and regulated by three major permits (Table 1-7). Additionally, discharges from the mine site are governed by the federal Metal and Diamond Mining Effluent Regulations under the federal Fisheries Act. All permits have specific monitoring requirements, and general or specific discharge limits and characteristics.
Table 1-7: Major Permits at Copper Mountain Mine
| Permit |
Issued By |
Original Date of Issue |
Last Permit Amendment |
| B.C. Mines Act Permit M-29 |
B.C. Ministry of Energy, Mines and Petroleum Resources |
August 3, 1970 |
March 3, 2021 |
| Effluent Permit PE-261 |
B.C. Ministry of Environment and Climate Change Strategy |
February 3, 1969 |
March 17, 2022 |
| Air Emissions Permit PA-105340 |
B.C. Ministry of Environment |
October 3, 2011 |
January 18, 2016 |
The current B.C. Mines Act M-29 permit, issued and enforced by the B.C. Ministry of Energy, Mines, and Low Carbon Innovation (EMLI) authorizes the mine and reclamation plans, tailings, and WRFs, site roads, and water management. It also contains requirements for reclamation liabilities, closure-cost estimates, and associated reclamation bonding.
The major permits (Table 1-7) will require amendments based on the CMM LOM plan, but no federal authorizations are required. The New Ingerbelle Open Pit Push-Back and Mine Life Extension, which is part of the CMM LOM plan, is advancing through a joint coordination authorization process to amend the B.C. Mines Act (MA) and B.C. Environmental Management Act permits, through EMLI's Major Mines Office permit amendment process.
1.17.2 Environmental, Social Setting, and Community Engagement
The CMM biophysical setting includes relevant baseline studies, monitoring, and management plans for vegetation, wildlife and wildlife habitat, fish and aquatic resources, hydrology, hydrogeology, water quality, sediment, periphyton and benthic invertebrates, air quality, as well as greenhouse gas (GHG) and climate change.
Hudbay has strong support from local communities and the Town of Princeton. Transparent engagement and strong cooperative working relationships with all local communities are priorities for Hudbay. The CMM is within the Traditional Territory of the Smilq'mixw People as represented by the Upper Similkameen Indian Band (USIB), in Hedley, and the Lower Similkameen Indian Band (LSIB), in Cawston. Hudbay maintains a cooperative and respectful relationship with USIB and LSIB that is in keeping with the principles of economic sustainability, environmental stewardship, and self-determination in respect of Smilq'mixw Territory. Hudbay will continue engagement activities with USIB and LSIB on the New Ingerbelle development plan and for the TMF dam raise, specifically with involvement in environmental baseline studies, input of Indigenous Knowledge into design considerations, and review of basic engineering concepts.
1.17.3 Conceptual Mine Closure and Reclamation
A conceptual end land-use plan (ELUP) has been developed in collaboration with LSIB and USIB for the CMM. The conceptual ELUP serves as a guide for reclamation planning, progressive reclamation efforts, and research on site-throughout operations, as well as a tool for input from LSIB and USIB in developing a detailed ELUP. The detailed ELUP, once developed, will continue to be used to achieve the end land-use objectives and to identify challenges and solutions that can be addressed through recontouring, reclamation research, and reclamation implementation.
As required under Mines Act Permit M-29, Hudbay will develop and submit a detailed Closure Plan to EMLI for approval at least twelve months prior to final closure. Hudbay will also continue to engage First Nations, local communities, and regulatory agencies in focused consultation about closure and development of an appropriate and detailed mine closure plan that is responsive to First Nations and stakeholder concerns.
1.18 Capital and Operating Costs
1.18.1 Capital Costs
The LOM sustaining capital is estimated to be $731 million (excluding capitalized stripping) for the mine and the mill, while the mill stabilization and growth capital is estimated to be $167 million. Capitalized stripping represents $742 million over the LOM with an additional discretionary capitalized stripping project of $114 (Table 1-8).
The total capital cost includes expenses required for major mining equipment acquisition, rebuilds, and major repair. The cost also includes site infrastructure expansion (TMF, WRFs, and others) and process-plant infrastructure; however, the capital costs exclude all costs related to mine closure. Growth associated capital costs include New Ingerbelle development expenditures.
Table 1-8: Copper Mountain Mine-Summary of LOM Capital Cost ($ 000s)
| |
2024 |
2025 |
2026 |
2027 |
2028 |
2024-2028
Avg. |
2029-2033
Avg. |
2034-2038
Avg. |
2039-2043
Avg. |
LOM |
| Sustaining Capital |
|
|
|
|
|
|
|
|
|
|
| CMM and New Ingerbelle |
|
|
|
|
|
|
|
|
|
|
| Mine Equipment - New Trucks and Equipment |
- |
11,517 |
13,664 |
15,290 |
12,870 |
10,668 |
4,473 |
- |
- |
75,704 |
| Mine Equipment - Major Repair |
17,352 |
18,651 |
19,584 |
19,895 |
19,459 |
18,988 |
19,202 |
18,574 |
7,303 |
321,691 |
Mine Equipment - Equipment Leases
(Current Commitments) |
21,755 |
19,768 |
16,818 |
10,132 |
3,622 |
14,419 |
412 |
210 |
210 |
76,465 |
| Mine - Other |
3,375 |
3,325 |
3,325 |
3,325 |
3,325 |
3,335 |
3,325 |
3,325 |
2,261 |
61,363 |
| Plant |
12,704 |
7,680 |
4,380 |
4,563 |
4,575 |
6,780 |
4,565 |
4,565 |
4,565 |
104,271 |
| Plant - Stabilization |
698 |
14,947 |
5,167 |
- |
- |
4,162 |
- |
- |
- |
20,812 |
| TMF |
2,925 |
4,063 |
2,901 |
4,365 |
4,330 |
3,717 |
3,421 |
2,473 |
2,586 |
60,980 |
| Other |
3,139 |
4,400 |
- |
2,000 |
- |
1,908 |
- |
- |
- |
9,539 |
| Total (Before Capitalized Stripping) |
61,947 |
84,350 |
65,838 |
59,569 |
48,180 |
63,977 |
35,398 |
29,147 |
16,925 |
730,826 |
| Total (Before Capitalized Stripping) (US$ 000s) |
45,887 |
63,421 |
49,503 |
44,789 |
36,226 |
47,965 |
26,615 |
21,915 |
12,726 |
548,803 |
| Capitalized Stripping |
22,659 |
78,287 |
54,936 |
18,607 |
76,394 |
50,176 |
54,020 |
44,192 |
- |
741,940 |
| Discretionary Capitalized Stripping1 |
30,000 |
56,000 |
28,000 |
- |
- |
22,800 |
- |
- |
- |
114,000 |
| Total (After Capitalized Stripping) |
114,606 |
218,637 |
148,774 |
78,177 |
124,574 |
136,953 |
89,418 |
73,339 |
16,925 |
1,586,766 |
| Total (After Capitalized Stripping) (US$ 000s) |
84,893 |
164,389 |
111,860 |
58,779 |
93,665 |
102,717 |
67,231 |
55,142 |
12,726 |
1,191,780 |
| |
|
|
|
|
|
|
|
|
|
|
| Project Capital |
|
|
|
|
|
|
|
|
|
|
| Plant |
150 |
15,791 |
14,659 |
- |
- |
6,120 |
- |
- |
- |
30,600 |
| Mine |
3,453 |
38,736 |
77,638 |
7,673 |
9,103 |
27,321 |
- |
- |
- |
136,603 |
| Total Project Capital |
3,603 |
54,527 |
92,297 |
7,673 |
9,103 |
33,441 |
- |
- |
- |
167,203 |
| Total Project Capital (US$ 000s) |
2,669 |
40,997 |
69,397 |
5,769 |
6,844 |
25,135 |
- |
- |
- |
125,676 |
| |
|
|
|
|
|
|
|
|
|
|
Total Sustaining and Project Capital
(Before Capitalized Stripping) |
65,550 |
138,877 |
158,135 |
67,242 |
57,283 |
97,418 |
35,398 |
29,147 |
16,925 |
898,029 |
Total Sustaining and Project Capital
(After Capitalized Stripping) |
118,209 |
273,164 |
241,071 |
85,850 |
133,677 |
170,394 |
89,418 |
73,339 |
16,925 |
1,753,969 |
Total Sustaining and Project Capital
(Before Capitalized Stripping) (US$ 000s) |
48,556 |
104,418 |
118,900 |
50,558 |
43,070 |
73,100 |
26,615 |
21,915 |
12,726 |
674,479 |
Total Sustaining and Project Capital
(After Capitalized Stripping) (US$ 000s) |
87,562 |
205,386 |
181,257 |
64,548 |
100,509 |
127,852 |
67,231 |
55,142 |
12,726 |
1,317,456 |
Notes: 1 Discretionary capitalized stripping relates to a portion of accelerated stripping activities over 2024-2026 to access higher grade ore but could be reduced or deferred to a later date based on further geotechnical evaluation and other considerations.
1.18.2 Operating Costs
The average cost per tonne milled is shown in Table 1-9, with all assumptions in place for the mining and milling of an integrated mine plan. The mine cost includes all mining costs for rehandling existing mineralized stockpiles to feed the concentrator.
Table 1-9: Copper Mountain Mine-Summary of LOM Operating Costs ($/t)
| |
2024 |
2025 |
2026 |
2027 |
2028 |
2024-2028
Avg. |
2029-2033
Avg. |
2034-2038
Avg. |
2039-2043
Avg. |
LOM |
| Unit Costs |
|
|
|
|
|
|
|
|
|
|
| Mining |
15.30 |
16.33 |
13.84 |
12.06 |
11.92 |
13.78 |
11.73 |
11.32 |
4.82 |
10.21 |
| Milling |
7.41 |
6.77 |
5.94 |
5.70 |
5.69 |
6.25 |
5.70 |
5.70 |
5.70 |
5.85 |
| G&A |
1.48 |
1.35 |
1.27 |
1.22 |
1.18 |
1.29 |
1.17 |
1.14 |
0.87 |
1.13 |
Total Operating Costs
(Before Capitalized Stripping) |
24.19 |
24.45 |
21.05 |
18.98 |
18.79 |
21.32 |
18.60 |
18.16 |
11.39 |
17.19 |
Total Operating Costs
(After Capitalized Stripping) |
20.68 |
16.27 |
16.31 |
17.96 |
14.61 |
17.06 |
15.64 |
15.73 |
11.39 |
14.86 |
Cash costs and sustaining cash costs per pound of copper are summarized in Table 1-10. Cash costs include mining, milling G&A, off-site costs, and treatment and refining charges. Sustaining cash costs also include both sustaining capital and lease payments (but exclude any growth capital related to mill expansion and New Ingerbelle). Both cash costs and sustaining cash costs include the impact of capitalized stripping and are reported net of by-product credits.
Table 1-10: Operating Costs and Sustaining Costs per Pound (US$/lb)
| |
2024 |
2025 |
2026 |
2027 |
2028 |
2024-2028
Avg. |
2029-2033
Avg. |
2034-2038
Avg. |
2039-2043
Avg. |
LOM |
| Cash Costs |
2.69 |
1.89 |
1.89 |
1.90 |
1.36 |
1.89 |
1.53 |
1.75 |
2.31 |
1.84 |
Sustaining Cash Costs
(Excl. discretionary stripping) |
3.49 |
3.40 |
2.74 |
2.45 |
2.13 |
2.76 |
2.26 |
2.46 |
2.58 |
2.53 |
Sustaining Cash Costs
(Incl. discretionary stripping) |
3.77 |
3.87 |
2.94 |
2.45 |
2.13 |
2.93 |
2.26 |
2.46 |
2.58 |
2.58 |
Notes: Cash cost and sustaining cash cost, net of by-product credits per pound of copper contained in concentrate. By-product credits are calculated using the following commodity prices:
Gold: US$1,940/oz for 2024, US$1,900/oz for 2025, US$1,800/oz for 2026, US$1,764/oz for 2027, US$1,725/oz for 2028, and
US$1,700/oz long term.
Silver: US$24.00/oz for 2024-2026, US$23.75/oz for 2027, US$23.38/oz for 2028, and US$23.00/oz long term.
Discretionary capitalized stripping relates to a portion of accelerated stripping activities over 2024-2026 to access higher grade ore but could be reduced or deferred to a later date based on further geotechnical evaluation and other considerations.
1.19 Economic Analysis
Pursuant to NI 43-101, producing issuers may exclude the information required for economic analysis on properties in production, unless the technical report includes a material expansion of current production. As Hudbay is a producing issuer, it has excluded information required by Item 22 of Form 43-101F1.
1.20 Conclusions
The CMM has been in continuous operation since restarting commercial production in 2011. The mine has continually improved its performance indicators and is expected to achieve the projected throughput and forecast results as outlined in this report, producing copper saleable concentrates. The Mineral Resource and Mineral Reserve estimates are compliant with industry best practices as outlined in the Canadian Institute of Mining, Metallurgy and Petroleum's (CIM) CIM Definition Standards for Mineral Resources & Mineral Reserves (CIM, 2014, May 19).
Thorough reconciliations from Mineral Reserve estimates to mill-credited production will continue to be closely monitored in order to continue to validate the performance of the reserve model.
Other than the risks described in this Technical Report, the other risk factors described in Hudbay's most recent annual information form dated March 29, 2023, and management's discussion and analysis for the three and nine months ended September 30, 2023, there are no known significant risks and uncertainties that could reasonably be expected to materially affect the potential development of the Mineral Reserve and Mineral Resource estimates in this Technical Report.
1.21 Recommendations
The CMM deposits are still open at depth and the Mineral Resource estimates include a significant proportion of high-grade mineralization in the Inferred category at an expected strip ratio close to the current LOM plan that offers many opportunities to improve the profitability of the operation and to extend the life of the operation beyond the mine plan presented in this report, based solely on Proven and Probable Mineral Reserve estimates. There are also several studies that Hudbay has scoped or initiated to materialize opportunities to improve the LOM presented in this Technical Report. Studies that are not at a sufficient level of maturity to be incorporated in this Technical Report in compliance with NI 43-101 include:
- Carrying out geotechnical investigations along the south wall of Pit 3 to identify opportunities to maximize the use of double benching and reduce waste stripping
- Continuing infill drilling programs and open pit optimization to convert inferred mineral resource to mineral reserve estimates in the CM North Pit and at New Ingerbelle
- Conducting additional technical and economic trade-off studies to reduce ore and waste transportation by diesel trucks in an effort to reduce mining costs, improve mining productivity, and reduce GHGs
- Metallurgical testing and simulations to refine the forecast model for mill throughput and metals and continue process optimization
- Installing a mast for collecting real-time wind data, to evaluate site renewable-energy generation.
In parallel, ongoing work should continue in the following areas:
- Thorough reconciliations from Mineral Reserve estimates to mill-credited production continuing to be closely monitored in order to continue to validate the performance of the new reserve model
- Continue with the TMF Engineer of Record's construction engineering guidance to confirm the annual construction plan for increasing the existing tailings impoundment capacity
- Continuing with environmental baseline studies and environmental monitoring to support permit amendments
- Continuing to engage with communities of interest and First Nations.
2 Introduction
This Technical Report has been prepared for Hudbay Minerals Inc. (Hudbay) to support the public disclosure of Mineral Resources and Mineral Reserves at the Copper Mountain Mine (CMM) as of December 1, 2023.
Hudbay acquired Copper Mountain Mining Corporation (CMMC) in June 2023 and indirectly holds a 75% interest in Copper Mountain Mine (BC) Ltd. (CMML) and the CMM. The remaining 25% interest in CMML and the CMM is held by Mitsubishi Materials Corp. (MMC).
Hudbay is an integrated Canadian mining company with assets in North and South America principally focused on the discovery, production, and marketing of base and precious metals. Hudbay's objective is to maximize shareholder value through efficient operations, organic growth, and accretive acquisitions, while maintaining its financial strength.
Hudbay's operations at CMM include the Copper Mountain Pits 2, 3, and North, and the New Ingerbelle Pit, a processing plant, waste rock facilities (WRF), a tailings management facility (TMF) and other ancillary facilities that support the operations.
At the date of this Technical Report, CMM is in steady production. Following the acquisition of the dormant asset by Copper Mountain Mining Corporation in January 2007, the mining and concentrator operations were restarted in May 2011 and expanded with the installation of the secondary crusher in August 2014, and the operations has continued without interruption since then.
Unless the context suggests otherwise, references to "Hudbay" refer to Hudbay Minerals Inc. and its direct and indirect subsidiaries, including but without limitation, CMML.
2.1 Qualified Person
This Technical Report has been prepared in accordance with National Instrument (NI) Form 43-101 F1. The Qualified Person (QP) who supervised the preparation of this Technical Report is Olivier Tavchandjian, P.Geo., Senior Vice-President, Exploration and Technical Services of Hudbay.
Olivier Tavchandjian is not independent of Hudbay, and this is not an independent technical report, but Hudbay is a "producing issuer" as defined in NI 43-101. As such, this Technical Report is not required to be prepared by or under the supervision of an independent QP.
Mr. Tavchandjian has been directly involved on a regular basis with the exploration, geology, resource-modelling, mine planning, and estimation of operating and capital costs for the CMM and the New Ingerbelle deposit since Hudbay's acquisition of these assets in June 2023. Mr. Tavchandjian has visited the operation on a regular basis since July 2022, as well as the core storage facilities, and has directly overseen the Mineral Resource and Mineral Reserve estimation process.
2.2 Source of Information
Geology and Mineral Resource estimation sources of information are: drilling log and sample data, blasthole sample data, and in-pit geology mapping.
Mineral Reserve sources of information are the Mineral Resources, actual production, and budget projections.
Metallurgy, processing, and economic sources of information are the actual operating data acquired since copper production commenced in 2014, and operating budget estimates.
All other relevant information has been updated with information or reports provided and translated by senior site personnel.
Multiple participants have worked on this Technical Report. Discussions were held with personnel from Hudbay and CMM. The QP relied upon additional senior Hudbay personnel who were also involved in preparing this document: Matt Taylor (Vice President Metallurgy Services), Javier Toro (Vice President Mining Services), Richard Klue (Vice President Engineering Studies), and Jon Douglas (Vice President and Treasurer), as listed in Section 3.
2.3 Unit of Measure Abbreviations Used in Report
Units of measurement used in this report conform to the International System of Units (metric system), apart from some equipment sizes given in imperial units. All currency is in Canadian dollars ($) unless otherwise noted.
| Definition |
Acronyms |
| Canadian Institute of Mining, Metallurgy and Petroleum |
CIM |
| Copper Mountain Mine |
CMM or the mine |
| Copper Mountain Mine (BC) Ltd |
CMML |
|
Granby Consolidated Mining, Smelting and Power Company
|
Granby |
Hudbay Minerals Inc. and its direct and indirect subsidiaries
(unless the context suggests otherwise) |
Hudbay |
| Life-of-mine |
LOM |
| National Instrument 43-101 |
NI 43-101 |
| Pre-feasibility Study |
PFS |
| Tailings Management Facility |
TMF |
3 Reliance on Other Experts
The information, conclusions, opinions, and estimates contained herein are based on:
-
Information available to Hudbay at the time of preparation of this Technical Report
-
Assumptions, conditions, and qualifications as set forth in this Technical Report.
In accordance with NI 43-101 guidelines, the QP responsible for this Technical Report is Mr. Olivier Tavchandjian, Senior Vice President, Exploration and Technical Services of Hudbay.
Table 3-1 lists the Hudbay vice presidents involved in preparing this Technical Report.
Table 3-1: Reliance on Other Experts
|
Section
|
Description
|
Relied Upon
|
|
1
|
Summary
|
OT
|
|
2
|
Introduction
|
OT
|
|
3
|
Reliance on Other Experts
|
OT
|
|
4
|
Property Description and Location
|
RK
|
|
5
|
Accessibility, Climate, Local Resources, Infrastructure, and Physiography
|
RK
|
|
6
|
History
|
RK
|
|
7
|
Geological Setting and Mineralization
|
OT
|
|
8
|
Deposit Types
|
OT
|
|
9
|
Exploration
|
OT
|
|
10
|
Drilling
|
OT
|
|
11
|
Sample Preparation, Analyses, and Security
|
OT
|
|
12
|
Data Verification
|
OT
|
|
13
|
Mineral Processing and Metallurgical Testing
|
MT
|
|
14
|
Mineral Resource Estimates
|
OT
|
|
15
|
Mineral Reserve Estimates
|
JT
|
|
16
|
Mining Methods
|
JT
|
|
17
|
Recovery Methods
|
MT
|
|
18
|
Infrastructure
|
RK
|
|
19
|
Market Studies and Contracts
|
JD
|
|
20
|
Environmental Studies, Permitting, and Social or Community Impact
|
RK
|
|
21
|
Capital and Operating Costs
|
JT, MT, OT
|
|
22
|
Economic Analysis
|
OT
|
|
23
|
Adjacent Properties
|
OT
|
|
24
|
Other Relevant Data and Information
|
OT
|
|
25
|
Interpretation and Conclusions
|
OT
|
|
26
|
Recommendations
|
OT
|
|
27
|
References, Abbreviations, and Units of Measure
|
RK
|
Notes: JD = Jon Douglas (VP Treasurer); JT = Javier Toro (VP Mining); MT = Matt Taylor (VP Metallurgy); OT = Olivier Tavchandjian (Senior VP, Exploration and Technical Services); RK = Richard Klue (VP Engineering Studies).
4 Property Description and Location
4.1 Location
The CMM lies in southern British Columbia (B.C.) at latitude 49°20′ N, longitude 120°31′ W, 21 km by road south of Princeton and 304 km by road east of Vancouver (Figure 4-1). The property consists of 126 Crown-granted mineral claims, 157 located mineral claims, 14 mining leases and 12 fee simple properties covering an area of 8,989 ha (89.9 km2).
Figure 4-1: Copper Mountain Mine Location

4.2 Land Use, Mineral Tenure, and Surface Rights
The mine has a B.C. Mining Permit (M-29) and is operated in accordance with government regulations. All permits are in good standing. Envirogreen Technologies Ltd. (Envirogreen), a soil remediation company, operates on the Lela Crown Grant near the historical Ingerbelle Pit area, thermally remediating hydrocarbon-contaminated soils to produce inert soils. Their facility and materials are stored on the Lela claim. The New Ingerbelle Pit development will impact a small portion of the Lela claim. Hudbay has a right to have the Lela claim and certain other mineral claims that it optioned to Envirogreen reconveyed to it in exchange for replacement properties. Hudbay and Envirogreen are in discussions to reach an agreement on this matter.
In 2019, Arrow Transportation purchased the compost facility and associated licenses of occupation on the Ingerbelle WRF from Highline Mushrooms (formerly Gro-well Enterprises) with the intent to compost green waste and produce a Class A Compost. Hudbay and Arrow Environmental have entered into an agreement that supports Arrow's continued operation of their facility and Hudbay's planned development of New Ingerbelle.
The earliest type of tenure at Copper Mountain was in the form of Crown granted mineral claims that covered both the historical underground and open pit mining areas on the eastern side of the Similkameen River (Table 4-1). Mineral claims surround the crown grants and subsequent mining leases exist in the northeast and southern areas of the claim block.
All tenure is currently in good standing-physical work completed in 2023 that includes a large ground geophysical survey and geological mapping will be applied as assessment work and will assist in pushing current mineral claim expiry dates beyond 2024 and 2025.
Figure 4-2 shows the property tenure, and Table 4-1, Table 4-2, and Table 4-3 contain the list of Crown grants, mineral claims, and mining leases, respectively.
Section A.3 (a) of Mines Act Permit M-29 (March 3, 2021) authorizes mine-related development, including surface disturbance and works, plus a management buffer around the approved disturbance, within a defined, permitted mine area. The mine site and most of the surrounding region for a considerable distance have been heavily logged in the past, including the areas undisturbed by mining that are proposed to be disturbed as part of the current development plan. Much of the Ingerbelle side of the property has been cleared in conjunction with previous mining activity.
Figure 4-2: Copper Mountain Mine Land Tenure

Table 4-1: Crown Grants
|
|
PID No.
|
Lot No.
|
Name
|
|
PID No.
|
Lot No.
|
Name
|
|
PID No.
|
Lot No.
|
Name
|
|
1
|
011-483-814
|
835
|
Ada B
|
51
|
011-483-709
|
385S
|
Lone Star Fraction
|
101
|
011-466-294
|
635S
|
Tin Cup
|
|
2
|
011-493-372
|
839
|
Ada B Fraction
|
52
|
011-457-163
|
3024
|
Mabel Fraction
|
102
|
011-457-139
|
3026
|
Tinhorn Fraction
|
|
3
|
011-464-275
|
386S
|
Adelaide Fraction
|
53
|
011-468-696
|
2580S
|
Malone Fraction
|
103
|
011-469-455
|
3534
|
Transvaal Fraction
|
|
4
|
011-455-497
|
2429
|
Alabama
|
54
|
011-457-074
|
3025
|
Milo Fraction
|
104
|
011-458-356
|
1832
|
Triangle Fraction
|
|
5
|
011-457-180
|
787
|
Annie L.
|
55
|
011-455-594
|
255
|
Mogul
|
105
|
011-483-989
|
123A
|
Vancouver
|
|
6
|
011-458-283
|
1775S
|
Automatic Fraction
|
56
|
011-457-228
|
256
|
Mogul Fraction
|
106
|
001-567-403
|
1295
|
Vancouver
|
|
7
|
011-483-920
|
420A
|
Bell Fraction
|
57
|
011-484-039
|
2268S
|
Mooney
|
107
|
011-455-021
|
1295
|
Vancouver
|
|
8
|
011-464-976
|
419S
|
Blue Bird
|
58
|
011-458-291
|
1778S
|
Nelson Fraction
|
108
|
011-467-231
|
1790S
|
Vera Fraction
|
|
9
|
011-463-911
|
280
|
Boanite
|
59
|
011-464-143
|
382S
|
Nero Fraction
|
109
|
011-455-501
|
2428
|
Virginia
|
|
10
|
011-463-775
|
236
|
Brooklyn
|
60
|
011-467-142
|
1776S
|
New No. 37 Fraction
|
110
|
011-458-259
|
943S
|
W.G. Fraction
|
|
11
|
011-455-730
|
2270S
|
Casino No. 1 Fraction
|
61
|
011-465-778
|
1777S
|
New Wolf Fraction
|
111
|
011-465-794
|
474S
|
Cabin
|
|
12
|
011-457-198
|
840
|
Centre Star Fraction
|
62
|
011-469-510
|
3349
|
No. 1
|
112
|
011-465-891
|
476S
|
Colorado Fraction
|
|
13
|
011-458-631
|
1833
|
Copper Bench
|
63
|
011-469-544
|
3289
|
No. 14
|
113
|
011-463-082
|
135
|
Columbia Fraction
|
|
14
|
011-467-967
|
1940
|
Copper Bluff
|
64
|
011-466-219
|
1598S
|
No. 15 Fraction
|
114
|
011-463-732
|
231
|
Fraser
|
|
15
|
011-467-843
|
1939
|
Copper Cliff
|
65
|
011-469-579
|
3288
|
No. 18
|
115
|
011-463-619
|
234
|
Ingersoll Belle
|
|
16
|
011-451-254
|
122A
|
Copper Farm
|
66
|
011-468-564
|
2256S
|
No. 18 Fraction
|
116
|
011-463-759
|
235
|
Magnetic
|
|
17
|
011-458-267
|
122A
|
Copper Farm
|
67
|
011-466-073
|
480S
|
No. 27 Fraction
|
117
|
011-466-057
|
479S
|
No 26 Fraction
|
|
18
|
011-458-402
|
1831
|
Copper King
|
68
|
011-469-480
|
3359
|
No. 33
|
118
|
011-465-972
|
477S
|
No 6 Fraction
|
|
19
|
011-464-640
|
403
|
Copper King
|
69
|
011-469-498
|
3354
|
No. 5
|
119
|
011-466-006
|
478S
|
No. 7 Fraction
|
|
20
|
011-454-431
|
1830
|
Copper Reef
|
70
|
011-464-895
|
417S
|
No. 50 Fraction
|
120
|
011-463-074
|
133
|
Nubian Fraction
|
|
211
|
011-454-814
|
816
|
Daisy
|
71
|
011-464-780
|
413S
|
No. 51 Fraction
|
121
|
011-463-791
|
238
|
Red Butte Fraction
|
|
22
|
011-469-200
|
3265
|
Diamond Dot
|
72
|
011-464-836
|
414S
|
No. 52
|
122
|
011-468-343
|
2046
|
Rifle
|
|
23
|
011-457-121
|
384S
|
Dividend
|
73
|
011-464-941
|
418S
|
No. 53
|
123
|
011-469-005
|
3187S
|
May Fraction
|
|
24
|
011-462-680
|
63S
|
Duke of York
|
74
|
011-462-647
|
61S
|
No. 69
|
124
|
011-465-867
|
475S
|
Frieda
|
|
25
|
011-466-146
|
481S
|
Edward Fraction
|
75
|
011-462-655
|
62S
|
No. 70
|
125
|
011-464-615
|
402
|
Key West
|
|
26
|
011-464-852
|
416S
|
Falum
|
76
|
011-464-801
|
415S
|
No. 71
|
126
|
011-459-204
|
3572
|
|
|
27
|
011-463-376
|
226
|
Fraser Fraction
|
77
|
011-465-018
|
443S
|
No. 73 Fraction
|
127
|
011-457-279
|
3573
|
Smelter
|
|
28
|
011-455-527
|
2430
|
Frisco
|
78
|
011-455-551
|
3357
|
R.S.
|
128
|
011-458-917
|
2254S
|
New No. 61
|
|
29
|
011-454-482
|
2050
|
Great Republic
|
79
|
011-469-021
|
3262
|
Olympia
|
129
|
011-466-715
|
1596S
|
No 63A
|
|
30
|
011-463-988
|
322S
|
Great Western Fraction
|
80*
|
011-454-636
|
808
|
Oriole
|
130
|
011-466-391
|
1595S
|
New 62A
|
|
31
|
011-463-058
|
127
|
Hamilton
|
81
|
011-468-424
|
2158S
|
Oronoco
|
131
|
011-459-522
|
2572S
|
Zapata 1 Fraction
|
|
32
|
011-457-155
|
120A
|
Helen H. Gardner
|
82
|
011-455-586
|
250
|
Peerless Fraction
|
132
|
011-458-437
|
2164S
|
No. 60B
|
|
33
|
011-454-571
|
3537
|
Holdfast
|
83
|
011-456-329
|
2248S
|
Princess Caroline Fraction
|
133
|
011-462-612
|
52S
|
Zapata No. 1 Fraction
|
|
341
|
017-236-274
|
121A
|
Humbolt
|
84
|
011-456-078
|
2282S
|
Princess Dorthia No. 1
|
134
|
011-462-639
|
53S
|
No 63A
|
|
35
|
001-701-819
|
1294
|
Home Rule
|
85
|
011-456-370
|
2271S
|
Princess Helen No. 1
|
135
|
011-458-232
|
424
|
|
|
36
|
011-454-946
|
1294
|
Home Rule
|
86
|
011-456-264
|
2273S
|
Princess Louise
|
136
|
011-450-916
|
118S
|
|
|
37
|
011-469-048
|
3263
|
Honey Suckle
|
87
|
011-483-873
|
1837
|
Princess Maud
|
137
|
011-451-394
|
251S
|
|
|
38
|
011-468-378
|
2047
|
I.X.L.
|
88
|
011-467-690
|
1829
|
Princess May
|
138
|
011-458-160
|
423
|
|
|
39
|
011-454-695
|
813
|
Iron Mask
|
89
|
011-467-444
|
1829
|
Princess May
|
139
|
011-457-309
|
|
|
|
40
|
011-454-601
|
810
|
Jennie Silkman
|
90
|
011-455-641
|
153
|
Princeton
|
140
|
011-451-548
|
|
|
|
41
|
011-456-345
|
2269S
|
Jessie
|
91
|
011-455-551
|
3357
|
R.S.
|
141
|
011-450-819
|
|
|
|
42
|
011-455-489
|
814
|
Jubilee #2
|
92
|
011-463-864
|
279
|
Red Buck
|
|
|
|
|
|
431
|
011-468-840
|
3028
|
Kenley
|
93
|
011-451-319
|
149
|
Red Eagle
|
|
|
|
|
|
44
|
011-468-904
|
3029
|
June Bug
|
94
|
011-455-578
|
3568
|
Robert Bryant
|
|
|
|
|
|
45
|
011-454-679
|
809
|
King Soloman
|
95
|
011-463-007
|
66S
|
Silver Dollar
|
|
|
|
|
|
461
|
011-454-750
|
378S
|
Klondike
|
96
|
011-454-652
|
811
|
Spider Fraction
|
|
|
|
|
|
47
|
011-455-659
|
233
|
Lareine
|
97
|
011-464-127
|
369S
|
Sunlight
|
|
|
|
|
|
48
|
011-484-829
|
2281S
|
Leon
|
98
|
011-458-798
|
3023
|
Sunrise
|
|
|
|
|
|
49
|
011-464-224
|
383S
|
Little Gem Fraction
|
99
|
011-457-058
|
1077
|
Sunset
|
|
|
|
|
|
501
|
011-454-865
|
1935
|
Lone Star
|
100
|
011-455-683
|
251
|
Tempest Fraction
|
|
|
|
|
Notes: 1 Partial Ownership. Grant 21- 50% Bertha May Foss/50% CMM BC Ltd; Grant 34-25% Charles and Alice Cooper/75% CMM BC Ltd; Grant 43-79.5% CMM BC Ltd; Grant 46-25% William Wheeler/75% CMM BC Ltd; Grant 50-25% Sydney Johnson/25% Bertha May Ross/50% CMM BC Ltd; Grant 80-6.25% Doug French & David O Day/93.75% CMM BC Ltd.
Table 4-2: Mineral Claims
|
|
Title
Number
|
Claim Name
|
Good To
Date
|
Area
(ha)
|
|
Title
Number
|
Claim Name
|
Good To
Date
|
Area
(ha)
|
|
Title
Number
|
Claim Name
|
Good To
Date
|
Area
(ha)
|
|
Title
Number
|
Claim
Name
|
Good To
Date
|
Area
(ha)
|
|
1
|
248598
|
ROAD
|
2027/NOV/30
|
75.0
|
51
|
250177
|
ELEPHANT NO. 2 FR.
|
2028/APR/26
|
25.0
|
101
|
250244
|
MCB #1
|
2028/APR/26
|
25.0
|
151
|
1092456
|
EXT WEST 2
|
2025/FEB/09
|
147.29
|
|
2
|
248603
|
SIMCOL #1 FR.
|
2028/NOV/30
|
25.0
|
52
|
250178
|
ELEPHANT NO. 3
|
2028/APR/26
|
25.0
|
102
|
250245
|
MCB #2
|
2028/APR/26
|
25.0
|
152
|
1092473
|
YOSHI TRIO
|
2025/FEB/09
|
189.39
|
|
3
|
248604
|
SIMCOL #2 FR.
|
2028/NOV/30
|
25.0
|
53
|
250179
|
ELEPHANT NO. 4
|
2028/APR/26
|
25.0
|
103
|
250246
|
MCB #3
|
2025/APR/26
|
25.0
|
153
|
1092582
|
WEST EXT 3
|
2025/FEB/09
|
42.08
|
|
4
|
248605
|
SIMCOL #10
|
2026/NOV/30
|
100.0
|
54
|
250182
|
"E.M." FR
|
2028/APR/26
|
25.0
|
104
|
250247
|
MCB #4
|
2025/APR/26
|
25.0
|
154
|
1095841
|
INGER 1
|
2024/MAY/30
|
63.14
|
|
5
|
248606
|
SIMCOL #11
|
2028/NOV/30
|
25.0
|
55
|
250185
|
"BEM" NO.1
|
2028/APR/26
|
25.0
|
105
|
250248
|
MCB #5
|
2025/APR/26
|
25.0
|
155
|
1095842
|
INGER 2
|
2024/MAY/30
|
84.2
|
|
6
|
248609
|
NEWMIN #1
|
2026/JAN/30
|
500.0
|
56
|
250186
|
"BEM" NO.3
|
2028/APR/26
|
25.0
|
106
|
250249
|
MCB #6
|
2025/APR/26
|
25.0
|
156
|
1095869
|
INGER 3
|
2024/MAY/31
|
21.05
|
|
7
|
248610
|
NEWMIN #2
|
2026/JAN/30
|
400.0
|
57
|
250187
|
"BEM" NO.5
|
2028/APR/26
|
25.0
|
107
|
250250
|
DEEP #1
|
2025/APR/26
|
25.0
|
157
|
1097616
|
WEST EXT 4
|
2025/FEB/09
|
84.17
|
|
8
|
248626
|
NEWMIN #3
|
2027/JAN/30
|
225.0
|
58
|
250188
|
"BEM" NO.7
|
2028/APR/26
|
25.0
|
108
|
250251
|
DEEP #2
|
2025/APR/26
|
25.0
|
158
|
1103113
|
WILD WEST
|
2024/MAR/16
|
1,136.61
|
|
9
|
248627
|
NEWMIN #4
|
2028/NOV/30
|
50.0
|
59
|
250195
|
RAD NO.1
|
2028/JAN/15
|
25.0
|
109
|
250252
|
DEEP #3
|
2025/APR/26
|
25.0
|
159
|
1106800
|
Wild South
|
2024/AUG/15
|
927.1
|
|
10
|
248628
|
NEWMIN #5
|
2027/NOV/30
|
75.0
|
60
|
250196
|
RAD NO.2
|
2028/JAN/15
|
25.0
|
110
|
250253
|
DEEP #4
|
2025/APR/26
|
25.0
|
|
|
|
|
|
|
11
|
248640
|
DOT FR
|
2028/APR/26
|
25.0
|
61
|
250197
|
RAD NO.3
|
2029/APR/26
|
25.0
|
111
|
250254
|
DEEP #5
|
2025/APR/26
|
25.0
|
|
|
|
|
|
|
12
|
248723
|
ALPINE #1
|
2028/APR/26
|
75.0
|
62
|
250198
|
RAD NO.4
|
2028/APR/26
|
25.0
|
112
|
250255
|
DEEP #6
|
2025/APR/26
|
25.0
|
|
|
|
|
|
|
13
|
248724
|
ALPINE FR.
|
2028/APR/26
|
25.0
|
63
|
250199
|
RAD NO.5
|
2028/APR/26
|
25.0
|
113
|
250256
|
DEEP #7
|
2025/APR/26
|
25.0
|
|
|
|
|
|
|
14
|
248778
|
BULLET #1 FR.
|
2028/APR/26
|
25.0
|
64
|
250200
|
RAD NO.6
|
2028/APR/26
|
25.0
|
114
|
250257
|
DEEP #8
|
2025/APR/26
|
25.0
|
|
|
|
|
|
|
15
|
248779
|
BULLET #2 FR.
|
2028/APR/26
|
25.0
|
65
|
250201
|
RAD NO.7
|
2028/APR/26
|
25.0
|
115
|
250258
|
DEEP #9
|
2025/APR/26
|
25.0
|
|
|
|
|
|
|
16
|
248782
|
REFER TO LOT TABLE
|
2028/OCT/26
|
25.0
|
66
|
250202
|
RAD NO.8
|
2028/APR/26
|
25.0
|
116
|
250259
|
DEEP #10
|
2025/APR/26
|
25.0
|
|
|
|
|
|
|
17
|
248783
|
NM #1 FR.
|
2028/OCT/26
|
25.0
|
67
|
250204
|
RAD NO.10
|
2028/APR/26
|
25.0
|
117
|
250260
|
AF 13
|
2025/NOV/30
|
25.0
|
|
|
|
|
|
|
18
|
248784
|
NM #2 FR.
|
2028/APR/26
|
25.0
|
68
|
250205
|
BRIAN H. FR.
|
2028/NOV/26
|
25.0
|
118
|
250261
|
AF 14
|
2025/NOV/30
|
25.0
|
|
|
|
|
|
|
19
|
248785
|
NM #3 FR.
|
2028/APR/26
|
25.0
|
69
|
250206
|
SER #3
|
2028/APR/26
|
25.0
|
119
|
250262
|
FRIEDA FR
|
2025/APR/26
|
25.0
|
|
|
|
|
|
|
20
|
248786
|
NM #4 FRACTION
|
2028/APR/26
|
25.0
|
70
|
250207
|
SER #4
|
2028/APR/26
|
25.0
|
120
|
250268
|
ANNIE FR.
|
2025/APR/26
|
25.0
|
|
|
|
|
|
|
211
|
248787
|
NM #5 FR.
|
2028/APR/26
|
25.0
|
71
|
250208
|
SER #5
|
2028/APR/26
|
25.0
|
121
|
250269
|
RAD #1 FR.
|
2025/APR/26
|
25.0
|
|
|
|
|
|
|
22
|
248788
|
NM #6 FR.
|
2028/OCT/26
|
25.0
|
72
|
250209
|
SER #6
|
2028/APR/26
|
25.0
|
122
|
250270
|
BETH #1 FR
|
2025/APR/26
|
25.0
|
|
|
|
|
|
|
23
|
248809
|
LAN NO.1
|
2028/NOV/30
|
50.0
|
73
|
250210
|
SER #7
|
2028/APR/26
|
25.0
|
123
|
250271
|
BETH #2 FR
|
2025/APR/26
|
25.0
|
|
|
|
|
|
|
24
|
248810
|
LAN NO.2
|
2028/NOV/30
|
25.0
|
74
|
250211
|
SER #8
|
2028/APR/26
|
25.0
|
124
|
250272
|
BETH #3 FR
|
2025/APR/26
|
25.0
|
|
|
|
|
|
|
25
|
248811
|
LAN NO.3
|
2028/NOV/30
|
150.0
|
75
|
250212
|
SER #9
|
2028/APR/26
|
25.0
|
125
|
250273
|
BETH #5 FR
|
2025/JAN/15
|
25.0
|
|
|
|
|
|
|
26
|
248812
|
LAN NO.4
|
2027/NOV/30
|
100.0
|
76
|
250213
|
SER #10
|
2028/APR/26
|
25.0
|
126
|
250274
|
BETH #4 FR
|
2025/JAN/15
|
25.0
|
|
|
|
|
|
|
27
|
248813
|
LAN NO.5
|
2027/NOV/30
|
50.0
|
77
|
250214
|
SER #11
|
2028/APR/26
|
25.0
|
127
|
250275
|
BETH #6 FR
|
2025/APR/26
|
25.0
|
|
|
|
|
|
|
28
|
248814
|
LAN NO.6
|
2028/NOV/30
|
50.0
|
78
|
250215
|
SER #12
|
2028/APR/26
|
25.0
|
128
|
250276
|
BETH #7 FR
|
2025/APR/26
|
25.0
|
|
|
|
|
|
|
29
|
248815
|
LAN NO.7
|
2028/NOV/30
|
50.0
|
79
|
250216
|
SER #13
|
2028/APR/26
|
25.0
|
129
|
250277
|
BETH #8 FR.
|
2025/JAN/15
|
25.0
|
|
|
|
|
|
|
30
|
249233
|
ALPINE 3
|
2024/APR/26
|
500.0
|
80*
|
250217
|
SER #14
|
2028/APR/26
|
25.0
|
130
|
250278
|
BETH #9 FR.
|
2025/APR/26
|
25.0
|
|
|
|
|
|
|
31
|
249234
|
ALPINE 4
|
2024/APR/26
|
500.0
|
81
|
250218
|
SER #15
|
2028/APR/26
|
25.0
|
131
|
250279
|
BETH #10 FR
|
2025/JAN/15
|
25.0
|
|
|
|
|
|
|
32
|
249235
|
ALPINE 5
|
2028/APR/26
|
25.0
|
82
|
250219
|
SER #16
|
2028/APR/26
|
25.0
|
132
|
250280
|
DEN #1 FR.
|
2025/APR/26
|
25.0
|
|
|
|
|
|
|
33
|
249264
|
ALPINE 6 FR
|
2028/APR/26
|
25.0
|
83
|
250220
|
SER #17
|
2028/APR/26
|
25.0
|
133
|
250281
|
DEN #2 FR.
|
2025/APR/26
|
25.0
|
|
|
|
|
|
|
|
Title
Number
|
Claim Name
|
Good To
Date
|
Area
(ha)
|
|
Title
Number
|
Claim Name
|
Good To
Date
|
Area
(ha)
|
|
Title
Number
|
Claim Name
|
Good To
Date
|
Area
(ha)
|
|
Title
Number
|
Claim
Name
|
Good To
Date
|
Area
(ha)
|
|
341
|
249265
|
ALPINE 7 FR
|
2028/APR/26
|
25.0
|
84
|
250221
|
SER #18
|
2028/APR/26
|
25.0
|
134
|
250321
|
DEEP NO.1 FR
|
2025/APR/26
|
25.0
|
|
|
|
|
|
|
35
|
250157
|
PENNY NO. 1 FR.
|
2028/APR/26
|
25.0
|
85
|
250222
|
SER #19 FR.
|
2028/APR/26
|
25.0
|
135
|
250322
|
DEEP NO.2 FR
|
2025/APR/26
|
25.0
|
|
|
|
|
|
|
36
|
250159
|
MAY #1
|
2028/NOV/26
|
25.0
|
86
|
250223
|
SER #20
|
2028/APR/26
|
25.0
|
136
|
250323
|
DEEP NO.3 FR
|
2025/APR/26
|
25.0
|
|
|
|
|
|
|
37
|
250161
|
MAY #5 FR.
|
2028/APR/26
|
25.0
|
87
|
250224
|
SER #21 FR.
|
2028/APR/26
|
25.0
|
137
|
250324
|
DEEP NO.4 FR
|
2025/APR/26
|
25.0
|
|
|
|
|
|
|
38
|
250164
|
RAY NO. 7
|
2028/APR/26
|
25.0
|
88
|
250225
|
SER #22
|
2028/APR/26
|
25.0
|
138
|
250325
|
DEEP NO.5 FR
|
2025/APR/26
|
25.0
|
|
|
|
|
|
|
39
|
250165
|
RAY NO. 8
|
2028/APR/26
|
25.0
|
89
|
250226
|
SER #23
|
2028/APR/26
|
25.0
|
139
|
250330
|
REFER TO LOT TABLE
|
2025/NOV/30
|
25.0
|
|
|
|
|
|
|
40
|
250166
|
QUEEN D. FR.
|
2028/APR/26
|
25.0
|
90
|
250227
|
SER #24 FR.
|
2028/APR/26
|
25.0
|
140
|
301376
|
WR 1
|
2026/APR/26
|
25.0
|
|
|
|
|
|
|
41
|
250167
|
QUEEN E. FR.
|
2028/APR/26
|
25.0
|
91
|
250228
|
SER #25 FR.
|
2028/APR/26
|
25.0
|
141
|
301377
|
WR 2
|
2028/APR/26
|
25.0
|
|
|
|
|
|
|
42
|
250168
|
QUEEN G. FR.
|
2028/APR/26
|
25.0
|
92
|
250229
|
NUT #7
|
2028/APR/26
|
25.0
|
142
|
301378
|
WR 3
|
2026/APR/26
|
25.0
|
|
|
|
|
|
|
431
|
250169
|
QUEEN H. FR.
|
2028/APR/26
|
25.0
|
93
|
250230
|
NUT #8
|
2028/APR/26
|
25.0
|
143
|
301379
|
WR 4
|
2026/APR/26
|
25.0
|
|
|
|
|
|
|
44
|
250170
|
QUEEN J. FR.
|
2028/APR/26
|
25.0
|
94
|
250231
|
NUT #9
|
2028/APR/26
|
25.0
|
144
|
301380
|
WR 5
|
2026/APR/26
|
25.0
|
|
|
|
|
|
|
45
|
250171
|
QUEEN B. FR.
|
2028/NOV/26
|
25.0
|
95
|
250232
|
NUT #10
|
2028/APR/26
|
25.0
|
145
|
301381
|
WR 6
|
2026/APR/26
|
25.0
|
|
|
|
|
|
|
461
|
250172
|
QUEEN A. FR.
|
2028/NOV/26
|
25.0
|
96
|
250233
|
NUT #11
|
2028/APR/26
|
25.0
|
146
|
616863
|
ELEVATION
|
2028/DEC/10
|
105.19
|
|
|
|
|
|
|
47
|
250173
|
QUEEN C. FR.
|
2028/NOV/26
|
25.0
|
97
|
250235
|
NUT #13
|
2028/APR/26
|
25.0
|
147
|
617888
|
ELEVATION 2
|
2028/DEC/11
|
42.07
|
|
|
|
|
|
|
48
|
250174
|
R.R. FR.
|
2028/NOV/30
|
25.0
|
98
|
250236
|
NUT #14
|
2028/APR/26
|
25.0
|
148
|
1074704
|
DEEP GULCH
|
2028/FEB/21
|
42.12
|
|
|
|
|
|
|
49
|
250175
|
R FR.
|
2028/NOV/30
|
25.0
|
99
|
250240
|
RAY 13 FR
|
2028/APR/26
|
25.0
|
149
|
1074705
|
DEEP GULCH 2
|
2028/FEB/21
|
84.23
|
|
|
|
|
|
Source: BC Mineral Titles Online, Owner 141588 (CMM BC Ltd), Title Type: Mineral Claim, Map Number 092H038, Status: Good
Note: Refer to notes below Table 4-1.
Table 4-3: Mining Leases
|
Title Number
|
Good To Date
|
Area (ha)
|
|
1
|
250139
|
2024/MAR/10
|
231.49
|
|
2
|
250140
|
2024/MAR/12
|
9.37
|
|
3
|
250141
|
2024/AUG/20
|
48.22
|
|
4
|
250142
|
2024/AUG/20
|
3.84
|
|
5
|
250143
|
2024/JUN/23
|
107.09
|
|
6
|
250144
|
2024/SEP/27
|
75.69
|
|
7
|
250145
|
2024/SEP/27
|
39.34
|
|
8
|
250146
|
2024/JAN/13
|
84.80
|
|
9
|
250147
|
2024/APR/20
|
61.75
|
|
10
|
250148
|
2024/NOV/04
|
19.83
|
|
11
|
250149
|
2024/JUL/07
|
1.44
|
|
12
|
250152
|
2037/APR/07
|
0.33
|
|
13
|
250153
|
2037/APR/07
|
0.63
|
|
14
|
250155
|
2037/APR/07
|
1.56
|
Source: BC Mineral Titles Online, Owner 141588 (CMM BC Ltd),
Title Type: Mining Lease, Map Number 092H038, Status: Good
4.3 Environmental Property Liabilities
Hudbay's posted CMM reclamation security currently includes liabilities for all mine disturbance areas and any environmental liabilities therein, including the Ingerbelle side of the property and mineral and surface tenures held by third parties, except for the District Lot 401 (Lela crown granted mineral claim, which Envirogreen Technologies Ltd. owns).
An updated CMM reclamation liability cost estimate was submitted in April 2023 for the 5-Year and life-of-mine (LOM) plans.
4.4 Royalties
Approximately 11% of the property area consists of claims subject to a 5% net smelter return (NSR) royalty. The royalty claims are mainly peripheral to areas currently scheduled for mining, and most are either outside of the area deemed favourable for mineralization or under active exploration. Both past and current mine production areas occupy less than 5% of the property area. The North Pit is partially covered by royalty-bearing claims. Exploration in the Virginia, North Pit, and Voigt areas was carried out intermittently between 1993 and 2012. Mine production recommenced in the Virginia deposit in 2016 and was completed in 2017. There are no Mineral Resources or Mineral Reserves for the Voigt Zone. Newmont made the royalty agreements dating back to 1979, with both Cominco's and Nufort's claims combined into a single agreement. UNOR Inc., a small uranium exploration company, which has since changed its name to Hornby Bay Mineral Exploration Ltd., purchased the Nufort royalty, which CMML later purchased. The only remaining royalty belongs to Sandstorm Gold Ltd., which purchased the Cominco royalty from Teck Resources Ltd.
5 Accessibility, Climate, Local Resources, Infrastructure, and Physiography
5.1 Accessibility
Almost all the CMM area is accessible by highway, with the site served by a paved access road, local gravel roads (remaining either from previous mining or logging), and those used for current mining (Figure 5-1). The nearest railway access is at Hope, about 120 km from the site. Grid power is supplied via a 65 MVA connection to the property at the historical Ingerbelle mill site, and a 3 km-long power line that connects to the mill site on Copper Mountain. Most of the water necessary for mill operations is recycled from the tailings pond, supplemented with fresh water pumped from the Similkameen River in accordance with regulations and permits.
5.2 Climate
The Copper Mountain area has a relatively dry climate, typical of British Columbia's southern interior. Summers are usually warm and dry, whereas winters are cool with minor precipitation. Most of the precipitation during the winter months falls as snow, with total snowfall of approximately 200 cm resulting in accumulated (compacted) snow depths of approximately 60 cm to 70 cm on the ground. Weather data from the mine site were collected from 1966 through 1996, and again from 2009 onwards. Temperatures range from an average annual high of 35°C to an average annual low of −29.5°C, with the annual mean temperature of 6°C. Total annual precipitation varies widely, ranging from a low of 253 mm to a high of 790 mm, with the average 400 mm. The biogeoclimatic (BGC) zones for the area are Ponderosa Pine-Bunchgrass at the lower elevations, transitioning to various BGCs at the higher elevations having lodgepole pine and spruce forests.
5.3 Local Resources
Princeton has a population of approximately 3,000 and a diversified economy driven by mining, ranching, forestry, and tourism. The CMM operation is the predominant employer in the area. The town has services typical of its size; however, the proximity of Vancouver to the west, Kamloops to the north, Penticton to the east, and Kelowna to the northeast, allows for most services and supplies to be easily obtained.
5.4 Infrastructure
When CMMC took over the mine in 2010, remaining infrastructure consisted of roads, a main office building, the TMF, a 138 kV power line to the old Ingerbelle mill, the water source, and a fleet of open pit mining equipment. In 2010 CMM added a 35 kt/d concentrator processing facility, mine maintenance truck shop, power-line extension, and a fresh-water booster station. Due to the hardness of the Copper Mountain mineralization the nameplate capacity of 35 kt/d could not be reached, and in 2014 a secondary crushing system was installed that surpassed nameplate capacity. In 2021-2022 CMM added additional processing plant equipment to increase the concentrator capacity to 45 kt/d.
Figure 5-1: Copper Mountain Mine Site

5.5 Physiography
Topography is gentle to moderate over most of the plateau area of Copper Mountain, where elevations range from 1,050 m to 1,300 m, but becomes rugged in the Similkameen River canyon. The elevation of the river is approximately 770 m; the canyon walls are steep.
6 History
The Copper Mountain area has a long history of exploration, development, and production, beginning with initial exploration in the 1880s. Granby Consolidated Mining, Smelting and Power Company (Granby) acquired the property in 1922-1923 and initiated production following construction of a crushing and milling facility, mostly processing underground mine production, which continued, with minor shutdowns, through 1957. Open pit mining began in 1968, when Newmont Mining Corporation of Canada (Newmont) commissioned the Ingerbelle Pit. In 1988, Newmont sold the property to Cassiar Mining Corporation (later to become Princeton Mining Corp.), and mining and exploration continued intermittently through to late 1996. An exploration-drilling program was carried out in 1996-1997; thereafter, the property was dormant until CMMC resumed exploration in January 2007. Following a feasibility study, permitting, and financing activities (which involved selling a 25% interest in CMML and the CMM to MMC) (Holbek, et al., 2009, August 21), CMMC constructed a new crushing and milling facility, new truck shop, administration buildings, and all other required infrastructure, and initiated production in August 2011. This section summarizes both the production and exploration history of the property. All past operations occurred prior to implementation of NI 43-101, and, as such, any Mineral Resource figures must be considered historical. However, the Mineral Reserve and Mineral Resource estimates were carried out by significant mining companies and are deemed relevant for historical reference and comparative purposes. In June 2023, Hudbay acquired CMMC and all its associated assets, including a 75% interest in CMML and the CMM.
6.1 Copper Mountain Mine Area and Mining History
Stanley and others (1996) summarize the exploration and mining history of the Copper Mountain and Ingerbelle deposits. The first recorded exploration at Copper Mountain dates to 1884. Several unsuccessful attempts at initiating production were made between 1892 and 1922. In 1923, Granby acquired the property, built a milling facility in the town of Allenby (adjacent to Princeton), and ultimately extracted 31.5 Mt of mineralization containing 1.08% Cu from vein ore bodies on the east side of the Similkameen River (Stanley et al., 1996). The underground mine production was transported to the east wall of the Similkameen River canyon via a 1 km-long adit, where it was crushed and placed in rail cars and transported 5 km along a spur line of the Kettle Valley Railway to the milling facilities in Allenby. Mining operations were suspended in 1957, partly due to low metal prices, and partly due to transportation charges by the owners of the rail line. Granby carried out a significant amount of exploration drilling during its operations, and data from this phase of work have been preserved.
Modern exploration activity began in 1966, when Newmont optioned claims opposite the historical Granby Mine on the west side of the Similkameen River (Figure 6-1). Newmont carried out geological mapping, soil sampling, and geophysical surveys, which resulted in bulldozer trenching uncovering a significant mineralized zone. Subsequent drilling defined sufficient resources to contemplate production. During this time, Granby was drilling off open pit reserves on Copper Mountain. In late 1967, Newmont purchased Granby's entire mining interest in the Princeton area for $8 million and 750,000 Newmont shares (with a trading price at the time of approximately $4/share), including a much-needed tailings impoundment area (Smelter Lake). Newmont continued exploration, including an underground drive that provided underground drilling stations and a bulk sample from the Ingerbelle deposit. Production commenced from the Ingerbelle deposit in April 1972, following a five-month period of pre-stripping. The predicted reserve at start-up was 67 Mt grading 0.55% Cu (and approximately 0.20 g/t Au). Actual mined grades were lower than the predicted grades, and to reduce the strip ratio and unit costs, the cut-off grade was lowered from 0.30% Cu to 0.20% Cu, and mill throughput was increased from 13.6 kt/d to 20 kt/d.
Figure 6-1: Locations and Names of Historical and Current Mining Zones and Areas

In 1979, development of additional reserves on the Copper Mountain side of the property (east of the Similkameen River) commenced with the installation of a new primary crusher and conveyor system. The conveyor system was 2.1 km long, extending from the gyratory crusher near the northwest edge of Pit 2, along the east side of the Similkameen River for 1.6 km, and then across the Similkameen canyon to the old Ingerbelle milling facility. Initial production on the Copper Mountain side was from Pit 2, with additional production from Pit 3 in 1983. Mining in Pit 2 ceased in 1985. In 1988, the entire property was sold to Cassiar Mining Corporation (later to become Princeton Mining Corp.) for $10 million and operated as Similco Mines Ltd (Similco). Similco continued mining from Pits 1 and 3, and later added a small amount of production from the Virginia Pit. Total production from the camp to 1993 was 1.7 billion pounds of copper, 8.4 Moz of silver, and 0.62 Moz of gold (Stanley et al., 1996).
In November 1993, Similco was shut down due to low metal prices and placed in care and maintenance. An improving copper price combined with a favourable US-Canadian dollar exchange rate allowed the mine to reopen in August 1994. In conjunction with the reopening, a significant exploration effort was made to delineate additional deposits on the property. A property-scale airborne magnetometer (Mag), electromagnetic (EM), and radiometric (RM) survey was flown, followed by mine-scale geological mapping, ground geophysics, and diamond drilling. Drilling was initially focused on the North Pit (Alabama Zone), where a large area of mineralization was identified, then shifted to extending mineralization to the east and at depth in the Ingerbelle deposit. That exploration defined additional reserves in those places, and in 1995 Similco returned to the Ingerbelle deposit. The mine was closed in late 1996 due to falling metal prices and a shortage of mineralization that did not require extensive stripping.
6.2 Exploration and Mineral Resource Estimates History
There is little documentation of the early exploration history on the CMM property, and most of this information must be inferred. Abundant evidence of early workings, such as trenches and adits, indicate that prospecting was quite extensive from 1900 to the 1940s. By the mid-1940s, Granby was using diamond drilling in addition to percussion drilling for exploration. Granby's mining and exploration programs located most of the currently known areas of mineralization, except for the North Pit (Virginia and Alabama areas). However, in many of these areas, Granby did not define significant mineralization, or the full extent of mineralization, as their exploration was driven by the need for relatively high-grade underground resources. Most of Granby's exploration took place along a northwest trend that followed the northern contact of the Copper Mountain Stock (referred to at that time as the "Contact Zone"), where grades were high enough to support underground mining. Exploration was also conducted on the Voigt Zone, first by Emil Voigt and later by Newmont, but this deposit was never developed, probably due to its limited thickness and the extensive disruption of mineralization by post-mineral dykes (the relatively high gold grades in the Voigt Zone would not have been economically significant at the time).
Granby's need to achieve mill capacity, and the slow pace of diamond drilling, usually meant that exploration drilling success was quickly followed by underground development. An example of this is the 750 m-long Wolfe tunnel, approximately 1.5 km southeast of the Oriole Zone. A beneficial aspect of Granby's underground drilling operations is that many of the underground drill holes were flat, providing perpendicular intersections of vertical to steeply dipping zones of mineralization, and allowing for more accurate resource estimation.
Although Granby developed some small open pits at a few locations during the later stages of the mine life, their equipment was ill-suited for efficient open pit mining, and most of their exploration was directed toward development and mining of underground resources. Newmont initiated exploration on claims on the western side of the Similkameen River, and ultimately succeeded at delineating the Ingerbelle deposit. Most of Newmont's drilling on Copper Mountain was in the Pit 1 and Pit 2 areas, using vertical, up-to-60 m-deep percussion holes that defined only near-surface resources, and prevented full definition and understanding of underlying mineralization.
Newmont sold the operation (Similco Mines) to Princeton Mining in 1988, and that company continued to explore the property, conducting small-scale diamond drill programs from 1989 to 1991, and from 1993 to 1997. These drill programs were conducted in the area extending from the eastern end of Pit 2 to the northeast, through the Mill Zone, across the Lost Horse Gulch, and into the eastern end of the North Pit (Alabama Zone). All holes encountered some mineralization, with the best results coming from what would become the Virginia deposit.
Drilling in the Ingerbelle area in 1994 and 1995 defined additional historical reserves extending eastward from the Ingerbelle deposit; and the low-strip parts of these newly defined reserves were mined through 1996. Following Imperial Metals' takeover of Princeton Mining, it undertook a 61-hole, 11,800 m drill program in late 1996 and early 1997. Imperial subsequently sold the property to a non-mining entity.
In 2006 CMMC acquired an option on the Copper Mountain property from Compliance Energy. Following large exploration and drilling programs in 2007 (138 diamond drill holes) and 2008 (275 diamond drill holes), CMMC exercised the option, and decided to work towards putting the property back into production. Exploration continued from 2009 to 2012 with production commencing in mid-2011 and continuing to the present day.
The two most recent relevant Mineral Resource estimates for the CMM were produced in January 2019 and August 2022 and are shown in Table 6-1.
Table 6-1: Reconciliation between the 2019, 2022, and 2023 Copper Mountain
Mineral Resource Estimates
|
Categories
|
CMMC 2019 PFS
(as of January 1, 2019)
|
CMMC 2022 PFS
(as of August 1, 2022)
|
Hudbay 2023
(as of December 1, 2023)
|
|
Tonnes
(Mt)
|
Cu
(%)
|
Au
(ppm)
|
Ag
(ppm)
|
Tonnes
(Mt)
|
Cu
(%)
|
Au
(ppm)
|
Ag
(ppm)
|
Tonnes
(%)
|
Cu
(%)
|
Au (ppm)
(%)
|
Ag (ppm)
(%)
|
|
Measured + Indicated
|
549
|
0.24
|
0.11
|
0.75
|
1,080
|
0.22
|
0.09
|
0.65
|
440
|
0.25
|
0.12
|
0.73
|
|
Inferred
|
237
|
0.21
|
0.10
|
0.50
|
446
|
0.19
|
0.09
|
0.54
|
371
|
0.25
|
0.13
|
0.61
|
Notes: PFS = prefeasibility study.
Cut-off at 0.10% Cu.
Mineral Resources are constrained by a $3.50/lb Cu pit shell in the 2019 and 2022 and by a pit shell using long-term copper, gold, and silver prices of US$4.00/lb, US$1,650/oz, and US$22.00/oz, respectively in 2023.
In early 2022, CMMC engaged SLR Consulting Inc (based in Denver, Colorado) to review the existing database and prior Mineral Resource estimation methodology. A full audit was undertaken, and a number of recommendations were proposed to update the estimation methodology; an additional 55,000 m of drilling were included, which were completed as part of a large two-year program spanning 2021-2022. Including additional drilling and implementing SLR's recommendations resulted in a large increase in Mineral Resources across all categories in the 2022 estimates. In 2023, the resource model was subject to many internal checks and validations of both the drill-hole database and geological model, and a new estimation workflow was adopted. This change in resource modelling methodology was also implemented to bring the resource modelling approach in line with the approach used at other Hudbay operating sites and projects. The 2023 resource model described in Section 14 of this Technical Report is deemed to be more aligned with those constructed at Copper Mountain in 2019 and prior years.
7 Geological Setting and Mineralization
7.1 Regional Geology
The Copper Mountain porphyry copper deposit is near the southern end of the Quesnel Terrane-an allochthonous composite crustal fragment consisting of Paleozoic and Mesozoic volcanic, sedimentary, and plutonic rocks (Petersen et al., 2004). This terrane developed off-shore of the North America Craton on deformed oceanic volcano-sedimentary rocks during the Mesozoic, and was accreted to ancestral North America in the Early to Middle Jurassic (Monger et al., 1982, 1992; Mortimer, 1987). Arc growth continued through the late Triassic, culminating in a prolific metallogenic event manifesting a series of porphyry deposits within the Quesnel and adjacent Stikine terrane (Mihalynuk et al., 2010). Copper Mountain is one of a number of alkalic porphyry deposits in British Columbia that formed during the Late Triassic to Early Jurassic in the Quesnel and Stikine terranes (Lang et al., 1995). Figure 7-1 shows the location of the major alkalic porphyry deposits in British Columbia.
7.2 CMM Geology
The southern Quesnel Terrane is dominated by the late Triassic Nicola Group, a subaqueous island arc assemblage composed of volcanic and sedimentary rocks which make up the Nicola Volcanic Arc (Preto, 1977). At Copper Mountain, the Nicola Group is cut by an intrusive suite including the composite Copper Mountain Stock (CMS), the Voigt Stock, and the slightly younger, polyphase, Lost Horse Intrusive Complex (LHIC) (Figure 7-2 and Figure 7-3). Copper-gold mineralization postdates the CMS and is temporally and spatially associated with the LHIC.
Host rocks and mineralization in the mine area are cut by numerous late, north-south-trending felsite dykes, related to emplacement of the Cretaceous Verde Creek quartz monzonite approximately 3.5 km northeast of the mine area. Sedimentary and volcanic rocks of the Eocene Princeton Group have been unconformably deposited onto Nicola Group volcanic rocks and LHIC along the northern and eastern margins of the CMM area and dip about 30° to the north (Figure 7-2).
Figure 7-1: Terranes of British Columbia Showing the Copper Mountain Deposit Location

Source: From Bissig and Cooke (2014).
Notes: Terrane map and location of selected alkalic porphyry Cu-Au deposits of British Columbia.
Copper Mountain is in the Quesnel Terrane (referred to in the figure as Quesnellia), labelled QN on the map.
Deposits shown in the Figure (other than Copper Mountain) are held by third parties.
Figure 7-2: Geology of the Copper Mountain Area

Source: Prepared by CMM (2022).
Notes: Geology modified after Montgomery (1967) and Preto (1972). The dashed red line, referred to as
"Resource Outline >0.1% Cu" in the legend, represents the outline of >0.1% Cu blocks within the
Mineral Resources pit shell.
Figure 7-3: Schematic Representation of a Geological SW-NE Cross-Section Across Copper Mountain

Note: Locations of cross sections are provided in Figure 7-2.
Source: CMM (2022).
7.2.1 Lithologies
7.2.1.1 Nicola Group
Nicola Group rocks within the CMM area have been split into two formations separated by a major north-south-striking structure called the Boundary Fault (Dolmage, 1934; Preto, 1972). The Wolfe Creek Formation, within and adjacent to the deposit, comprises three main rock types: aphanitic to porphyritic basalt, polymictic volcanic breccias and finely laminated volcanic siltstone, typically less altered and mineralized. The Kennedy Lake Formation, exposed to the west of the New Ingerbelle Zone, is a shallow marine sedimentary sequence that exhibits northerly dips and consists of argillite, arkose sandstone, and a coarse volcanic conglomerate with ovoid limestone clasts. Undifferentiated Nicola Group rocks outcrop on the west side of the Boundary Fault apart from the Kennedy Lake Formation and include massive to pillowed andesite, dacite, and minor basalt (Figure 7-2 and Figure 7-3).
7.2.1.2 Copper Mountain Intrusive Suite
The Copper Mountain Intrusive Suite includes the CMS, Voigt stock, and associated dykes, domes, and breccias (Dolmage, 1934). The CMS is an alkaline intrusion, approximately 16 km2, dominant in the southern end of the mine and the CMM area (Figure 7-2). The stock is concentrically zoned from diorite with local gabbroic zones on the margins, to a monzonite and syenite (almost pure orthoclase) core (Montgomery, 1967; Preto, 1972). The CMS generally has steep-to-vertical contacts with Nicola Group rocks along its northern and eastern margins.
The Voigt Stock occurs approximately 1 km northeast of the Copper Mountain deposit on the northern edge of Nicola Group rocks. The stock is nearly visually and petrologically identical to the outer phase of the CMS and does not appear to exhibit any concentric zoning. Outer contacts of the Voigt stock with Nicola Group rocks and LHIC intrusions are more irregular and less steep than the contacts between the CMS and the Nicola Group.
7.2.1.3 Lost Horse Intrusive Complex
The LHIC comprises multi-phase diorite to monzonite intrusions consisting predominantly of dykes and lesser small, irregular intrusions and associated breccias (Dolmage, 1934; Montgomery, 1967; Preto, 1972). These intrusions form an approximately 1 km-wide, east-west-trending band that cuts across the mine area from the Voigt Stock in the northeast to the Boundary Fault in the west. Individual dykes of the LHIC are typically porphyritic in texture, steeply dipping, and display sharp wall-rock contacts. These dykes are commonly altered, mineralized, and cut by numerous veins, and are therefore interpreted to be genetically related to orebody formation. Four phases of the LHIC are recognized, with pre-, syn-, and post-mineralization phases present.
7.2.1.4 Verde Stock and Felsite Dykes (Mine Dykes)
The Cretaceous Verde stock (Mihalynuk et al., 2010; Preto, 1972) is a large body of medium- to coarse-grained quartz monzonite that cuts both the Nicola Group and the Voigt stock to the east of the mine area. The Nicola Group, the Voigt Stock, the CMS, and the Copper Mountain orebody are also cut by a series of felsite dykes, referred to as "mine dykes." These mine dykes, which form a north-trending, vertical to steeply easterly dipping swarm in the eastern half of the mine area are also Cretaceous in age (Figure 7-2 and Figure 7-3). In the mine area, the dykes are aphyric and flow-banded, but can locally be quartz- and/or feldspar-phyric. Mine dykes range from a few metres to a few tens of metres thick. Along strike, the dykes extend for many kilometres north and south of the mine area.
7.2.1.5 Princeton Group
Eocene-age Princeton Group rocks unconformably overlie Nicola Group rocks, predominantly on the north side of the mine area (Figure 7-2). They consist of basal conglomerates and carbonaceous clastic sedimentary rocks, including coal beds overlain by feldspar porphyry flows and poorly consolidated laharic breccias and ash tuffs. The rocks of the Princeton Group in the CMM area are assigned to the Allenby Formation (Shaw, 1952) and were deposited in the structurally controlled Princeton Basin.
7.2.2 Structure
The structural geology of the Copper Mountain CMM area has been described by a number of authors, most notably Fahrni (1951), Fahrni et al., (1976), and Preto (1972). However, there has not been a comprehensive structural geology study or synthesis carried out at Copper Mountain since the mine reopened in 2011.
The Gully Fault, which runs through the middle of the Ingerbelle Zone, strikes east, and dips north at 70°. This fault has been traced from the Boundary Fault in the east to the Main Fault, a strike length of around 1,100 m (Preto, 1972). The fault was exposed in the historical 3050 exploration adit, and was characterized by a fault clay zone up to 23 m wide.
The Pit Fault is a major structure in the Copper Mountain Main Zone and is similar in style and orientation to the Gully Fault. The Pit Fault strikes west-southwest and dips 80° to the north. It extends eastward from the Main Fault for approximately 1,000 m. The Tremblay Fault cuts the Pit Fault and displaces it left laterally approximately 30 m. West of the Tremblay Fault, a narrow zone of copper mineralization follows the Pit Fault, indicating that the fault was active during the period of mineralization (Preto, 1972).
Fahrni (1951) and Montgomery (1967) describe a prominent >3 km-long northwest-striking, sub-vertical fault immediately north of the CMS, within Nicola Group rocks. This fault cut through the underground workings of the Granby Mine, and was referred to as the "Main Fault." The fault had about 50 m of vertical offset, with the development of marked "schistosity" and biotite alteration in the adjacent Nicola Group rocks for up to 15 m either side of the fault (Fahrni, 1951). It appears to have had a control on copper mineralization, with Fahrni (1951, p. 205) stating that "roughly one half of the known orebodies in the [Granby] mine are grouped along the Main Fault and its branches." Preto (1972) also describes the prominent northwest-trending Main Fault, cutting Nicola Group rocks to the north of the CMS, and coming within 50 m of the intrusion, but never cutting it.
The Tremblay Fault is another prominent fault that Preto (1972) describes, and more recently Holbek et al. (2020). The fault has a south-southwest strike length of more than 1 km, and dips about 65° to 80° degrees to the west. The fault has a 10-m-wide fault clay zone in the southern part of the Main Pit. A half graben along the Tremblay fault was infilled with Eocene Princeton Group rocks, indicating west-side-down (normal) movement of about 60 m. This control on Eocene sedimentation indicates that normal displacement on the Tremblay Fault occurred at roughly the same time as normal displacement of the Boundary Fault system.
The Boundary Fault system is <0.5 km west of the Ingerbelle Zone (Figure 7-2) and is part of a series of well-developed, south striking faults that control the location of Paleogene (Tertiary) basin faults in south-central British Columbia and northern Washington (Fahrni et al., 1979; Shaw, 1952). The Boundary Fault strikes south, dipping 65° to the west, and the overall fault system has an interpreted strike length of at least 10 km (Preto, 1972). The 45 Degrees Fault is a few hundred metres east of the Boundary Fault, with a similar southern strike, dipping 45° to the west. Preto (1972) interprets it as merging with the main Boundary Fault north and south of New Ingerbelle. This fault truncates copper mineralization on the western side of the New Ingerbelle Zone. To the north of the mine area, the half-graben containing the Princeton Group strata is bounded on the east by the northern extension of the Boundary Fault that juxtaposes Eocene Allenby Formation beds against Upper Triassic rocks of the Nicola Group (Preto, 1979; Rice, 1947).
7.2.3 Geochronology
Multiple studies, using different geochronometers, have addressed the question of the age of igneous intrusions and mineralization at the Copper Mountain deposit. The formation of the Copper Mountain deposit was coeval with the approximately 205 Ma to 200 Ma regional alkalic copper-gold porphyry event that stretched the length of the Canadian Cordillera (Logan and Mihalynuk, 2014).
7.3 Deposit Geology
The bulk of the known copper mineralization at Copper Mountain occurs in a northwesterly trending belt of Nicola Group rocks, approximately 5 km long and 2 km wide, that is bounded on the south by the CMS and on the west by the northerly trending Boundary Fault system (Figure 7-2).
7.3.1 Alteration
Alteration types in the Copper Mountain deposit are typical of porphyry copper deposits. Three major alteration assemblages are observed at CM: potassic, sodic, and propylitic. Other volumetrically minor alteration types include kaolinitic and sericite-chlorite clay (Stanley et al., 1995).
Contact metamorphism from the CMS resulted in pervasive hornfelsing of the Nicola Group volcanic rocks within a northwest-oriented zone between the CMS and the LHIC, near to CMS and LHIC dykes (Preto, 1972). Biotite and calc-silicate hornfels preceded all hydrothermal alteration and subsequent copper mineralization at Copper Mountain (Stanley et al., 1995).
Sodic alteration at Copper Mountain is observed as albite, with lesser amounts of diopside, epidote, and locally scapolite. Fracture-controlled sodic alteration in the Copper Mountain main zone is conspicuous within the intrusive breccia (INBX) and Nicola Group volcanic rocks. Sodic alteration is texturally destructive, replacing almost all existing minerals with very fine-grained to aphanitic albite with minor diopside and spots or patches of epidote (Holbek et al., 2020).
Potassic alteration at Copper Mountain can be observed within intrusive rocks and volcanic-sedimentary units; however, it is best developed within intrusive dykes of the LHIC. Potassic alteration occurs as veins, envelopes, and fracture fill, and where strongest appears as pervasive alteration of the entire rock. Potassic alteration crosscuts sodic alteration (Holbek et al., 2020).
Propylitic alteration is characterized by a chlorite-actinolite-calcite-pyrite ± epidote assemblage. It occurs throughout the deposit area, can be locally pervasive, and is best developed outboard of the mineralized areas.
Late calcite veinlets are ubiquitous at Copper Mountain, distinct from calcite-sulphide veins associated with late-stage mineralization, and crosscut all other alteration and mineralization types.
Pervasive kaolinitic alteration and sericite-chlorite-clay alteration are volumetrically minor compared to the other alteration types within the Copper Mountain deposit. Kaolinitic alteration is commonly associated with major structures throughout the deposit and appears to postdate copper mineralization (Holbek et al., 2020; Stanley et al., 1995).
7.3.2 Mineralization
The bulk of the known copper mineralization at Copper Mountain occurs in a northwesterly trending belt of Nicola Group rocks, approximately 5 km long and 2 km wide, that is bounded in the south by the CMS and in the west side by the northerly trending Boundary Fault system (Figure 7-2 and Figure 7-4). Here copper mineralization occurs as structurally controlled, multidirectional veins and vein stockworks, with peripheral disseminations. Mineralization has been subdivided into four types, as follows:
-
Disseminated and stockwork chalcopyrite, bornite, chalcocite, and pyrite in altered Nicola Group volcanic rocks and LHIC rocks that formed much of the core of the deposit in the southern part of the CM Main Pit
-
Bornite-chalcopyrite associated with pegmatite-like veins (coarse masses of orthoclase, calcite, and biotite situated along the northern contact of the CMS within the Nicola Group
-
Magnetite-(±hematite)-chalcopyrite replacements and/or veins) mineralogically similar to the chalcopyrite-pyrite-bearing pegmatite-textured veins, but carry significantly higher gold grades (Stanley and Lang, 1993) relative to other mineralized zones
-
Chalcopyrite-bearing magnetite breccias (Fahrni et al., 1976; Holbek et al., 2020; Preto, 1972; Stanley et al., 1995) within the Ingerbelle Pit and the north side of the CM Main Pit mineralized with chalcopyrite and pyrite and are bounded by a higher-grade zone of copper-gold mineralization.
Figure 7-4 shows the detailed copper grade pattern in the Copper Mountain Main Zone. Figure 7-4 is based on blasthole data from approximately 280,000 blastholes, drilled on a nominal 8 m by 8 m spacing on each bench. These data highlight structural trends in copper mineralization and also show the location of late, post-mineral mine dykes. The prominent northwest-trending grade break in the southern area of the map is along the contact between the Copper Mountain Stock and Nicola Group.
Figure 7-4: Contoured Blastholes in the CM Main Pit at November 2019 Mining Surface

Source: CMMC (2022).
7.3.3 Weathering
Due to recent glaciation, most of the Copper Mountain deposit is characterized by a relatively fresh erosion surface, with limited surficial oxidation and no significant secondary enrichment of copper. Locally, the overlying Princeton Group has preserved a thin layer of oxidized mineralization and small supergene zones below the basal unconformity of the Princeton Group rocks. Fahrni et al. (1976) state that primary sulphide mineralization extends to the present surface, and oxidation is limited to the upper 15 m of fault and fracture zones. Recent mining in the North Pit area has exposed an irregular zone of supergene weathering extending about two benches from the surface.
8 Deposit Types
The Copper Mountain deposit is considered to be an example of an alkalic porphyry deposit. Although less common globally than calc-alkalic porphyry deposits, alkalic porphyry deposits are common in B.C. where they have been extensively studied. Well known examples of alkalic porphyry deposits in B.C. include Copper Mountain, Afton/Ajax, Mt. Milligan, Mount Polley, Lorraine, Red Chris, and Galore Creek. Lang et al. (1995) further subdivide mineralized alkalic porphyry deposits in B.C. into two types; silica undersaturated (e.g., Galore Creek) and silica saturated (e.g., Copper Mountain).
8.1 Alkalic Porphyry Deposits
Alkalic porphyry copper-gold deposits have the following features that distinguish them from the more common calc-alkalic porphyry deposits (as summarized by Bissig and Cooke, 2014):
-
Copper-gold mineralization is spatially and genetically associated with multiple pulses of volumetrically restricted, but compositionally varied, alkaline porphyry intrusions.
-
In the core of alkalic porphyry deposits, alteration assemblages include calcic and calc-potassic assemblages.
-
Calc-potassic alteration can be surrounded by potassic alteration that typically contains abundant biotite and magnetite in basaltic host rocks.
-
Outward from the potassic zone, both inner and outer propylitic assemblages can be found.
-
Albite-rich sodic alteration can characterize the shallow part of the system.
-
Alkalic porphyry deposits in general are characterized by a relative scarcity of phyllic (sericitic) alteration, and an almost total lack of clay alteration.
-
The obvious alteration footprint of alkalic porphyries is also considerably smaller than in their calc-alkalic cousins, commonly not extending more than 500 m laterally outward from the mineralizing intrusions.
-
Mineralization is typically hosted by the potassic and/or calc-potassic alteration zones, and potassic alteration is typically more extensive spatially than copper-gold mineralization.
-
Sulphides in alkalic porphyry deposits are typically zoned from bornite-rich cores to bornite + chalcopyrite and then pyrite + chalcopyrite zones, with an outer barren zone where pyrite is the dominant sulphide. Overall, the sulphide content, especially pyrite, is low compared to calc-alkalic porphyry deposits.
-
Sulphides may occur as breccia cements, disseminated, or in veins together with gangue minerals.
-
Quartz gangue is restricted to alkalic porphyry deposits related to silica-saturated magmatism.
9 Exploration
The CMM has a long history of exploration and mining. Records of the early work are sparse, but record-keeping improved greatly after 1940, in the later years of Granby's mining operation. Historical exploration data have been compiled by different companies over the last 50 years, most recently by CMMC and Hudbay.
9.1 Geological and Geochemical Mapping
A number of geological mapping programs have been completed on the Project. Mapping scales range from 1:20,000 district geological maps to more-detailed 1:2,500 geological maps of the mine. Data from this mapping have been used to support geological interpretation and Mineral Resource estimation.
Historical soil sampling and rock chip sampling were carried out. There is limited information available on these historical geochemical surveys, and the surficial data are not relevant to the current Mineral Resource estimate.
9.2 Geophysics
9.2.1 Airborne Surveys
In November 2014, Precision GeoSurveys conducted an airborne magnetic and radiometrics survey on the Project. Figure 9-1 shows the total magnetic intensity (TMI) data from this survey.
9.2.2 Ground Surveys
In 2007, Quantec Geoscience carried out a Titan 24 induced polarization (IP)/resistivity/magnetotelluric survey consisting of seven north-south lines, 2.4 km to 3.6 km long, and spaced 500 m apart (Figure 9-2). The benefits of this Titan 24 survey included the relatively deep investigation of the system and the quality of the data. Three-dimensional (3-D) inversion models of both chargeability and resistivity data were also created (3.6 km by 3.6 km by 1.2 km). The Titan 24 inversion models revealed large high-IP chargeability anomalies beneath the historical Pit 1, Pit 2, and Pit 3, which provided the impetus for major drilling campaigns by CMMC and resulted in the subsequent definition of the modern Copper Mountain Main Zone.
In 2017, SJ Geophysics conducted another IP/resistivity survey using a Volterra acquisition system comprising seven geophysical lines totalling 9.925 line km on both sides of the Similkameen River between the area of current mining in the Copper Mountain Main Zone and the New Ingerbelle Zone (Figure 9-2). The resulting two-dimensional (2-D) inversion models were limited to relatively shallow depths of investigation (<400 m depth from surface) but yielded several areas of anomalously high IP chargeability, including: along the periphery of the New Ingerbelle Zone; between the western edge of the known Copper Mountain Main Zone and the Similkameen River; and northwest of the Copper Mountain Main Zone.
In 2023, Dias Geophysical conducted 2-D and 3-D IP and resistivity surveys using the DIAS32 systems to cover the New Ingerbelle Zone, the west of the CM North Zone, and the east and southeast of the CM Main Zone (Figure 9-2). Inversion models were generated by Dias Geophysical for each data set. High IP chargeability anomalies were identified within the inversions of each Dias survey areas, and geological interpretation of these data are currently underway.
Figure 9-1: Total Magnetic Intensity
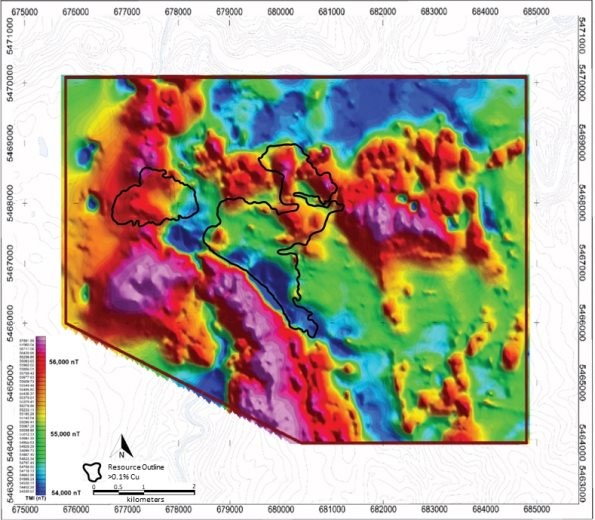
Notes: TMI of the CMM area. The black line represents the outline of >0.1% Cu blocks within the 2022 Mineral Resources pit shell.
Figure 9-2: Location of IP Survey Lines

Note: Aerial photograph showing the outline of 2023 >0.1% Cu grade shells brown), 2007 Titan 24 survey lines, 2017 Volterra survey lines, 2023 Dias 2-D survey lines, and 2023 Dias 3-D survey areas.
9.3 Exploration Potential
Porphyry copper-gold mineralization at Copper Mountain occurs over a large area, approximately 5 km long and 2 km wide, and the deposit remains open both laterally and at depth. The majority of historical drill holes did not extend beyond 500 m deep, and many ended in zones of copper-gold mineralization. These drill-hole data, combined with geophysical data, suggest that the Copper Mountain deposit extends below the current known Mineral Resource.
A program of relogging and resampling of historical drill holes began in June 2022, prioritizing drill holes that ended in zones of copper-gold mineralization. This relogging focused on the style of mineralization and alteration to assess the potential for vertical and lateral extensions to mineralization. The 2022-2023 relogging program also included physical property measurements on drill core, including density, magnetic susceptibility, IP chargeability, and resistivity. These data will be used to constrain geophysical inversions and to guide future exploration drilling. Hyperspectral data were collected in 2022 using an ASD TerraSpec spectrometer.
The 2022 relog program included the re-assay of archived pulps and drill core, by four acid digestion and 48 elements inductively couple plasma mass spectrometry (ICP-MS) analysis. In September 2023, an additional 3,000 archived pulps from throughout the CMM site were selected for re-assay. The multi-element data from the analysis of these pulps will provide needed information for characterizing lithology, alteration, sulphide speciation, and trace-element vectoring.
10 Drilling
Drilling completed to September 1, 2023, on the CMM includes 6,041 core and percussion drill holes (647,642 m) and 281 reverse-circulation (RC) drill holes (45,744 m) for a total of 6,322 drill holes (693,386 m).
Since the previous NI 43-101 technical report in August 2022, 72 additional drill holes, comprising 17,691 m of drilling have been added to the database. Exploration drilling was carried out in the Copper Mountain Main, North-West, and New Ingerbelle Zones, while RC drilling was used for reserve definition drilling in the Main Pit area. Geotechnical programs were undertaken concurrently with exploration drilling and focused on the west wall of Pit 3 (CM Main) and the east wall abutment of the current New Ingerbelle Pit. Exploration drilling was designed to test both historical and recently defined geophysical anomalies with an emphasis on locating the causative intrusions that control mineralization at depth within the hydrothermal system.
10.1 Drill Summary
The majority of historical drilling (1912-1996) at the CM Project was diamond drilling, with some percussion holes drilled in the 1950s and 1960s during the underground mining operation and RC holes drilled in 1994. Historical drilling is summarized in Table 10-1. Since 2007, the majority of the drilling has been diamond drilling, with some RC drilling carried out between 2020 and 2023. Drilling since 2007 is summarized in Table 10-2. Figure 10-1 shows an isometric view of the Copper Mountain Main area and illustrates the density of drilling that exists.
Since the last technical report update in 2022, four diamond drill holes totalling 2,576 m have been drilled on the Copper Mountain Main and North-West Zones of the property, and four diamond drill holes drilled at the New Ingerbelle Zone, totalling 4,322 m. The diamond drill holes at both Copper Mountain and New Ingerbelle were conducted to test some deeper pre-existing and new geophysical anomalies from IP surveys that were conducted in 2008 and 2023; the program was successful in extending mineralization a further 200 m below the previous lowest portions of the New Ingerbelle deposit. New Ingerbelle now exhibits mineralization from the 1090 m elevation down to 135 m above sea level (masl) (955 m vertical continuity).
An infill RC drilling program was undertaken in the CM Main Pit area to confirm the occurrence of high-grade mineralization mostly indicated in this area from historical drilling. A total 59 RC holes were completed in 2022 and 2023 for 9,198 m.
Table 10-1: Summary of Historical Drill Hole Data for the Copper Mountain Project
|
Year
|
Company
|
Type
|
Area
|
Zone
|
Number
|
Metres
|
Comments
|
|
1917-1957
|
Granby
|
DDH/UG/Perc.
|
UG Deposits
|
CM Main
|
1,219
|
74,311
|
U-series; U1 to U1827
|
|
1917-1967
|
Granby
|
DDH
|
Surface Exploration
|
CM Main
|
337
|
33,710
|
Holes named with letter code off mineral claims
|
|
1940-1957
|
Granby
|
DDH
|
UG, Pit 3
|
CM Main
|
152
|
4,828
|
SH-series, Production drilling
|
|
1952-1969
|
Granby
|
DDH
|
Surface exploration
|
CM Main
|
468
|
54,418
|
S-series (approx. 4% of holes missing)
|
|
1951-1956
|
Granby
|
DDH/UG/Perc.
|
UG, Pits 1, 3
|
CM Main
|
978
|
43,646
|
2 to 8 series indicating level
|
|
1966-1970
|
Newmont
|
PDH
|
Surface; Pits 1, 2
|
CM Main
|
923
|
57,963
|
P-series (approx. 10% missing data)
|
|
1966-1970
|
Newmont
|
DDH/UG/Perc.
|
Ingerbelle
|
New Ingerbelle
|
520
|
70,728
|
DH-series, E-series, P-series; 66-, 66B- series;
|
|
67-, 67C-series, 68C-, 68D-, 68U-series; 70U-series
|
|
1980
|
Newmont
|
DDH
|
Ingerbelle
|
New Ingerbelle
|
20
|
3,227
|
80-series, 80ADH-series
|
|
1988-1991
|
Princeton Mining
|
DDH
|
Surface; Lost Horse-Virginia
|
CM North
|
210
|
32,408
|
A, LH, M, M90, OP, P, VA, VB series
|
|
1994-1996
|
Princeton Mining
|
DDH
|
Alabama
|
CM North
|
41
|
6,581
|
94A, 95A, 96A series
|
|
1994
|
Princeton Mining
|
RC
|
Alabama
|
CM North
|
29
|
5,313
|
R94A-series
|
|
1994
|
Princeton Mining
|
DDH
|
Ingerbelle
|
New Ingerbelle
|
41
|
6,443
|
94I-, 94El-, 94IEOC-series
|
|
1996
|
Princeton Mining
|
DDH
|
Orinoco
|
CM North
|
11
|
1,137
|
96ORN-series
|
|
1996-1997
|
Princeton Mining
|
DDH
|
Pit 3, Pit 2, Saddle Zone
|
CM Main
|
60
|
12,215
|
DH96P5-, DH97P2-series
|
|
|
|
|
|
Total
|
5,009
|
406,929
|
|
Table 10-2: Summary of Recent Drill Hole Data for the Copper Mountain Project
| Year |
Company |
Type |
Area |
Zone |
Number |
Metres |
Series |
| 2007-2009 |
CMMC |
DDH |
Surface, Pit 2, Saddle Zone, Oriole |
CM Main |
404 |
105,464 |
07SD-, 07P2-, 07QA-, 07STP-, 08MC- |
| Orinoco, WC, Mill Zone, Pit 1 |
08MZ- |
| Stope, Condemnation, Geotech |
080-, 080R-, 08P1-, 08P2-, 08P3-, 08SD- |
08STP-, 08WC-, BH08, CB-BH08-,
PC-BH-series |
| 2010-2012 |
CMMC |
DDH |
Pit 1, Pit 2, Pit 3, Saddle, Rifle |
CM Main |
271 |
35,407 |
100-, 10P2, 10P3-, 10PO-, 10RF-, 10SD- |
| Rifle, Oriole, Voight Zone |
110- |
| Voigt, Pit 2 |
11 VZ, 12P1-, 12P2-, 12 P3-, P2N-, P2P-series |
| Alabama, Virginia |
CM North |
101 |
7,939 |
11PA-, 11VE-, 12AB-series |
| 2015 |
CMMC |
DDH |
Virginia, Saddle Zone |
CM Main-North |
10 |
1,875 |
15SD-series, CM15VC-series |
| 2016 |
CMMC |
DDH |
Pit 2 |
CM Main |
18 |
5,125 |
16P2-series |
| 2017 |
CMMC |
DDH |
Pit 1, Pit 2 |
CM Main |
12 |
13,500 |
17P2-, CM17P1-series |
| Saddle Zone Pit 2 East |
20 |
17SD-series, CM17P2E-series |
| New Ingerbelle |
New Ingerbelle |
15 |
17IG-series |
| 2018 |
CMMC |
DDH |
Pit 3 East, Pit 3 East Geotech |
CM Main |
6 |
12,237 |
18P3-series,18P3GT-series |
| CMMC |
DDH |
New Ingerbelle |
New Ingerbelle |
29 |
18IG-series |
| 2019 |
CMMC |
DDH |
Pit 1, Pit 3, Pit 3 East |
CM Main |
28 |
14,609 |
19P1-, 19P3-; 19P3E-, 19PWS-series |
| New Ingerbelle |
New Ingerbelle |
5 |
19IGGT-series; 19IGHD-series |
| Alabama |
CM North |
32 |
19AB-series |
| 2020 |
CMMC |
RC |
Alabama, Pit 1, Pit 2, Pit 3 |
CM Main-North |
96 |
15,792 |
20ABRC-, 20RCP1-, 20CPS-2, 20RCP3-,
20P2-, 20D5P3-series |
| CMMC |
DDH |
New Ingerbelle |
New Ingerbelle |
6 |
20IG-series |
| Year |
Company |
Type |
Area |
Zone |
Number |
Metres |
Series |
| 2021 |
CMMC |
DDH |
Alabama |
CM North |
19 |
4,628 |
21AB- series |
| Pit 2, Pit 3 |
CM Main |
5 |
2,060 |
21P2- series, 21P3- series |
| New Ingerbelle |
New Ingerbelle |
43 |
19,979 |
21IG- series |
| RC |
Alabama |
CM North |
21 |
4,942 |
21ABRC- series |
| Mill Zone, Pit 3 |
CM Main |
76 |
14,093 |
21MZRC- series, 21P3RC-, 21P4RC-, 21ST4RC- series, 21MSRC- series |
| 2022 |
CMMC |
DDH |
Pit 3 |
CM Main |
6 |
2,703 |
22P3- series |
| New Ingerbelle |
New Ingerbelle |
18 |
8,413 |
22IG- series |
| RC |
Pit 3 |
CM Main |
30 |
5,010 |
22P4RC, 22P5RC-series |
| 2023 |
CMMC |
DDH |
Pit 1, Pit 2 |
CM Main |
3 |
2,115 |
CM-DD-series |
| New Ingerbelle |
New Ingerbelle |
4 |
4,322 |
| NW Zone |
CM North |
1 |
461 |
| RC |
Pit 3 |
CM Main |
29 |
4,188 |
CM-RC-series |
| DDH |
Pit 3 Geotech |
5 |
1,595 |
CM-GT-series |
| |
|
|
|
Total |
1,313 |
286,457 |
|
Figure 10-1: Isometric View of Drill Hole in the CM Main and CM North Zones

Source: Drill data (Hudbay, 2023), image (CMMC, 2022).
Notes: Isometric view looking northeast showing the Copper Mountain area and the distribution of drill hole collars by campaign. Drill holes are colour-coded by company: Yellow = Granby; Green = Newmont; Blue = Princeton Mining; and Red = Copper Mountain Mining.
10.2 Drilling Methods
The majority of historical drilling (1912-1996) at the CMM was diamond drilling, with some percussion holes drilled in the 1950s and RC holes drilled in 1994. Since 2007, the majority of the drilling has been diamond drilling. In 2020, RC drilling started in the CM Main and North areas to assist with further definition of the short-term mining plan.
A number of different drill-core diameters have been employed over the history of the mine, including BX (36.6 mm core diameter for historical underground), NQ (47.6 mm core diameter) and HQ (63.5 mm core diameter). From 2007 onwards, the standard method of drilling was to start all holes with HQ core and then reduce to NQ core at depth.
10.3 Geological Logging
Diamond core drill holes have been geologically logged for lithology, structure, alteration, vein types, and mineralization. The geological logging of RC chips is recorded using a modified logging template to capture the same major characteristics as the core logging. All drill core was logged prior to sampling.
10.4 Recovery
Core recovery was systematically recorded from the commencement of coring to end of hole, by reconciling against driller's depth blocks in each core box. Core recoveries are typically between 90% and 100% with isolated zones of lower recovery. No sample bias has been identified associated with core loss.
Core recoveries are typically between 90% and 100% with isolated zones of lower recovery associated with fault zones. Core loss is marked in the core box by the drillers at the time of drilling.
10.5 Collar Surveys
Historical collar surveys were surveyed by predecessor company survey staff using industry standard theodolite instrumentation to establish local grid control.
From 2007 to 2008 drill collar locations were surveyed by McElhanney Consulting Services Ltd., using a total station instrument and established property grid controls. For this period, the final drill-hole collar locations were surveyed by McElhanney using both a total station and a survey-quality Global Positioning System (GPS) instrument.
In 2009, the mine site survey department was created, and from that point onwards a Trimble R10 and R12 Total station GPS instrument have been used for surveying drill hole collar location.
10.6 Downhole Surveys
Downhole survey data are absent in pre-1960 holes. Deviation of historical holes is unknown; however most of the historical drilling (without downhole data) being used for Mineral Resource estimation comprises short underground holes where the amount of deflection is not likely to be significant.
Downhole dip data, presumably by acid tests, were included in drill data from 1960 to 1987. From 1988 to 1998, drill-hole surveys using a Pajari instrument, which provided both downhole azimuths and dips were available for these drill holes.
From drilling from 2007 onwards, downhole surveys were obtained using digital REFLEX instruments (or similar systems) which were compass based. Deviations in azimuth due to magnetite concentrations within alteration zones were rare and were removed from the survey data.
In 2023, downhole Reflex instruments were swapped for Gyro tooling (Axis Mining Systems) to remove any form of magnetic noise.
10.7 RC and Percussion Drilling
Between 1966 and 1970, Newmont Mining conducted an extensive percussion drilling program over what is now the CM Main Pit area. The program comprised 58,252 m of drilling which represents only 8% of the total drilled metres used to construct the mineral resource model. In addition, significant proportion of the volume drilled by percussion drilling has already been mined.
Since 2020, a total of 275 RC holes have been completed at the CMM.
In 2023, Hudbay conducted global comparisons of assay results obtained from RC drilling to closely located diamond drilling in order to confirm the absence of sampling bias between the two drilling techniques. The results from this analysis are summarized in Section 11.
10.8 Geotechnical and Hydrological Drilling
Geotechnical data were collected from 2008 and 2012 exploration drilling, including lithology, alteration, and unconfined compressive strength (UCS) measurements. This work was primarily focused on the eastern wall of Pit 3 at the time. In 2018, Golder & associates (Golder) carried out follow-up geotechnical and hydrogeological investigations in the same area.
More recently, in 2023, two geotechnical drilling programs were undertaken in the west wall of the CM Main Pit and the East wall of the New Ingerbelle Pit, respectively.
The CM Main Pit investigation included the following:
- Drilling six oriented HQ3 triple-tube diamond-cored boreholes
- Oriented geotechnical core logging of recovered core from the six diamond boreholes
- Collection of core samples for rock-mass testing.
Contractor Hardrock Drilling performed the work and HEG & Associates logged it.
The New Ingerbelle geotechnical drilling program was focused on collecting both geotechnical and hydrological information. The investigation included the following:
- Drilling three oriented HQ3 triple-tube diamond cored boreholes
- Oriented geotechnical core logging of recovered core from the three diamond boreholes
- Collecting core samples for rock-mass testing
- Performing packer tests
- Installing vibrating-wire (VW) piezometers
- Performing acoustic and optimal televiewer surveys.
Hardrock Drilling was the drilling contractor for New Ingerbelle; they carried out and assisted with the packer tests, piezometer installation, and televiewer surveys. SRK Consultants oversaw the geotechnical logging, packer tests, and VW piezometer installations, while WSP Consultants (WSP) personnel (formerly Golder) conducted the televiewer surveys.
10.9 Drill Coverage
Drill hole spacing varies throughout the deposit. Historical underground drilling was about 10 m to 30 m spacing. More recent drilling from 2007 onwards has an average drill-hole spacing of approximately 50 m by 50 m within the central portion of the CM Main, CM North, and New Ingerbelle Zones, with wider-spaced drilling in the more distal portions of the deposit.
Where possible, drill-hole orientations were designed to intersect mineralization perpendicular to the strike of the known mineralized trends and structures. In general, mineralization is vertical to sub-vertical in nature and therefore the majority of recent drilling was angled drilling to provide the best possible sample of mineralization. Where drill-rig access was limited due to steep topography, in-pit fill, historical stope or cave zones, or other operationally related reasons, then drill-hole orientations were more variable in order to drill-test specific target areas and maintain an appropriate drill-hole spacing.
10.10 Comments on Drilling
In the opinion of the QP, the quantity and quality of the logged geological data, collar, and downhole survey data collected in the exploration and infill drill programs are sufficient to support Mineral Resource and Mineral Reserve estimation. Drilling has generally been done at appropriately spaced intervals and is considered representative of the deposit. Drilling was not specifically targeted to the high-grade portions of the deposits; rather, a relatively uniform drill spacing has been achieved across the deposit.
11 Sample Preparation, Analyses, and Security
Hudbay's QP, Olivier Tavchandjian, P.Geo., reviewed sample preparation, analysis, and security procedures. The sampling methodology, analyses, and security measures used previously at CMM have been documented in detail in a previous technical report (Redmond et al., 2022, September 30). Section 12 provides a reassessment of the available quality assurance and quality control (QA/QC) data pertinent to the processes used for the sampling and analysis during the drilling campaigns performed at CMM since 2007. Although historical documentation of drilling campaigns prior to 2007 is scarce, the nature and execution of program sampling data and results indicates that drilling and sampling methodology were designed and collected in a professional manner, and that no material bias exists before or after the 2007 programs. Hudbay conducted a global comparison between two of the main methods of drilling used at CM to ensure no global bias between methods of sampling (i.e., diamond drilling and RC drilling).Contribution from percussion drilling to the 2023 Mineral Resource estimates is deemed to be much less significant than from diamond and RC drilling (they constitute only 8% of the entire database and mostly pre-date modern drilling campaigns-i.e., pre-2007).
11.1 Sampling Methods
All exploration drilling before 2007 is considered historical.
11.1.1 Historical Drilling
Geological employees of large, professional, international mining companies Granby, Newmont Mining, and Princeton Mining ostensibly used professional sampling techniques for pre-2007 sampling. No reports detailing the sampling methods, analyses, or security procedures that the previous operators used were available to the authors for review; however, the organization and level of detail in drill logs, assay sheets, plans, sections, and other historical documents indicate a careful and professional approach to data collection and management.
Most of the historical samples documented in this report were collected between 1930 and 1996, and analyzed at the mine laboratory, which would have been checked primarily by the mill balance and production records. Some historical drill core is preserved on the property, and from this it is inferred that a majority of the older diamond drilling was BQ diameter sampled by splitting with a manual hammer splitter. The actual details of the sampling methods, as well as the approach the individual companies selected to complete the various sampling programs are not available to the authors. Such details were generally not recorded in internal company reports, as methodologies were standard, with little variation from year to year. Historical drill logs with recorded assay results are available for most of the historical drill holes
11.1.2 Diamond and Reverse-Circulation Drilling
Diamond drill core was geologically logged, and sample selections were determined based on visual observation of mineralization. Sample intervals were marked on the core, and assay tags were stapled onto the core boxes. Core was photographed in the boxes and moved to the cutting area, where it was cut in half using a manual diamond-bladed saw. Sample lengths were usually 3 m for NQ core and 2 m for HQ core, but either may be shorter depending on geological or mineralogical boundaries. Cut core was placed in plastic bags, sealed with a cable tie, and exploration staff transported it to the CMM laboratory or an external laboratory for sample preparation and analysis.
RC drilling was first undertaken in 1994 with a 29-hole program on the Alabama claim at the Copper Mountain North Zone. Since that time, RC drilling within the Copper Mountain Main and Copper Mountain North Zones was carried out between 2020 and 2023 as part of an infill drilling program designed to upgrade resource classification and support detailed mine planning. RC samples were collected in continuous 3 m intervals and reduced to approximately 12.5% of the original sample size to provide an appropriate sample size for sample preparation and analysis at the CMM laboratory. Sample reduction was carried out at the drill either by using a rotary wet splitter on the RC rig or by splitting the sample on a riffle splitter. Samples for analysis were collected in pre-numbered bags along with a corresponding Tyvek sample tag and were then sealed with a cable tie. At the end of each 12-hour shift, company geologists collected the samples and transported them to the CMM laboratory for processing, where they were placed in a secure location inside the laboratory. A small subsample of material was taken from every 3 m sample, washed, and placed in a plastic chip tray for geological logging. Chip trays were photographed and archived at the mine.
As the diamond drilling and RC drilling methods represent respectively 55% and 35% of the drilling database, the following methodology was used to assess whether a global bias could be identified between the two methods of sampling. The following approach was adopted:
-
Create a block model using a nearest-neighbor (NN) interpolant, recording for each block the closest copper grade-estimate from the closest diamond drilling and RC drilling composites. Original samples were composited to 15 m (bench height) for the purpose of this exercise to eliminate noise from very small samples.
-
Retain and compare only the block estimates that were within 20 m of a diamond drill hole and an RC hole in the North Zone and 40 m in the South Zone. These distances of comparison constitute a compromise between having samples close enough to one another for comparison and having a meaningful number of pairs (~475 pairs in both cases).
Between the zones the mean copper grade differed by less than 2%. It was not deemed necessary to test also for gold and silver, as these elements are calculated from global regression formulae by domain from the copper grade with which they are strongly correlated.
11.2 Density (Specific Gravity) Determinations
The historical tonnage conversion factor used at Copper Mountain was 2.80 t/m3, which was used for all rock types and resulted in reasonable reconciliation with historical mine production.
During the 2007-2008 drilling campaign, 308 density measurements were made using the weigh-in-air/weigh-in-water technique. Samples were whole or split core, with dry weights between 500 g and 1,000 g. Samples were selected from drill holes, and their location and lithology, alteration, and mineralization type recorded. Selected samples were geologically competent, with no vugs or fractures, so coating the samples was deemed unnecessary. The average density of the 308 samples is 2.80 (range 2.61 to 2.96). A table of rock types with specific gravity (SG) measurements is available in Giroux and Holbek (2009).
In 2022, an additional 1,365 density measurements were made on core samples from 34 diamond drill holes. Twenty-seven of these drill holes were from the 2021-2022 drill campaign, while the remainder were from 2017-2020 drill holes. Isolated areas of notable core deterioration and oxidation were avoided. Measurements were taken on a mixture of half and whole core, with an average measurement length of 24 cm and an average spacing of 10.2 m downhole. A range of lithology, alteration, and mineralization types were measured, with each measurement taken from core deemed visually representative of the approximately 10 m interval. Density measurements were made using the weigh-in-air/weigh-in-water technique. The weight in water of the samples stabilized quickly, and no air bubbles were observed from the samples. QA/QC was maintained by measuring a piece of aluminum- or chrome-coated steel of known weight at the beginning of each batch of samples to confirm scale accuracy. Results indicate an average density of 2.80 very similar to the average value of 2.78 used for mineral resource and mineral reserve estimation (range of 2.44-3.96, with a single, high outlier of 5.11).
11.3 Analytical and Test Laboratories
Table 11-1 provides a list of the analytical laboratories used from 2007 through 2022. The CMM laboratory was used for sample preparation and primary copper and silver analysis of diamond drill core and RC samples from 2012 to 2022. Throughout this time, primary gold analysis and check analysis for copper and silver were carried out at a number of different independent laboratories. Starting in March 2022, sample preparation and primary analysis for copper, gold, and silver were carried out at MSALABS, and the analytical suite was expanded to 48 elements to support mineralization- and waste-characterization studies, and for trace-element vectoring to guide exploration targeting.
Table 11-1: Sample Preparation and Analytical Laboratories
|
Program
|
Sample Preparation and
Primary Analysis
|
Check Cu and Ag,
Plus Primary Au Analysis
|
|
Pre-2007
|
Similco Mine Laboratory
|
None
|
|
2007
|
Pioneer
|
IPL
|
|
2008
|
Pioneer and Ecotech
|
ALS Chemex
|
|
2010
|
Pioneer
|
None1
|
|
2011
|
Pioneer
|
None1
|
|
2012
|
CMM laboratory
|
Pioneer
|
|
2015
|
CMM laboratory
|
None1
|
|
2016
|
CMM laboratory
|
Pioneer
|
|
2017
|
CMM laboratory
|
Pioneer
|
|
2018
|
CMM laboratory
|
ALS Chemex
|
|
2019
|
CMM laboratory
|
ALS Chemex
|
|
2020
|
CMM laboratory
|
ALS Chemex
|
|
2021
|
CMM laboratory
|
Actlabs
|
|
2022
|
CMM laboratory and MSALABS2
|
Actlabs and MSALABS
|
|
2023
|
MSALABS
|
None3
|
Notes: 1 Relatively small drill programs in these years.
2 Twelve holes from the final phase of the 2022 drilling program.
3 All primary samples sent to independent laboratory as of 2023. |
11.3.1 Laboratory Accreditation
Table 11-2 summarizes laboratory accreditation information.
Table 11-2: Laboratory Location and Accreditation
|
Laboratory
|
Independent
|
Accreditation
|
|
IPL, Vancouver, B.C.
|
Yes
|
ISO9001 accreditation for quality management systems
|
|
Pioneer, Richmond, B.C.
|
Yes
|
Not accredited
|
|
Ecotech labs, Kamloops, B.C.
|
Yes
|
ISO9001 accreditation for quality management systems
|
|
CMM Laboratory
|
No
|
Not accredited
|
|
ALS Chemex, Vancouver, B.C.
|
Yes
|
ISO 17025:2017 accreditation for competence of testing and calibration laboratories.
|
|
Actlabs, Kamloops, B.C.
|
Yes
|
ISO9001 accreditation for quality management systems, and ISO 17025:2017 accreditation for competence of testing and calibration laboratories.
|
|
MSALABS, Langley, B.C.
|
Yes
|
ISO9001 accreditation for quality management systems, and ISO 17025:2017 accreditation for competence of testing and calibration laboratories.
|
11.4 Sample Preparation and Analysis
Sample preparation methods have included crushing and pulverizing; however, the crush and pulverization sizing has changed slightly over time. Currently, the protocol is to crush to 70% passing (P70) a −10 mesh (<2 mm) sieve and pulverize to P85 −200 mesh (<75 µm). Aqua regia digestion has been the standard digestion method since 2007. Analytical methods have been primarily by atomic absorption spectroscopy (AAS) for copper and silver, and fire assay/ICP finish for gold. The CMM laboratory also carried out initial copper analysis of samples using X-ray fluorescence (XRF), with all samples returning >0.1% Cu subsequently analyzed using AAS. Multi-element suites were determined for selected samples from 2007 to early 2022, and for all exploration samples submitted to MSALABS (starting in March 2022); these multi-element analyses are reported using ICP methods.
11.5 Quality Assurance and Quality Control
QA/QC for historical data (pre-2007) and 2007-2023 are provided below, with details of drilling programs from 2007 to 2023 which included QA/QC material (standards and blanks) to validate the analytical and preparation protocols used by the different analytical laboratories in these drilling campaigns. To some extent these data have also been used to broadly validate the historical drill-hole data lacking QA/QC material. QA/QC procedures at Copper Mountain have varied since 2007. A summary of the analytical labs, preparation procedures, and insertion rates of QA/QC materials (e.g., preparation coarse blank and standards) for the period 2007 to 2023 are summarized in Table 11-3. Also included in this table is a breakdown of the relative proportions of each program in terms of its contribution to the assay data used in the current mineral resource model. Finally, we provide a review of the CMM laboratory QA/QC data from 2012 to 2022.
Table 11-3: Summary of CMM QA/QC from 2007 to 2023
|
Year
|
Pre-2007
|
2007
|
2008
|
2009
|
2010
|
2011
|
2012
|
2015
|
2016
|
2017
|
2018
|
2019
|
2020
|
2021
|
2022
|
2022
|
2023
|
|
Number of Samples
|
177,110
|
13,330
|
10,876
|
-
|
3,139
|
924
|
5,169
|
274
|
1,278
|
3,399
|
3,398
|
4,476
|
4,833
|
14,576
|
3,204
|
1,600
|
3,851
|
|
Assaying Laboratory
|
-
|
Pioneer & Ecotech
|
Pioneer & Ecotech
|
Pioneer
|
Pioneer
|
Pioneer
|
CMM
|
CMM
|
CMM & Ecotech
|
CMM
|
CMM
|
CMM
|
CMM
|
CMM
|
CMM
|
MSALABS
|
MSALABS
|
|
Assaying Method
|
n/a
|
AA
|
AA
|
AA
|
AA
|
AA
|
AA & XRF
|
AA & XRF
|
AA & XRF
|
AA & XRF
|
AA & XRF
|
AA & XRF
|
AA & XRF
|
AA & XRF
|
AA & XRF,
ICP-AES/MS, AA
|
ICP-AES/MS, AA
|
ICP-AES/MS, AA
|
|
QA/QC Program Samples
|
n/a
|
Yes
|
Yes
|
Yes
|
Yes
|
No
|
Yes
|
No
|
Yes
|
Yes
|
Yes
|
Yes
|
Yes
|
Yes
|
No
|
Yes
|
Yes
|
|
Blank
|
306
|
201
|
None
|
45
|
-
|
66
|
None
|
4
|
16
|
52
|
55
|
18
|
1
|
None
|
None
|
238
|
|
Coarse Duplicates
|
None
|
None
|
None
|
None
|
None
|
None
|
None
|
None
|
None
|
None
|
None
|
None
|
None
|
None
|
None
|
207
|
|
Standards
|
395
|
206
|
-
|
45
|
-
|
74
|
None
|
-
|
-
|
-
|
-
|
-
|
-
|
-
|
-
|
227
|
|
Check Assays
(Umpire Laboratory)
|
None
|
None
|
None
|
None
|
None
|
Pioneer
|
None
|
Pioneer
|
Pioneer
|
ALS
|
ALS
|
ALS
|
Act Labs
|
Act Labs,
MSALABS
|
None
|
Pending
|
|
Check Assays
(Number Cu checks)
|
None
|
None
|
None
|
None
|
None
|
194
|
None
|
149
|
98
|
134
|
204
|
48
|
169
|
Act Labs: 4
MSALABS: 556
|
135
|
Pending
|
|
QA/QC Program Sample Total
|
-
|
701
|
407
|
0
|
90
|
0
|
334
|
0
|
153
|
114
|
186
|
259
|
66
|
170
|
560
|
135
|
465
|
|
Twin Holes & Correction Factors
|
n/a
|
None
|
None
|
None
|
None
|
None
|
None
|
None
|
None
|
None
|
None
|
None
|
None
|
None
|
None
|
None
|
None
|
11.5.1 Historical Data (Pre-2007)
To date, Hudbay has no information related to QA/QC procedures carried at CMM for historical (pre-2007) analytical data (Table 11-1). To the authors' knowledge, these historical data were obtained and compiled by major mining companies for mine design and production. Therefore, it is inferred that the pre-2007 data were acquired following what were industry-standard analytical protocols at that time. Historical drill-hole data are also supported by more than 11 years of reconciled copper production and operational data. No significant issues have been noted during the reconciliation between resource models prior to 2021 and those based on the current model. The differences in reconciliation observed during 2021-2023 under previous ownership at CMM are deemed related to the resource modelling process and not to the supporting data once properly filtered and validated.
11.5.2 2007-2023 QA/QA Control Program
QA/QC measures adopted for the 2007-2016 drilling campaigns included submitting non-certified coarse blanks and certified reference material (standard), with the exception of a small drilling program in 2011. The QA/QC insertion rates consisted of 2.2% coarse blanks and 2.2% certified reference material (CRM). From 2017-2020, QA/QC measures included the submission of CRMs at an insertion rate of 1.4%, with no coarse blanks included. From 2021 to early 2022, QA/QC measures did not include submitting CRMs or coarse blanks; however, during this time, the CMM laboratory continued to insert CRMs into the analytical sample stream at an insertion rate of 5% for both XRF and AAS analyses. This QA/QC measure had been in place at the CMM laboratory from 2013 to 2022. From March 2022, sample preparation and primary analysis for exploration samples was carried out at MSALABS, and QA/QC measures included submitting coarse blanks, CRMs, and half-core duplicates, with an insertion rate of 5% for coarse blanks, 5% for CRMs, and 3.9% for half-core duplicates. MSALABS also carried out coarse-crush duplicate analyses, at a rate of 3.2%. Review of the QA/QC data indicates that although there were batches that indicated QA/QC failures, after resubmitting the outlier samples to the laboratory, the resulting re-assay data were acceptable. A summary of the QA/QC insertion procedures for the drilling programs at the CMM is presented in Table 11-4.
The QA/QC materials consisted of:
-
Blanks-coarse (or preparation) blank material varied through time and included drill core from felsic mine dykes (post mineralization, barren), and since 2022, crushed barren granite.
-
CRMs-between 2007 and 2016 CMM used nine separate CRMs purchased from CDN Resources Laboratories Ltd. In 2022, an additional five CRMs purchased from Ore Research and Exploration (OREAS) were used. For total copper, the CRMs are certified by four-acid digestion with an AA or ICP finish, and for gold by fire assay with an AA or ICP finish. The CMM laboratory has used several different CRMs since 2010, including CRMs purchased from the Natural Resource Canada's Canadian Certified Reference Material Project, WCM Minerals, and OREAS.
Table 11-4: Blank and CRM Insertion Procedures from 2007 to 2023
|
Program
|
Total Assays
|
Total Assays
(%)
|
Sample
Preparation Blanks
|
CRMs
|
CMM Laboratory
CRMs
|
Primary Laboratory
|
|
2007
|
13,330
|
17.9
|
Inserted
|
Inserted
|
Not applicable
|
Pioneer and Ecotech
|
|
2008
|
10,876
|
14.6
|
Inserted
|
Inserted
|
Not applicable
|
Pioneer and Ecotech
|
|
2010
|
3,139
|
4.2
|
Inserted
|
Inserted
|
Not applicable
|
Pioneer
|
|
2011
|
924
|
1.2
|
Not inserted
|
Not inserted
|
Not applicable
|
Pioneer
|
|
2012
|
5,169
|
7
|
Inserted
|
Inserted
|
Inserted
|
CMM laboratory
|
|
2015
|
274
|
0.4
|
Inserted
|
Inserted
|
Inserted
|
CMM laboratory
|
|
2016
|
1,278
|
1.7
|
Inserted
|
Inserted
|
Inserted
|
CMM laboratory
|
|
2017
|
3,399
|
4.6
|
Inserted
|
Not inserted
|
Inserted
|
CMM laboratory
|
|
2018
|
3,398
|
4.6
|
Inserted
|
Not inserted
|
Inserted
|
CMM laboratory
|
|
2019
|
4,476
|
6
|
Inserted
|
Not inserted
|
Inserted
|
CMM laboratory
|
|
2020
|
4,833
|
6.5
|
Inserted
|
Not inserted
|
Inserted
|
CMM laboratory
|
|
2021
|
14,576
|
19.6
|
Not inserted
|
Not inserted
|
Inserted
|
CMM laboratory
|
|
2022
|
4,804
|
6.5
|
Inserted
|
Not inserted
|
Inserted
|
CMM laboratory/MSALABS
|
|
2023
|
3,851
|
5.2
|
Inserted
|
Inserted
|
Not applicable
|
MSALABS
|
|
Total
|
74,327
|
100.0
|
|
|
|
|
Notes: As of 2023, all assays are sent off site to an independent laboratory for prep and assaying.
11.5.2.1 QA/QC Data Analysis (Standards)
The following results are based on the QA/QC data for the period 2007-2023, based on the insertion rates stated above, which the CMM senior project geologist validated and exported from the MX Deposit database. This discussion will focus on QA/QC data from Pioneer and MSALABS, as they represent proportionally the most significant QA/QC data sets compared to Ecotech and the CMM laboratory. Considering the final date of completion reported for the certificates in the database, the Pioneer data cover mainly 2007 to 2008, with lesser samples from 2012, whereas the MSALABS data represent the most recent QA/QC data for the 2022 drilling program, reported in 2023.
The threshold for CRM failure due to analytical bias was recorded based on the certified best value (CBV) and standard deviation (SD) reported for each certificate (Table 11-6) and analyzed at each laboratory.
-
The CRM assay values were accepted when within CBV ± 2 SD and isolated values between CBV ± 2 SD and CBV ± 3 SD. The CRM assay values outside CBV ± 3 SD were considered failures.
-
The absolute analytical bias was estimated based on the CBV and SD of the assayed CRMs (Table 11-6) with respect to the laboratory mean for the analyzed CRMs.
The relative bias for element of interest is evaluated using the following equation:
| |
Bias (%) =100×[(Aveo/CBV)-1] |
(1) |
where Aveo is the average assay values excluding outliers (i.e., values outside AV ± 3 SD), and CBV is the certified best value as indicated in Table 11-5. Acceptable analytical bias corresponds to the following ranges: good, ±5%; acceptable from ±5% to ±10%; unacceptable, values above ±10%.
At present it is not clear what protocol was used for a failed CRM between 2007 and 2012 (e.g., number of samples reanalyzed before and following the failed CRM, or re-assay of the whole tray in case of repeated failure, and if any such case was required). It is therefore assumed that the certificates corresponding to the failed CRM and associated samples were re-assayed and reviewed, and the corrected values were incorporated into the existing database at that time.
The standards were prepared by CDN Resource Laboratories and OREAS laboratories. Table 11-5 presents the CBVs for each CRM. Based on the results presented in Table 11-6, no significant analytical biases were observed for copper and gold. For Pioneer, bias for copper was considered good, ranging from −1.1% to 5.0%-except for standard CDN-CGS-12, with a slightly more elevated bias of 6.7%, which decreases to 4.8% upon removal of one outlier, and therefore can also be considered of good quality. For MSALABS the bias for copper was nominal, in the range of −0.9% to 0%. Therefore, the values for copper that Pioneer and MSALABS reported for 2007-2008 and 2022, respectively can be considered of good quality and accepted with confidence for resource modelling. For gold, the bias data from Pioneer is of good quality, ranging from −5.2% to 5.0% upon removing four extreme outliers from standards CDN-CGS-10, CDN-CGS-11, and CDN-CGS-13. The exception is standard CDN-CGS-8, which yielded a bias of 11.3%, equivalent to 9 ppb. This can also be considered acceptable given that the CBV for gold in that standard is provisional. At MSALABS the bias for gold was minor, ranging from −3.9% to 0.6%. In sum, the data for gold from Pioneer and MSALABS is of good quality and can also be accepted with confidence for resource modelling.
Table 11-5: CRMs Used from 2007-2023
|
Year
|
Name in Tables
|
Standard
|
%Cu
|
g/t Au
|
g/t Ag
|
Labs
|
|
%
|
SD
|
g/t
|
SD
|
g/t
|
SD
|
|
2007-2012
|
Standard A
|
CDN-CGS-7
|
1.01
|
0.07
|
0.95
|
0.08
|
-
|
-
|
Pioneer, MSALABS, Ecotech,
Mine Laboratory, (Similco Historical)
|
|
Standard B
|
CDN-CGS-9
|
0.473
|
0.025
|
0.34
|
0.034
|
-
|
-
|
|
Standard C
|
CDN-CGS-11
|
0.683
|
0.026
|
0.73
|
0.068
|
-
|
-
|
|
Standard D
|
CDN-CGS-12
|
0.265
|
0.015
|
0.29
|
0.04
|
-
|
-
|
|
Standard E
|
CDN-CGS-8
|
0.105
|
0.008
|
0.08
|
0.012
|
-
|
-
|
|
Standard F
|
CDN-CGS-10
|
1.55
|
0.07
|
1.73
|
0.15
|
-
|
-
|
|
Standard G
|
CDN-CGS-13
|
0.329
|
0.018
|
1.01
|
0.11
|
-
|
-
|
|
Standard CM-16
|
CDN-CM-16
|
0.184
|
0.014
|
0.294
|
0.046
|
-
|
-
|
|
Standard ME-8
|
CDN-ME-8
|
0.103
|
0.008
|
0.093
|
0.018
|
-
|
-
|
|
2022-2023
|
OREAS 501d
|
OREAS 501d
|
0.272
|
0.009
|
0.232
|
0.011
|
-
|
-
|
MSALABS
|
|
OREAS 503d
|
OREAS 503d
|
0.524
|
0.01
|
0.666
|
0.015
|
-
|
-
|
|
OREAS 505
|
OREAS 505
|
0.321
|
0.008
|
0.555
|
0.014
|
-
|
-
|
|
OREAS 506
|
OREAS 506
|
0.444
|
0.01
|
0.364
|
0.01
|
-
|
-
|
|
OREAS 507
|
OREAS 507
|
0.622
|
0.013
|
0.176
|
0.006
|
-
|
-
|
|
2013-2023
|
CCu-1d
|
CCu-1d
|
23.93
|
0.29
|
14.01
|
0.34
|
120.70
|
2.20
|
Mine Laboratory
|
|
Cu160
|
Cu160
|
0.35
|
0.01
|
2.84
|
0.09
|
48.50
|
1.67
|
|
Cu188
|
Cu188
|
0.18
|
0.01
|
0.40
|
0.02
|
0.18
|
0.01
|
|
Cu199
|
Cu199
|
0.36
|
0.01
|
0.83
|
0.04
|
0.36
|
0.01
|
|
CH-4
|
CH-4
|
0.20
|
0.01
|
0.88
|
0.04
|
2.10
|
0.20
|
|
DS-1
|
DS-1
|
0.00
|
0.00
|
32.59
|
0.56
|
0.47
|
0.06
|
Table 11-6: Summary of CRM Performance for Drill Programs 2007-2023
|
Laboratory
|
Element
|
Standard
|
No. of
Samples
|
No. of
Failures
|
Failure
Rate
(%)
|
CRM
Value
|
Laboratory
Average
|
Relative
Bias
(%)
|
Bias
Excluding
Outliers
|
Max.
Value
Reported
|
|
Pioneer
|
Cu (%)
|
CDN-CGS-7
|
52
|
1
|
2
|
1.010
|
1.01
|
0.2
|
2.2
|
1.06
|
|
CDN-CGS-8
|
86
|
0
|
0
|
0.105
|
0.11
|
1.9
|
-
|
0.12
|
|
CDN-CGS-9
|
89
|
0
|
0
|
0.473
|
0.50
|
4.9
|
-
|
0.52
|
|
CDN-CGS-10
|
35
|
0
|
0
|
1.550
|
1.56
|
0.5
|
-
|
1.59
|
|
CDN-CGS-11
|
85
|
2
|
2
|
0.683
|
0.70
|
1.9
|
3.7
|
0.75
|
|
CDN-CGS-12
|
83
|
1
|
1
|
0.265
|
0.28
|
6.7
|
4.8
|
0.7
|
|
CDN-CGS-13
|
31
|
1
|
3
|
0.329
|
0.32
|
−1.5
|
0.6
|
0.34
|
|
CDN-CM-16
|
1
|
0
|
0
|
0.184
|
0.18
|
−1.1
|
-
|
0.18
|
|
CDN-ME-8
|
-
|
-
|
-
|
0.103
|
-
|
-
|
-
|
-
|
|
Au (g/t)
|
CDN-CGS-7
|
13
|
2
|
15
|
0.950
|
0.93
|
−1.8
|
−3.0
|
1.72
|
|
CDN-CGS-8
|
52
|
0
|
0
|
0.080
|
0.09
|
11.3
|
-
|
0.1
|
|
CDN-CGS-9
|
60
|
0
|
0
|
0.340
|
0.34
|
1.0
|
-
|
0.38
|
|
CDN-CGS-10
|
38
|
1
|
3
|
1.730
|
4.88
|
181.8
|
−0.8
|
121.75
|
|
CDN-CGS-11
|
53
|
2
|
4
|
0.730
|
2.98
|
308.2
|
−0.2
|
120.7
|
|
CDN-CGS-12
|
57
|
1
|
2
|
0.290
|
0.30
|
5.0
|
2.5
|
0.71
|
|
CDN-CGS-13
|
28
|
2
|
7
|
1.010
|
0.96
|
−5.2
|
0.6
|
1.05
|
|
CDN-CM-16
|
4
|
0
|
0
|
0.294
|
0.30
|
2.9
|
-
|
0.31
|
|
CDN-ME-8
|
4
|
0
|
0
|
0.093
|
0.09
|
−0.5
|
-
|
0.1
|
|
MSALABS
|
Cu (%)
|
OREAS 501d
|
86
|
1
|
1
|
0.272
|
0.27
|
−0.5
|
−0.7
|
0.327
|
|
OREAS 503d
|
4
|
0
|
0
|
0.524
|
0.52
|
−0.7
|
-
|
0.525
|
|
OREAS 505
|
20
|
0
|
0
|
0.321
|
0.32
|
0.0
|
-
|
0.342
|
|
OREAS 506
|
11
|
0
|
0
|
0.444
|
0.44
|
−0.9
|
-
|
0.456
|
|
OREAS 507
|
13
|
0
|
0
|
0.622
|
0.62
|
0.0
|
-
|
0.642
|
|
Au (g/t)
|
OREAS 501d
|
86
|
1
|
1
|
0.232
|
0.23
|
0.1
|
−1.4
|
0.537
|
|
OREAS 503d
|
4
|
0
|
0
|
0.666
|
0.66
|
−0.3
|
-
|
0.682
|
|
OREAS 505
|
20
|
0
|
0
|
0.550
|
0.55
|
0.6
|
-
|
0.579
|
|
OREAS 506
|
11
|
0
|
0
|
0.364
|
0.36
|
−1.1
|
-
|
0.380
|
|
OREAS 507
|
13
|
0
|
0
|
0.176
|
0.17
|
−3.9
|
-
|
0.179
|
11.5.2.2 QA/QC Data Analysis (Blanks)
Blank material was introduced in the sample stream to monitor cross-contamination during sample preparation. Non-certified blanks consisted of late-stage barren felsite mine dyke material (i.e., post-mineralization dyke blank). Pioneer analyzed the majority of blank material data available for copper during 2007-2008, followed by the CMM laboratory during 2012 and 2016-2020, and fewer samples from Ecotech in 2008 (Table 11-7). The data for gold are proportionally less abundant, with most of the data derived from the CMM laboratory.
The failure threshold was estimated based on the long-term average excluding outliers as reported by the different analytical labs (0.0023% Cu with SD = 0.0025%, 0.0077 g/t Au with SD = 0.0035). However, it is uncertain at this time if the analyzed post-mineralization dyke blank material was derived from a single batch, or multiple batches of material prepared and analyzed over time. To further constrain the data, a practical threshold value with respect to the background levels of the upper continental crust (UCC) for copper (5 x UCC = 0.038%) and gold (10 x UCC = 10 ppb) was also considered for comparison. The observed blank failures due to potential cross-contamination during sample preparation was nominal (i.e., carry-over from preceding high-grade samples). Most failures above the postulated threshold for copper were observed for the mine laboratory (33 of 99 samples) and the Similco laboratory (40 of 383 samples) (Table 11-7). At present there is uncertainty about the size of the blank material used in the analysis compared to the drill-core sample size, to quantify more precisely the analytical carry-over. In the case of blank-failures above the established limit of rejection, it is also uncertain whether the blank was reanalyzed together with the preceding and following samples, following the same preparation and analytical protocols as the original samples. Although these samples represent valid blank data, to date a link between certificates and the analytical laboratory have not been established. The failure rate for the blank material analyzed for gold at the CMM laboratory was moderate (6.9%), with a somewhat elevated average contamination driven by three extreme outliers.
Taken as whole, the copper and gold data for the blank material indicate that the failure rate and average levels of contamination at Pioneer, CMM laboratory, and Ecotech were not significant.
Table 11-7: Summary of Blank Performance for Drill Programs 2007-2023
|
Post Mineralized
Dyke Blank
|
Element
|
No. of
Blanks
|
Failed
Blanks
|
Failure Rate
(%)
|
Maximum
Contamination
|
Average
Contamination
|
Period
|
|
Pioneer
|
Cu (%)
|
290
|
4
|
1.4
|
0.150
|
0.038
|
2007-2008
|
|
Au (g/t)
|
8
|
4
|
50.0
|
1.722
|
0.687
|
|
Mine Laboratory
|
Cu (%)
|
99
|
33
|
33.3
|
1.650
|
0.075
|
2012,
2016-2020
|
|
Au (g/t)
|
87
|
6
|
6.9
|
1.722
|
0.877
|
|
Ecotech
|
Cu (%)
|
24
|
1
|
4.2
|
0.003
|
0.003
|
2008
|
|
Au (g/t)
|
2
|
1
|
50.0
|
0.852
|
0.852
|
|
MSALABS
|
Cu (%)
|
1
|
0
|
0.0
|
-
|
-
|
2022
|
|
Au (g/t)
|
1
|
0
|
0.0
|
-
|
-
|
|
Similco Historical
|
Cu (%)
|
383
|
40
|
10.4
|
1.511
|
0.054
|
-
|
|
Au (g/t)
|
76
|
1
|
1.3
|
1.662
|
1.662
|
11.5.2.3 QA/QC Data Analysis (Review of the CMM Laboratory QA/QC Data from 2012 to 2022)
A suite of four CRMs for copper and three CRMs for silver were consistently inserted into the sample stream at the CMM laboratory from 2013 to 2023 (Table 11-8). The exception is Cu160, which was inserted only during 2013-2014. A few Cu160 standards were also inserted in 2023. The standards used internally at the CMM laboratory present a representative range of copper and silver concentrations, and were analyzed using AA. The standards were prepared, analyzed, and certified by the CANMET Mining and Mineral Sciences Laboratories and WCM minerals. CBVs for each CRM are presented in Table 11-5. Preparation blanks have not been analyzed. However, tap water for the AA and an empty cell (i.e., air) for the XRF have been used routinely as blanks for monitoring baseline instrumental measurements. The threshold for CRM failure and analytical bias was estimated following the same parameters mentioned.
Based on the results presented in Table 11-8, no significant analytical biases were observed for copper (−0.8% to 0.3%) with respect to the CRM's certified best values, with only a nominal number of outliers observed for Cu160 (n = 9), which mainly occurred in 2023. These samples failed below the certified best value −3 SD (CBV −3 SD) (Table 11-5) and may indicate improper dissolution of the CRM material, or alternatively a CRM switch for Cu188 (Cu = 0.18%) that needs verification. Upon removing these nine outliers the bias changed slightly from −0.8% to 0.4%. In general, bias remained steady from 2013 to 2023 irrespective of the CRM. For instance, for CRM Cu199 the average bias during 2014 was 0.2%, and it remained almost unchanged during 2023 (0.1%). These values are close to the overall level of bias for 2013 to 2023 (−0.1%). Similarly, CCu-1d changed only slightly, too, with respect to the overall bias from 2013 to 2023 (close to 0%) from 2013 (0.4%) through 2017 (0.02%) to 2023 (−0.03%).
For the three silver standards (Table 11-8) the analytical bias was low and the number of failures nominal. However, DS-1 showed a somewhat more elevated, but still acceptable, bias of 3.1% with respect to the other two CRMs. Similar to the copper CRMs, the silver bias changed only slightly over time. For instance, CCu-1d changed from 2013 (1.1%), through 2017 (0.3%) to 2023 (0.3%).
In sum, based on the above CRM analyses, the data for copper and silver from the Mine's laboratory are good quality and can be confidently accepted for resource modelling.
Table 11-8: Summary of CRM Performance for Copper Mountain Mine Laboratory 2012-2022
|
Laboratory
|
Element
|
Standard
|
No. of
Samples
|
No. of
Failures
|
Failure Rate
(%)
|
CRM
Value
|
Laboratory
Average
|
Relative
Bias
(%)
|
Bias Excluding
Outliers
(%)
|
Max. Value
Reported
|
|
Mine Laboratory
|
Cu (%)
|
CCu-1d
|
3,719
|
0
|
0.0
|
23.930
|
23.92
|
0.0
|
-
|
24.59
|
|
Cu160
|
245
|
9
|
3.7
|
0.350
|
0.35
|
−0.8
|
0.4
|
0.398
|
|
Cu188
|
3,394
|
0
|
0.0
|
0.179
|
0.18
|
0.3
|
-
|
0.194
|
|
Cu199
|
3,392
|
1
|
0.0
|
0.360
|
0.36
|
−0.1
|
−0.1
|
1.59
|
|
Ag (g/t)
|
CCu-1d
|
3,665
|
5
|
0.1
|
120.700
|
121.15
|
0.4
|
0.4
|
200
|
|
CH-4
|
3,563
|
1
|
0.0
|
2.100
|
2.11
|
0.7
|
0.7
|
2.39
|
|
DS-1
|
3,511
|
1
|
0.0
|
0.470
|
0.48
|
3.1
|
3.0
|
2.04
|
11.6 Check and Re-Assay Programs
The quality of information on check and re-assay programs is variable, with no historical information prior to 2007, and considerably more in the intervening years.
11.6.1 Check Assays
No information is available on check or re-assay programs prior to 2007. Since 2007, an independent check-assay procedure has been in place for samples analyzed for copper and silver at external laboratories from 2007-2010 and at the CMM laboratory from 2012-2022. Pulps from samples that returned >0.1% Cu in the CMM laboratory were routinely sent to an independent laboratory for gold analysis, and on average 10% of these sample pulps were also analyzed for copper and silver. These check assays have been carried out at number of different independent laboratories, as listed in Table 11-1. Check assay results indicate that sample analysis at the CCM laboratory is acceptable.
11.6.2 External Check-Assays Results
A total of 1,012 existing pulp samples previously analyzed for copper at the CMM laboratory (i.e., Primary Laboratory) was dispatched to three secondary (i.e., umpire) laboratories (Table 11-9): Pioneer (n = 194 and n = 255), ALS (n = 390) and Actlabs (n = 173). These pulp samples are from the analytical programs in 2012, 2016-2017, 2018-2020, and 2021-2022, respectively (Table 11-9). The data for both the CMM laboratory and the umpired labs represent pulps that were analyzed by AA following aqua regia digestion. However, it is unknown if, along with the check samples, a suite of CRMs, blanks, and pulp duplicates was inserted in the sample stream for monitoring the performance of each umpire laboratory.
The evaluation of pulp duplicate assay results was based on a linear regression method. The coefficient of determination (R2) is used to assess the variance explained by the linear relationship between the pairs. The bias is calculated as: bias (%) = 1 − S, where S is the slope of the linear regression. Some bias differences between umpire labs and the CMM laboratory are related to a nominal number of outlier samples with higher copper grades than the majority of the samples. Therefore, the overall check-assay results indicate that the analytical performance of the CMM laboratory with respect to copper analysis by aqua regia digestion with AA finish is acceptable for resource modelling.
Table 11-9: Summary of External Check Assays 2012-2022 for Cu% by AA Method
|
Primary
Laboratory
|
Umpire
Laboratory
|
Year
|
No. of
Samples
|
Group
Size
|
Mean
|
Linear Regression
|
Bias
(%)
|
Bias
(No Outliers)
(%)
|
Outliers
|
|
Original
|
Umpire
|
R2
|
Slope
|
Intercept
|
|
Mine Laboratory
|
Pioneer
|
2012
|
194
|
194
|
0.42
|
0.42
|
0.9123
|
0.888
|
0.0412
|
11.2
|
−1.9
|
2
|
|
2016-2017
|
255
|
179
|
0.30
|
0.31
|
0.9816
|
0.992
|
0.0092
|
0.8
|
0.3
|
1
|
|
ALS
|
2018-2020
|
390
|
385
|
0.37
|
0.38
|
0.9947
|
1.007
|
0.0083
|
−0.7
|
−0.8
|
1
|
|
ActLabs
|
2021-2022
|
173
|
173
|
0.35
|
0.35
|
0.7519
|
0.647
|
0.1182
|
35.3
|
1.1
|
7
|
|
MSALABS
|
2022
|
522
|
433
|
0.33
|
0.33
|
0.9883
|
0.966
|
0.0179
|
3.4
|
2.7
|
3
|
11.6.3 Re-Assays
In 2022, 360 samples of archived half-core from the 2021-2022 drilling program were sent to MSALABS for re-assay. These samples were NQ- and HQ-diameter core, 1.5 m to 3.0 m long, and represented a range of copper grades. Sample preparation and primary analysis of the original half-core samples for 310 of these samples had been carried out at the CMM laboratory. The CMM laboratory analyzed the original core samples by AA following aqua regia digestion. The duplicate core samples sent to MSALABS were also analyzed by AA, but contrastingly digested by four-acid (Table 11-10). Thus, in order to calibrate the data using aqua regia compared to four-acid results, 50 samples were selected and sent to MSALABS to be analyzed by AA after digestion by both methods (Table 11-10). Linear regression analysis for the copper data of all 310 samples indicates that the MSALABS four-acid data overestimated by about 1.2% the copper results with respect to the CMM laboratory aqua regia results (Table 11-10). Upon removing 23 outliers, the underestimation at the CMM laboratory increases slightly to 3.4% (Table 11-10). For analysis above 0.1% Cu, the bias by four-acid at MSALABS is about 2.1%, and increases slightly to 2.7% after removing 22 outliers. The re-assays for the 50 samples at a first glance indicate that there is a significant bias of 17.6% towards the four-acid method. However, after removing four outliers, the difference between both methods is nominal (0.2%). This indicates that the overall comparison for the 310 samples analyzed by aqua regia and four acids is within an acceptable analytical range. This re-assay program represented a 5% check of primary analyses of >0.1% Cu from the CMM laboratory on samples from the 2021-2022 program and showed that the original assay results from the CMM laboratory are acceptable.
Table 11-10: Summary of Half-Core Duplicate Check-Assays 2021-2022 for Cu% by AA Method
|
Primary
Laboratory
|
Umpire
Laboratory
|
No. of
Samples
|
Grade
|
Group
Size
|
Mean
|
Linear Regression
|
Bias
(%)
|
Bias
(No Outliers)
(%)
|
No. of
Outliers
|
|
Original
|
Umpire
|
R2
|
Slope
|
Intercept
|
|
CMM Laboratory
(AQ)
|
MSALABS (4A)
|
310
|
170 ppm to
28,100 ppm
|
310
|
3,559
|
3,660
|
0.909
|
1.012
|
58.9
|
−1.2
|
3.4
|
23
|
|
>1,000 pp
|
265
|
4,020
|
4,089
|
0.907
|
1.021
|
−17.1
|
−2.1
|
2.7
|
22
|
|
MSALABS (4A)
|
MSALABS (AQ)
|
50
|
819 ppm to
9,799 ppm
|
50
|
2,083
|
2,012
|
0.722
|
0.824
|
383.3
|
17.6
|
0.2
|
4
|
Hudbay has initiated an extensive re-sampling and re-assaying program on historical pulps that will be conducted at a certified laboratory. QA/QC samples (blanks, CRM, and duplicates) will be inserted to adequately monitor the precision and accuracy of the laboratory to provide additional assurance of the reliability of the CMM laboratory past performance. These data will also provide additional geochemical information for future mineralogical and metallurgical domaining studies.
11.7 Sample Security
Copper Mountain has no information on sample security measures prior to 2007. However, these historical data were obtained and compiled by major mining companies for mine design and production and were presumably collected in an industry-standard manner, including sample security measures in use at that time.
Since 2007, drilling crews or exploration team members have transferred drill core from the drill site to the core-logging area. At CMM, core is logged at a permanent logging facility (core shack) near the mill building. At Ingerbelle, core was logged at a temporary facility set up in the light-truck shop, proximal to the Ingerbelle Pit. In both cases, the core saws were beside the logging areas, to facilitate supervision of the core cutters, and to minimize the distance the core needed to be moved. CMM exploration staff prepared samples for transport to the laboratory. Samples remained in the custody of CMM on site, from sampling to delivery to the CMM laboratory. Pulp samples that assayed >0.1 Cu were analyzed for gold and silver at an external laboratory; CMM exploration staff transported them to that facility.
In 2022, either CMM exploration staff or a contract transportation company transported samples from 12 diamond drill holes to MSALABS for sample preparation and primary analysis. Individual sample bags were inventoried and sealed in rice sacks before leaving the CMM site, then checked and inventoried on arrival at the laboratory; any delivery issues were communicated to CMMC.
No significant security or chain-of-custody issues have been identified.
11.8 Sample Storage
Some historical (pre-2007) core remains on site. It is stored in the open and has deteriorated significantly.
Since 2007, after the core-sampling process was completed, core boxes were palletized and stored in the open on site. As the core trays are exposed to weathering conditions, there is some risk of sample degradation. Pulps and reject samples are also stored on site, mainly in the Ingerbelle light-truck shop, as mentioned above. Samples from recent years are in reasonable condition, while older samples have deteriorated significantly.
11.9 Comments on Sample Preparation, Analyses, and Security
The CMM has a long history of exploration and mining. Assay data were collected from 1912 to 1997, and QA/QC data were collected from 2007.
CMM has information on QA/QC procedures for historical drill-hole data (pre-2007). However, large drilling programs since 2007, which have included QA/QC measures, have globally validated these historical data. Historical drill-hole data are also supported by more than 11 years of reconciled copper production and operational data.
From 2007 to 2022, QA/QC data were collected and regularly monitored, and do not indicate any problems with the analytical programs. QA/QC submission rates varied through this time, and from 2021 to early 2022 QA/QC insertion rates dropped below industry-accepted standards. To address this shortcoming, a half-core re-assay program was carried out, representing a 5% check of primary analyses of >0.1% Cu from the 2021-2022 drilling program; the results of this re-assay program showed that the original assay results are acceptable. From March 2022, QA/QC insertion rates meet current industry-accepted standards.
From 2012 to 2022, sample preparation and primary analysis for copper and silver was carried out at the CMM laboratory. During this time, pulps from samples that returned >0.1% Cu in the CMM laboratory were routinely sent to a number of different independent laboratories for gold analysis, and on average 10% of these sample pulps were also analyzed for copper and silver. These check-assay results indicate that analytical data from the CCM laboratory are acceptable.
Sample preparation and analytical methods are appropriate to the mineralization style. Sample security measures are considered acceptable.
Based on a review of QA/QC data and the results of check and re-assay programs, the copper, gold, and silver data generated from drill core and RC samples are considered acceptable to support Mineral Resource and Mineral Reserve estimates.
12 Data Verification
Starting in 2023, Hudbay initiated data verification and validation for CMM under the supervision of the QP, Olivier Tavchandjian, P.Geo. Data verification performed prior to 2023 was reviewed and documented in various technical reports mentioned in this section, which summarizes the existing material information in relation to work performed prior to 2023.
12.1 Internal Verification
CMMC exploration staff continually verified data starting with the 2007-2008 drilling programs, which supported the mine restart in 2011, and continued through the most recent 2023 drill program. Drill-hole data are also supported by more than 11 years of reconciled copper production and operational data.
There is no direct method for verifying historical (pre-2007) drill data. Although some drill cores remain on site, their condition does not allow for any systematic resampling or reanalysis. However, historical data were obtained and compiled by major mining companies for mine design and production, and it is assumed that the data were acquired in the industry-standard manner for their time. Large drilling programs since 2007 have included QA/QC measures and globally validated historical drilling data, as documented in Section 11.
CMMC acquired most of the historical assay data in digital format. Granby data could be compared to original drill logs-in a test of more than 1,000 assays, the error ratio was less than 1%, and most of the errors were missing data that were subsequently added. Data that Princeton Mining Corp. generated between 1988 and 1996 have been subjected to several past reviews.
In 2023, a major database migration moving all project exploration data into a cloud-based Seequent MX Deposit Database Management System (MXDB) was completed. Prior to this, data were stored and managed within a Surpac Access Database on the company server. Hudbay staff members have independently and extensively validated the 2023 project database. Validation included manual checks for transcription errors, data gaps, hole collar, downhole survey measurements, and assay interval locations. Exploration personnel also conducted regular reviews of data quality prior to commencing Mineral Resource estimation.
During the migration a number of pre-existing holes were removed for various reasons.
Pre-2007 holes removed from the database were:
-
D-Series holes (horizontal drift samples collected along the walls of the underground development workings)
-
TR-Series holes (surface trenches that were sampled in the CM North and Orinoco Zones)
-
R-Series holes that were not sampled (designed but not drilled).
Post-2006 holes removed from the database were:
-
Holes designed and not drilled
-
Holes that were lost in overburden or fill (typically less than 10 m deep with no core recovery)
-
Short geotechnical holes (<30 m deep) drilled to test the foundations of the concentrator and primary crusher before concrete was poured.
12.1.1 Collars
All collar coordinates were verified using Leapfrog Geo to ensure correct spatial distribution within the UTM Zone 10N (NAD 83) geographic coordinate system.
The historical (pre-2007) collar data set was modified to place collars directly onto the pre-mining topographic surface. In all, 2,152 collar elevations from the pre-2007 data set were adjusted by an average absolute vertical value of 3.9 m.
CMMC established in Redmond et al.'s (2022) technical report that all drill-collar locations were surveyed using a total station and a survey-quality GPS instrument. However, there is no specific indication in the database, nor are consulting company certificates available. Given the 3-D continuity of the mineralization, and the proposed mining method (i.e., open pit), the accuracy of the handheld GPS measurements does not cause a material issue for the Mineral Resource estimates.
12.1.2 Downhole Surveys
Survey data for all drill holes included in the 2023 resource model were validated according to the following criteria.
-
All new 2023 downhole survey data must pass internal instrumental QA/QC, which ensures that survey data were not affected by external disturbances or instrument error during the reading.
-
Pre-2023 survey results were excluded if they displayed excessive downhole deviation in dip or azimuth, resulting in impossible "kinks" in the drill string.
Downhole survey readings were flagged if they deviated >0.5°/m in dip or azimuth from readings above or below. These flagged survey intervals were reviewed on an individual basis to determine which readings were erroneous.
Additional quality validation was completed using Leapfrog Geo-including availability of survey for each of the drill holes; last station equal or less than collar final depth; and presence of duplicates. Table 12-1 presents the survey-type breakdown of pre-2007 and post-2006 holes by hole type.
Table 12-1: Summary of Survey by Hole Type
| Category |
Years |
Hole Type |
Survey Type |
Total
No. Holes |
| Historical |
Design |
Reflex MS |
Reflex SS |
Gyro |
Historical Holes
(Pre-2007) |
1927-2006 |
DDH |
3,842 |
- |
- |
- |
- |
3,842 |
| PERC |
1,138 |
- |
- |
- |
- |
1,138 |
| RC |
29 |
- |
- |
- |
- |
29 |
Recent Holes
(Post-2006) |
2007-2010 |
DDH |
- |
- |
42 |
404 |
- |
446 |
| PERC |
- |
83 |
- |
- |
- |
83 |
| 2011-2020 |
DDH |
- |
6 |
1 |
256 |
- |
263 |
| PERC |
- |
165 |
- |
- |
- |
165 |
| RC |
- |
96 |
- |
- |
- |
96 |
| 2021-2023 |
DDH |
- |
- |
- |
91 |
13 |
104 |
| RC |
- |
144 |
- |
- |
12 |
156 |
| Total |
5,009 |
494 |
43 |
751 |
25 |
6,322 |
Notes: DDH = diamond drill hole; PERC = percussion.
In all, 62% of the 1,313 drill holes drilled post-2006 were surveyed. However, only 5% of the RC drill holes were surveyed starting in 2023 (i.e., those having a length up to 390 m). Table 12-2 presents the percentage of surveys for the most recent drilling period.
Table 12-2: Survey Type in Recent Drill Holes (2007-2023)
| Hole Type |
Maximum Length
(m) |
Survey Type |
Total Holes |
| Design |
Reflex MS |
Reflex SS |
Gyro |
| DDH |
1,232 |
6 |
43 |
751 |
13 |
813 |
| 1% |
5% |
92% |
2% |
| PERC |
29.9 |
248 |
- |
- |
- |
248 |
| 100% |
- |
- |
- |
| RC |
387.6 |
240 |
- |
- |
12 |
252 |
| 95% |
- |
- |
5% |
| Total (Percentage of Survey Type) |
495 (38%) |
43 (3%) |
752 (57%) |
25 (2%) |
1,313 |
Notes: DDH = diamond drill hole; PERC = percussion.
12.1.3 Assays
The migration of assay data to MXDB was completed in two parts. All the pre-2007 data were imported into MXDB directly from the Surpac database since it was not possible to find the original lab certificates. For the post-2006 period, 85% of the copper, 84% of the gold, and 82% of the silver assays were captured and imported from the raw laboratory certificates into the new database system, with the remaining percentages still relying on the Surpac database (DB) (no digital or hard copies of certificates could be located).Table 12-3 summarizes the number of assays by element and laboratory, as well as the percentage by period.
A 10% check of assays against the original laboratory certificates was completed and showed an error rate of less than 1%.
Table 12-3: Assay Database Summary by Element, Period, and Laboratory
|
|
Period
|
Laboratory
|
No. Assays
|
Percentage by Period
|
Total
|
|
Cu
|
1927
|
2006
|
Ecotech
|
93
|
100
|
171,749
|
|
Surpac Historical DB
|
171,656
|
|
2007
|
2023
|
ALS
|
35
|
0.05
|
73,786
|
|
Ecotech
|
1,243
|
2
|
|
Mine Laboratory
|
34,130
|
46
|
|
MSALABS
|
4,624
|
6
|
|
Pioneer
|
22,389
|
30
|
|
Surpac Historical DB
|
11,365
|
15
|
|
Total
|
245,535
|
|
Au
|
1927
|
2006
|
Ecotech
|
93
|
100
|
6,201
|
|
Surpac Historical DB
|
6,108
|
|
2007
|
2023
|
Actlabs
|
3,626
|
12
|
30,271
|
|
ALS
|
2,429
|
8
|
|
Ecotech
|
602
|
2
|
|
MSALABS
|
5,463
|
18
|
|
Pioneer
|
13,339
|
44
|
|
Surpac Historical DB
|
4,812
|
16
|
|
Total
|
36,472
|
|
Ag
|
1927
|
2006
|
Ecotech
|
93
|
100
|
1,802
|
|
Surpac Historical DB
|
1,709
|
|
2007
|
2023
|
Actlabs
|
10
|
0.03
|
32,259
|
|
ALS
|
135
|
0.42
|
|
Ecotech
|
1,232
|
4
|
|
Mine Laboratory
|
8,052
|
25
|
|
MSALABS
|
4,940
|
15
|
|
Pioneer
|
11,953
|
37
|
|
Surpac Historical DB
|
5,937
|
18
|
|
Total
|
34,061
|
12.1.4 Database Corrections
A series of issues were identified and fixed during drill-hole database validation. These include:
-
Soluble copper assays replacing total copper values, causing a negative bias.
-
Duplicates of sample numbers. This issue was fixed by adding the last two digits of the collecting year to the original sample number. Exceptions to this protocol were made when the sample number corresponded to the concatenation of the "Hole ID" and "From-To."
-
Sample duplicates found in Mine Laboratory certificates were removed and not used in the database.
-
Several issues with sample intervals were identified in the original logging tables. These include overlaps, gaps, interval exceeding hole final depth, and sample numbers out of sequence or in reverse sequence.
-
P-Series of percussion hole identifications (ID) in New Ingerbelle had duplicate IDs in Copper Mountain. The issue was fixed by adding the prefix "IG" to the hole ID in New Ingerbelle.
-
Errors converting units. Cu% values greater than 100 and copper, gold, and silver high-end outliers were identified and tracked to original certificates to apply correct converting factors.
From 2007 onwards, field geologists selectively sampled diamond drill holes based on the amount of mineralization defined visually when logging. Areas that were left unsampled were: post-mineral geological units that include felsic and mafic mine dykes; Princeton Group Volcanics; Kennedy Lake Sediments and Copper Mountain Stock; and barren areas of drill holes within Nicola Group Volcanics and the Lost Horse Intrusive Complex.
For resource modelling purposes, unsampled intervals in dykes were assigned 0.00001% Cu. Since there is not valid logging information about drilling recovery, other unsampled intervals ≥10 m were considered barren and assigned a value of 0.00001% Cu. Unsampled intervals <10 m are considered the result of a possible lack of recovery and therefore kept as missing copper.
12.1.5 Data Security
The database is currently stored and managed within MX Deposit, with a single database administrator responsible for controlling data imports and exports. Throughout the migration process a team of geologists was assembled, and a number of working copies of the database were used and stored within Hudbay's Google Drive network before any modifications were made to the final product via the DB administrator.
For the purpose of checks and validations, working databases were: time stamped; consistent across company personnel and storage devices; and only accessible through a single-source location that the DB administrator managed.
Geological logs have been stored in hard copy at both the Vancouver office of Hudbay as well as at the mine site. A scanned electronic version of logs is also stored on Hudbay's server and systematically backed up. Earlier assay certificates between 2007 and 2010 exist in both hard copy and digital form, and are stored in the Vancouver office and on the server. More-recent assay certificates (post-2010) exist only in digital format and are stored on the company server. The recent migration involved all available assay certificates to be loaded to MX Deposit, which are now stored in the Seequent cloud.
12.1.6 Site Visits
Hudbay personnel have visited the CMM area to conduct site inspections, to become familiar with conditions on the property, to observe the geology and mineralization, to perform core review, and to verify the work completed on the property as part of the Mineral Resource estimation and technical report process since June 2023.
12.2 Comments on Data Verification
Based on the QP's experience and familiarity with the analytical procedures and methodologies used on the CMM, and with the verified data and observations discussed above, it is the QP's opinion that the data set has been appropriately validated and verified and is adequate for Mineral Resource and Mineral Reserve estimation and for use in mine planning.
13 Mineral Processing and Metallurgical Testing
Knowledge of the metallurgical characteristics of the Copper Mountain deposits has been developed through extensive mill experience and ongoing on-site- and off-site-based testing over the past decade. There are three main areas of the property from which plant feed will be sourced over the next 15 years of operations: Main Pit, North Pit, and New Ingerbelle. These will be followed by mining of the Virginia pit and reclaiming of the low grade stockpiles in the latter years of the mine plan.
13.1 Comminution
13.1.1 Copper Mountain Main and North Pit
Feed sourced from the Copper Mountain Main and North Pits is competent and hard, with impact resistance (Axb) values of 24 to 32 and Bond ball mill work indices (BWi) of 18 to 26 kWh/t. To predict processing throughput from Main and North Pit, a conservative set of hardness values has been used and is outlined in Table 13-1. An expanded testwork program to map spatial variability in orebody hardness in greater detail is planned to begin in 2024.
Table 13-1: Main and North Pit Hardness
|
Parameter
|
Value
|
|
BWi
|
24
|
|
DWi
|
9.82
|
|
Axb
|
28
|
|
SG
|
2.75
|
| Note: DWi = drop weight index; SG = specific gravity. |
13.1.2 New Ingerbelle
The New Ingerbelle Pit constitutes a significant percentage of the LOM Mineral Reserve estimates, with a material impact on projected throughput. Comminution testwork campaigns were completed at Base Met Laboratories Ltd. (Base Met) in Kamloops in 2021 and 2022. A combination of BWi and SMC Test parameter analyses was performed on six unique core samples collected during a drill campaign conducted in 2021, representing all geological domains and phases of mining, with the hardness values outlined in Table 13-2.
Table 13-2: New Ingerbelle Hardness Testwork Results
|
Parameter
|
New Ingerbelle Pit
|
|
BWi
|
24.7
|
|
DWi
|
9.37
|
|
Axb
|
30
|
|
SG
|
2.75
|
The hardness results indicate that the New Ingerbelle mineralization is similar to the Copper Mountain Main Pit, and that similar processing throughput is expected when the plant begins processing the New Ingerbelle mineralization.
13.2 Flotation
13.2.1 Copper Mountain Main and North Pit
Since 2012, copper recovery has ranged from 72% to 88% on a monthly basis, with an average of 80.5% (Figure 13-1). The rougher and cleaner recoveries range from 70% to 90% and 94% to 98%, respectively. The cleaner recovery has been consistent since the beginning of operations and is expected to remain within the 96% to 98% operating range going forward. Rougher recovery is a function of the feed-ore quality and the overall operational efficiency of the comminution and flotation circuits. Without any changes to the existing circuit, inclusive of any configuration, equipment, and reagent schemes, the rougher copper recovery would vary from 81% to 85%, for a total copper recovery of 79% to 83%.
Figure 13-1: Monthly Copper Recovery

Flotation testwork has been initiated to lift the average flotation recovery to the 83% to 87% range via changes to the reagent scheme. The target of the programs has been the sulphide mineral collectors and sulphidation agents. The standard flotation reagent scheme employs potassium amyl xanthate (PAX) as the lone collector, with an alcohol-glycol frother blend. pH control is limited to the regrind-cleaner circuit where quicklime is added dry to the regrind mill.
The addition of a secondary co-collector alongside PAX has been found to significantly increase the rougher circuit recovery. The addition of either dithiophosphate (DPT) or thionocarbamate (IPETC) has in other alkaline porphyry deposits shown an increase in rougher copper recovery of up to 10%. In the case of Copper Mountain, the testwork to date has shown copper-rougher recovery improvements up to 8% within the design circuit mass recovery range (8% to 10%) against the current PAX-only scheme.
Figure 13-2: Rougher Flotation Co-Collector Testwork on Copper Mountain Main Pit Samples

In addition to co-collector testwork, investigation into controlled potential sulphidation (CPS) began in 2023 to determine its effectiveness in improving recovery of oxide, transition, and sulphide minerals by reapplying active S− ions to the surface of the target minerals. Two on-site lab-scale test campaigns were completed, investigating a range of mineralization types. The results showed:
-
Sulphide copper recovery improvement of 2% with all dosages of the sulphidizing agent when compared to the baseline conditions.
-
Oxide copper recovery improvement ranged from 18% to 29% relative to baseline conditions.
-
Potential for reduction of xanthate collector dosage when employing CPS.
-
Silver recovery improvement ranged from 6% to 7%; however, further variability testwork is required to improve the accuracy of the silvery recovery model.
Larger-scale test programs are under way to determine the ultimate performance improvement range for both co-collector and sulphidation additions. An overall 4% improvement in recovery has been included in the recovery forecasting through the implementing both co-collector and CPS.
13.2.2 New Ingerbelle
Testwork on New Ingerbelle Pit material began in 2017. Variable mineralized samples collected from a 2017 and 2018 drill program within the pit have been tested to assess the expected flotation performance. Eleven composite samples were created and dispatched to Process Mineralogical Consulting for size-by-analysis. The samples were ground to P80 250 µm, with the following outcomes:
-
Copper is present as chalcopyrite within minimal secondary copper minerals observed.
-
The P80 of observed chalcopyrite grains was 67 μm.
-
The host non-sulphide rock is composed of albite, plagioclase, potassic feldspar, and mafic materials.
-
At a coarse grind of 250 μm, 54% of the chalcopyrite was liberated.
Results of the flotation tests performed on the composites samples are outline in Figure 13-3. At the processing plant target mass-recovery range, each of the samples tested exceeded 85% rougher recovery, with many above 90%.
Figure 13-3: Rougher Flotation Testwork on New Ingerbelle Composites

Historical production data from the Ingerbelle mill are shown in Table 13-3. The processing plant treated mineralization from the Ingerbelle Pit from 1970 through 1981, and stockpiled material later in 1993.
Table 13-3: Historical Ingerbelle Flotation Performance
|
Year
|
Tonnes Milled
(t/a)
|
% Cu
Head
|
Overall
Cu Rec. %
|
Cu Produced
(lb x 000s)
|
Au Produced
(oz)
|
Ag Produced
(oz)
|
|
1976
|
6,355,744
|
0.42
|
86.7
|
51,000
|
35,599
|
147,198
|
|
1997
|
7,135,924
|
0.37
|
86.9
|
50,601
|
35,199
|
139,998
|
|
1978
|
6,779,400
|
0.41
|
89.1
|
54,600
|
37,099
|
139,798
|
|
1979
|
6,899,148
|
0.43
|
89.3
|
58,400
|
38,099
|
138,798
|
|
Average
|
6,792,554
|
0.41
|
88.0
|
53,672
|
36,503
|
141,327
|
With the existing circuit, the rougher recovery from New Ingerbelle is expected to be 87% to 92%. Applying the same cleaner copper-recovery range as per Main Pit, total copper recovery is expected to be in the 85% to 90% range, with an estimated 87% on average.
13.2.3 Precious Metal Recoveries
Gold and silver are recovered as by-products by means of flotation. Historical production data from production records indicates that both gold and silver are correlated with overall copper recovery. Based on recent production records for Main and North Pits (Figure 13-4 and Figure 13-5), and on production records available for the 1976-1979 period for New Ingerbelle, recovery targets for gold and silver have been set to a range of 65% to 70%.
Figure 13-4: Monthly Gold Recovery

Figure 13-5: Monthly Silver Recovery

There are any known processing factors or deleterious elements that could have a significant effect on potential for economic extraction.
14 Mineral Resource Estimates
Hudbay prepared a 3-D resource model using Leapfrog (Version 2023.1) and MineSight (Version 16.0), two industry-standard, commercial geological and mining software titles. Hudbay personnel constructed this resource model and the Mineral Resource estimate following Hudbay procedures, in compliance with best industry standards and the Canadian Institute of Mining, Metallurgy and Petroleum's (CIM) guidelines (CIM, 2019). The work was conducted under the supervision of QP and Technical Report author Olivier Tavchandjian, P.Geo., Senior Vice-President, Exploration and Technical Services at Hudbay Minerals.
14.1 Drilling Database
In all 6,322 drill holes totalling approximately 693,386 m were drilled on the Copper Mountain and New Ingerbelle deposit since the 1920s. These drill-hole data were imported into Leapfrog and MineSight from CSV files, with a cut-off date for Mineral Resource estimate purposes of September 11, 2023. Table 14-1 presents the drill-hole breakdown by company and drilling type.
Table 14-1: Drill-Hole Summary
|
Category
|
Years
|
No. DDH
|
No. PERC
|
No. RC
|
Total
Drilling Length
(m)
|
No. of Samples
|
Total
Sampling Length
(m)
|
Overall
Percentage
(%)
|
|
|
1927
|
1930
|
2,314
|
-
|
-
|
121,306
|
75,200
|
121,100
|
100
|
97
|
|
1931
|
1940
|
156
|
-
|
-
|
15,923
|
6,547
|
15,923
|
100
|
|
1941
|
1950
|
149
|
-
|
-
|
15,305
|
5,978
|
15,022
|
98
|
|
1951
|
1960
|
295
|
-
|
-
|
17,853
|
10,538
|
17,236
|
97
|
|
1961
|
1970
|
557
|
1,126
|
-
|
169,218
|
52,901
|
167,314
|
99
|
|
1971
|
1980
|
20
|
-
|
-
|
3,227
|
860
|
3,114
|
97
|
|
1981
|
1990
|
198
|
12
|
-
|
32,408
|
8,819
|
26,395
|
81
|
|
1991
|
2000
|
153
|
-
|
29
|
31,689
|
10,906
|
30,441
|
96
|
|
2001
|
2006
|
-
|
-
|
-
|
-
|
-
|
-
|
|
|
|
2007
|
2010
|
446
|
83
|
-
|
121,995
|
27,299
|
67,975
|
56
|
70
|
|
2011
|
2020
|
263
|
165
|
96
|
89,954
|
23,797
|
68,880
|
77
|
|
2021
|
2023
|
104
|
-
|
156
|
74,509
|
22,690
|
63,329
|
85
|
Notes: DDH = diamond drill hole; PERC = percussion.
From these drill holes, 5,631 holes have intersected copper mineralization and were used to define the Copper Mountain and New Ingerbelle deposits. Table 14-2 presents the drill-hole breakdown by deposit.
Table 14-2: Drill-Hole Summary per Deposit
|
|
Total Metres
|
Total Metres with
Cu Results
|
Total Metres with
Au Results
|
Total Metres with
Ag Result
|
|
New Ingerbelle
|
103,70
|
94,619
|
25,304
|
22,346
|
|
CM North
|
38,741
|
36,178
|
12,020
|
7,363
|
|
CM Central East
|
2,808
|
2,576
|
515
|
515
|
|
CM Central
|
117,628
|
108,267
|
23,918
|
24,695
|
|
CM South Central
|
2,601
|
2,407
|
699
|
714
|
|
CM South
|
205,542
|
197,810
|
14,973
|
18,122
|
|
Total
|
471,026
|
441,857
|
77,430
|
73,754
|
|
Percentage of Samples Assayed (%)
|
94
|
16
|
16
|
From a total drilled sample length of 471,026 m, approximately 441,857 m were analyzed for copper (94%), 77,430 m for gold (16%), and 73,754 m for silver (15%), while density (specific gravity) was measured in 1,515 samples. After confirming with the CMM geologists that samples with missing values were not assayed due to the absence of visual mineralization, any missing copper, gold, and assay results were replaced with a 0.00001 grade. However, if missing intervals are within the stopes or underground development wireframe, the missing values are kept as missing. Finally, if the missing intervals are less than 10 m of continuous length, the intervals are kept as missing to account for possible core loss.
The preliminary 3-D geological model (Figure 14-1) described in Section 7 was used as the basis for constructing smooth and continuous 3-D solids of the mineralized domains in Leapfrog using a 0.1% Cu cut-off as a natural marker and general guide. (Figure 14-2).
Table 14-3 presents the envelope code equivalency that will be referred to through the remainder of this section.
Table 14-3: Mineralized Envelopes Code Equivalency
|
Code
|
Equivalency
|
|
ENVLP=1
|
New Ingerbelle
|
|
ENVLP=2
|
CM North
|
|
ENVLP=3
|
CM Central East
|
|
ENVLP=4
|
CM Central
|
|
ENVLP=5
|
CM South Central
|
|
ENVLP=6
|
SM South
|
|
ENVLP=7
|
Barren
|
Figure 14-1: Plan View of the Geological Model

Figure 14-1 presents a plan view of the geological model, while Figure 14-2 to Figure 14-8 present the envelopes used as hard boundaries for grade interpolation purposes for each deposit. The six mineralized domains from west to the southeast are:
Figure 14-2: Plan View of the Mineralized Domains

Figure 14-3: New Ingerbelle Mineralization

Note: Image on the left = looking east; top right image = plan view; bottom right image = looking north.
Figure 14-4: Copper Mountain North Mineralization

Note: Image on the left = plan view; top right image = looking east; bottom right image = looking north.
Figure 14-5: Copper Mountain Central East Mineralization

Note: Image on the left = plan view; top right image = looking north; bottom right image = looking east.
Figure 14-6: Copper Mountain Central Mineralization

Note: Image on the left = plan view; top right image = looking north; bottom right image = looking east.
Figure 14-7: Copper Mountain South Central Mineralization

Note: Image on the left = plan view; top right image = looking north; bottom right image = looking east.
Figure 14-8: Copper Mountain South Mineralization

Note: Image on the left = plan view; top right image = looking north; bottom right image = looking east.
The envelopes and the drill-hole traces were loaded into MineSight to ensure proper tagging of the solids to actual drill-hole locations. The mineral envelopes were used as a hard boundary in all cases for grade interpolation purposes, to prevent spreading of mineralization into the barren zone and vice-versa.
14.2 Density
In all, 1,179 measurements of specific gravity have been conducted for samples taken at random from the drilling programs post 2007. Table 14-4 presents the details of the specific gravity by mineralization domains.
Table 14-4: Specific Gravity by Mineralization Domains
|
ENVLP
|
Number
|
Mean
|
Minimum
|
Q1
|
Median
|
Q3
|
Maximum
|
|
1
|
1,094
|
2.80
|
2.51
|
2.74
|
2.8
|
2.85
|
5.11
|
|
2
|
27
|
2.75
|
2.47
|
2.66
|
2.74
|
2.83
|
3.07
|
|
3
|
0
|
n/a
|
n/a
|
n/a
|
n/a
|
n/a
|
n/a
|
|
4
|
329
|
2.79
|
2.49
|
2.7
|
2.77
|
2.87
|
4.83
|
|
5
|
0
|
n/a
|
n/a
|
n/a
|
n/a
|
n/a
|
n/a
|
|
6
|
65
|
2.80
|
1.46
|
2.73
|
2.82
|
2.91
|
3.15
|
|
7
|
727
|
2.78
|
2.27
|
2.69
|
2.78
|
2.85
|
3.96
|
Given the fact that the current drill-hole database includes mostly copper grades, regression analysis was not performed to predict density values. Instead, the average density values were assigned to the interpolation domains. Due to their proximity, ENVLP4 was used to populate ENVLP3, while ENVLP6 was used to populate ENVLP5.
14.3 Gold and Silver Regressions
Gold and silver grades were predicted via a linear regression formula when samples had copper grade but no gold or silver grades. The following regression formulas were used to predict the gold and silver values where no actual measurement was taken:
| |
Au in ENVLP1 = 0.02661 + 0.52790 * Cu% (r = 0.81)
Au in ENVLP2 = 0.01859 + 0.38092 * Cu% (r = 0.77)
Au in ENVLP3 = 0.03754 + 0.4167 * Cu% (r = 0.79)
Au in ENVLP4 = 0.057989 + 0.21886 * Cu% (r = 0.74)
Au in ENVLP5 = 0.03557 + 0.10046 * Cu% (r = 0.71)
Au in ENVLP6 = 0.018315 + 0.15039 * Cu% (r = 0.73)
Ag in ENVLP1 = 0.09725 + 1.36984 * Cu% (r = 0.82)
Ag in ENVLP2 = 0.09241 + 2.5171 * Cu% (r = 0.86)
Ag in ENVLP3 = 0.2751 + 3.565 * Cu% (r = 0.85)
Ag in ENVLP4 = 0.32528 + 2.13142 * Cu% (r = 0.88)
Ag in ENVLP5 = 0.3358 + 2.0191 * Cu% (r = 0.89)
Ag in ENVLP6 = 0.188 + 3.4118 * Cu% (r = 0.77)
|
|
The residuals were compared against a normal distribution to ensure no bias was introduced, and the predicted values were validated through comparisons against the measured values. The measured and predicted values were merged into a single field, with the priority given to the measured values.
14.4 Compositing
Assay intervals were regularized by compositing drill-hole data within the interpreted geological and mineralized envelopes. The drill holes were typically assayed on intervals of 3 m, and a composite length of 7.5 m was selected as more appropriate to conducting interpolation into the 15 m x 15 m x 15 m block size selected to account for the proposed mining method (front-loading shovels). The compositing process was validated by comparing total length and length-weighted average grade for each metal of the composites to the original assays.
14.5 Exploratory Data Analysis
Exploratory data analysis (EDA) includes basic statistical evaluation of the assays and composites for copper, gold, and silver. The EDA was conducted separately for each mineralized envelope. The composite statistics for copper, gold, and silver are summarized in the block model validation Section 14.9.
14.6 Grade Capping
The decile analysis and the metal-at-risk methods were used to define high-grade outliers, and to assess the need for grade capping. The analysis was conducted on the composites in the mineralized envelope. Based on this analysis, gold and silver were capped as detailed in Table 14-5. These capping values were selected to limit the weight of the high-grade outliers on the overall population.
Table 14-5: Copper Mountain and New Ingerbelle Capping Thresholds
|
ENVLP
|
Gold
|
Silver
|
|
Capping
Threshold
|
No. of
Composites
|
% of
Composites
|
Metal Loss
(%)
|
Capping
Threshold
|
No. of
Composites
|
% of
Composites
|
Metal Loss
(%)
|
|
1
|
1.1
|
33
|
0.3
|
0.4
|
3
|
39
|
0.3
|
1.0
|
|
2
|
0.5
|
30
|
0.6
|
1.1
|
4
|
8
|
0.2
|
0.5
|
|
3
|
n/a
|
n/a
|
n/a
|
n/a
|
n/a
|
n/a
|
n/a
|
n/a
|
|
4
|
0.6
|
30
|
0.2
|
0.7
|
5.5
|
36
|
0.2
|
3.0
|
|
5
|
n/a
|
n/a
|
n/a
|
n/a
|
n/a
|
n/a
|
n/a
|
n/a
|
|
6
|
0.75
|
46
|
0.2
|
0.9
|
13
|
41
|
0.2
|
0.7
|
Note: Based on the metal at risk method (no capping required based on Parrish method).
14.7 Variography
Downhole and directional pairwise relative variograms for all elements were created for each individual mineral envelope using MineSight Sigma software. The major, semi-major, and minor axes were built from variogram maps. A combination of nugget and two-nested spherical models were adjusted in all cases. Once generated, a systematic visual check was conducted to ensure that the search ellipsoid would be correctly oriented with respect to the geometry of the mineral envelopes. Table 14-6 presents the variogram parameters for all the interpolation domains.
Table 14-6: East Deposit Variogram Parameters
|
|
|
Interpolation Domains (ENVLP)
|
|
1
|
2
|
3
|
4
|
5
|
6
|
7
|
|
|
Nugget
|
0.2
|
0.15
|
0.1
|
0.2
|
0.2
|
0.2
|
0.1
|
|
Sill -1
|
0.341
|
0.293
|
0.198
|
0.338
|
0.457
|
0.432
|
0.45
|
|
Major Axis -1
|
45
|
45
|
30
|
25
|
30
|
35
|
500
|
|
Semi-Major Axis -1
|
45
|
50
|
30
|
30
|
30
|
50
|
500
|
|
Minor Axis -1
|
45
|
20
|
40
|
35
|
25
|
30
|
150
|
|
Rotation 1 -1
|
80
|
-60
|
-68
|
-82
|
-70
|
-55
|
-55
|
|
Rotation 2 -1
|
-20
|
-7
|
15
|
-17
|
0
|
-10
|
-10
|
|
Rotation 3 -1
|
-90
|
-90
|
66
|
70
|
-82
|
-90
|
-90
|
|
|
Sill -2
|
0.089
|
0.057
|
0.114
|
0.125
|
0.198
|
0.224
|
0.45
|
|
Major Axis -2
|
200
|
100
|
100
|
100
|
100
|
120
|
1,000
|
|
Semi-Major Axis -2
|
125
|
120
|
80
|
100
|
100
|
120
|
1,000
|
|
Minor Axis -2
|
100
|
60
|
100
|
80
|
60
|
100
|
300
|
|
Rotation 1 -2
|
80
|
-60
|
-68
|
-82
|
-70
|
-55
|
-55
|
|
Rotation 2 -2
|
-20
|
-7
|
15
|
-17
|
0
|
-10
|
-10
|
|
Rotation 3 -2
|
-90
|
-90
|
66
|
70
|
-82
|
-90
|
-90
|
14.8 Grade Estimation and Interpolation Methods
The block model consists of regular blocks 15 m along strike by 15 m across strike by 15 m vertically. The block dimensions were selected to match the smallest mining unit (SMU) used at CMM.
Where a block was intersected by more than one interpolation domain, the domain wireframes were used to assign the percentage of the block that belongs to each domain. Figure 14-9 presents an example of the mineralized percentage model with 70% of the block inside ENVLP 5 and 30% within ENVLP 6.
Figure 14-9: Ore Percentage Example

In all cases, both NN and ordinary kriging (OK) grade interpolations were completed on the uncapped and capped grades using a strict composite and block matching code by mineralized envelope, and three passes with increasing minimum information requirements (Table 14-7).
The search passes were selected to ensure the best local estimates, recognizing that OK has a smoothing effect, but making no attempt during interpolation to reduce this smoothing, as it would negatively impact the quality of the local estimates. Over-smoothing is addressed through the post-processing of the model described in Section 14.12.
Table 14-7: Search Ellipse Parameters
|
|
Pass #1 (Fill Pass)
|
Pass #2
|
Pass #3
|
|
Search Ellipse
|
≈150% of variogram range
|
755 of variogram range
|
50% of variogram range
|
|
Minimum Number of Composites
|
1
|
16
|
16
|
|
Maximum Number of Composites
|
32
|
32
|
32
|
|
Maximum Number of Composites per Hole
|
6
|
6
|
6
|
|
Declustering
|
No
|
Yes
|
Yes
|
|
Maximum Number of Composites per Quadrant
|
No
|
24
|
18
|
|
Minimum Number of Quadrant
|
1
|
2
|
3
|
14.9 Grade Estimation Validation
The grade estimation process was validated for each mineralized envelope to ensure appropriate honouring of the input data and subsequent unbiased Mineral Resource reporting through the following steps:
-
Visually checking appropriate honouring of the input data, but acknowledging that some natural smoothing should occur between samples, as the grade of a sample in the middle of a block is not the average grade of the block.
-
Verifying absence of global bias by comparing the mean grade estimated by kriging to the original composite average grade and to a declustered grade obtained from a NN interpolation.
-
Assessing the level of smoothing in the kriged model and correcting for over-smoothing as per variogram model assumptions by domain of consistent drilling density and statistical properties.
14.10 Visual Inspection
Visual inspection of block grade versus composited data was systematically conducted in section view. This check confirmed a good reproduction of the data by the model. As an example, cross-sections are presented in Figure 14-10 to Figure 14-14. These figures display all drill holes, including the ones above the current topographic surface. These holes were also used during the interpolation process.
Figure 14-10: New Ingerbelle-OK Model and Copper Grade Composites
N-S Section View

Figure 14-11: Copper Mountain North-OK Model and Copper Grade Composites
N-S Section View

Figure 14-12: Copper Mountain Central East-OK Model and Copper Grade Composites
N-S Section View

Figure 14-13: Copper Mountain Central and South Central-OK Model and Copper Grade Composites
N-S Section View

Figure 14-14: Copper Mountain South-OK Model and Copper Grade Composites N-S Section View

14.11 Global-Bias Checks
The global-bias checks validation step consists of comparing the global-average grade of each element between the composites, the NN, and the kriged block estimates inside each grade shell.
A NN interpolation is equivalent to the declustered statistics of the composites based on weighting each composite by its polygon of influence. The average grade obtained from this method is a useful benchmark, but not a perfect one, as it fails to incorporate the nugget effect measured by the variogram.
A global check was performed to verify that the kriged mean block estimate did not present any bias when compared to the composites and the NN model. Differences between the composites, the NN, and OK grades were acceptable. The comparison of the mean and variance for each metal between the diamond drill holes (DDH), the composites, the NN, and OK models are summarized in Table 14-8.
Table 14-8: Global Statistics

Note: CV = coefficient of variation.
14.12 Smoothing Assessment
The visual validation conducted in section view confirmed that the block-grade interpolation is consistent with the supporting composite data. The larger number of composites used for grade estimation in the block model significantly improves the individual block grade-estimates, but at the same time results in a much smoother model, requiring a careful assessment and in many cases a post-processing of the OK estimates.
The extent of grade over-smoothing in the model was investigated based on material differences in grade distribution or drilling density. The mean and variance of the kriged estimates were compared to the variance of the composites after declustering. The expected true variance between SMUs was calculated from the variogram models summarized in Table 14-6.
Over-smoothing is a normal outcome of a sound interpolation method when the drill spacing is not sufficient to address the short-range variability in the metal grade-distribution. Smoothing will gradually decrease as additional infill drilling is performed during the definition-drilling phases.
14.13 Smoothing Correction
Using the smoothed OK estimates results in an erroneous grade-tonnage curve, and reporting Mineral Resources or Mineral Reserves at a cut-off grade different than 0% would produce biased estimates, usually overestimating tonnes and underestimating grade.
An indirect log-normal correction was used to perform a change of support on the kriged models to obtain unbiased grade-tonnage curves. This correction is only valid globally and provides poorer local estimates than the smoothed OK model. However, it does not materially alter the global average grade within each zone and provides the correct grade-tonnage curve for the variogram models fitted on the drill-hole data. It is an appropriate method to predict the recoverable tonnage and grade, such as the mined volume over three months of production, which should be a realistic aim for a long-term reserve model based on exploration drilling.
For some of the elements, the correction did not fully attain the targeted variance, reflecting that the log-normal model does not perfectly fit these elements. However, the targeted variance was reached within very close limits in most cases, as illustrated in Table 14-9.
Table 14-9: Summary of Smoothing Correction
|
|
ENVLP
|
Sub-Zone
|
NN Model
Variance
|
OK Model
Variance
|
Theoretical Variance
of Blocks
|
Smoothing Ratio
of Blocks
|
Corrected Variance
of Blocks
|
|
|
1
|
1
|
0.0819
|
0.0256
|
0.0408
|
1.55
|
0.0397
|
|
2
|
0.0550
|
0.0109
|
0.0274
|
2.44
|
0.0267
|
|
3
|
0.0581
|
0.0087
|
0.0026
|
3.40
|
0.0297
|
|
2
|
4
|
0.0394
|
0.0109
|
0.0071
|
1.54
|
0.0168
|
|
5
|
0.0363
|
0.0096
|
0.0061
|
1.68
|
0.0162
|
|
6
|
0.0263
|
0.0044
|
0.0018
|
2.86
|
0.0126
|
|
3
|
7
|
0.0182
|
0.0027
|
0.0008
|
3.13
|
0.0083
|
|
4
|
8
|
0.0762
|
0.0153
|
0.0071
|
2.26
|
0.0346
|
|
9
|
0.0529
|
0.0089
|
0.0035
|
3.06
|
0.0272
|
|
10
|
0.0965
|
0.0119
|
0.0034
|
4.91
|
0.0583
|
|
5
|
11
|
0.0606
|
0.0090
|
0.0029
|
2.82
|
0.0254
|
|
6
|
12
|
0.2671
|
0.1067
|
0.0793
|
1.30
|
0.1391
|
|
13
|
0.1581
|
0.0489
|
0.0282
|
1.84
|
0.0901
|
|
14
|
0.2445
|
0.0360
|
0.0099
|
4.08
|
0.1467
|
|
|
1
|
1
|
0.0241
|
0.0070
|
0.0120
|
1.72
|
0.0121
|
|
2
|
0.0174
|
0.0036
|
0.0087
|
2.40
|
0.0082
|
|
3
|
0.0169
|
0.0027
|
0.0009
|
3.11
|
0.0090
|
|
2
|
4
|
0.0067
|
0.0017
|
0.0010
|
1.69
|
0.0029
|
|
5
|
0.0055
|
0.0013
|
0.0008
|
1.71
|
0.0024
|
|
6
|
0.0040
|
0.0006
|
0.0002
|
2.62
|
0.0019
|
|
3
|
7
|
0.0059
|
0.0005
|
0.0001
|
5.75
|
0.0030
|
|
4
|
8
|
0.0048
|
0.0010
|
0.0005
|
2.13
|
0.0022
|
|
9
|
0.0044
|
0.0007
|
0.0003
|
2.54
|
0.0022
|
|
10
|
0.0072
|
0.0009
|
0.0002
|
3.55
|
0.0033
|
|
5
|
11
|
0.0020
|
0.0003
|
0.0001
|
3.38
|
0.0011
|
|
6
|
12
|
0.0071
|
0.0026
|
0.0018
|
1.47
|
0.0038
|
|
13
|
0.0061
|
0.0015
|
0.0007
|
2.24
|
0.0037
|
|
14
|
0.0117
|
0.0017
|
0.0005
|
3.65
|
0.0049
|
|
|
1
|
1
|
0.1559
|
0.0451
|
0.0777
|
1.72
|
0.0794
|
|
2
|
0.1265
|
0.0234
|
0.0630
|
2.69
|
0.0656
|
|
3
|
0.1523
|
0.0206
|
0.0056
|
3.69
|
0.0851
|
|
2
|
4
|
0.2843
|
0.0767
|
0.0494
|
1.55
|
0.1212
|
|
5
|
0.2075
|
0.0504
|
0.0293
|
1.72
|
0.0918
|
|
6
|
0.1622
|
0.0268
|
0.0106
|
2.53
|
0.0742
|
|
3
|
7
|
0.4782
|
0.0484
|
0.0096
|
5.06
|
0.3036
|
|
4
|
8
|
0.3179
|
0.0712
|
0.0370
|
1.93
|
0.1474
|
|
9
|
0.2795
|
0.0460
|
0.0175
|
2.63
|
0.1425
|
|
10
|
0.4083
|
0.0630
|
0.0225
|
2.80
|
0.2017
|
|
5
|
11
|
0.3040
|
0.0429
|
0.0130
|
3.30
|
0.1525
|
|
6
|
12
|
3.1520
|
1.2481
|
0.9202
|
1.36
|
1.6579
|
|
13
|
1.9836
|
0.5961
|
0.3336
|
1.79
|
1.1185
|
|
14
|
2.1656
|
0.3889
|
0.1300
|
2.99
|
1.0054
|
14.14 Classification of Mineral Resource
During the interpolation process, several control parameters were recorded for each block. These included number of samples; number of holes; distance to the nearest sample; the average distance to all the samples used for the interpolation; and for each individual block estimate, the number of quadrants with samples, the kriging variance, and the regression slope of kriging.
The regression slope values obtained from the kriging of copper and soluble-copper grade estimates was used as the primary criteria for resource classification with 80% and 60% regression slope thresholds, respectively, used to separate Measured from Indicated and Inferred resources, but other parameters were also considered, such as distance to closest samples as a proxy for drill spacing. From detailed reserves to mill reconciliation exercises Hudbay conducted at its operating mines, these criteria were found to be a reliable first-pass measure of quarterly and annual performance in tonnes and grade prediction.
The block-by-block coding assignation was then smoothed to remove isolated blocks of one category within another. Globally, proportions of Measured, Indicated, and Inferred category blocks were not changed significantly by this process. Figure 14-15 illustrates the classification before and after smoothing, while Table 14-10 presents the classification proportion before and after smoothing. As for ENVLP6, XYZ, where notable modifications occur, it was deemed that the drilling density is locally high enough to warrant "Inferred" material to be reclassified as "Indicated."
Figure 14-15: Resource Classification at the CMM Deposits

Note: Block-by-block classification (left) and smoothed classification (right).
Table 14-10: Resource Classification Proportion Pre- and Post-Processing
|
ENVLP
|
Measured
|
Indicated
|
Inferred
|
|
Resource (%)
|
Classification
(%)
|
Resource (%)
|
Classification
(%)
|
Resource (%)
|
Classification
(%)
|
|
1
|
37
|
32
|
15
|
17
|
48
|
51
|
|
2
|
22
|
26
|
14
|
19
|
64
|
55
|
|
3
|
19
|
0
|
14
|
34
|
66
|
66
|
|
4
|
23
|
28
|
16
|
24
|
61
|
48
|
|
5
|
20
|
0
|
21
|
69
|
59
|
31
|
|
6
|
55
|
67
|
14
|
26
|
31
|
7
|
14.15 Post-Processing of Dykes, Mined-Out Areas, and Backfill
Once the grade interpolation was validated and the smoothing corrections applied, the underground mined-out areas were coded in the block model (i.e., percentage of the block within the stopes or development).
The mineralized-percent block model was recombined to a full 15 m x 15 m x 15 m block model by calculating the volume-weighted average of a block intersected by dykes. Material inside the dyke solids was assigned a grade of zero. The mined-out areas have historically been given a grade of about 0.30% Cu as the mid-point between the historical operating cut-off of 0.60% Cu for the underground operation and a waste grade of zero. Hudbay has adopted a more conservative approach, using a grade of 0.12% Cu so that blocks inside this zone will be treated as low-grade and processed at the end of the mine life, thus minimizing the risk on short-term production associated to this estimate of metal content based on historical data. The silver and gold grade were calculated based on the linear regressions from the copper grade described earlier in Section 14.3 and a density of 1.9 as assumed for this "broken material." As for the backfill dumped into the pits, the blocks between the as-built and the hardrock surfaces were flagged as CLASS = 4, and considered as waste, with a grade of zero and a density of 2.0.
14.16 Reasonable Prospects for Economic Extraction and Mineral Resource Estimates
The component of the mineralization within the block model that meets the requirements for reasonable prospects of economic extraction was based on the application of the Lerchs-Grossman (LG) algorithm. The Mineral Resources are therefore contained within a computer-generated open pit geometry. Table 14-11 summarizes the Mineral Resource estimates inclusive of the Mineral Reserve estimates at a cut of grade of 0.1% Cu.
Table 14-11: Copper Mountain Mineral Resource Estimates Inclusive of Mineral Reserves
Effective as of December 1, 2023
|
Resource Classification
|
Tonnes
(kt)
|
% Cu
|
Au g/t
|
Ag g/t
|
CuEq %
|
|
Measured
|
225,145
|
0.27
|
0.12
|
0.81
|
0.34
|
|
Indicated
|
273,304
|
0.22
|
0.11
|
0.63
|
0.39
|
|
Measured+Indicated
|
498,450
|
0.25
|
0.12
|
0.71
|
0.32
|
|
Inferred
|
371,319
|
0.25
|
0.13
|
0.61
|
0.34
|
Notes: Totals may not add up correctly due to rounding.
Mineral Resources are estimated as of December 1, 2023, and exclude those Mineral Resources expected to be mined and milled in the month of December 2023, resulting in an effective date of December 1, 2023.
Tonnes and grades constraint to a Lerch-Grossman revenue factor 1 pit shell.
Mineral Resources are not Mineral Reserves as they do not have demonstrated economic viability.
Mineral Resources are reported using long-term copper, gold, and silver prices of US$4.00/lb, US$1,650/oz, and US$22.00/oz, respectively.
Table 14-12 summarizes the Mineral Resource estimates exclusive of the Mineral Reserve estimates at a cut of grade of 0.1% Cu. These Mineral Resource estimates include estimates in all categories inside a pit shell with revenue factor of 1.0, and outside of the Mineral Reserve pit, as well as Mineral Resource estimates within the Mineral Reserve pit but classified as inferred, and as such excluded from the Mineral Reserve estimates but still deemed to have potential for economic extraction with additional infill drilling.
Table 14-12: Copper Mountain Mineral Resource Estimates Exclusive of Mineral Reserves
Effective as of December 1, 2023
|
Resource Classification
|
Tonnes
(kt)
|
% Cu
|
Au g/t
|
Ag g/t
|
CuEq %
|
|
Measured
|
41,198
|
0.21
|
0.09
|
0.73
|
0.27
|
|
Indicated
|
96,615
|
0.21
|
0.11
|
0.68
|
0.29
|
|
Measured+Indicated
|
137,814
|
0.21
|
0.10
|
0.69
|
0.28
|
|
Inferred
|
371,319
|
0.25
|
0.13
|
0.61
|
0.34
|
Notes: Totals may not add up correctly due to rounding.
Mineral Resources are estimated as of December 1, 2023 and exclude those Mineral Resources expected to be mined and milled in December 2023, resulting in an effective date of December 1, 2023.
Tonnes and grades constraint to a Lerch-Grossman revenue factor 1 pit shell.
Mineral Resources are not Mineral Reserves as they do not have demonstrated economic viability.
Mineral Resources are reported using long-term copper, gold, and silver prices of US$4.00/lb, US$1,650/oz, and US$22.00/oz, respectively.
14.17 Reconciliation
To validate the resource model, tonnes and grade reported at the operating cut-off for the areas that have been mined between December 2020 and October 2023 were compared against the credited mill production. The results presented in Table 14-13 confirm that the mine production of the 35-month period is predicted by the 2023 block model within very close limits both for tonnes (+4%), grade (+3%) and metal content (+6%). Overall, the model performs well, and as such constitutes a reliable and prudent basis to develop a LOM plan for the CMM. The SMU dimensions adopted for this reconciliation work are 15 m x 15 m x 15 m, as per the current operating practice.
Table 14-13: December 2020 to October 2023 Mineral Reserve Estimates vs. Plant Reconciled Results
|
|
Tonnes
(kt)
|
Cu%
|
Cu Tonnes
|
|
Plant and Dispatch Data (December 2020 to October 2023)
|
38,200
|
0.31
|
118,000
|
|
Hudbay 2023 Model
|
36,800
|
0.30
|
111,000
|
|
Model vs. Mill-Reconciled Data
|
+4%
|
+3%
|
+6%
|
Table 14-14 presents a comparison of the Measured + Indicated and Inferred Mineral Resource estimates inclusive of Mineral Reserve estimates reported by CMMC in Holbek et al. (2019) and in Redmond et al. (2022) with the current 2023 estimates from Hudbay. Table 14-14 shows a reasonable agreement between the 2019 CMMC and the 2023 Hudbay estimates after mining depletion and considering a reclassification of some of the Indicated Mineral Resource estimates to the Inferred category, as well as some exploration successes since 2019 that have resulted in the addition of high-grade resources. The 2022 CMMC estimates are deemed to represent an anomaly, with an inflated estimate of the Mineral Resources due to the use of optimistic assumptions
Table 14-14: Reconciliation between the 2019, 2022, and 2023 Copper Mountain
Mineral Resource Estimates
|
Categories
|
CMMC 2019 PFS
(as of January 1, 2019)
|
CMMC 2022 PFS
(as of August 1, 2022)
|
Hudbay 2023
(as of December 1, 2023)
|
|
Tonnes
(Mt)
|
Cu
(%)
|
Au
(ppm)
|
Ag
(ppm)
|
Tonnes
(Mt)
|
Cu
(%)
|
Au
(ppm)
|
Ag
(ppm)
|
Tonnes
(%)
|
Cu
(%)
|
Au (ppm)
(%)
|
Ag (ppm)
(%)
|
|
Measured + Indicated
|
549
|
0.24
|
0.11
|
0.75
|
1,080
|
0.22
|
0.09
|
0.65
|
440
|
0.25
|
0.12
|
0.73
|
|
Inferred
|
237
|
0.21
|
0.10
|
0.50
|
446
|
0.19
|
0.09
|
0.54
|
371
|
0.25
|
0.13
|
0.61
|
Notes: PFS = prefeasibility study.
Cut-off at 0.10% Cu.
Mineral Resources are constrained by a $3.50/lb Cu pit shell.
The mining depletion that occurred between the CMMC 2022 and Hudbay 2023 PFS is a non-factor when it comes to explaining the significant difference between the two Mineral Resource estimates. The major factors contributing to the difference between CMMC's and Hudbay's are as follows.
Factor 1: Hudbay constrained the Mineral Resource estimate within smooth and continuous 0.1% Cu grade-shells in order to prevent smearing of high grade samples into non mineralized areas. Figure 14-16 displays CMMC's 2022 PFS block model above 0.1% Cu and Hudbay 0.1% Cu grade shells (wireframes and lines in white). It can be observed that the unconstrained approach followed by CMMC in 2022 has led to grade smearing outside the actual mineralized zones, hence leading to the overestimation of Mineral Resources. Whether CMMC's 2022 PFS block model is visualized in plan view, or cross-sections, a large halo of diffused mineralization above 0.1% Cu can be observed. For reference purposes, Hudbay's block model does not have blocks with grades above 0.1% outside the grade shells.
Figure 14-16: Copper Mountain 2022 Block Model vs. Hudbay Grade Shells

Factor 2: While CMMC 2022 PFS block model relied on the original drill hole file, Hudbay replaced the vast majority of non-assayed samples with 0.00001 grades for the construction of the 2023 resource model. This was a necessary correction since these samples were not assayed due to the absence of visual mineralization. The proportions of samples with missing values in the 2022 database were respectively 14% at New Ingerbelle and 22% at Copper Mountain. This was compounded by the absence of grade shell to prevent grade extrapolation into un-mineralized areas during the construction of the 2022 resource model by CMMC.
Factor 3: The CMMC 2022 Mineral Resource classification relied solely on the block distance to drill holes, even if a given drill hole did not have any associated assay results. This led to a higher confidence level than the method used by Hudbay in all its operations and mineral projects.
Factor 4: Hudbay performed smoothing corrections of its OK grade model in order to limit the overestimation of tonnes and underestimation of grades. As an indication, at a cut-off grade of 0.1% Cu, 129 Mt (−14%) are removed compared to the OK model (i.e., 833 MT for the corrected model vs. 962 Mt for the OK model). Not performing smoothing corrections would lead to overestimating the LOM of the operation.
14.18 Conclusion
The Mineral Resource estimation is well-constrained by 3-D wireframes representing geologically realistic volumes of mineralization. EDA has demonstrated that the wireframes are suitable domains for Mineral Resource estimation. Grade estimation has been performed using an interpolation plan designed to minimize bias, and over-smoothing has been addressed to estimate the correct tonnes and grades of the deposits.
Mineral Resources are constrained and reported using economic and technical criteria such that the Mineral Resource has reasonable prospects of economic extraction. The estimated Mineral Resources for the Project conform to the requirements of CIM Definition Standards for Mineral Resources and Mineral Reserves (CIM, 2014) (CIM Definition Standards), and requirements in Form 43-101F1 of NI 43-101, Standards of Disclosure for Mineral Projects (CIM, 2011).
It is the QP's opinion that there are no known factors that could affect the mineral resource estimates presented in Figure 14-11 and Figure 14-12.
15 Mineral Reserve Estimates
Reserves for the CMM are estimated to be 367 Mt grading 0.25% Cu, 0.12 g/t Au, and 0.69 g/t Ag, and have an effective date of December 1, 2023. The Mineral Reserves are defined according to the CIM Definition Standards. A summary of Mineral Reserves is shown in Table 15-1.
Mineral Resources were converted to Mineral Reserves by applying economic factors, generating pit shells through pit optimization, then using those shells to design operationally ready pits. The Mineral Reserves were estimated using an NSR cut-off value of $5.67/t, and a minimum cut-off grade of 0.1% Cu. Measured and Indicated Mineral Resources were converted to Proven and Probable Mining Reserves if they exceeded the NSR cut-off value and minimum copper grade while falling within the mining limits.
In accordance with the CIM Definition Standards, only Measured and Indicated Resources were considered in estimating Mineral Reserves. Inferred Mineral Resources have been treated as waste with an assigned grade of zero.
15.1 Dilution and Mining Recovery
Hudbay considers the Mineral Resource estimation process to account for adequate dilution by using a minimum block size consistent with the dimensions of a SMU. The SMU is the smallest volume that can be selectively mined and is therefore the smallest volume that can be classified as either mineralization or waste. For the Mineral Resource estimate, the block size has been set at 15 m x 15 m x 15 m (X, Y, Z). The mineable tonnage and grade are estimated within the block, and if the average grade of the SMU is greater than the cut-off value and minimum copper grade of 0.1%, the SMU is classified as mineralization.
The SMU dimensions are large enough to incorporate sufficient dilution for the geometry of the mineralization. The implicit inclusion of dilution in the SMU will also result in some mineralization loss from the Mineral Resource, where the grade of the SMU drops below the economic cut-off value and minimum copper grade of 0.1%.
Because of the adopted Mineral Resource estimation methodology, no further modifying factors for dilution or mineralization loss were applied to the resource block model for use in mine planning and reporting.
15.2 Geotechnical Considerations
WSP Consultants has provided geotechnical support to the CMM since 2011. This work includes geotechnical recommendations and conformance reporting. In advance of this Technical Report, WSP Consultants summarized the latest recommendations, which have been incorporated into the pit optimization process and mine design. Geotechnical recommendations by sector are discussed in more detail in Section 16.
15.3 Pit Optimization
The resource block model was reviewed prior to converting Mineral Resources to Mineral Reserves. Mineral Reserves were estimated by generating a series of pit shells using a Lerchs-Grossmann optimization algorithm.
Geotechnical parameters were added to each block to ensure that the pit optimization process adhered to the appropriate inter-ramp angles. Economic parameters were included by estimating the NSR value of each block. The NSR value considers metal prices, off-site costs, royalties, metal recoveries, concentrate transportation costs, smelter-related costs, deductions, and exchange rate. Operating costs (milling, mining, and general and administrative [G&A]) were also applied in the pit optimization process. Mining costs were incrementally adjusted at lower elevations to account for increasing haulage costs at greater pit depths.
Total and incremental profit of the pit shells were estimated, and shells were selected for phase and ultimate pit designs. The design process includes adding ramps and benches that align with WSP Consultants' geotechnical recommendations to ensure operational feasibility. These designs were then used in the LOM plan.
15.4 Mineral Reserve Statement
To be considered as part of the Mineral Reserve estimate, the NSR of a given diluted block needed to exceed $5.67/t and meet a minimum copper grade of 0.1% Cu while falling within the mining limits. The NSR cut-off was established as an estimate of the fixed component of the total mining, milling, and overhead costs in order to ensure that each block would have a positive contribution margin.
It is the QP's opinion that the classification of Proven and Probable Mineral Reserves as estimated in Table 15-1 meets the definitions of Proven and Probable Mineral Reserves in NI 43-101 and the CIM Definition Standards.
15.5 Factors that may Materially Affect Mineral Reserves
Mineral Reserves are most sensitive to the estimated grade, metal prices, and metallurgical recoveries, but can also be affected by operating cost assumptions.
Hudbay has obtained the major required permits for the Mineral Reserves in the mine plan, although there are areas that will require permit amendments (e.g., the New Ingerbelle Pit). Detailed information on permitting can be found in Section 20.
Table 15-1: Copper Mountain Mine Mineral Reserves, December 1, 2023
|
Category
|
Tonnes
(kt)
|
Cu Grade
(% Cu)
|
Au Grade
(g/t)
|
Ag Grade
(g/t)
|
Cu Pounds
(Mlb)
|
Au Ounces
(koz)
|
Ag Ounces
(koz)
|
CuEq
(%)
|
|
Proven
|
|
|
|
|
|
|
|
|
|
Mined Tonnes
|
194,199
|
0.27
|
0.12
|
0.78
|
1,168
|
775
|
4,880
|
-
|
|
Stockpile
|
838
|
0.15
|
0.05
|
0.59
|
3
|
1
|
16
|
-
|
|
Total Proven
|
195,037
|
0.27
|
0.12
|
0.78
|
1,171
|
777
|
4,896
|
0.35
|
|
Probable
|
|
|
|
|
|
|
|
|
|
Mined Tonnes
|
118,226
|
0.25
|
0.14
|
0.65
|
659
|
524
|
2,489
|
-
|
|
Stockpile
|
53,717
|
0.16
|
0.04
|
0.45
|
185
|
69
|
779
|
-
|
|
Total Probable
|
171,943
|
0.22
|
0.11
|
0.59
|
844
|
593
|
3,268
|
0.30
|
|
Proven + Probable
|
|
|
|
|
|
|
|
|
|
Mined Tonnes
|
312,425
|
0.27
|
0.13
|
0.73
|
1,827
|
1,299
|
7,370
|
-
|
|
Stockpile
|
54,555
|
0.16
|
0.04
|
0.45
|
188
|
71
|
795
|
-
|
|
Total
|
366,980
|
0.25
|
0.12
|
0.69
|
2,015
|
1,370
|
8,164
|
0.33
|
Notes: CIM Definition Standards were followed for Mineral Reserves.
Mineral Reserves have an effective date of December 1, 2023, but were generated excluding the Measured and Indicated Mineral Resource estimates planned to be mined and milled in the month of December 2023.
Mineral Reserves are reported using an NSR cut-off value of $5.67 that meet a minimum 0.10% Cu grade.
Mineral Reserves are reported using long-term copper, gold, and silver prices of US$3.75/lb, US$1,650/oz, and US$22.00/oz, respectively.
Average density is 2.78 t/m3 for hard rock material, 2.0 t/m3 for stockpiled material, and 1.90 t/m3 for material in old stopes from previous underground mining activities.
Stockpile tonnes and grade are based on historical production grade control processes.
Totals may not add due to rounding.
16 Mining Methods
16.1 Mining Overview
Mining at the CMM is by conventional open pit methods. The major components of this mining method are blasthole drilling, blasting, loading, and hauling. The current mining fleet consists of three electric shovels, one diesel shovel, twenty-eight 220-tonne haul trucks, three electric production drills, two diesel production drills, and related ancillary equipment. The expected peak requirement of equipment can be found in Section 16.5.
Mining at the CMM consists of two areas: the Copper Mountain Pits (currently in operation) and New Ingerbelle. There is also a low-grade stockpile that will be reclaimed during the mine life.
Using an effective date of December 1, 2023, the mine life will be 21 years inclusive of stockpile reclaim. During the LOM an estimated 367 Mt of Proven and Probable Mineral Reserves will be milled, 1,179 Mt of material will be mined from the pits, and a total of 54.6 Mt will be reclaimed from the inventory of high- and low-grade stockpiles projected as of January 1, 2024. The mill throughput rate will ramp up to 50 kt/d by 2027 and will remain at that rate for the remainder of the mine life. To uncover high-grade ore early in the mine life, the total material movement will reach 114.0 Mt in 2025 and gradually decrease as the strip ratio improves. The production schedule is shown in Section 16.4.4.
16.2 Pit and Waste-Rock Storage Area Design Criteria
The Copper Mountain and New Ingerbelle Ultimate Pits is shown in Figure 16-1. The geotechnical parameters used for pit and WRF design have been supplied by WSP. Golder (now WSP) has been CMM's geotechnical consultant since 2012 and has provided geotechnical recommendations on pit and WRF design during that time (WSP 2023a & 2023b). This work includes field investigation, support on geotechnical drilling programs, and regular slope-stability design review. Pit walls are designed to never exceed WSP's set parameters and are provided as zones to account for varying lithologies, alterations, and local ground conditions. These zones are presented in Table 16-1; Figure 16-2 provides their relative locations. Ramp widths are designed at 33.5 m when accommodating dual-lane traffic. In the few cases where single-lane traffic is required, a designed ramp width of 25 m is used. All ramp grades are designed at 10%.
Figure 16-1: Copper Mountain and New Ingerbelle Ultimate Pits

Table 16-1: Pit Wall Slope Parameters
|
|
Zone
|
Domain
|
Sector
|
Criteria
|
Bench Height
(m)
|
Batter Angle
(°)
|
Catch-Bench Width
(m)
|
Estimated Inter-Ramp Angle
(°)
|
New Ingerbelle and Copper Mountain Pits
|
Upper North Wall Structural Domain
|
Polygon assignment (Zone 10):
dominant over alteration zones
|
New Ingerbelle-10
|
Double Bench
|
30
|
70
|
14
|
50.3
|
|
Lower North Wall Structural Domain
|
Polygon assignment (Zone 11):
dominant over alteration zones
|
New Ingerbelle -11
|
Double Bench
|
30
|
70
|
15.94
|
48.2
|
|
Un-Daylighted Wedge Failure Domain
|
Polygon assignment (Zone 12):
dominant over alteration zones
|
New Ingerbelle -12
|
Single bench
|
15
|
70
|
9.50
|
45.1
|
|
West Zone
|
Alteration Zone 8
|
New Ingerbelle -8
|
Single bench
|
15
|
70
|
10.70
|
42.9
|
|
Central Zone
|
Alteration Zone 3, 4
(except where overwritten by 10, 11, 12)
|
New Ingerbelle -3, 4
|
Double Bench
|
30
|
70
|
14.45
|
49.8
|
|
South Zone
|
Alteration Zones 1, 2
|
New Ingerbelle -1, 2
|
Double Bench
|
30
|
70
|
14.45
|
49.8
|
|
North Pit
|
North Pit
|
1
|
Single Bench
|
15
|
70
|
8.0
|
48.1
|
|
Volcanics Zone
|
Golder Design Sector 2
(Volcanics)
|
2
|
Double Bench
|
30
|
72
|
14.55
|
51.0
|
|
Dyke Zone
|
Golder Design Sector 3
(Felsic dykes)
|
3
|
Single Bench
|
15
|
70
|
9.75
|
44.6
|
|
Pit 3 East Wall Zone
|
Golder Design Sector 6
(Southeast wall failure zone)
|
4
|
Single Bench
|
15
|
73.7
|
10.7
|
44.8
|
|
CMS Zone Outside of Wedge Areas
|
Golder Design Sector 1
(Intrusive Stock)
|
5
|
Double Bench
|
30
|
70.5
|
10.5
|
55.0
|
|
Stopes
|
Golder Design Sector 4
(Caved Zone)
|
6
|
Single Bench
|
15
|
70
|
14.4
|
37.1
|
|
Cracking Zone
|
Golder Design Sector 5
(Subsidence Zones)
|
7
|
Single Bench
|
15
|
70
|
9.75
|
44.6
|
|
Overburden / Fill Zone
|
Coded for excavation in
WRFs and LGO stockpiles
|
8
|
Single Bench
|
15
|
37
|
13
|
24
|
|
Tremblay Fault Zone
|
Narrow zone along
Tremblay fault, 30-m offset
|
9
|
Single Bench
|
15
|
70
|
9.75
|
44.6
|
|
Albite Domain Sector 1
|
|
10
|
Double Bench
|
30
|
66.6
|
12.00
|
50.2
|
|
Albite Domain Sector 2
|
|
11
|
Double Bench
|
30
|
60.7
|
12.00
|
46.1
|
|
Albite Domain Sector 3
|
|
12
|
Double Bench
|
30
|
59.7
|
12.00
|
45.5
|
|
Albite Domain Sector 4
|
|
13
|
Double Bench
|
30
|
65.6
|
12.00
|
49.5
|
|
Albite Domain Sector 5
|
|
14
|
Double Bench
|
30
|
65.6
|
12.00
|
49.5
|
|
Hornfelsed Volcanic Altered Domain
|
|
15
|
Double Bench
|
30
|
68
|
12.00
|
51.2
|
Figure 16-2: Geotechnical Zones

Table 16-2 summarizes the WRF design parameters. The LOM plan also uses in-pit disposal in the former Pit 2 area. The pit design parameters are given in Table 16-3.
Table 16-2: Copper Mountain Mine WRF Design Criteria
|
Input Factor
|
Unit
|
Copper Mountain
|
New Ingerbelle
|
|
Road Grade
|
%
|
10
|
10
|
|
Minimum Road Width
|
m
|
33.5
|
33.5
|
|
Catch-Bench Width
|
m
|
17.5
|
17.5
|
|
Loose Density
|
t/m3
|
2.00
|
2.00
|
|
Angle of Repose
|
H:V
|
1.32:1
|
1.32:1
|
|
Lift Slope
|
degree
|
37
|
37
|
|
Overall Slope
|
degree
|
26
|
26
|
|
Typical Lift Height
|
m
|
25
|
25
|
Table 16-3: Copper Mountain Mine Planning Parameters
|
Description
|
Unit
|
CM Main Pit
|
New Ingerbelle
|
|
Inter-Ramp Pit Slopes (Average)
|
degree
|
Varies by Zone
|
Varies by Zone
|
|
Batter (Bench Face Angle)
|
degree
|
Varies by Zone
|
Varies by Zone
|
|
Bench Height
|
m
|
15
|
15
|
|
Berm Width (Catch Bench)
|
m
|
Varies by Zone
|
Varies by Zone
|
|
Haul Road Width (Double-Lane Traffic)
|
m
|
33.5
|
33.5
|
|
Pit Bottom Road Width (Single-Lane Traffic)
|
m
|
25
|
25
|
|
Benching Method (Single- or Double Benching)
|
|
Varies by Zone
|
Varies by Zone
|
|
Haul Road Grade
|
%
|
10
|
10
|
|
Intact Rock Density
|
t/m3
|
2.78
|
2.78
|
|
Fill Rock Bulk Density
|
t/m3
|
2.00
|
2.00
|
16.3 Pit Dewatering
Generally, pit dewatering at CMM has included two components: pumping and monitoring groundwater levels. Most of the groundwater and surface water encountered during mining reports to the pit bottom. The water is then pumped out of the pit bottom in advance of mining to those elevations.
Copper Mountain has historically not had significant work interruptions due to pit dewatering issues, and it is anticipated the current pumping methods will be sufficient to keep the pits dewatered. However, an allowance for groundwater monitoring, pumping, and hydrogeological modelling has been included in the sustaining capital estimate.
The existing pit at New Ingerbelle will require dewatering in advance of mining. A preliminary cost estimate has been generated and is included in the capital estimate.
16.4 Life-of-Mine Production Schedule and Sequence
16.4.1 Sequence, Dilution, and Mill-Feed Cut-Off Strategy
Hudbay has conducted trade-off studies between various scenarios for the life of mine plan all aiming at uncovering high-grade mill feed early in the mine life. The base case selected for the LOM plan adopted in the Technical Report constitutes a conservative approach to maximize high grade access while adhering to known geotechnical requirements outlined in Section 16.2. Hudbay has identified opportunities to reduce waste stripping requirements which are not yet at the mature level of engineering required to comply with NI 43-101 requirements but the Hudbay intends to fully develop and demonstrate these improvements in the coming months and as such the extra 40 Mt of capitalised stripping is considered as a discretionary investment that could be reduced or deferred to a later date but is fully costed in the technical report.
16.4.2 Dilution and Mill-Feed Cut-Off Strategy
The block size for use in the block model supporting the production schedule is set at 15 m x 15 m x 15 m (X, Y, Z). This block size is consistent with the SMU and represents the smallest volume that can be independently mined as ore or waste. The SMU dimensions are large enough to incorporate sufficient dilution for the geometry of the mineralization, and material can only be classified as ore if the value of the block exceeds an NSR cut-off value of US$5.67/t and a minimum copper grade of 0.1%. In cases where more ore is mined in a year than can be processed, higher NSR values will be used to prioritize mill feed, with the remaining material stockpiled to be fed at a later date. The implicit inclusion of dilution in the SMU will also result in some ore loss from the Mineral Resource (represented as waste in the production schedule), where the grade of the SMU drops below the economic cut-off value and minimum copper grade of 0.1%.
Because of the adopted resource estimation methodology, no further modifying factors for dilution or ore loss were applied to the resource block model when converting Measured and Indicated Mineral Resources to Mineral Reserves.
The LOM mine production plan and processing schedule use only Proven and Probable Mineral Reserves (Measured and Indicated Resources converted). No Inferred Resources are included in the LOM mining and processing schedule shown in Table 16-4.
16.4.3 New Ingerbelle Development
The proposed New Ingerbelle development plan involves renewing mining activities in the historical Ingerbelle open pit on the west side of the Similkameen River. The reserves from New Ingerbelle will be processed in the existing milling facility at Copper Mountain and the tailings generated from processing will also be stored at the existing TMF on the Copper Mountain side of the Similkameen River.
16.4.3.1 New Ingerbelle Mining Development Plan
The New Ingerbelle Open Pit Push-Back and Mine Life Extension (New Ingerbelle Project) development plan includes several key components:
• A three-phase push-back of the historical Ingerbelle Pit
• Constructing two Waste Rock Facilities (to the north and the south of the proposed pit) to accommodate all waste generated from the New Ingerbelle Pit, and a low-grade stockpile to the south of the New Ingerbelle Pit to facilitate a variable cut-off grade strategy
• Developing haul-road access connecting the New Ingerbelle Pit to the WRFs
• Installing a clear-span bridge over the Similkameen River connecting the Copper Mountain and New Ingerbelle haul roads
• Developing haul-road access connecting the Copper Mountain and Ingerbelle sides of the river to allow for ore haulage from New Ingerbelle to the existing mill.
The haul road connecting the bridge to the Copper Mountain milling facility on the east side of the river (mentioned above) will be cut from the original topography and is designed to be approximately 2.5 km long at a 10% grade. This road (the east haul road) will be trolley capable, presenting an opportunity for future study. It is projected that the excavation of the east haul road will be undertaken by a contractor and is reflected in the capital estimate. The tonnages for the east haul road are not shown in Table 16-4.
The New Ingerbelle Pit will be mined using the planned fleet at Copper Mountain, and no additional equipment will be required for its development. Equipment and personnel will access the New Ingerbelle Pit via Copper Mountain, and mine operations will continue to be directed from the Copper Mountain side of the Similkameen River.
There are no plans for fixed maintenance services on the west side of the Similkameen River. Shop maintenance will continue to be conducted at the existing Copper Mountain truck shop on the east side of the Similkameen River. The mobile maintenance group will continue to attend to service needs of the New Ingerbelle mining fleet in the field as is currently the case at Copper Mountain.
Additional infrastructure required for developing the New Ingerbelle Pit is discussed in Section 18.
16.4.4 Production Schedule
16.4.4.1 Lif-of-Mine Production Scheduling Criteria
The mining schedule is based on operating 24 h/d, 365 d/a. The mine operations and mine maintenance departments' shift schedules are planned to continue to be two 12 h shifts per day, using four alternating crews. This schedule is quite common and acceptable in Canada. Mining rate varies through the mine life depending on waste stripping requirements and haulage distances. The peak mining rate occurs in 2025 and gradually decreases as waste-stripping demand declines.
The mining production schedule was derived from applying loading and hauling equipment productivities and key performance indicators (KPI) to the above-mentioned mining sequence. When required, due to long hauls, additional hauling units are projected to be purchased. The mine phases allow for a balance between total material movement, mill feed requirements, and maximizing mill feed-grade using the projected mining fleet. The mine plan is based on an average mill throughput of 41 kt/d in 2024, increasing to 50 kt/d in 2027. The copper metallurgical recovery will also increase as operational improvements are initiated. Recoveries vary by ore source and fluctuate depending on where mill feed originates.
16.4.4.2 Advanced Waste Stripping
From 2024 though 2026, additional waste stripping will take place to address a backlog of waste mining and increase the exposure of high- grade reserves. It is projected that the Copper Mountain fleet and personnel will be accountable for 94 Mt/a of total material movement during this period, and a contractor miner will be responsible for the remainder of the projected material movement. Between the second half of 2024 and mid-2026, the contractor will be responsible for moving 10 Mt in 2024, 20 Mt in 2025, and 10 Mt in 2026.
The projected long-term mine plan is presented in Table 16-4, and the annual material movement is shown in Figure 16-3.
Table 16-4: Copper Mountain LOM Mine Schedule-2024-2044
| Category |
Unit |
LOM Total/Avg. |
2024 |
2025 |
2026 |
2027 |
2028 |
2029-2033 |
2034-2038 |
2039-2044 |
| Ex-Pit Mining |
|
|
|
|
|
|
|
|
|
|
| Ore Mined from Pit |
kt |
312,425 |
18,983 |
22,363 |
14,020 |
20,710 |
21,096 |
102,055 |
92,300 |
20,898 |
| Waste Mined from Pit |
kt |
866,559 |
82,832 |
91,637 |
86,480 |
63,290 |
48,904 |
237,945 |
224,700 |
30,770 |
| Total Mined from Pit |
kt |
1,178,984 |
101,815 |
114,000 |
100,500 |
84,000 |
70,000 |
340,000 |
317,000 |
51,669 |
| Mined Stripping Ratio |
w:o |
2.8 |
4.4 |
4.1 |
6.2 |
3.1 |
2.3 |
2.3 |
2.4 |
1.5 |
| Stockpile Movement |
|
|
|
|
|
|
|
|
|
|
| High-Grade Stockpile Starting Balance |
kt |
- |
1,258 |
- |
- |
- |
- |
- |
- |
- |
| Material Mined to High-Grade Stockpile |
kt |
- |
0 |
- |
- |
- |
- |
- |
- |
- |
| Reclaimed to Mill from High-Grade Stockpile |
kt |
- |
1,258 |
- |
- |
- |
- |
- |
- |
- |
| High-Grade Stockpile Ending Balance |
kt |
- |
0 |
- |
- |
- |
- |
- |
- |
- |
| Low-Grade Stockpile Starting Balance |
kt |
- |
53,297 |
58,530 |
64,468 |
60,968 |
63,428 |
66,224 |
76,979 |
77,979 |
| Material Mined to Low-Grade Stockpile |
kt |
- |
6,160 |
5,938 |
0 |
2,460 |
2,796 |
10,755 |
1,000 |
0 |
| Reclaimed to Mill from Low-Grade Stockpile |
kt |
- |
927 |
0 |
3,500 |
0 |
0 |
0 |
0 |
77,979 |
| Low Grade Stockpile Ending Balance |
kt |
- |
58,530 |
64,468 |
60,968 |
63,428 |
66,224 |
76,979 |
77,979 |
0 |
| Total Material Movement |
|
|
|
|
|
|
|
|
|
|
| Total Material Movement |
kt |
1,262,648 |
104,000 |
114,000 |
104,000 |
84,000 |
70,000 |
340,000 |
317,000 |
129,648 |
| Mill Feed |
|
|
|
|
|
|
|
|
|
|
| Mill Feed Tonnes |
kt |
366,980 |
15,008 |
16,425 |
17,520 |
18,250 |
18,300 |
91,300 |
91,300 |
98,877 |
| Copper Grade |
% Cu |
0.25 |
0.30 |
0.29 |
0.33 |
0.32 |
0.36 |
0.27 |
0.24 |
0.17 |
| Gold Grade |
g/t |
0.12 |
0.07 |
0.10 |
0.07 |
0.11 |
0.12 |
0.16 |
0.15 |
0.07 |
| Silver Grade |
g/t |
0.69 |
1.12 |
0.90 |
1.27 |
1.07 |
1.17 |
0.60 |
0.54 |
0.55 |
| Copper Recovery |
% |
85.7 |
82.5 |
84.0 |
84.0 |
85.6 |
85.5 |
86.7 |
86.4 |
85.1 |
| Gold Recovery |
% |
68.3 |
65.0 |
65.0 |
65.0 |
67.9 |
67.8 |
69.6 |
69.0 |
66.0 |
| Silver Recovery |
% |
68.5 |
70.0 |
70.0 |
70.0 |
69.2 |
69.2 |
66.5 |
67.1 |
69.6 |
| Recovered Metal |
|
|
|
|
|
|
|
|
|
|
| Copper |
Mlb |
1,726 |
82 |
88 |
108 |
111 |
124 |
475 |
425 |
313 |
| Gold |
koz |
935 |
21 |
36 |
26 |
44 |
47 |
321 |
302 |
138 |
| Silver |
koz |
5,590 |
378 |
334 |
500 |
434 |
477 |
1,174 |
1,067 |
1,225 |
Notes: LOM plan contains only Proven and Probable Mineral Reserves.
Inferred Mineral Resources are treated as waste.
Numbers may vary due to rounding.
Figure 16-3: Annual Material Movement

16.5 Mine Equipment
At peak requirement, the CMM mining fleet (excluding contractor equipment) will consist of three electric shovels with 42 m3 buckets, one 22 m3 bucket diesel shovel, one front-end loader, thirty-seven 220-tonne haul trucks, five drills, and related ancillary equipment. Hudbay believes the mining method and mine design criteria-including bench heights, road widths, and pit slopes-are appropriate for mining the orebody. Table 16-5 summarizes the major CMM peak equipment requirements.
Table 16-5: Copper Mountain Mine Pit Equipment Fleet, Peak Production
|
Max No. of Units During LOM
|
Type
|
Description
|
|
3
|
Front shovel
|
42 m3
|
|
1
|
Front shovel
|
22 m3
|
|
1
|
Front end loader
|
Cat 994k
|
|
37
|
Truck
|
220 t
|
|
6
|
Track dozer
|
22 m3 or similar
|
|
3
|
Blasthole drill
|
Atlas Copco PV271
|
|
2
|
Blasthole drill
|
Atlas Copco PV351
|
|
1
|
Blasthole drill
|
Atlas Copco DML-HP
|
|
4
|
Motor grader
|
Caterpillar 16M
|
|
3
|
Water truck
|
Road maintenance water trucks
|
|
3
|
Articulated trucks
|
Articulated trucks
|
|
1
|
Excavator
|
Komatsu PC-400
|
|
1
|
Excavator
|
Komatsu PC-200
|
|
1
|
Excavator
|
Komatsu PC-490
|
|
Max No. of Units During LOM
|
Type
|
Description
|
|
2
|
Small excavator
|
Hitachi 350
|
|
1
|
Backhoe loader
|
Caterpillar 420D
|
|
2
|
Wheel loader
|
Komatsu WA-600
|
|
2
|
Stemming loader
|
Komatsu WA-180
|
|
1
|
Cable reeler
|
Caterpillar 980C
|
|
1
|
Tire manipulator
|
Caterpillar 980G
|
|
1
|
Support loader
|
Caterpillar 988
|
|
2
|
Water pumps
|
Water Pumps
|
|
2
|
Fuel/lube truck
|
Fuel/lube truck
|
|
5
|
Mobile cranes
|
Various capacities
|
|
2
|
Crew bus
|
Crew bus
|
|
3
|
Mechanic service/welding truck
|
Mechanic service/welding truck
|
|
4
|
Aerial lift
|
Aerial lift
|
|
2
|
Drill support water trucks
|
Drill support/water trucks
|
17 Recovery Methods
The processing plant consists of a standard crush-grind-flotation circuit that operates two 12-hour shifts per day, 365 d/a, with targeted plant availability of 92%. The process plant has an installed capacity of 45 kt/d via a comminution circuit consisting of a primary and secondary crushing circuit reducing the feed down to minus 40 mm ahead of a semi-autogenous grinding (SAG) mill, ball mill, and pebble crusher grinding circuit further reducing the feed size to P80 150 µm. The process plant flowsheet at 45 kt/d is illustrated in Figure 17-1.
The comminution circuit is followed by a sulphide flotation circuit that produces a copper-silver-gold concentrate. The unthickened flotation tailings are transported via a gravity pipeline to the TMF, with the sands and slime separation occurring on the TMF's dam walls via mobile cyclone units. The concentrate is dewatered via two pressure filters and stored on site before transport via truck to the Port of Vancouver for shipment to the final customers.
17.1 Process Plant Description
The areas of the process plant consist of the following unit operations:
- Primary and secondary crushing
- Primary and secondary grinding
- Sulphide flotation circuit
- Thickening, filtration, and loading of copper concentrates.
17.1.1 Crushing Circuit
Run-of-mine (ROM) is direct-dumped into the primary gyratory crusher at a nominal rate of 2,343 t/h. The primary crushed mineralization is transported from the primary crusher surge pocket up a 1,800 mm-wide variable-speed conveyor where it can be directed either to the SAG-feed stockpile or the secondary crusher-feed surge pile. The feed reporting to the secondary surge pile is reclaimed via two vibratory feeders at a nominal rate of 2,343 t/h via a variable-speed conveyor and is fed to the secondary crusher scalping screen.
The secondary crusher scalping screen is a double-deck screen with a bottom-deck aperture size of 38 mm. All feed passing through the bottom-deck aperture reports to the secondary crushing-product conveyor belt, with all oversize feed reporting via gravity to the secondary crusher. The secondary crusher is configured with a short-head liner package and operates with a variable closed-side setting (CSS) based on the downstream SAG-feed stockpile level. The secondary crusher product combines with the screen undersize and is conveyed to the SAG-feed stockpile.
The fine-ore stockpile has a single reclaim chamber, a live capacity of 20,000 tonnes, and a total capacity of more than 300,000 tonnes when pulled out with mobile equipment. Reclamation of the mineralization from the stockpile is accomplished using three reclaim feeders, with each feeder fitted with a real-time sizing camera. The draw rate from each feeder is variable and is controlled to maintain a constant feed-rate and particle size to the SAG mill.
Figure 17-1: Process Plant 45 kt/d Flowsheet

Major equipment in the grinding and classification area will include:
- Metso Superior MKII Primary Gyratory Crusher, 60 inch by 89 inch, installed power 600 kW
- FLSmidth Raptor XL2000 Secondary Cone Crusher, installed power 1800 kW.
17.1.2 Grinding and Classification
Ore reclaimed from the SAG-feed stockpile is fed to a single variable-speed primary SAG mill operating in closed circuit with a single-duty pebble crusher. The nominal fresh-feed rate to the SAG mill is 2,038 t/h, with a variable pebble recycle-rate of 5% to 10% depending on the feed-ore size. The SAG mill total load is maintained at 24% to 26%, including an 18% ball charge. The SAG discharge is screened via a single-duty, single-deck vibratory screen with 15 mm apertures. The screen oversize reports to the pebble-crushing circuit while the screen undersize reports to the SAG transfer-pump box.
The SAG-mill discharge-screen undersize is pumped from the SAG transfer-pump box to a splitter box, where the slurry is distributed to the three ball mill circuits. Each of the ball mill circuits is fitted with a variable-speed drive and operates in closed circuit, with a dedicated cyclone pack per ball mill. Each ball mill circuit operates with a nominal 300% recirculating load, with the cyclone overflow gravitating to the head of the flotation circuit, and the cyclone underflow gravitating to the ball mill feed-chute. The ball mill circuits produce a flotation feed at a nominal P80 150 µm.
Major Equipment in the grinding and classification area will include:
- One SAG mill, 34 ft in diameter by 20 ft effective grinding length (EGL), installed power 13,560 kW
- Two ball mills, 24 ft in diameter by 39.5 ft EGL, installed power 13,560 kW
- One ball mill, 22 ft in diameter by 28 ft EGL, installed power 12,500 kW
- SAG transfer pumps (1 duty, 1 standby), installed power
- Cyclone feed pumps (1 duty, 1 standby), installed power
- Pebble crusher, FLS XL900 Raptor, installed power 675 kW.
17.1.3 Flotation Circuit
The three cyclone overflow streams gravitate to the flotation-feed splitter box where the mineral collectors and frother are added. The cyclone overflow is split down two rougher trains, each consisting of five OK160 tank cells. The rougher tailings from both trains recombine, and are further processed to recover remaining sulphide minerals via two OK300 tank cells operating as rougher scavengers. The tailings from the rougher scavengers flow via gravity to the tailings dam, and the concentrate combines with the rougher concentrate generated from the two rougher trains and is pumped to the regrind mill.
The combined rougher concentrate is ground in a regrind ball mill to P80 30 µm. The regrind ball mill is operated in closed circuit with cyclones, with the cyclone overflow pumped onwards to the cleaner circuit, and the cyclone underflow reporting to the regrind ball mill. A portion of the cyclone underground is fed to a rougher-cleaner flash flotation-cell where full, liberated, coarse-copper minerals are recovered at final concentrate grade and report to the final concentrate thickener.
The regrind cyclone overflow is pumped to the first cleaner, which consists of three Eriez columns operating in parallel. The first cleaner concentrate gravitates to the second cleaner-three direct flotation reactors (DFR) in series. The second cleaner concentrate is pumped to the final concentrate thickener while the DFR tailings returns to the first cleaner feed. The tailings from the first cleaner are pumped to the cleaner-scavenger bank. The cleaner scavengers consist of five OK70 tank cells. The cleaner-scavenger concentrate is pumped to the regrind ball mill while the cleaner-scavenger tailings are combined with the rougher-scavenger tailings and report to the tailings dam.
Major equipment in the bulk flotation area will include:
- Ten rougher cells, unit model OK160 tank cells
- Two rougher-scavenger cells, unit model OK300 tank cells
- Two first-cleaner columns, 3.7 m (d) x 12 m (h)
- One first-cleaner column, 6 m (d) x 14 m (h)
- Three DFR second cleaners
- Five cleaner-scavenger cells, model OK70 tank cells
- Regrind ball mill, 14 ft in diameter by 28.5 ft EGL, installed power 2687 kW
- One regrind flash-flotation rougher cell, model Skimair 240
- One regrind flash-flotation cleaner cell, model OK5 tank cell.
17.1.4 Copper-Concentrate Dewatering
The copper concentrate produced by the second cleaner and flash flotation cleaner all report to the final concentrate high-rate thickener. The thickener overflow water is reused in the grinding and flotation circuits. The copper-concentrate thickener underflow is pumped to an agitated-concentrate stock tank prior to the filtration process. Two pressure filters are employed to dewater the copper concentrate to <9% moisture, with the concentrate dropping via gravity directly into the concentrate storage shed. The concentrate is transported from site to the Port of Vancouver via truck.
Major equipment in the copper-concentrate dewatering area will include:
- One copper-concentrate high-rate thickener, 16 m diameter
- One copper-concentrate stock tank
- Two copper-concentrate pressure filters, 1.5 x 1.5 m plates, 60 plates per filter.
17.1.5 Reagents and Consumables
Various chemical reagents will be added to the processing circuit to modify the mineral particles, to either enhance mineral floatability or chemically break the minerals down and extract the contained elements to the solution phase. The reagents on site are prepared and stored in separate, self-contained areas inside the process plant and delivered to the required processing circuits via dedicated metering pumps. Where reagent mixing is required, fresh water is used.
17.1.5.1 Collectors
PAX in pellet form is shipped to the mine site in bulk bags. The PAX is mixed to a 20% solids w/w solution strength in a mixing tank and stored in a holding tank before being dosed to the flotation circuit via metering pumps.
17.1.5.2 Frother
The frother is received as a liquid in intermediate bulk container (IBC) totes or bulk road transport carriers. The reagent is used at the supplied solution strength. Metering pumps deliver the frother to the flotation circuits.
17.1.5.3 Flocculant
Flocculant powder is delivered to the site in standard 25 kg bags. The flocculant is manually transferred to the flocculant mixing station and mixed 1% solids w/w solution strength. The mixed flocculant solution is held in a storage tank ahead of metering to the copper-concentrate thickener.
17.1.5.4 Quicklime
The quicklime is delivered to the site in standard bulk road transport carriers and is pneumatically transferred to the dry quicklime storage silo. The quicklime is held in the storage tank ahead of dry metering to the regrind mill for use in the flotation cleaner circuit.
17.2 50 kt/d Debottlenecking
The process plant throughput is planned to be stabilized at 45 kt/d throughout 2024-2025, followed by an expansion to 50 kt/d by 2027 via minor capital upgrades targeted at removing process bottlenecks in the primary and secondary crushing circuits, enabling a finer product to be fed to the grinding circuit (Table 17-1). Adding new major equipment is not planned for this stage of debottlenecking.
Table 17-1: Production Ramp-Up Schedule
| Criteria |
Unit |
2024 |
2025 |
2026 |
2027 |
2028 |
| Throughput |
kt/d |
41.1 |
45.0 |
48.0 |
50.0 |
50.0 |
| t/oph |
1,861 |
2,038 |
2,174 |
2,264 |
2,264 |
| Cu Recovery |
% |
83 |
84 |
84 |
86 |
86 |
| Cu Concentrate Grade |
%Cu |
24 |
26 |
26 |
26 |
26 |
| Au Recovery |
% |
65 |
65 |
65 |
68 |
68 |
Note: t/oph = tonnes per operating hour.
17.2.1 Comminution Circuit
The comminution circuit has sufficient installed capacity to achieve greater than 2,200 t/h; this is limited by the crushing circuit's ability to operate consistently under fully choke-fed conditions. When the crushing circuit is not operating under choke-fed conditions, the crushing circuit output coarsens, reducing the SAG mill's capacity. To enable consistent crusher operations and product quality control, the following circuit upgrades are planned to be executed:
- Upgrading the primary gyratory crusher from an MKII to an MKIII Metso Superior model. This upgrade increases the motor power from 600 kW to 1000 kW, enables simpler maintenance while allowing for operation at a tighter CSS.
- Replacing the 500-tonne secondary crusher surge-pile with a +15,000-tonne live-capacity secondary crusher feed-stockpile. The present 500-tonne surge pile is the primary bottleneck in the entire crushing circuit and does not allow the primary and secondary crushers to operate independently of one another. By replacing the surge pile with a large stockpile, both primary and secondary crushers can be operated in choke-fed conditions, and at greater utilization of available runtime.
- Installing new crushing-circuit closing screen. The secondary crusher is currently open circuit to the SAG-feed stockpile, with the material top-size linked to the secondary-crusher open-side setting (OSS). By closing the crushing circuit by installing a screen on the secondary crusher product, the crushing-circuit output size will materially decrease.
- Installing an automated SAG media loader. Presently the SAG media is periodically manually loaded into the mill in 3.5-tonne kibbles. Installing an automated media loader will stabilize SAG-mill power draw and load, allowing for improved operational stability.
- Making other minor circuit upgrades targeting operational stability, including but limited to pebble-belt auto tracker, pebble-belt motor upgrade, belt sizing cameras, cyclone feed-pump flowmeter, and cyclone modifications.
17.2.2 Flotation Circuit
The flotation circuit has sufficient installed capacity to handle additional throughput; however, the increased throughput will lead to an increase in the flotation-feed P80. To ensure flotation recovery is not adversely affected by the increase in flotation-feed P80, the following circuit upgrades are planned:
- Installing centre launder upgrades to the original rougher OK160 tank cells
- Upgrading the cleaner-scavenger pump to enable greater flow
- Modernizing the online stream analysis system
- Upgrading instrumentation to support the ongoing automation and operation of the expert system.
Table 17-2: Process Design Criteria
| Criteria |
Unit |
Value
(current) |
Value
(Expansion) |
| Plant Design Capacity |
| Process Plant |
t/a |
16,425,000 |
18,250,000 |
| t/d |
45,000 |
50,000 |
| t/h |
2,038 |
2,240 |
| Operating Availability |
| Crushing |
% |
80 |
80 |
| Grinding, Flotation, and Tailings |
% |
92 |
93 |
| Concentrate Dewatering |
% |
84 |
84 |
| Feed Properties |
| Axb |
|
26 |
26 |
| BWi |
kWh/t |
24 |
24 |
| Density |
t/m3 |
2.75 |
2.75 |
| Comminution Circuit Parameters |
| SAG Feed F80 |
mm |
45 |
35 |
| SAG Transfer Size |
mm |
4.5 |
4.0 |
| Cyclone Overflow |
µm |
150 |
170 |
18 Infrastructure
The present CMM facility was constructed between 2010 and mid-2011 on the site of previous mining activity, and significant parts of the infrastructure were already in place, including a 138 kV power line to the old Ingerbelle concentrator, roads, water source, mine office building, and TMF. In 2010, new site facilities were constructed, including a 35 kt/d concentrator processing facility; a power-line extension; transformers and power distribution; a freshwater booster station and piping to the new concentrator; and a mine maintenance truck shop. In addition, a fleet of open pit mining equipment was purchased. In 2014, a secondary crushing circuit was added, followed by Ball Mill 3 in 2021; in 2022, two rougher expansion cells, a 6 m-diameter flotation column, and a second concentrate filter press were added. In 2022, to support the Low Carbon Electrification Project, Haul Truck Trolley Assist, a new 138/25 kV 63 MVA 20 MVAR STATCOM-equipped substation was constructed at the Ingerbelle SCO substation.
The CMM, with its concentrator and associated infrastructure, is approximately 21 km from Princeton. CMM can be accessed by an 18.4 km-long paved road and an existing site-access gravel road approximately 2.6 km long. The site is easily serviced and accessible due to a strong presence of key support vendors in the greater Vancouver, Okanagan-Kelowna, and Kamloops areas. With the CMM's proximity to the Town of Princeton, employees live in the town, precluding the need for accommodation camp services.
Electricity is supplied from the BC Hydro Nicola (NIC) Substation near Merritt. Power is transmitted to the two CMM substations-SCO at Ingerbelle and CUM at the CM concentrator-along a 100 km-long 138 kV 1L251 owned and maintained by BC Hydro. The BC Hydro line 1L251 also has a tap constructed that enables it to supply power to FortisBC at the Princeton substation (PRI). Currently there is one additional new BC Hydro customer also being supplied from BC Hydro's 1L251 line-Transmountain Pipeline, 32 km from the Nicola substation.
Concentrator process water is recycled from the TMF pond through a floating reclaim water barge and booster system. Additional fresh make-up water is pumped from the Similkameen River using a historical pumphouse established by prior operations. Additional water is added to the site water balance by collecting runoff from a series of surface contact water collection points around the site. The sum of all inflows and outflows results in a net negative site water balance. The existing site water infrastructure can deliver sufficient water to support a plant throughput increase from 45 kt/d to 50 kt/d of water supply.
Activating the New Ingerbelle Pit will require additional contact water management stations at the north and south WRFs, pit bottom, and east access roads. This water will be marshalled at the existing Ingerbelle water tank and sent to the plant freshwater booster station for plant consumption. The sum of the nominal flow rates of each of these systems operating at a 100% utilization will continue to maintain a negative site water-balance. Each pump station will have auxiliary pumps capable of handling the flow rate necessary for a 200-year, 24-hour precipitation event.
The 50 kt/d plant expansion will require minimal site infrastructure to achieve 5 kt/d of additional throughput. Most of the scope will be in situ upgrades of existing process equipment. A new secondary crusher closed-loop screen will require adding a new building housing the screen deck and associated electrics and conveyors.
Existing infrastructure installed to support the CMM operation includes:
- A complete 45 kt/d Cu-Au-Ag flotation plant and concentrate load-out facility.
- Active CMM open pits and WRFs.
- Historical Ingerbelle Pit and its north WRF.
- Cyclone sand dam TMF (approximately 267 ha), complete with seepage return-pumping systems installed at the toe of the east dam and west dam.
- Roads: access and haul
- Plant site
- TMF
- Explosives bulk storage depot and magazine
- Pumping station at the Similkameen River
- Truck shop (five bays), tire pad, wash pad, and warehouse facilities.
- Overland 3.3 km-long, 65 MVA, high-voltage power line from the historical Ingerbelle concentrator area (SCO substation) to the new concentrator area (CUM substation). The substations are equipped with power factor correction and respective transformers for step-downs to concentrator (13 kV, 4160 V, and 600 V) and pit (27.2 kV) operating voltages.
- Freshwater supply is composed of two 224 kW and two 335 kW pumps on the west side of the Similkameen River. Fresh water is pumped across the existing Similkameen River pipe bridge to a booster station equipped with three 522 kW pumps for transport to the freshwater storage tank.
- Process water is pumped from two 447 kW and two 597 kW vertical turbine pumps (mounted on a barge) to a booster station (consisting of five 597 kW booster pumps) that sends flow to the process water storage tank.
- Potable and wastewater treatment facilities servicing the full allotment of operating and administration staff.
- Site security and safety/training facility and sediment management installations.
- Fuel storage for 352 kL of diesel, 44 kL of gasoline, and 94 kL of propane; dispensing equipment; bulk storage areas for lubricants and reagents.
- Fully equipped metallurgical and assay determination laboratory.
- Administration facilities and car parking lot.
- Communication facilities (telephone, cellular, internet, and fibre-optic on site).
- Training, plant tool storage, security gatehouse, and first aid facilities.
- Mining infrastructure, including a 1 km trolley-assist hauling system from the CM pits.
- Explosives bulk storage depot and magazines.
- One 18-inch-diameter and two 20-inch-diameter pipelines span the Similkameen River on a cable-supported bridge.
- Several water pump-back systems are installed at a series of surface-water collection points throughout the TMF and pit operations area; these return water flow to the concentrator process-water balance and, ultimately, the TMF. The additional water is considered within the site water balance, acting as a source of additional water for operations.
18.1 Power Supply
BC Hydro transmits power to the CMM from the Nicola Substation (NIC) near Merritt, along a 138 kV transmission line-1L251-owned and operated by BC Hydro (Figure 18-1). The power is then tapped from 1L251 at the New Ingerbelle site to feed the two 138 kV substations, CUM at CM, and SCO at Ingerbelle. These two substations provide 100 MW of power to the concentrator, mine, and water-pumping infrastructure on the east and west sides of the Similkameen.
Figure 18-1: BC Hydro Transmission Map

Source: BC Hydro (2022).
A second tap off 1L251 then supplies 138 KV power to the new SCO substation (138/25 kV-63 MVA). This 25 kV power supplies all CMM mining loads, including rotary blasthole drills, electric mining shovels, haul-truck trolley assist, and pit dewatering. There is a well-established operating order between BC Hydro and CMM to provide for safe operation and coordination of the facilities. This operating order complies with the BC Hydro Power System Safety Protection Operating Order 1T-12, and the BC Hydro Safety Practice Regulations.
In 2022, a 138 kV to 25 kV, 63 MV transformer equipped with a 20 MVAR static compensator was installed at the SCO substation to support a new 25 kV transmission line internal to the site. This network supported additional site loads consumed by trolley assist and additional electrical equipment operating in the pit.
The current nominal power draw at the site is 87.1 MW. In 2023, regional transmission line upgrades were completed with BC Hydro to facilitate the supply of 100 MW to the site to support additional concentrator loads to achieve 50 kt/d production, future New Ingerbelle contact water pump stations, an additional PC8000, and a future PV351 electric rotary drill (Table 18-1).
Table 18-1: Site Power Demand Summary
| Description |
CUM Sub
(MW) |
SCO Sub
(MW) |
Total Site Power Demand
(MW) |
| Current Site Power Demand (Peak Load) |
75.6 |
11.5 |
87.1 |
| 50 kt/d Plant Upgrades |
2.3 |
|
2.3 |
| New Ingerbelle Water Management (Peak Storm Load) |
|
2.8 |
2.8 |
| PC 8000 (Shovel 5) |
2.2 |
|
2.2 |
| Drill 5 Replacement, New PV351 E |
1.0 |
|
1.0 |
| Total Against Existing Contact Demand, including 50 kt/d Loads |
81.2 |
14.3 |
95.5 |
| Current Supply Agreement Limits |
81.5 |
18.5 |
100 |
18.1.1 Copper Mountain Mine Power Reticulation
The existing pit reticulation supports the current phases of mining on the CM portion of the property. However, future phases will require relocation of this infrastructure as mining approaches the ultimate pit rim.
18.2 Water Supply and Management
The existing freshwater system was designed for 850 m3/h, with a peak flow of 1,200 m3/h. However, installing several environmental surface-water collection points has offset freshwater demand. The expansion from 45 kt/d to 50 kt/d will require an average freshwater draw of 1,006 m3/h; however, this will be further offset with surface-water collection points activated with the start of New Ingerbelle mining in 2027. The permitted freshwater draw rate from the Similkameen River allows for 1,515 m3/h of flow, with additional flexibility during periods with surplus or minimal precipitation. Figure 18-2 presents a simple schematic of the site water management.
A new reclaim barge is planned for 2024, which will be capable of delivering 4,417 m3/h as required by the site-water balance expansion to 50 kt/d. With additional surface-collection water routed to the TMF, these reclaim pumps will supply sufficient additional water to the process water tank to satisfy production.
Figure 18-2: Overall 25 kV Distribution System

Source: CMMC (2022)
18.2.1 Existing Water Management Systems
From 2019 to 2022, several contact water-collection pump stations were established and upgraded. These pump stations collect water at historically permitted discharge points and return them either directly to the TMF or to the concentrator for in-process consumption. These constructed and upgraded systems consist of:
- East seepage and WRF contact water collection, pond, and pumping infrastructure
- West dam toe seepage collection, pond, and pumping infrastructure
- Adit 6 discharge pumping infrastructure
- SW38/63 contact water collection and pumping infrastructure
- In-pit dewatering collection and pumping infrastructure.
A summary of the existing water management system is shown in Figure 18-3.
Figure 18-3: Site Water Management Schematic

Additional study work is under way for water capture at the toe of the existing east dam. The intent of this study is to determine the best achievable method for collecting additional sulphates present in dam toe and WRF contact water. Once designed, this system will integrate with the existing east seepage pump-station and be returned to the TMF pond to be reclaimed as process water.
18.3 Other Services
This subsection details the CMM maintenance, storage, distribution, administration, and warehouse services.
18.3.1 Process Plant Maintenance
A detached concentrator maintenance shop (50 ft x 100 ft) at the main building's northwest corner is outfitted with a 25-tonne overhead crane to service heavy equipment, with bay doors providing access both to the west laydown yard and directly to the concentrator building. This facility is used for all concentrator maintenance activities and major component rebuilds. Rebuilds requiring specialty tooling and labour are shipped via ground to the Vancouver, Kelowna, and Kamloops regions for service at specialized shops.
18.3.2 Fleet Maintenance
The existing five-bay truck maintenance shop adjacent to the CM Pit is used for maintaining the 28- truck haul fleet. An external service platform used as a sixth bay was established in 2022 for servicing pantographs on trolley-capable trucks. Mobile service trucks provide local maintenance to drills and shovels.
SMS-Komatsu in Kamloops provided specialty labour and rebuild services.
18.3.3 Fuel Storage and Distribution
Fuel is delivered to site via ground transport from port facilities in Seattle, Washington. Two on-site fuel islands provide storage and refuelling services with a total capacity of 420 kL. A mobile fuel truck is used for fueling the diesel PC4000 and PV271 drills. Additional separate fuel tanks are available on site for storing alternative fuels such as renewable diesel.
18.3.4 Administration Facilities
Site administration is in the existing building attached to the fleet maintenance shop. No additional administration facilities are anticipated for the expansion to 50 kt/d.
Access to the site is managed by a gatehouse equipped with a radio-frequency identification card sign-in system. The gatehouse also contains the site medical and first aid services, and the site-managed ambulance.
18.3.5 Warehousing
An existing warehouse attached to the fleet maintenance shop houses high-turn items. Several covered and open outdoor storage facilities house major components and consumables. Large capital spares are stored at the historical Ingerbelle fleet maintenance shop adjacent to the historical Ingerbelle concentrator building.
18.3.6 Waste Rock Facility
The existing permitted north and south WRFs on the east side of the CMM property will be used for storing of ROM waste from the existing CMM pits. In-pit waste dumps, and high-grade and low-grade stockpiles in the operations area will be used over the LOM for intermittent storage.
The north and south WRFs use a ditched and partially lined contact water collection system to route all contact water to the toe of the east dam where it is combined with dam seepage water for return pumping to the TMF pond.
An annual agreement with Arrow Environmental and Metro Vancouver facilitates progressive reclamation of the WRFs using a processed class A biosolids blend. A total of 25 ha are sloped and seeded with native grass species each year.
18.3.7 Tailings Management Facility
The existing TMF will be used to process tailings for the remaining LOM. This facility was historically operated by the previous property owners and was reactivated in 2011. The dam uses a simple cyclone sand process where five cyclone towers on both east and west dams hydraulically deposit sand for dam construction. On average, lifts are performed in 3 m to 6 m increments annually, with enough dam freeboard to support all design constraints, plus a full year of operation. The high quality of coarse cyclone sand negates the need for cell or compacted construction methods, requiring minimal equipment intervention.
A reclaim barge operating on the TMF pond reclaims water and provides process water to the concentrator. Sprinklers on the dam crests provide dust suppression during dry months and are supplied from existing seepage-return pump systems.
The current facility is permitted to 997 m elevation, which contains enough storage to support operations through 2028. To support the remaining LOM, a permit amendment currently in process will raise this facility to a dam crest height of 1,060 m, allowing for sufficient storage of the anticipated in situ mineral reserves.
18.4 New Ingerbelle Pit Activation
The mining fleet discussed in Section 16 will be used to mine the New Ingerbelle Pit. Several key additions will be required to support operations on the west side of the Similkameen River: a bridge across the river, the New Ingerbelle Pit power line and reticulation, pit dewatering pumps, and contact water management ponds, sumps, and pumps.
18.4.1 New Ingerbelle Maintenance Services
There are currently no plans for fixed maintenance services at New Ingerbelle on the west side of the Similkameen River. The mobile maintenance group will attend to the maintenance needs of the New Ingerbelle mining fleet. Shop maintenance will continue to be conducted at the existing CMM fleet maintenance shop on the east side of the Similkameen River.
18.4.2 New Ingerbelle Pit Access
The New Ingerbelle Pit is 14 km west of Princeton on Highway 3. A series of gated entry points allow for controlled access to the New Ingerbelle operations area from Highway 3 on the west side of the Similkameen. A new haul road will be constructed to connect the CM Main Pit on the east side of the river to the New Ingerbelle Pit, starting at the west side at 1,050 masl and descending through a series of switchbacks to the river bridge elevation at 784 masl. A 75 m-long, single-span, single-lane, steel-girder bridge with 100 mm concrete overlay will be constructed, with a more-than-771-tonne capacity (Komatsu PC8000-6 shovel and Komatsu 830e operating weight), allowing active hauling between the New Ingerbelle Pit and the CM primary crusher, providing access between the two sides of the Similkameen River. The bridge is designed so that it clears the river at high water by approximately 5 m, thus having minimal hydraulic or environmental impact on the site and surroundings.
COWI North America Ltd. (COWI) used the following data to design the 75 m-span bridge:
- Hydrological studies performed by Knight Piésold Consulting (2014, January 20)-Similkameen River 2012-2013 Hydrometric Monitoring Summary.
- Hatfield Consultants (2021, January 22)-2020 Similkameen River Hydrology Assessment.
- Hatfield Consultants (2021, March 9)-Similkameen River Instantaneous Peak Flood Frequency Analysis.
- BC River Engineers investigated the potential of riverbank slides, logs, and ice jams at and near the selected bridge site.
- The judgement of representatives from CMM and the Ledcor Group, who visited the site to help select the most suitable bridge location and alignment.
The final bridge general arrangement, abutments, and superstructure details are shown in Figure 18-4.
Figure 18-4: Proposed Equipment Bridge Crossing the Similkameen River

Source: COWI (2020).
The bridge is on a straight portion of the Similkameen River, away from any bends, which minimizes the potential for scour and provides for stable ground outside the wetted perimeter of the river on which to locate the abutments for a single-span bridge clear-spanning the river without any intermediate piers. This eliminates the need for any construction in the river, which results in minimal hydraulic and environmental impacts both during construction and while the bridge is in service. The span length of 75 m is selected to keep the construction as far away from the riverbanks as possible, while making the bridge's construction feasible with cranes on either shore.
The deck width of 17.2 m, with a running surface width of 16 m, is selected to allow single-lane traffic for haul trucks. The bridge's elevation is chosen to achieve a minimum vertical hydraulic clearance of 4 m above the estimated 200-year-flood elevation and 8 m above the nominal river elevation, as recorded on June 24, 2017. The bridge abutments comprise spread footings founded on rock or piled foundations, which would be constructed without any work in the river. The bridge will allow free passage for wildlife under the bridge. The bridge superstructure comprises approximately 3.2 m-tall steel-plate girders made of weathering steel, eliminating the need for future coating.
The deck concrete will have special properties for extended service life, while providing a high-quality riding surface for heavy vehicles using the bridge. Additionally, a 1 m-thick gravel layer will be placed on the bridge deck to protect the deck concrete and to improve traction for the vehicles. The concrete bridge deck is contiguous, with 3.75 m-high sidewalls for haul-truck safety, and to prevent any material on the deck from entering the river. The bridge deck is sloped at a 10% grade towards the west side to allow for drainage to be directed and contained in a sump.
18.4.3 New Ingerbelle Power Reticulation
Activating the New Ingerbelle Pit will require additional power reticulation to support electrified mining operations (Figure 18-5). The future power distribution system is based on the following key lines and voltage ratings.
- 25 kV pit perimeter line-2,825 m long.
- 7.2 kV pit feed lines-1,140 m long.
- 4.16 kV north water management line-1,040 m long.
- 4.16 kV east haul road water management line-230 m long.
- 4.16 kV Envirogreen-1,812 m long.
- 4.16 kV Arrow Enviro Services line (Fortis line extension)-2,406 m long.
- 4.16 kV south water-management line-589 m long.
- Feed to north dewatering and sumps-tap from New Ingerbelle Pit feed line connected to SCO substation, Segment #4 (1,509 m) (connecting to existing power line feeding north side of CMM).
- Feed to south WRF dewatering and sumps-tap from New Ingerbelle Pit feed line connected to SCO substation, Segment #5 (2,281 m) (Connecting to existing power line feeding power to the south side).
- Feed to north WRF dewatering and sumps-tap from SCO substation, Segment #6 (2,448 m) (connecting to existing power line).
- SCO substation upgrades include a new transformer (37.5/50/62.5 MVA), switchgear, and substation building.
The New Ingerbelle Pit perimeter line will be routed around the pit circumference via 44 wooden poles to a portable substation that will then distribute power as required by the pit operation via a pit feed-line approximately 1,140 m long.
The Arrow Enviro Services Line (FortisBC Extension) will be rerouted following utility standards. The line will also be extended to service the south water-management line.
Figure 18-5: New Ingerbelle Proposed Power Supply and Reticulation

18.4.4 New Ingerbelle Water-Management Installations
The future New Ingerbelle area of operations will feature the contact water collection points shown in Figure 18-3, including:
- New Ingerbelle north WRF pond, lower sump, and return pumping infrastructure.
- New Ingerbelle south WRF pond, lower sump, and return pumping infrastructure.
- New Ingerbelle in-pit dewatering complete with booster station.
- East haul road collection basin and return pumping infrastructure.
All Ingerbelle collection points will be marshalled at the existing Ingerbelle water tank. This tank discharges by gravity using the existing pipeline bridge across the Similkameen to the existing freshwater booster station. This will route flow to the concentrator freshwater tank for in-process consumption.
The sum of all contact water, fresh water, and reclaim water collects within the concentrator and TMF water balance. At nominal flow rates, the site water-balance will remain negative, with make-up water continuing to be sourced from the existing Similkameen River pump station. A graphical summary of the site-water balance, including the introduction of New Ingerbelle Pit operations, is shown in Figure 18-3.
18.4.5 New Ingerbelle Waste Rock Facility
Historical Ingerbelle operations used a WRF on the northwest corner of the property adjacent to the historical Ingerbelle concentrator. This dump will be reactivated and used for waste storage during New Ingerbelle mining, especially for the first year or two. A new south WRF will be established for additional New Ingerbelle waste storage.
Contact water collection and pumping stations will be established at each WRF as described in Section 18.4.4.
19 Market Studies and Contracts
19.1 Copper Concentrate
Global copper concentrate fundamentals are expected to be strong in the medium and longer terms (Figure 19-1). Smelters globally will seek to maximize metal production in an attempt to satisfy unprecedented demand driven by the green energy megatrend. However, smelters' ability to do so will be constrained by a shortage of mine production. Buyers are expected to compete aggressively for concentrate supply, exerting downward pressure on treatment charges, relative to current market conditions.
Figure 19-1: Global Copper Production and Primary Demand

CMM concentrate quality is well established. It is a clean concentrate, attracting no penalties, and includes important by-product precious-metal credits.
19.2 Related Contracts
Concentrate production is sold exclusively to Mitsubishi Materials Corporation, a major Japanese smelting entity. CMM incurs treatment and refining charges consistent with the global industry benchmark established by major miners and smelters.
19.3 Logistics
Logistics for delivering the CMM concentrate to its single MMC customer are well established. The concentrate is trucked to the Port of Vancouver, where it is warehoused prior to shipment to Japan. Multi-year logistics' agreements are in place with several prominent service providers.
20 Environmental Studies, Permitting, and Social or Community Impact
20.1 Permitting
This section details the existing major permits for the mine CMM, and the federal and provincial legislation and associated permits, licenses, and approvals that apply or potentially apply to CMM construction and operations, as currently proposed as part of the CMM LOM plan.
20.1.1 Existing Major Permits
Mining and processing at CMM are authorized and regulated by three major permits-B.C. Mines Act (MA) Permit M-29, B.C. Environmental Management Act (EMA) Effluent Permit 00261, and EMA Air Emissions Permit 105340 (Table 20-1). Additionally, discharges from the mine site are governed by the federal Metal and Diamond Mining Effluent Regulations (MDMER) under the federal Fisheries Act. All permits have specific monitoring requirements and general or specific discharge limits and characteristics.
Table 20-1: Major Permits at Copper Mountain Mine
| Permit |
Issued By |
Original
Date of Issue |
Last Permit
Amendment |
| Mine Permit M-29, under B.C. Mines Act |
B.C. Ministry of Energy, Mines and Low Carbon Innovation |
August 3, 1970 |
March 3, 2021 |
| Effluent Permit 00261, under Environmental Management Act |
B.C. Ministry of Environment and Climate Change Strategy |
February 3, 1969 |
March 17, 2022 |
| Air Emissions Permit 105340, under Environmental Management Act |
B.C. Ministry of Environment and Climate Change Strategy |
October 3, 2011 |
January 18, 2016 |
The major permits (Table 20-1) will require amendments based on the CMM LOM plan. No federal authorizations are required for the CMM LOM plan. The New Ingerbelle Project, which is part of this CMM LOM plan, is advancing through a joint coordination authorization process to amend the MA and EMA permits, through the B.C. Ministry of Energy, Mines and Low Carbon Innovation's Major Mines Office (MMO) permit amendment process.
Figure 20-1: Copper Mountain Permitted Mine Area

20.1.1.1 Mines Act Permit M-29
The original MA Permit M-29 was issued on August 3, 1970. For the current mining phase, an amended MA Permit M-29 was issued on April 1, 2010, which authorizes the mine and reclamation plans, tailings, WRFs, site roads, and water management. The permit has been amended several times to reflect various updates to the mine plan and design changes.
The entire Hudbay property holding, including both Ingerbelle and Copper Mountain, covers an area of approximately 7,157 ha; however, the permitted mine area, shown in Figure 20-1 comprises 2,368 ha under MA Permit M-29. In 2022, the area disturbed by mining activity totalled approximately 1,590 ha.
Prior to issuing the 2010 permit amendment, the B.C. Environmental Assessment Office (EAO) issued a determination (July 2007) that the mine restart plan did not trigger an Environmental Assessment (EA) under the B.C. Environmental Assessment Act (EAA). The EAO is in the process of determining the reviewability of the New Ingerbelle Project under Section 11 of the B.C. EAA.
Three MA Permit M-29 amendments are in progress, including authorizing the New Ingerbelle Project, authorizing a new landfill on the Copper Mountain side of the mine property (joint MA and EMA Refuse Permit application), and authorizing the historic Copper Mountain and Ingerbelle landfill locations under Permit M-29. In addition, MA Permit M-29 is being amended through the 5-Year Mine Plan and Reclamation Program review process (conducted in 2021).
20.1.1.2 Effluent Permit 00261
Effluent Permit 00261, issued by B.C. Ministry of Environment and Climate Change Strategy (ENV) under the EMA, authorizes the discharge of tailings and treated sewage effluent to the TMF, and regulates potential mine-site drainage impacts on the receiving environment. Permit 00261 specifies environmental monitoring requirements for the mine site and receiving environment, including surface water, groundwater, and biological-effects monitoring studies. An EMA Permit 00261 amendment application is in progress to authorize discharge of mine-site drainages to the Similkameen River.
20.1.1.3 Air Emissions Permit 105340
Air Emissions Permit 105340, issued by ENV under the EMA, authorizes and regulates the point-source air emissions from dust collectors and fume hoods, as well as general fugitive dust generated from the mine site. Hudbay monitors the release, spread, and composition of mine-generated particulate matter through dustfall monitoring stations. These data are used to develop dust-monitoring and -mitigation plans. Dust suppression and management measures are used to minimize dust release to protect workers and the environment. Two EMA Permit 105340 amendment applications are in progress: authorizing discharge from a baghouse for the planned new Met Laboratory dust-collection system, and authorizing an increase in the discharge period for the lime silo dust-collection baghouse.
20.1.2 Other Potential Permits
Additional provincial permits will be required for the CMM LOM plan. These will include License of Occupation, Occupant License to Cut, Water Licenses, Heritage Inspection Permits.
20.2 Environmental Studies and Monitoring Programs
20.2.1 Meteorology
CMM is in south-central British Columbia on either side of the Similkameen River valley, at latitude 49°20' north and longitude 120°31' west, approximately 20 km south of the Town of Princeton. Elevations range from 770 m at the Similkameen River to approximately 1,300 m on the Copper Mountain side and 1,150 m on the Ingerbelle side. Environment and Climate Change Canada's Princeton A weather station (Station ID: 1126510) has a 70-year-long data record, which is used as a proxy for the mine site due to the duration and continuity of the data set. The Princeton A station is approximately 15 km north of the mine, at 701.7 masl. CMM climate parameters are estimated by applying a correction factor of 1.3 to data from the Princeton A station to account for orographic effects. CMM also operates its own weather station, which is on the east bank of Similkameen River valley, northwest of the current pit development, at an elevation of 1,150 m. The station was recently relocated here from its previous location northeast of the concentrator building, and records temperature, wind speed, wind direction, rainfall, relative humidity, and various instrument diagnostics at regular intervals.
20.2.2 Air Quality and Greenhouse Gas Emissions
A dustfall-monitoring program is conducted at CMM in accordance with requirements under EMA Permit 105340; it assesses the potential impacts of fugitive dust from mining activities on the plants, soils, and ambient air quality in neighboring receiving environments. Currently, the program authorized under the permit consists of 15 monitoring locations, including 8 receiving environment stations, 6 source-monitoring stations, and one background-monitoring station. In addition to permit-required monitoring locations, nine dustfall-monitoring stations were set up around the New Ingerbelle site to collect baseline dustfall information prior to the start of operations. Dustfall monitoring continues to show that measures developed and implemented as part of the Fugitive Dust Management Plan to minimize dust generation from the mine site have been effective at maintaining dustfall levels in the receiving environment well below the EMA Permit 105340-specified Ambient Air Quality Objective.
Industrial greenhouse gas (GHG) emissions attributed to the CMM facility are monitored and reported under the following reporting programs:
● B.C. Greenhouse Gas Industrial Reporting and Control Act and B.C. Greenhouse Gas Emissions Reporting Regulation
● ECCC Greenhouse Gas Reporting Program, which falls under the Canadian Environmental Protection Act.
The CMM facility has three main GHG-emission source types: general stationary combustion, fuel combustion by mobile equipment, and electricity generation. CMM is aiming to reduce carbon emissions by increasing energy efficiency, focusing on equipment electrification, maximizing grid electrical power supply, and using renewable fuel alternatives.
20.2.3 Hydrology, Hydrogeology, and Water Quality
Since 2008, SRK Consulting (SRK) has been retained to maintain a hydrological and water quality model for Wolfe Creek and Similkameen River within the immediate vicinity and downstream of the mine. Regular updates of the water quality model have been completed, providing predictions for receiving-environment quality associated with proposed changes to the CMM LOM plan and changes in water-management systems operation. Model scenarios are simulated for all constituents of interest (COI), especially for key COIs, including sulphate, nitrate, copper, molybdenum, and selenium. Model predictions are completed for current operations, closure, and post-closure scenarios for CMM's LOM plan, which has informed the water-management mitigation measures.
Water quality samples under EMA Permit 00261 have been collected at select monitoring locations around the property since 1967. The current EMA Permit 00261 requires routine analysis of surface water at 28 mine infrastructure and receiving-environment monitoring stations to assess water quality, and 15 groundwater monitoring wells for water-level measurements and groundwater quality. Water quality data from all monitoring stations in the Similkameen River and Wolfe Creek, which represent the receiving-environment watercourses on the west and east side of the mine property, respectively, have been compared to British Columbia Water Quality Guidelines for the protection of freshwater aquatic life (BC FWAL) or EMA Permit 00261 specific concentration limits, as applicable.
Hudbay maintains a Water Management Plan (WMP), which establishes a framework for efficient use of water resources, and ensures watercourse and water quality protection during operation, closure, and post-closure activities. The WMP synthesizes information from hydrology, hydrogeology, geochemical characterization, water quality monitoring, site-wide water quality modelling, site-wide water balance, and the mine plan to inform the effective operations, maintenance, surveillance, and monitoring of water-management infrastructure. The water-management practices and procedures included in the WMP will be updated with the CMM LOM plan and continue to aim to minimize adverse effects on water resources.
20.2.4 Waste Rock Geochemistry
Segregation of waste rock and low-grade mineralization materials according to their acid-rock drainage (ARD) potential is not currently required for the Copper Mountain pits unless monitoring results trigger the MA Permit M-29-specified threshold. SRK has developed a metal leaching (ML)/ARD Prediction and Prevention Plan as well as a management and mitigation plan for the current operations and the CMM LOM plan pit development, including the New Ingerbelle Project. Water quality downstream of existing WRFs has been monitored for decades, resulting in a robust data set at long-term monitoring stations, and ARD has not been detected at either the former Ingerbelle or current Copper Mountain side.
20.2.5 Fish and Aquatics
The fish and aquatics assessment builds on years of continuous monitoring, and provides an overview of fish, fish habitat, sediment, benthic invertebrate, and periphyton sampling information at locations throughout the Similkameen River and Wolfe Creek watersheds. Aquatic environment monitoring studies are designed to meet both annual provincial biological monitoring requirements under EMA Permit 00261 and federal Environmental Effects Monitoring requirements under the MDMER.
Both the Similkameen River and Wolfe Creek support healthy fish populations that are part of the local sport and First Nations fisheries. These include several salmonids, cyprinids, suckers, and sculpins. Fish and fish habitat studies since 2007 have demonstrated that mining activities at CMM have not had significant negative impacts on fish and aquatic habitats of the receiving environment. Water leaving the mine property into the Similkameen River and Wolfe Creek has parameter concentrations generally reporting lower than the BC FWAL.
20.2.6 Wildlife and Vegetation
The baseline conditions prior to CMM development have been determined by existing ecosystem mapping along with forestry site-productivity and site range-utility information from similar nearby sites. Terrestrial baseline studies and ecosystem mapping have been completed for the New Ingerbelle Project and surrounding landscape. The objectives of the ecosystem mapping and vegetation studies is to create an inventory for current and pre-development productivity, and capability objectives to support post-mine end land-use planning.
CMM and surrounding areas currently provide valuable habitat for ungulates in winter, particularly mule deer, providing a mix of woody browse and grasses, and high-percent crown closure that provides important snow interception, security, and thermal habitat. Moose habitat is moderate and concentrated around a few wetland areas. Results of the wildlife surveys indicate that moist ecosystems provide higher-value habitat for moose and elk, as well as predators like bear and cougar. Additionally, there is an abundance of late successional, mature forests that are important for raptors for nesting and woodpeckers for foraging.
The CMM Biodiversity Conservation Management Plan (BCMP) describes the approach to biodiversity conservation management and considers biodiversity conservation management for vegetation, wildlife, water, and aquatic resources. The BCMP will be updated to reflect the CMM LOM plan.
20.2.7 Archaeology
Archaeology overview assessments of the potential effects of CMM on archaeological and heritage resources were completed in 2008, 2009, and 2010, in advance of mine development, and resulted in identifying several small areas of archaeological interest. A more detailed archaeological impact assessment of the areas was completed by the Upper Similkameen Indian Band (USIB) and Lower Similkameen Indian Band (LSIB) in 2018, which included developing options for managing or relocating soils containing archaeological artifacts that are within the CMM LOM plan.
An Archaeological Overview Assessment (AOA) was completed in 2019 for the proposed new disturbances related to the New Ingerbelle Project. The preliminary AOA model identified 123 areas of potential (AOP) across 83.63 ha. The AOA was partially ground-truthed during Preliminary Field Reconnaissance. A detailed archaeological impact assessment (AIA) in collaboration with USIB and LSIB was completed in 2022 and 2023 for select areas within the proposed CMM LOM plan. Further AIAs would be completed prior to any new land disturbances and construction related to the CMM LOM plan.
20.2.8 Environmental Disclosure
Much of the mine and surrounding areas have been subject to extensive prior impacts related to forestry and agricultural activities. However, no environmental disclosures have been identified.
20.3 Social and Community
CMM is within the Traditional Territory of the Smilq'mixw People, as represented by the USIB, in Hedley, and the LSIB, in Cawston (Figure 20-2). The nearest population centre to CMM is Princeton, B.C. The First Nations Reserves closest to CMM are Vermilion Forks 1 (3.2 ha) near Princeton at the junction of the Similkameen River and Tulameen River, and Wolfe Creek 3 (202.5 ha) near the confluence of Wolfe Creek and the Similkameen River, both belonging to the USIB, and approximately 14 km and 20 km, respectively, from CMM.
On January 1, 2016, B.C. approved incorporating the CMM site within the Town of Princeton's municipal boundaries (comprising approximately 5,274.4 ha). To reflect the incorporation of the CMM site within the Town of Princeton, the CMM site was removed from all Official Community Plans and zoning bylaw schedules, but remains designated and zoned as a resource area. The CMM is within the Regional District of Okanagan Similkameen (RDOS).
Figure 20-2: Community Boundaries and Setting in Relation to Copper Mountain Mine

20.3.1 Employment and Economy
Hudbay is the predominant employer in the area surrounding the mine site. The operation at CMM employs approximately 500 people, with an annual payroll of approximately $60 million. Approximately 70% of the employees live in Princeton, with an additional 20% living in nearby Similkameen valley communities. Over 15% of the mine workforce is made up of persons of First Nations descent. Princeton has a population of approximately 3,000, and a diversified economy driven by mining, ranching, forestry, and tourism. The USIB, in Hedley, has a total registered population of 263, with a workforce primarily in agriculture and manufacturing (Government of Canada, 2021a). The LSIB, in Cawston, has a total registered population of 598, with a workforce primarily in agriculture, manufacturing, and other services (Government of Canada, 2021b).
20.3.2 Land Use
Current land uses in the vicinity of and adjacent to the CMM property include mineral exploration, industrial facilities, forestry, ranching, placer mining, outdoor recreation, and Indigenous use.
20.3.2.1 Industrial Facilities
Envirogreen operates a facility near the Ingerbelle Pit area that thermally remediates hydrocarbon-contaminated soils. Their facility and their materials are stored on District Lot 401 (Lela Crown-granted mineral claim) which Envirogreen owns. Envirogreen's holdings on the Ingerbelle side comprise mineral tenures in the form of mineral claims, Crown grants, and mineral leases totalling approximately 137.2 ha (Figure 20-3). Hudbay has a right to have the Lela claim and certain other mineral claims that it optioned to Envirogreen reconveyed to it in exchange for replacement properties. Hudbay and Envirogreen are in discussions to reach an agreement on this matter.
Arrow Environmental operates a green compost facility at the south end of the reclaimed historical 701 WRF on the Ingerbelle side of the property (Figure 20-3). The facility processes organic matter, including residential and commercial food waste, garden and yard waste, and municipal biosolids. Arrow Environmental partners with NutriGrow for transportation services, wood processing, and reclamation services. Hudbay has partnered with Arrow Environmental and NutriGrow to provide soil mixes for site reclamation efforts. Hudbay and Arrow Environmental are in discussions directed at working together to ensure the Arrow Environmental operation can continue while Hudbay completes the planned New Ingerbelle development.
20.3.2.2 Forestry
CMM is within the Merritt Timber Supply Area (TSA), which covers about 1.13 Mha in British Columbia's southwest interior. Merritt and Princeton are the largest communities in the TSA. The TSA's Allowable Annual Cut is 1.2 Mm3.
20.3.2.3 Ranching
Hubday maintains regular communication and has open discussions with local ranchers on topics such as requests for extra monitoring; coordinating access for range cattle along Copper Mountain Road; reminding mine employees of open range cattle on the mine road; and other topics.
Figure 20-3: Ingerbelle Land Tenure

20.3.2.4 Outdoor Recreation
A variety of recreation and tourism activities are enjoyed in the region, including hiking, camping, fishing, hunting, wildlife viewing, boating, mountain biking, snowmobiling, and ski touring.
Areas with concentrated recreation land use include Manning Provincial Park, Cascade Recreation Area, Skagit Valley Provincial Park, Whipsaw Creek Ecological Area, Bromley Provincial Park, Cathedral Provincial Park, Snowy Protected Area, Coquihalla Summit Recreation Area, and Brent Mountain Protected Area. The proximity of these areas to the CMM property ranges from approximately 6 km to 47 km.
The nearest recreational residents are at Kennedy Lake, approximately 1 km west of Highway 3. The Kennedy Lake property has a number of leased lots on which are a variety of recreational cabins and vehicles. In recent years there have reportedly been approximately five year-round residents. Hudbay is in continual contact with the Kennedy Lake residents.
20.3.2.5 Indigenous Use
It is known and understood that Indigenous populations have been using the Similkameen area since at least the early Holocene Epoch. A Use and Occupancy Mapping Study (UOMS) for the CMM and surrounding area was finalized in 2019. The intent of the UOMS was to describe past, present, and potential Indigenous use and occupancy, and traditional ecological knowledge with a focus on the mine claim area, as well as the adjacent areas of the Similkameen River and Wolfe Creek watersheds (collectively the UOMS study area).
From the UOMS interviews, 357 values associated with traditional-use sites were mapped within the UOMS study area, which included the entire Hudbay claim area. These values can be grouped into five broad categories of: cultural/spiritual values, environmental features, habitation values, subsistence values, and transportation values. Hudbay considers these identified values in CMM environmental baseline assessment, mine design, and mine planning.
20.3.3 Engagement
Hudbay has strong support from local communities, including the Town of Princeton, Village of Keremeos, the RDOS, local business, and ranchers. Transparent engagement and strong cooperative working relationships with all local communities are priorities for Hudbay.
20.3.3.1 Community Engagement Process and Activities
Hudbay has a Local Community Business and Employment Engagement Policy that outlines its commitment to hiring people and procuring goods and services from neighbouring communities to the extent practical. Local communities, First Nations, Town of Princeton, Town of Keremeos, and the RDOS participate in all major permit authorizations and permit amendment reviews.
Hudbay is open to receiving requests for information from the public, communities of interest, or from other businesses operating in the area and responds to any requests received. Hudbay also regularly communicates with local ranchers and the other facilities operating within the mine boundary.
Annually, in May, CMM organizes Princeton Mining Day, a public event with vendor information booths set up in town to educate the public about the mine and to provide a forum to share information. In addition, CMM hosts public tours of the mine with specific information sessions on the mine, mill, maintenance, tailings management, and environmental protection. Hudbay also organizes technical information, open houses, and engagement sessions within the community to share information about the mine and the operations.
20.3.3.2 First Nations Community Engagement Process and Activities
Hudbay respects USIB and LSIB's commitment to the principles of economic sustainability, environmental stewardship, and self-determination regarding Smilq'mixw Territory. Hudbay maintains a cooperative and respectful relationship with USIB and LSIB that is in keeping with these principles. To do so, Hudbay, USIB, and LSIB work together within the framework of a Participation Agreement (PA) signed with each Band. In October 2022, USIB and LSIB requested an amendment to the existing PA, which Hudbay is actively pursuing.
Hudbay is committed to a partnership with First Nations and the communities in which CMM operates. To support this successful partnership, in August 2022 the mine general manager role was split into two designated roles: an operation mine general manager focused on the daily operations of the mine, and a designated First Nations, Community, and Government Relations general manager focused on providing leadership on engagement with key stakeholders.
Hudbay, USIB, and LSIB meet on a regular basis (typically once per quarter) through a Joint Implementation Committee (JIC) to review Hudbay's mine development and environmental management plans (EMP), and environmental monitoring reports, as well as to discuss human resources and business opportunities.
Hudbay has actively engaged USIB and LSIB on the proposed New Ingerbelle development plan. To facilitate the amendment application review process, Hudbay, USIB, and LSIB have proactively developed and initiated a First Nations Early Engagement Plan, which calls for USIB and LSIB prior input and involvement in environmental baseline studies; input of Indigenous Knowledge into design considerations; and review of basic engineering concepts prior to application submission.
Since 2021, regular Technical Information Sessions have been hold at the request of USIB, to provide a targeted forum to discuss technical information in further detail with the USIB and LSIB and their technical consultants. Hudbay, the USIB, and the LSIB have collaboratively initiated a Joint Technical Committee (JTC), which reports to the JIC, where qualified professionals and persons from Hudbay and the Bands review technical details of interest to both parties.
In addition to the regularly scheduled meetings, Hudbay maintains regular communication with the USIB and LSIB through telephone, email, and text messages relating to matters of mutual interest. Hudbay also engages with USIB and LSIB in a variety of other ways, including sponsorships, scholarships, and support for attendance at mine-related conferences. Hudbay actively promotes Cultural Awareness Training with the management level team to support successful and meaningful ongoing engagement.
20.4 Conceptual Mine Closure and Reclamation
In 2019, CMML started developing an end land-use plan (ELUP) for CMM, in collaboration with USIB and LSIB. The conceptual ELUP serves to provide a blueprint to guide reclamation planning, progressive reclamation efforts, and on-site research throughout operations and following closure, and as a tool fostering input from USIB and LSIB in developing a detailed ELUP. The ELUP process is intended to develop an understanding of the site characteristics at both pre-disturbance and post-closure, the objectives for post-closure land use, and the challenges to and solutions for achieving those objectives (Associated Environmental Consultants, 2021a). The ELUP objectives are to re-establish average pre-mining capability to support suitable habitat for specific wildlife species and create opportunities for USIB and LSIB traditional use of the land.
A detailed ELUP is under development, which will include ecohydrological mapping to provide more detail of the post-mine conditions. To achieve successful reclamation, progressive reclamation strategies have begun with a target to begin reclamation on approximately 20 ha to 25 ha areas each year from 2019 to 2026, which is informed by the ELUP and results of reclamation trials that began in 2018. Reclamation research trials include re-sloping, applying growth media, and initial reseeding of WRFs with native plants. Information obtained from the trials, in addition to previous reclamation activities already undertaken at Ingerbelle, will be used to inform reclamation activities to meet or exceed the reclamation objectives under the MA Permit M-29. As required under MA Permit M-29, Hudbay will develop and submit a detailed Closure Plan to B.C. Ministry of Energy, Mines and Low Carbon Innovation (EMLI) for approval at least twelve months prior to final mine closure.
21 Capital and Operating Costs
All amounts are reported in Canadian dollars ($) unless otherwise specified.
21.1 Capital Costs
Project capital costs are estimated to be $167 million including mine development and mill expansion and stabilization projects (Table 21-1). The LOM sustaining capital totals $731 million excluding capitalized stripping estimated to be $742 million plus an additional discretionary capitalised stripping project of $114 million (Table 21-2).
21.1.1 Project Capital
The initial mining fleet was purchased from 2009 through 2011, with multiple additions and replacements since. Mining at the New Ingerbelle satellite pit will require infrastructure additions for heavy-equipment access and water management.
The total LOM capital cost is shown in Table 21-1.
Table 21-1: LOM Capital Projects Expenditures ($ 000s)
| |
2024 |
2025 |
2026 |
2027 |
2028 |
2024-2028
Avg. |
2029-2033
Avg. |
2034-2038
Avg. |
2039-2043
Avg. |
LOM |
| Plant |
150 |
15,791 |
14,659 |
- |
- |
6,120 |
- |
- |
- |
30,600 |
| Mine |
3,453 |
38,736 |
77,638 |
7,673 |
9,103 |
27,321 |
- |
- |
- |
136,603 |
| Total Project Capital |
3,603 |
54,527 |
92,297 |
7,673 |
9,103 |
33,441 |
- |
- |
- |
167,203 |
| Total Project Capital (US$000s) |
2,669 |
40,997 |
69,397 |
5,769 |
6,844 |
25,135 |
- |
- |
- |
125,676 |
The existing concentrator, with an installed capacity of 45 kt/d, and its required support infrastructure are in place. In 2010 the facility was constructed with an initial capacity of 35 kt/d; since that time a secondary crusher, a third ball mill, an additional column cleaner flotation cell, and an additional concentrate plate and frame filter have been added. The available milling capacity of 45 kt/d has not yet been fully achieved in a sustainable manner, and it is believed that some limited capital expenditures will be required to stabilize milling throughput and recovery at their design capacity through 2024 and 2025. Once stabilized, milling throughput will be debottlenecked and gradually increased to 50 kt/d, without negative impact on recovery, as detailed in Section 17.
The LOM plan will also require expanding the TMF within the existing land package to elevation 1,060 m.
Respected suppliers provided direct equipment budgetary pricing quotes to generate mechanical equipment lists, while quantities were determined and benchmarked with other installations where possible. Budgetary quotes for supply and installation provided architectural building costs, escalated in 2023 dollars. Bulk quantities were estimated based on estimates of installed-equipment cost percentages. Labour rates were updated from the Craft Manual Labour Rates-British Columbia (Base Wage and Benefit Building Trade Unions). Labour classifications were used for the composite crew rates for each discipline. Costs include living-out allowances.
The cost estimate covers direct and indirect costs encompassing all of the traditional items that are standard to any project: direct costs are those pertaining to permanent equipment and materials and labour associated with constructing the permanent facilities (i.e., those which are easily traceable).
Contractor's indirect costs are contained within each discipline's all-in costs, which includes contractor's distributable costs. Other indirect costs include all those associated with implementing the plant, and those incurred by the Owner, engineer, or consultants in the design, procurement, construction, and commissioning of the permanent facilities.
The contracting strategy is assumed to be based on an engineering, procurement, and construction management style of delivery, using a contracted company to provide engineering and procurement documentation and construction-management services; Hudbay will provide equipment procurement. The construction subcontractors are directly contracted to the Owner, with the contracts managed by the ECM contractor on the Owner's behalf. The Owner will manage minor and operational contracts.
21.1.2 Sustaining Capital and Capitalized Stripping
The LOM sustaining capital and capitalized stripping costs are summarized in Table 21-2. The total includes capital required for major mining equipment acquisition, rebuilds, and major repair work. The cost also includes site infrastructure expansion, process-plant infrastructure; however, the capital costs exclude all costs related to mine closure.
Waste-stripping operating costs that provide future economic benefits are capitalized when strip ratios in a given year are above the average strip ratio for a total pit phase (capitalized stripping). Operating costs that are expected to be capitalized as stripping are summarized in Table 21-2.
The current mining fleet will need to be supplemented during 2024-2025 to catch up on waste stripping that has been postponed during the past three operating years. The waste-stripping project consists of mining approximately 40 Mt of waste, which will be capitalized and operated with a separate fleet using contractor's equipment and personnel.
Table 21-2: LOM Sustaining Capital and Capitalized Stripping Expenditures ($ 000s)
| |
2024 |
2025 |
2026 |
2027 |
2028 |
2024-2028
Avg. |
2029-2033
Avg. |
2034-2038
Avg. |
2039-2043
Avg. |
LOM |
| CMM and New Ingerbelle |
|
|
|
|
|
|
|
|
|
|
| Mine Equipment-New Trucks and Equipment |
- |
11,517 |
13,664 |
15,290 |
12,870 |
10,668 |
4,473 |
- |
- |
75,704 |
| Mine Equipment-Major Repair |
17,352 |
18,651 |
19,584 |
19,895 |
19,459 |
18,988 |
19,202 |
18,574 |
7,303 |
321,691 |
Mine Equipment-Equipment Leases
(Current Commitments) |
21,755 |
19,768 |
16,818 |
10,132 |
3,622 |
14,419 |
412 |
210 |
210 |
76,465 |
| Mine-Other |
3,375 |
3,325 |
3,325 |
3,325 |
3,325 |
3,335 |
3,325 |
3,325 |
2,261 |
61,363 |
| Plant |
12,704 |
7,680 |
4,380 |
4,563 |
4,575 |
6,780 |
4,565 |
4,565 |
4,565 |
104,271 |
| Plant-Stabilization |
698 |
14,947 |
5,167 |
- |
- |
4,162 |
- |
- |
- |
20,812 |
| TMF |
2,925 |
4,063 |
2,901 |
4,365 |
4,330 |
3,717 |
3,421 |
2,473 |
2,586 |
60,980 |
| Other |
3,139 |
4,400 |
- |
2,000 |
- |
1,908 |
- |
- |
- |
9,539 |
| Total (Before Capitalized Stripping) |
61,947 |
84,350 |
65,838 |
59,569 |
48,180 |
63,977 |
35,398 |
29,147 |
16,925 |
730,826 |
| Total (Before Capitalized Stripping) (US$ 000s) |
45,887 |
63,421 |
49,503 |
44,789 |
36,226 |
47,965 |
26,615 |
21,915 |
12,726 |
548,803 |
| Capitalized Stripping |
22,659 |
78,287 |
54,936 |
18,607 |
76,394 |
50,176 |
54,020 |
44,192 |
- |
741,940 |
| Discretionary Capitalized Stripping |
30,000 |
56,000 |
28,000 |
- |
- |
22,800 |
- |
- |
- |
114,000 |
| Total (After Capitalized Stripping) |
114,606 |
218,637 |
148,774 |
78,177 |
124,574 |
136,953 |
89,418 |
73,339 |
16,925 |
1,586,766 |
| Total (After Capitalized Stripping) (US$ 000s) |
84,893 |
164,389 |
111,860 |
58,779 |
93,665 |
102,717 |
67,231 |
55,142 |
12,726 |
1,191,780 |
Notes: 1 Discretionary capitalized stripping relates to a portion of accelerated stripping activities over 2024-2026 to access higher grade ore but could be reduced or deferred to a later date based on further geotechnical evaluation and other considerations.
21.2 Operating Costs
The operating costs for CMM are developed annually as part of the site budget process and based on past performance and planned operational improvements. The operating costs are divided into three categories: mining (including the capitalised portion of the stripping), milling, and G&A. The LOM operating costs are given in Table 21-3.
Table 21-3: On-Site Operating Costs ($/t Milled)
| |
2024 |
2025 |
2026 |
2027 |
2028 |
2024-2028
Avg. |
2029-2033
Avg. |
2034-2038
Avg. |
2039-2043
Avg. |
LOM |
| Unit Costs |
|
|
|
|
|
|
|
|
|
|
| Mining |
15.30 |
16.33 |
13.84 |
12.06 |
11.92 |
13.78 |
11.73 |
11.32 |
4.82 |
10.21 |
| Milling |
7.41 |
6.77 |
5.94 |
5.70 |
5.69 |
6.25 |
5.70 |
5.70 |
5.70 |
5.85 |
| G&A |
1.48 |
1.35 |
1.27 |
1.22 |
1.18 |
1.29 |
1.17 |
1.14 |
0.87 |
1.13 |
Total Operating Costs
(Before Capitalized Stripping) |
24.19 |
24.45 |
21.05 |
18.98 |
18.79 |
21.32 |
18.60 |
18.16 |
11.39 |
17.19 |
Total Operating Costs
(After Capitalized Stripping) |
20.68 |
16.27 |
16.31 |
17.96 |
14.61 |
17.06 |
15.64 |
15.73 |
11.39 |
14.86 |
The mining operating costs are estimated for each activity (i.e., drilling, blasting, loading, haulage, auxiliary, and indirect costs), with haulage having the highest impact on total mining operation cost. For each activity, the volume of consumables and labour requirements are calculated from the details of the LOM plan. A breakdown of mining operating costs by activity and component are given in Table 21-4 and Table 21-5.
Table 21-4: Operating Costs-Mining/Activity ($/t Moved)
| |
2024 |
2025 |
2026 |
2027 |
2028 |
2024-2028
Avg. |
2029-2033
Avg. |
2034-2038
Avg. |
2039-2043
Avg. |
LOM |
| Mining |
|
|
|
|
|
|
|
|
|
|
| Drilling |
0.17 |
0.15 |
0.17 |
0.21 |
0.22 |
0.18 |
0.22 |
0.22 |
0.18 |
0.20 |
| Blasting |
0.17 |
0.18 |
0.18 |
0.20 |
0.20 |
0.19 |
0.19 |
0.20 |
0.10 |
0.18 |
| Loading |
0.23 |
0.21 |
0.23 |
0.28 |
0.34 |
0.25 |
0.31 |
0.27 |
0.42 |
0.29 |
| Haulage |
0.95 |
0.97 |
1.12 |
1.46 |
1.79 |
1.20 |
1.84 |
1.98 |
2.18 |
1.67 |
| Auxiliary |
0.24 |
0.21 |
0.23 |
0.28 |
0.34 |
0.25 |
0.35 |
0.36 |
0.37 |
0.32 |
| Indirect |
0.44 |
0.63 |
0.42 |
0.18 |
0.22 |
0.40 |
0.23 |
0.23 |
0.34 |
0.30 |
| Total Operating Costs |
2.21 |
2.35 |
2.33 |
2.62 |
3.12 |
2.48 |
3.15 |
3.26 |
3.60 |
2.97 |
Table 21-5: Operating Costs-Mining/Components ($/t Moved)
| |
2024 |
2025 |
2026 |
2027 |
2028 |
2024-2028
Avg. |
2029-2033
Avg. |
2034-2038
Avg. |
2039-2043
Avg. |
LOM |
| Mining |
|
|
|
|
|
|
|
|
|
|
| Direct (Total) |
1.77 |
1.73 |
1.91 |
2.44 |
2.89 |
2.07 |
2.92 |
3.03 |
3.26 |
2.66 |
| Labour |
0.41 |
0.38 |
0.43 |
0.55 |
0.66 |
0.47 |
0.67 |
0.72 |
0.97 |
0.64 |
| Diesel |
0.65 |
0.64 |
0.71 |
0.94 |
1.15 |
0.78 |
1.16 |
1.20 |
1.21 |
1.03 |
| Maintenance |
0.52 |
0.51 |
0.58 |
0.73 |
0.86 |
0.62 |
0.86 |
0.88 |
0.94 |
0.78 |
| Power |
0.02 |
0.02 |
0.02 |
0.02 |
0.03 |
0.02 |
0.03 |
0.03 |
0.04 |
0.03 |
| Purchased Services |
0.17 |
0.18 |
0.18 |
0.20 |
0.20 |
0.19 |
0.19 |
0.20 |
0.10 |
0.18 |
| Indirect |
0.44 |
0.63 |
0.42 |
0.18 |
0.22 |
0.40 |
0.23 |
0.23 |
0.34 |
0.30 |
| Total Operating Costs |
2.21 |
2.35 |
2.33 |
2.62 |
3.12 |
2.48 |
3.15 |
3.26 |
3.60 |
2.97 |
The process plant operating costs have been divided into the key drivers, with power having the greatest impact on the process plant cost. The G&A cost includes all administrative areas at the site. A breakdown of milling and G&A costs is given in Table 21-6.
Table 21-6: Operating Costs-Milling and G&A ($/t Milled)
| |
2024 |
2025 |
2026 |
2027 |
2028 |
2024-2028
Avg. |
2029-2033
Avg. |
2034-2038
Avg. |
2039-2043
Avg. |
LOM |
| Milling (Total) |
7.41 |
6.76 |
5.93 |
5.70 |
5.70 |
6.27 |
5.70 |
5.70 |
5.70 |
5.85 |
| Labour |
2.14 |
1.90 |
1.78 |
1.71 |
1.71 |
1.84 |
1.71 |
1.71 |
1.71 |
1.75 |
| Power |
2.29 |
2.09 |
1.96 |
1.88 |
1.88 |
2.01 |
1.88 |
1.88 |
1.88 |
1.92 |
| Primary and Secondary Crushing Liners |
0.14 |
0.16 |
0.15 |
0.14 |
0.14 |
0.15 |
0.14 |
0.14 |
0.14 |
0.14 |
| Media, Reagents, and Other Consumables |
1.66 |
1.53 |
1.25 |
1.20 |
1.20 |
1.36 |
1.20 |
1.20 |
1.20 |
1.24 |
| Maintenance |
1.01 |
0.93 |
0.65 |
0.63 |
0.63 |
0.76 |
0.63 |
0.63 |
0.63 |
0.66 |
| Other |
0.17 |
0.15 |
0.14 |
0.14 |
0.14 |
0.15 |
0.14 |
0.14 |
0.14 |
0.14 |
| G&A |
1.48 |
1.35 |
1.27 |
1.22 |
1.18 |
1.29 |
1.17 |
1.14 |
0.87 |
1.13 |
| Total Milling and G&A |
8.89 |
8.11 |
7.20 |
6.92 |
6.88 |
7.56 |
6.87 |
6.84 |
6.57 |
6.98 |
Cash costs and sustaining cash costs per pound of copper are summarized in Table 21-7. Cash costs include mining, milling G&A, off-site costs, and treatment and refining charges. Sustaining cash costs also include both sustaining capital and lease payments (but exclude any growth capital related to mill expansion and New Ingerbelle). Both cash costs and sustaining cash costs include the impact of capitalized stripping and are reported net of by-product credits.
Table 21-7: Operating Costs and Sustaining Costs per Pound (US$/lb)
| |
2024 |
2025 |
2026 |
2027 |
2028 |
2024-2028
Avg. |
2029-2033
Avg. |
2034-2038
Avg. |
2039-2043
Avg. |
LOM |
| Cash Costs |
2.69 |
1.89 |
1.89 |
1.90 |
1.36 |
1.89 |
1.53 |
1.75 |
2.31 |
1.84 |
Sustaining Cash Costs
(excl. discretionary stripping) |
3.49 |
3.40 |
2.74 |
2.45 |
2.13 |
2.76 |
2.26 |
2.46 |
2.58 |
2.53 |
Sustaining Cash Costs
(incl. discretionary stripping) |
3.77 |
3.87 |
2.94 |
2.45 |
2.13 |
2.93 |
2.26 |
2.46 |
2.58 |
2.58 |
Notes: Cash cost and sustaining cash cost, net of by-product credits per pound of copper contained in concentrate. By-product credits are calculated using the following commodity prices:
Gold: US$1,940/oz for 2024, US$1,900/oz for 2025, US$1,800/oz for 2026, US$1,764/oz for 2027, US$1,725/oz for 2028, and US$1,700/oz long term.
Silver: US$24.00/oz for 2024-2026, US$23.75/oz for 2027, US$23.38/oz for 2028, and US$23.00/oz long term.
Discretionary capitalized stripping relates to a portion of accelerated stripping activities over 2024-2026 to access higher grade ore but could be reduced or deferred to a later date based on further geotechnical evaluation and other considerations.
22 Economic Analysis
Pursuant to NI 43-101, producing issuers may exclude the information required for Section 22 Economic Analysis on properties in production, unless the Technical Report includes a material expansion of current production.
As Hudbay is a producing issuer, it has excluded information required by Item 22 of Form 43-101F1, as the updated mine plan does not represent a material increase in current production.
23 Adjacent Properties
The Copper Mountain property covers all the known significantly mineralized properties in the district. There are currently no adjacent properties with significant mineralization. To the north, within the same belt of rocks, some deposits and properties are relevant to exploration at the Copper Mountain site. The most significant are those associated with the Iron Mask batholith (IMB) in the Afton-Ajax camp near Kamloops, B.C., approximately 150 km north of the CMM.
The IMB is about 35 km long, consists of multi-phase diorite and gabbro intrusions, and was emplaced into Nicola Group rocks at approximately the same time as the Copper Mountain Stock. The Afton mineralization occurs within a zone of abundant magnetite veining, developed within extensively fractured diorite to monzonite of the IMB's Cherry Creek Phase. The veining is oriented along the IMB's longitudinal axis. Sub-vertical dykes of picrite, 1 m to 5 m thick, form the southeast contact of the relatively tabular zone of mineralization. Sulphide minerals consisting of bornite, chalcocite, and chalcopyrite, along with native copper are found in the upper 200 m supergene zone of mineralization, with all extending to depth except for the native copper. Pyrite (up to 6%) occurs as a halo of the more copper-rich phases; however, there is no concentric zonation of mineralization or alteration typical of calc-alkalic-type porphyry deposits.
The Afton deposit has a long exploration history, with several companies involved in attempting to develop resources over many years. Teck Resources Limited (Teck) commissioned production in 1977, based on a resource of 31 Mt grading 1.0% Cu, 0.58 g/t Au, and 4.2 g/t Ag. Mining from 1978 to 1987 recovered approximately 70% of the resource, with a pit depth of 275 m. A significant aspect of the open pit operation was the recovery of native copper, which resulted in significantly lower offsite costs for the mining operation.
New Gold Inc. (New Gold) acquired the Project, and after exploration and feasibility studies, placed the deposit into production in September 2012, as an 11,000 t/d, block cave operation producing copper, gold, and silver. Mineral Reserves as of December 31, 2019, are listed as 47.3 Mt grading 0.66 g/t Au, 1.9 g/t Ag, and 0.77% Cu, in addition to Measured and Indicated Resources (exclusive of Reserves) of 57.0 Mt grading 0.61 g/t Au, 2.1 g/t Ag, and 0.74% Cu (Lecuyer et al., 2020). Most of the mineralization occurs in a fault-bounded, tabular zone some 900 m long, 100 m wide, with a vertical extent of 350 m. Recent New Gold drilling indicates that mineralization continues to a depth of 1,200 m below surface (Hall & May, 2013).
KGHM International's Ajax project is adjacent to the New Afton deposit. The Ajax deposit has Proven and Probable Mineral Reserves estimated at 426 Mt containing 0.29% Cu, 0.19 g/t Au, and 0.39 g/t Ag (Dagel et al., 2016). The Ajax deposit has geological similarities to New Afton and Copper Mountain and is also classified as an alkalic porphyry. The Ajax deposit has not been permitted for production.
Mineralization at the CMM is similar to that of the New Afton and Ajax properties. The main differences include the existence of a supergene zone at New Afton, with significantly higher gold grades. The vertical extent of mineralization at New Afton, and its proximity to the Ajax deposit, further supports by analogy the deeper exploration potential at the CMM.
24 Other Relevant Data and Information
There are no other relevant data or information material to the CMM that is necessary to make this Technical Report not misleading.
25 Interpretation and Conclusions
CMM restarted operations in March 2011. Since that time the mine has run uninterrupted and consistently achieved improved performance regarding metallurgical recovery and throughput. The deposit represents what is considered by industry standards a low-grade copper porphyry dominated by hypogene mineralization. The CMM plant has proven to produce a marketable clean concentrate for copper, with both significant gold and silver by-products.
Hudbay internal peer reviews and validation processes have confirmed that the mineral resource model is constructed utilizing industry best practices and sound QA/QC principles-including a thorough reconciliation between the reserve model and the past three years of operations.
The economic and design parameters modelled, assumed, and stated provide for economic extraction of Mineral Reserves from the stated Mineral Resource.
The Mineral Resource and Mineral Reserve estimates meet the criteria outlined in industry best-practices such as Canadian institute of Mining, Metallurgy and Petroleum's CIM Definition Standards for Mineral Resources & Mineral Reserves (CIM, 2014, May 19).
The production and compilation of this Technical Report was performed by the capable and professional management and staff of Hudbay's corporate office and at the CMM site. The QP, Hudbay's Olivier Tavchandjian, P.Geo., Senior Vice-President, Exploration and Technical Services, supervised, revised, and approved the assembly of this Technical Report.
- The resulting life of mine plan accounts for feed restrictions as stipulated by the processing plant regarding feed grade.
- Current performance of the operation supports the position that the plant will ramp up to 45 kt/d average production, including consideration for maintenance by 2025, and will further increase to 50 kt/d by 2027.
- The sustaining capital included in the financial analysis is sufficient to address all the future requirements with respect to mine fleet and plant maintenance, and for tailings expansion.
- Separate project capital outlined adequately accounts for mill stabilization at 45 kt/d, the increase to 50 kt/d, development of the New Ingerbelle open pit and associated infrastructure on the west side of the Similkameen River, and haulage to the processing plant east of the river on a bridge to be constructed across the river.
- Relevant mining permits and land title are in good standing and will be amended as required throughout the LOM.
- Other than the risks described in this Technical Report, and other risk factors described in Hudbay's most-recent annual information form and most recent management's discussion and analysis, there are no known significant risks and uncertainties that could reasonably be expected to materially affect the potential development of the Mineral Reserve and Mineral Resource estimates in this report.
Below are the key findings of this Technical Report:
- The current long-term LOM plan was produced from the optimized pit shells and Mineral Reserve block model; total pit ore mined is estimated to be 312 Mt, starting in January 2024, with total pit waste mined of approximately 867 Mt. The LOM average strip ratio of material moved is 2.8:1 (waste:ore).
- The concentrator will process 367 Mt starting in January 2024, which includes the current low-grade stockpile of approximately 54.6 Mt.
- Over the first fifteen years of the LOM plan, average annual production is 94 Mlb of copper, 53 koz of gold, and 291 koz of silver.
This Technical Report is based on a long operating history. The following experience with the operation provides confidence in the proposed LOM plan:
- The property has been successfully operated as a bulk, low-cost, copper-gold-silver open pit mine since 2011.
- The operating plan uses existing site infrastructure and minimizes new disturbances.
- The Mineral Reserve is well understood and supports a 21-year mine life, inclusive of stockpile reclaim.
- Mineral recoveries are well understood.
- The deposits are non-acid generating, resulting in low environmental risks and low long-term liability.
- Progressive reclamation is actively implemented and incorporated in mine planning. A reclamation bond with the province is in place. The conceptual mine closure plan will be updated as part of the CMM expansion project. A detailed closure plan will be submitted prior to 12 months before mine closure.
- Hudbay has Participation Agreements with the local First Nations and maintains regular engagement through JIC meetings. Hudbay engages with the Community of Interest through regular meetings and enjoys strong support from the local communities.
- The LOM plan will require amendments to the existing operational permits, MA Permit M-29, PE-261, and PA-105340.
It is the opinion of the author that the classification of Proven and Probable Mineral Reserves meets the definitions of Proven and Probable Mineral Reserves as stated by NI 43-101 and defined by the CIM Standards on Mineral Resources and Reserves-Definitions and Guidelines.
26 Recommendations
The following recommendations aim to advance and fully capture the economic potential of the expansion study update defined in this Technical Report:
- Continue to closely monitor thorough reconciliations from Mineral Reserve estimates to mill-credited production to validate the performance of the new reserve model.
- Conduct additional geotechnical investigations along the south wall of Pit 3 to identify opportunities for maximizing double benching and reducing waste stripping.
- Finalize a design of site power infrastructure and supply.
- Continue with the TMF Engineer of Record's construction engineering guidance to confirm the annual construction plan for increasing the existing tailings impoundment capacity.
- Continue infill drilling programs to convert inferred mineral resource to mineral reserve estimates in the North Pit and at New Ingerbelle.
- Metallurgical testing and simulations to refine the forecast model for mill throughput and metals and continue process optimization.
- Continue engaging with communities of interest and First Nations.
- Conduct additional technical and economic trade-off studies to reduce ore and waste transportation by diesel trucks to reduce mining costs, improve mining productivity, and reduce GHGs.
- Install a mast for collecting real-time wind data, to evaluate site renewable-energy generation.
The recommended next steps address opportunities that Hudbay has yet not incorporated in the LOM plan as a result of time constraints associated to reporting. The recommendations listed in this section require further definition to accurately estimate their value and will be conducted internally by Hudbay. There are no anticipated significant additional costs to be incurred other than those already part of Hudbay annual operating budget at the CMM and for corporate exploration.
27 References, Abbreviations, and Units of Measure
27.1 References
ALS Metallurgy (Kamloops). (2011, October 5). Ore Hardness Testing Copper Mountain-KM3158. Prepared for Copper Mountain Mining Corp.
ALS Metallurgy (Kamloops). (2012, October 15). Ore Hardness Testing Copper Mountain-KM3586. Prepared for Copper Mountain Mining Corp.
AMEC (2016, January 22). Copper Mountain Mine Tailings Management Facility Eastern TMF Expansion-North Dam, Prefeasibility Study Report. Prepared for Copper Mountain Mine (BC) Ltd.
AMEC Earth and Infrastructure. (2011, May 31). Copper Mountain Mine Reactivation-Tailings Management Facility: Final Design Report. Prepared for Copper Mountain Mine (BC) Ltd.
Archer CRM Partnership. (2020). Archaeological Overview Assessment and Preliminary Field Reconnaissance of the Proposed New Ingerbelle Open Pit Push-Back and Mine Life Extension Project. Prepared for Copper Mountain Mining Corp.
Associated Environmental Consultants Inc. (2021a). Conceptual End Land Use Planning for Copper Mountain Mine. Prepared for Copper Mountain Mining Corp.
Associated Environmental Consultants Inc. (2021b). Copper Mountain Mine Wildlife Mitigation Management Plan: CMM-83023-EV-124-1000_0. Prepared for Copper Mountain Mining Corp.
Associated Environmental Consultants Inc. (2022). Summary Report of Field Program 1: Species at Risk Surveys 2022. Prepared for Copper Mountain Mine (BC) Ltd.
Ausenco Engineering. (2020, November). Copper Mountain-65 ktpd Expansion, Capital Cost Basis of Estimate. Prepared for Copper Mountain Mining Corp.
AusIMM The Minerals Institute (2012). Australasian Code for Reporting of Exploration Results, Mineral Resources and Ore Reserves. http://jorc.org/docs/JORC_code_2012.pdf
Base Metallurgical Laboratories. (2019, January). Copper Mountain Mining SMC Test Report-BL406. Prepared for Copper Mountain Mine (BC) Ltd.
Base Metallurgical Laboratories. (2020a, November 4). Generation of Tailing for Environmental Testing-Ingerbelle Zone-BL0655. Prepared for Copper Mountain Mine (BC) Ltd.
Base Metallurgical Laboratories. (2020b, November 4). Variability Testing for Copper Mountain Ores-BL0703. Prepared for Copper Mountain Mine (BC) Ltd.
Bissig, T., & Cooke, D. R. (2014). Introduction to the special issue devoted to alkalic porphyry Cu-Au and epithermal Au deposits. Economic Geology, 109(4), 819-825.
Canadian Institute of Mining, Metallurgy and Petroleum (CIM) (2014). CIM Definition Standards for Mineral Resources & Mineral Reserves. https://mrmr.cim.org/media/1128/cim-definition-standards_2014.pdf
Canadian Institute of Mining, Metallurgy and Petroleum (CIM) (2019). CIM Estimation of Mineral Resources & Mineral Reserves Best Practice Guidelines.
Chance, A., Giroux, G. H., Holbek, P. M., Martin, T., Murray, D., O'Rourke, J., Makram, E. J., & Thompson, I. (2009, August 21). Technical Report on the Copper Mountain Project, Princeton, British Columbia. Prepared for Copper Mountain Mining Corporation.
Collins, J., Rokosh, J., Major, K., Giroux, G. H., Muraro, T. & Gunning, D. (2007). Preliminary Assessment Report, Copper Mountain Project. Prepared for Copper Mountain Mining Corporation, effective date November 16, 2007.
Collins, J., Roskosh, J., Major, K., Giroux, G. H., Muraro, T., & Gunning, D. (2007, November 16). Preliminary Assessment Report for the Copper Mountain Project. Copper Mountain Mining Corporation.
Copper Mountain Mine (BC) Ltd. (2017, January). Mines Act Permit M-29, 2016 Mine and Reclamation Plan Update.
Copper Mountain Mine (BC) Ltd. (2018, September). Annual Production Data.
Copper Mountain Mine (BC) Ltd. (2018a, March). Environmental Management Act Permit PA-105340, Annual Inspection, Maintenance, and Performance Report, 2017.
Copper Mountain Mine (BC) Ltd. (2018b, April). Environmental Management Act Permit PE 00261, Annual Report of Operations, Maintenance and Environmental Monitoring Programs, 2017.
Copper Mountain Mine (BC) Ltd. (2018c, March). Mines Act Permit M-29, Annual Reclamation Report, 2017.
Copper Mountain Mine (BC) Ltd. (2018d, November 10). NI 43-101 Technical Report for the Copper Mountain Mine. Effective Date: September 27, 2018.
Copper Mountain Mine (BC) Ltd. (2019). Water Management Plan.
Copper Mountain Mine (BC) Ltd. (2020). Mine to Mill Testwork Data, September 2020.
COWI North America Ltd. (2018, November 30). Similkameen Bridge Study Letter Report. Prepared for Copper Mountain Mining Corp.
Cromwell, E. (2015). Host Rock Characteristics and Controls on Cu-Au-Ag Mineralization at Copper Mountain Porphyry Deposit, Southern BC, Canada. [Unpublished master's thesis]. Department of Earth Sciences, Durham University.
Dagel, K. D., Roth, D., Ennis, S., Tolmer, D., Chubb, D. C., Wild, C. J., Stoiber, C., Watson, J., Yue, J., Mehmedbegovic, E., Rahmatian, P., Laylabadi, M., & Farmer, S. (2016). Ajax Project NI 43-101 Technical Report Feasibility Study Update, British Columbia, Canada. Technical report prepared for KGHM Ajax Mining Inc., effective date February 19, 2016.
Daniel, M. J. (2019, February 5). Capacity Predictions for the Milling Circuit Upgrade to 45 kt/d (2C/SABC-B) and Ingerbelle Expansion to 65 kt/d Incorporating HPGR Technology (New 2C/HPGR/BM circuit). CMD Consulting Pty Ltd. Prepared for Copper Mountain Mining Corp.
DataBC. (2022). iMap BC. https://www2.gov.bc.ca/gov/content/data/geographic-data-services/web-based-mapping/imapbc
Dolmage, V. (1934). Geology and ore deposits of Copper Mountain, British Columbia. Geological Survey of Canada, Memoir 171.
Encoord Inc., (2021). Copper Mountain Mine Techno-Economic Pre-Feasibility Assessment (Renewable Energy). Prepared for Copper Mountain Corporation.
Fahrni, K. C. (1951). Geology of Copper Mountain. Canadian Institute of Mining and Metallurgy Bulletin, 44(469), 317-324.
Fahrni, K. C., Macauley, T. N., & Preto, V. A. G. (1976). Copper Mountain and Ingerbelle. In A. Sutherland Brown (Ed.), Porphyry Deposits of the Canadian Cordillera (Special Volume 15, pp. 368-375). Canadian Institute of Mining and Metallurgy.
Foggiatto, B. (2020a, November 20). Memorandum-Review of Flowsheet Options for the Copper Mountain 65 kt/d Expansion. Ausenco Engineering. Prepared for Copper Mountain Mining Corp.
Foggiatto, B. (2020b, November 3). Memorandum-Review of the Regrind Tower Mill Option for the Copper Mountain 65 kt/d Expansion. Ausenco Engineering. Prepared for Copper Mountain Mining Corp.
Giroux, G. H., & Holbek, P. M. (2009, April 21). Resource Estimate Report for the Copper Mountain Project. Prepared for Copper Mining Mountain Corporation.
Giroux, G. H., Ghosh, K. D., Hutchinson, C., Knight, E., Lipkewich, R. J., Major, K., Martin, T., Muraro, T., Murray, D., Pelletier, P., Proulx, E., Pytlewski, A., Purdy, W., & Woods, J. (2008, September 11). Independent Technical Report on behalf of Copper Mountain Mining Corporation on the Copper Mountain Project.
Golder Associates. (2021). Copper Mountain Mine: Geotech_Drawing_v2010_version_B-Geotech _Slopes. Prepared for Copper Mountain Mining Corporation.
Government of B.C. (2017). Health, Safety and Reclamation Code for Mines in British Columbia. Ministry of Energy, Mines and Petroleum Resources, Mining and Minerals Division, Victoria, B.C. https://www2.gov.bc.ca/assets/gov/farming-natural-resources-and-industry/mineral-exploration-mining/documents/health-and-safety/code-review/health_safety_and_reclamation_code_2017_rev.pdf
Government of B.C. (2020). BC Mine Information Authorizations. Authorizations for Major Mines in British Columbia. https://mines.nrs.gov.bc.ca/authorizations
Government of B.C. (2022). BC Species and Ecosystem Explorer. BC Conservation Data Centre (BC CDC).
Government of Canada. (2021a). First Nation Detail: Upper Similkameen. https://fnp-ppn.aadnc-aandc.gc.ca/fnp/Main/Search/FNMain.aspx?BAND_NUMBER=599&lang=eng
Government of Canada. (2021b). First Nation Detail: Lower Similkameen. https://fnp-ppn.aadnc-aandc.gc.ca/fnp/Main/Search/FNMain.aspx?BAND_NUMBER=598&lang=eng
Government of Canada. (2022). Fisheries Act Registry: Pollution Prevention. https://www.canada.ca/en/environment-climate-change/services/managing-pollution/effluent-regulations-fisheries-act.html
Hall, R., & May, B. (2013). Geology of the New Afton porphyry copper-gold deposit, Kamloops, British Columbia, Canada. In J. Logan & T. G. Schroeter (Eds.), Porphyry Systems of Central and Southern BC: Prince George to Princeton (Field Trip Guidebook Series 44, pp. 117-128). Society of Economic Geologists.
Hatfield Consultants LLP. (2021, January 22). 2020 Similkameen River Hydrology Assessment. Copper Mountain Mine (BC) Ltd.
Hatfield Consultants LLP. (2021, March 9). Similkameen River Instantaneous Peak Flood Frequency Analysis.
Holbek, P. M., & Giroux, G. H. (2007, October 22). Technical Report on the Copper Mountain Project, Princeton, British Columbia. Prepared for Copper Mountain Mining Corp.
Holbek, P. M., Cavey, G. & Gunning, D. (2007, June). Technical Report on the Copper Mountain Project. Prepared for Copper Mountain Mining Corporation and Compliance Energy Ltd.
Holbek, P. M., Cavey, G. & Gunning, D. (2007, June). Technical Report on the Copper Mountain Project. Prepared for Copper Mountain Mining Corporation and Compliance Energy Ltd.
Holbek, P. M., Cavey, G., & Gunning, D. (2007, February). Summary Report on the Copper Mountain Project. Prepared for Copper Mountain Mining Corporation.
Holbek, P. M., Change, A. Giroux G. Martin T. Murray D. O'Rourke, J. El Sabbagh, M, & Thompson, I. (2009, August 21).Technical Report on the Copper Mountain Project, Princeton, British Columbia. Prepared for Copper Mountain Mining Corp.
Holbek, P., & Collins, S. (2019). Copper Mountain Integrated LOM NI 43-101 Technical Report for the CMM including New Ingerbelle. Prepared for Copper Mountain Mining Corp.
Holbek, P., & Joyes, R. (2013). Copper Mountain: An alkalic porphyry copper-gold-silver deposit in the southern Quesnel terrane, British Columbia. In J. Logan & T. G. Schroeter (Eds.), Porphyry Systems of Central and Southern BC: Prince George to Princeton (Field Trip Guidebook Series 44, pp. 129-143). Society of Economic Geologists.
Holbek, P., Collins, S., & Strickland, D. (2018). NI 43-101 Technical Report for the Copper Mountain Mine. Prepared for Copper Mountain Mining Corporation.
Holbek, P., Klue, R., Collins, S., & Westendorf, M. (2020, November 30). Copper Mountain Mine 65 kt/d Expansion Study and Life-of-Mine Plan NI 43-101 Technical Report. Prepared for Copper Mountain Mining Corp.
Klohn Crippen Berger (2012). Copper Mountain Mine 2007 to 2011 Fish and Aquatic Habitat Assessment. Prepared for Similco Mines Ltd.
Klohn Crippen Berger (2018, March). Copper Mountain Mine Tailings Management Facility, 2016 Dam Safety Review. Prepared for Copper Mountain Mining Corp.
Klohn Crippen Berger (2019, March 31). Copper Mountain Mine Tailings Management Facility, 2019 Dam Safety Inspection and As-Built Report. Prepared for Copper Mountain Mining Corp.
Klohn Crippen Berger (2020a, April 30). Copper Mountain Mine Tailings Management Facility 2019 Integrated Life-of-Mine Plan Expansion Design. Prepared for Copper Mountain Mining Corp.
Klohn Crippen Berger (2020b, October 21). Copper Mountain Mine Tailings Management Facility 2019 Integrated Life-of-Mine Plan Expansion Design Review of TMF Design for 65,000 tpd. Prepared for Copper Mountain Mining Corp.
Klohn Crippen Berger (2022, September). Copper Mountain Mine TMF Expansion Feasibility Study to EL 1060 m. Engineer of Record, Andrew Witte. Prepared for Copper Mountain Mining BC Ltd.
Knight Piésold Consulting (2014, January 20). Similkameen River 2012-2013 Hydrometric Monitoring Summary.
KWM Consulting. (2008, January 16). Proposed Grinding System for the Copper Mountain Circuit Based on Small-Scale Data. Prepared for Copper Mountain Mine (BC) Ltd.
Lang, J. R. (1993). Chapter 4: Petrography and preliminary geochemical evaluation of igneous rocks in the Copper Mountain district. In Annual Technical Report, Year 2, Copper Gold Porphyry Systems of British Columbia. Mineral Deposit Research Unit Internal Report. University of British Columbia.
Lang, J. R., Stanley, C. R. & Thompson, J. F. H. (1995). Porphyry copper-gold deposits related to alkalic igneous rocks in the Triassic-Jurassic arc terranes of British Columbia. In J. Bolm & F.W. Pierce (Eds.) Bootprints Along the Cordillera. Arizona Geological Society Digest, 20. Arizona Geological Society.
Leblanc, C. (2018, September). Ingerbelle Flotation Report, Copper Mountain Concentrator. Prepared for Copper Mountain Mine (BC) Ltd.
Lecuyer, N. L., Rennie, D. W., Krutzelmann, H., & Vasquez, L. (2020). Technical Report on the New Afton Mine, British Columbia, Canada. NI 43-101 technical report prepared by Roscoe Postle Associates Inc. for New Gold Inc., effective date February 28, 2020.
Logan, J. M., & Mihalynuk, M. G. (2014). Tectonic controls on early Mesozoic paired alkaline porphyry deposit belts (Cu-Au±Ag-Pt-Pd-Mo) within the Canadian Cordillera. Economic Geology, 109(4), 827-858.
Lowell, J. D., & Guilbert, J. M. (1970). Lateral and Vertical Alteration, Mineralization and Zoning in Porphyry Ore Deposits. Economic Geology, 65, 373-408.
Metso Process Group. (2020, September 1). Copper Mountain Ingerbelle 65 ktpd - A Concept Level Study - Single Line HRC vs 2 Line SABC. Prepared for Copper Mountain Mining Corp.
Metso York Laboratory. (2020, August 22). Test Plant Report-20341136. Prepared for Copper Mountain Mining Corp.
Mihalynuk, M. G., Logan, J., Friedman, R. M., & Preto, V. A. (2010). Age of Mineralization and 'Mine Dykes' at Copper Mountain Alkaline Copper-Gold-Silver Porphyry Deposit (NTS 092H/07), South-Central British Columbia. In Geological Fieldwork 2009 (British Columbia Geological Survey Paper 2010-01, pp. 163-172). British Columbia Ministry of Energy, Mines and Petroleum Resources. http://cmscontent.nrs.gov.bc.ca/geoscience/PublicationCatalogue/Paper/BCGS_P2010-01-14_Mihalynuk.pdf
Mihalynuk, M.G., Diakow, L.J., Friedman, R.M., & Logan, J.M. (2016). Chronology of southern Nicola arc stratigraphy and deformation. In Geological Fieldwork 2015 (British Columbia Geological Survey Paper 2016-1, pp. 31-63). British Columbia Ministry of Energy and Mines.
Ministry of Energy, Mines and Low Carbon Innovation. (2022). Major Mines Authorizations Guide. https://www2.gov.bc.ca/assets/gov/farming-natural-resources-and-industry/mineral-exploration-mining/documents/permitting/mmpo/major_mines_auth_guide_-_v10_-_final_may_2022.pdf
Monger, J. W. H. (1989). Geology of the Hope Map Sheet, British Columbia (Map 41-1989). Geological Survey of Canada.
Monger, J. W. H., Price, R. A., & Tempelman-Kluit, D. J. (1982). Tectonic accretion and the origin of the two major metamorphic and plutonic welts in the Canadian Cordillera. Geology, 10, 70-75.
Monger, J. W. H., Wheeler, J. O., Tipper, H. W., Gabrielse, H., Harms, T., Struick, L. C., Campbell, R. B., Dodds, C. J., Gehrels, G. E., & O'Brian, J. (1992). Upper Devonian to Middle Jurassic Assemblages, Part B. Cordilleran Terranes. In H. Gabrielse & C. J. Yorath (Eds.), The geology of the Cordilleran Orogen in Canada (The Geology of Canada, No. 4, DNAG Vol. G2, pp. 281-328). Geological Survey of Canada.
Montgomery, J. H. (1967). Petrology, Structure and Origin of the Copper Mountain Intrusions near Princeton, BC [Unpublished doctoral dissertation]. The University of British Columbia.
Mortensen, J. K., Ghosh, D. K., & Ferri, F. (1995). U-Pb geochronology of intrusive rocks associated with copper-gold porphyry deposits in the Canadian Cordillera. In Porphyry Deposits of the Northwestern Cordillera of North America (Canadian Institute of Mining, Metallurgy and Petroleum, Special Volume 46, 142-158). Canadian Institute of Mining, Metallurgy and Petroleum
Mortimer, N. (1987). The Nicola Group: Late Triassic and Early Jurassic subduction-related volcanism in British Columbia. Canadian Journal of Earth Sciences, 24, 2521-2536.
Parliament, J. H. (1974). The Similkameen Project, April 1974. Prepared for Copper Mountain Mine (BC) Ltd.
Petersen N. T., Smith, P. L., Mortensen, J. K., Creaser, R. A., & H. W. Tipper. (2004). Provenance of Jurassic sedimentary rocks of south-central Quesnellia, British Columbia: implications for paleogeography. Canadian Journal of Earth Sciences, 41(1), 103-125.
Preto, V. A. G. (1972). Geology of Copper Mountain. Bulletin 59. British Columbia Department of Energy Mines and Petroleum Resources.
Preto, V. A. G. (1977). The Nicola Group: Mesozoic Volcanism Related to Rifting in Southern British Columbia. In W. R. A. Baragar, L. C. Coleman, & J. M. Hall (Eds.), Volcanic Regimes in Canada (Special Paper No. 16, pp. 39-57). Geological Association of Canada.
Preto, V. A. G. (1979). Geology of the Nicola Group between Merritt and Princeton. Bulletin 69. British Columbia Department of Energy Mines and Petroleum Resources.
Process Mineralogical Consulting. (2017, January 31). A Mineralogical Description of a Rougher Concentrate Sample. Prepared for Copper Mountain Mine.
Process Mineralogical Consulting. (2019, February 13). A Size-by-Size Mineralogical Characterization of Sample 2018-NIN-201. Prepared for Copper Mountain Mining Corp.
Redmond, P., Klue, R., Chang, A., Simonian, B., Humala, A., & Weston, S. (2022, September 30). Copper Mountain Mine LOM Plan and 65 kt/d Expansion Study Update NI 43-101 Technical Report. Prepared for Copper Mountain Mining Corp.
Rice, H. M. A. (1947). Geology and mineral deposits of the Princeton map-area, British Columbia. Memoir 243. Geological Survey of Canada.
Rokosh, J., Major, K., Giroux, G. H., Holbek, P. M., Mehr, E., O'Rourke, J., & Tiver, A. (2007, November). Preliminary Assessment Report, Copper Mountain Project. NI 43-101 Technical Report prepared for Copper Mountain Mining Corporation.
Shaw, W. S. (1952). The Princeton coalfield, British Columbia. Paper 55-12. Geological Survey of Canada.
SRK Consulting (Canada) Inc. (2009, March). Copper Mountain Porphyry Copper-Gold Mine, Princeton, BC. Application to Amend Mines Act Permit M-29. Prepared for Copper Mountain Mining Corp.
SRK Consulting (Canada) Inc. (2016, January). Copper Mountain Mine, Application to Amend Mines Act Permit M-29: Changes to Classification and Management of Rock Materials. Prepared for Copper Mountain Mining Corp.
SRK Consulting (Canada) Inc. (2018, May). Metal Leaching and Acid Rock Drainage Prediction and Prevention Plan. Prepared for Copper Mountain Mine (BC) Ltd.
SRK Consulting (Canada) Inc. (2019). Copper Mountain Mine: Metal Leaching and Acid Rock Drainage Prediction and Prevention Plan. Prepared for Copper Mountain Mining Corp.
SRK Consulting (Canada) Inc. (2021a). New Ingerbelle Project: Metal Leaching and Acid Rock Drainage Potential Assessment. Prepared for Copper Mountain Mine (BC) Ltd. (CMML).
SRK Consulting (Canada) Inc. (2021b). Hydrogeological Assessment, MAPA Application, New Ingerbelle Project. Prepared for Copper Mountain Mine (BC) Ltd. (CMML).
SRK Consulting (Canada) Inc. (2022). Copper Mountain Mine: 2021 Groundwater Annual Report. Prepared for Copper Mountain Mining Corp.
Stanley, C. R., & Lang, J. R. (1993). Geology, Geochemistry, Hydrothermal Alteration and Mineralization in the Virginia Zone, Copper Mountain Copper-Gold Camp, Princeton, British Columbia (92H/7). British Columbia Geological Fieldwork 1992, Paper 1993-1, 259-268.
Stanley, C. R., Holbek, P. M., Huyck, H. L., Lang, J. R., Preto, V. A. G., Blower, S. J., & Bottaro, J. C. (1995). Geology of the Copper Mountain Alkalic Copper-Gold Porphyry Deposits, Princeton, British Columbia. In Porphyry Deposits of the Northwestern Cordillera of North America (Special Volume 46, pp. 537-565). Canadian Institute of Mining and Metallurgy.
University of British Columbia. (2020, October 5). High-Pressure Grinding Tests on SAG Feed Belt Cut Sample from Copper Mountain Mine. NBK Institute of Mining Engineering. Prepared for Copper Mountain Mining Corp.
Woodsworth, G. J., Anderson, R. G., Armstrong, R. L., Struick, L. C., & Van der Heyden, P. (1992). Plutonic regimes. In H. Gabrielse & C. J. Yorath (Eds.), The geology of the Cordilleran Orogen in Canada (The Geology of Canada, No. 4, DNAG Vol. G2, pp. 493-531). Geological Survey of Canada.
WSP Canada Inc. (2023a, October 19). Open Pit Slope Design Summary Report-Copper Mountain Mine (Reference No. 21467876-154-R-Rev0-3003). Submitted to Copper Mountain Mining Corporation.
WSP Canada Inc. (2023b, September 19). Open Pit Slope Design Summary Report-New Ingerbelle Pit (Reference No. 21467876-154-R-Rev0-3003). Submitted to Copper Mountain Mining Corporation.
27.2 Abbreviations and Units of Measure
| AAC |
Allowable Annual Cut |
| a |
Annum |
| AOA |
Archaeological Overview Assessment |
| AOP |
Areas of Potential |
| AA |
Atomic Absorption |
| Base Met |
Base Met Laboratories Ltd. |
| BC EAA |
BC Environmental Assessment Act |
| MMPO |
BC Major Mine Permitting Office |
| MECCS |
BC Ministry of Environment and Climate Change Strategy |
| BGC |
Biogeoclimatic |
| BEMP |
Biological Effects Monitoring Program |
| BW |
Bond Work index |
| BC |
British Columbia |
| CABIN |
Canadian Aquatic Biomonitoring Network |
| C$ |
Canadian dollars |
| CIM |
Canadian Institute of Mining |
| CNWA |
Canadian Navigable Waters Act |
| CO2e |
Carbon Dioxide Equivalent |
| cm |
Centimeter |
| CPO |
Chief Permitting Officer |
| CPF |
Coarse Particle Flotation |
| COI |
Constituents of Interest |
| CuEq |
Copper Equivalent |
| CM |
Copper Mountain |
| CMM |
Copper Mountain Mine |
| CMME |
Copper Mountain Mine Expansion |
| CMML |
Copper Mountain Mine (BC) Ltd. |
| CMMC |
Copper Mountain Mining Corporation |
| CMS |
Copper Mountain Stock |
| ft3 |
Cubic foot |
| m3 |
Cubic metre |
| m3/h |
Cubic metre per hour |
| d |
Day |
| dwt |
Dead-weight tonne |
| °C |
Degree Celsius |
| DFR |
Direct Flotation Reactor |
| dmt |
Dry metric tonne |
| EGL |
Effective grinding length |
| EM |
Electromagnetic |
| EL |
Elevation |
| ELUP |
End Land Use Plan |
| EP |
Engineering and Procurement |
| Envirogreen |
Envirogreen Technologies Ltd. |
| EA |
Environmental Assessment |
| EAC |
Environmental Assessment Certificate |
| EAO |
Environmental Assessment Office |
| EEM |
Environmental Effects Monitoring |
| EMA |
Environmental Management Act |
| EMP |
Environmental Management Plan |
| DFO |
Fisheries and Oceans Canada |
| ft |
Foot |
| FDMP |
Fugitive Dust Management Plan |
| G&A |
General and administrative |
| GPS |
Global Positioning System |
| g/m3 |
Grain per cubic metre |
| g |
Gram |
| g/L |
Gram per litre |
| g/t |
Gram per tonne |
| Granby |
Granby Consolidated Mining, Smelting and Power Company |
| GIS |
Graphical information system |
| GHG |
Greenhouse Gas |
| Hatfield |
Hatfield Consultants LLP |
| ha |
Hectare |
| HCA |
Heritage Conservation Act |
| Hz |
Hertz |
| HPGR |
High Pressure Grinding Roll |
| HGT |
High-grade transition |
| Highway 3 |
Hope-Princeton Highway |
| hp |
Horsepower |
| h |
Hour |
| IAA |
Impact Assessment Act |
| IAAC |
Impact Assessment Agency of Canada |
| IBA |
Impacts and Benefits Agreement |
| IHA |
Interior Health Authority |
| IRR |
Internal Rate of Return |
| IMB |
Iron Mask Batholith |
| IOCG |
Iron-oxide-Copper-Gold |
| JKDW |
JKTech Drop Weight |
| JIC |
Joint Implementation Committee |
| JORC |
Joint Ore Reserves Committee |
| k |
Kilo (thousand) |
| km |
Kilometre |
| km2 |
Kilometre square |
| kW |
Kilowatt |
| kWh |
Kilowatt-hour |
| kWh/t |
Kilowatt-hour per tonne |
| KCB |
Klohn Crippen Berger |
| LG |
Lerchs-Grossmann |
| LOM |
Life of Mine |
| LOM |
Life-of-Mine |
| LOM/SP |
Life-of-Mine Pit and Stockpile |
| LiDAR |
Light Detection and Ranging |
| L |
Litre |
| LSA |
Local Study Area |
| LHIC |
Lost Horse Intrusive Complex |
| LSIB |
Lower Similkameen Indian Band |
| LSIB |
Lower Similkameen Indian Band |
| LGO |
Low-Grade Ore |
| Mag |
Magnetometer |
| MTOs |
Material Take-Offs |
| M&I |
Measured and Indicated |
| MVA |
Megavolt-amperes |
| MW |
Megawatt |
| MWh |
Megawatt-hour |
| MDMER |
Metal and Diamond Mining Effluent Regulations |
| MDMER |
Metal and Diamond Mining Effluent Regulations |
| ML/ARD |
Metal Leaching and Acid Rock Drainage |
| mASL |
Meters above sea level |
| m |
Metre |
| μm |
Micron |
| mm |
Millimetre |
| M |
Million |
| Moz |
Million ounces |
| Mlb/a |
Million pounds per annum |
| Mt/a |
Million tonner per annum |
| MA |
Mines Act |
| EMLI |
Ministry of Energy, Mines and Low Carbon Innovation |
| MEMPR |
Ministry of Energy, Mines and Petroleum Resources |
| ENV |
Ministry of Environment and Climate Change Strategy |
| FOR |
Ministry of Forests |
| MOTI |
Ministry of Transportation and Infrastructure |
| MMC |
Mitsubishi Materials Corp. |
| NI 43-101 |
National Instrument Standards of Disclosure for Mineral Projects |
| NPRI |
National Pollutant Release Inventory |
| NN |
Nearest Neighbor |
| NPV |
Net Present Value |
| NSR |
Net Smelter Return |
| New Gold |
New Gold Inc. |
| Newmont |
Newmont Mining Corporation |
| NAG |
Non-Acid Generating |
| NER |
Non-Economic Rock |
| NERSA |
Non-Economic Rock Storage Area |
| Not-PAG |
Not-Potentially Acid Generating |
| OLTC |
Occupant License to Cut |
| OCP |
Official Community Plans |
| OCM |
Ore Control Model |
| OK |
Ordinary Kriging |
| ORM |
Ore Resource Model |
| oz |
Ounces |
| ppb |
Part per billion |
| ppm |
Part per million |
| PA |
Participation Agreement |
| PPE |
Personal Protective Equipment |
| PAX |
Potassium Amyl Xanthate |
| PAG |
Potentially Acid-Generating |
| lb |
Pound |
| PPP |
Prediction and Prevention Plan |
| PFS |
Prefeasibility Study |
| PEA |
Preliminary Economic Assessment |
| PRF |
Preliminary Field Reconnaissance |
| PGV |
Princeton Group Volcanic |
| PMC |
Process Mineralogical Consulting Services |
| PEP or the Plan |
Project Execution Plan |
| QP |
Qualified Person |
| QA/QC |
Quality Assurance/Quality Control |
| RM |
Radiometric |
| RDOS |
Regional District of Okanagan-Similkameen |
| RL |
Relative elevation |
| ROW |
Right of Way |
| ROM |
Run-Of-Mine |
| SABC |
Semi-Autogenous Ball Mill Crusher |
| SAG |
Semi-Autogenous Grinding |
| SAP |
Site Alteration Permit |
| SARA |
Species at Risk Act |
| ft2 |
Square foot |
| m2 |
Square metre |
| SP |
Stockpile |
| TMF |
Tailings Management Facility |
| Teck |
Teck Resources Limited |
| ECCC |
The Federal Minister of Environment and Climate Change Canada |
| koz |
Thousand ounces |
| kt/d |
Thousand tonnes per day |
| 3-D |
Three-dimensional |
| TSA |
Timber Supply Area |
| t |
Tonne (1,000 kg) |
| t/d |
Tonne per day |
| ts/hm3 |
Tonne second per hour cubic metre |
| t/a |
Tonnes per annum |
| t/m3 |
Tonnes per cubic metre |
| TC |
Transport Canada |
| TC/RCs |
Treatment and Refining Costs |
| oz |
Troy ounce (31.1035 g) |
| US$ |
United States dollar |
| USIB |
Upper Similkameen Indian Band |
| UOMS |
Use and Occupancy Mapping Study |
| VMP |
Vegetation Management Plan |
| VSLT |
Volcanic Siltstone |
| V |
Volt |
| w:o |
Waste:ore |
| WSA |
Water Sustainability Act |
| W |
Watt |
| wt% |
Weight percent |
| wmt |
Wet metric tonne |
| WMMP |
Wildlife Mitigation Management Plan |
| XRF |
X-ray fluorescence |
|
TO:
|
British Columbia Securities Commission
Alberta Securities Commission
Financial and Consumer Affairs Authority of Saskatchewan
The Manitoba Securities Commission
Ontario Securities Commission
Autorité des marchés financiers
New Brunswick Financial and Consumer Services Commission
Nova Scotia Securities Commission
Office of the Superintendent of Securities, Prince Edward Island
Office of the Superintendent of Securities, Service Newfoundland and Labrador
Office of the Superintendent of Securities, Northwest Territories
Office of the Yukon Superintendent of Securities
Nunavut Securities Office
|
Dear Sir/Madam:
Re: Technical Report titled "Copper Mountain Mine NI 43-101 Technical Report, Updated Mineral Resources and Mineral Reserves Estimate, Princeton, British Columbia, Canada" dated December 4, 2023, with an effective date of December 1, 2023
I, Olivier Tavchandjian, consent to the public filing of the technical report titled "Copper Mountain Mine NI 43-101 Technical Report, Updated Mineral Resources and Mineral Reserves Estimate, Princeton, British Columbia, Canada" dated December 4, 2023, with an effective date of December 1, 2023 (the "Technical Report") by Hudbay Minerals Inc. ("Hudbay").
Dated this 4th day of December, 2023
(signed) "Olivier Tavchandjian"
Olivier Tavchandjian P. Geo.
Senior Vice President, Exploration and Technical Services, Hudbay
OLIVIER TAVCHANDJIAN
CERTIFICATE OF QUALIFICATION
Re: Copper Mountain Mine NI 43-101 Technical Report, Updated Mineral Resources and
Mineral Reserves Estimate, Princeton, British Columbia, Canada
I, Olivier Tavchandjian, P.Geo., of Canmore, Alberta, do hereby certify that:
1) I am currently employed as Senior Vice President, Exploration and Technical Services with Hudbay Minerals Inc. (the "Issuer"), 25 York Street, Suite 800, Toronto, Ontario, Canada, M5J 2V5.
2) I graduated from the Université du Québec à Chicoutimi with a Ph.D. in Mineral Resources in 1996.
3) I am a member in good standing with the Association of Professional Geoscientists of Ontario, member number 0714.
4) I have practiced my profession continuously for over 30 years and have been involved in mineral exploration, project evaluation, resource and reserve evaluation, and technical support to mine operations in underground and open pit mines for base metals, precious metals and bulk commodities in the Americas, Europe, Asia, and Africa.
5) I have read the definition of "qualified person" set out in National Instrument 43-101 ("NI 43-101") and certify that by reason of my education and affiliation with a professional association and past relevant work experience, I fulfil the requirements to be a "qualified person" for the purpose of NI 43-101.
6) I am responsible for the preparation of the Technical Report titled "Copper Mountain Mine NI 43-101 Technical Report, Updated Mineral Resources and Mineral Reserves Estimate, Princeton, British Columbia, Canada" (the "Technical Report"), dated December 4, 2023, with an effective date of December 1, 2023.
7) I last visited the Copper Mountain Mine in August 2023 for a duration of approximately 3 days. I also visited the Copper Mountain Mine twice over the last 18 months prior to that date.
8) As of the date of this certificate, to the best of my knowledge, information and belief, the Technical Report contains all scientific and technical information that is required to be disclosed to make the Technical Report not misleading.
9) I am not independent of the Issuer. Since I am an employee of the Issuer, a producing issuer, I fall under subsection 5.3(3) of NI 43-101 where "a technical report required to be filed by a producing issuer is not required to be prepared by or under supervision of an independent qualified person".
10) I have been involved with the Copper Mountain Mine, which is the subject of the Technical Report, continuously since the Issuer's acquisition of the Copper Mountain Mine in June 2023.
11) I have read NI 43-101 and Form 43-101F1, and the Technical Report has been prepared in compliance with NI 43-101 and Form 43-101F1.
12) I consent to the public filing of the Technical Report with any stock exchange, securities commission or other regulatory authority and any publication by them, including electronic publication in the public company files on their websites accessible by the public, of the Technical Report.
* * *
[Signature page follows]
Dated as of the 4th day of December, 2023.
Original signed by:
(signed) "Olivier Tavchandjian"
Olivier Tavchandjian, P.Geo
HudBay Minerals (NYSE:HBM)
Historical Stock Chart
Von Mär 2024 bis Apr 2024

HudBay Minerals (NYSE:HBM)
Historical Stock Chart
Von Apr 2023 bis Apr 2024
