Chart Industries to Present at Bank of America Securities Global Industrials Conference
06 März 2024 - 12:30PM

Chart Industries, Inc. (NYSE: GTLS) (“Chart”), a leading global
solutions provider to clean energy and industrial gas markets, will
present at the Bank of America Global Industrials Conference in
London. President and Chief Executive Officer, Jill Evanko, will
participate in a fireside discussion on Wednesday, March 20th, at
1:05 p.m. GMT.
A live webcast will be available on the company’s website
at: Chart Industries, Inc. | News and Events - Events
and Presentations and a replay of the webcast will be
available following the conclusion of the event.About Chart
Industries, Inc.
Chart Industries, Inc. is an independent global
leader in the design, engineering, and manufacturing of process
technologies and equipment for gas and liquid molecule handling for
the Nexus of Clean™ - clean power, clean water, clean food, and
clean industrials, regardless of molecule. The company’s unique
product and solution portfolio across stationary and rotating
equipment is used in every phase of the liquid gas supply chain,
including engineering, service and repair and from installation to
preventive maintenance and digital monitoring. Chart is a leading
provider of technology, equipment and services related to liquefied
natural gas, hydrogen, biogas and CO2 capture amongst other
applications. Chart is committed to excellence in environmental,
social and corporate governance (ESG) issues both for its company
as well as its customers. With 64 global manufacturing locations
and over 50 service centers from the United States to Asia,
Australia, India, Europe and South America, the company maintains
accountability and transparency to its team members, suppliers,
customers and communities. To learn more, visit
www.chartindustries.com.
Investor Contact:John WalshVP, Investor
Relations770-721-8899john.walsh@chartindustries.com
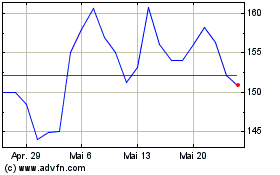
Chart Industries (NYSE:GTLS)
Historical Stock Chart
Von Dez 2024 bis Jan 2025

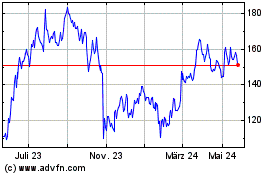
Chart Industries (NYSE:GTLS)
Historical Stock Chart
Von Jan 2024 bis Jan 2025
