More Schwab clients net bought equities than
net sold, adding exposure in the Health Care and Energy sectors
while net selling Information Technology and Communication
Services
The Schwab Trading Activity Index™ (STAX) increased to 51.16 in
December, up from its score of 49.22 in November. The only index of
its kind, the STAX is a proprietary, behavior-based index that
analyzes retail investor stock positions and trading activity from
Schwab’s millions of client accounts to illuminate what investors
were actually doing and how they were positioned in the markets
each month.
This press release features multimedia. View
the full release here:
https://www.businesswire.com/news/home/20250106221369/en/
Schwab Trading Activity Index vs. S&P
500 (Graphic: Charles Schwab)
The reading for the four-week period ending December 27, 2024,
ranks “moderate low” compared to historic averages.
“Schwab clients increased their exposure to equities in
December, even as major indices experienced atypical swings and
turbulence,” said Joe Mazzola, Head Trading & Derivatives
Strategist at Charles Schwab. “We didn’t see a significant ‘Santa
Claus Rally’ this year, but investor sentiment appeared bullish,
particularly at the start and end of the month. Many clients
appeared to close out the year by rebalancing their portfolios,
adding exposure to underperforming sectors such as Health Care and
Energy and trimming positions in outperformers like Information
Technology and Communication Services.”
U.S. equity markets hovered near their recent all-time highs for
the first half of the December period as a muted CBOE Volatility
Index (VIX) traded near 14, belying what was to come.
The U.S. Bureau of Labor Statistics released its Employment
Situation Summary on December 6, which showed that non-farm
payrolls rose by 227,000, more than anticipated, and the
unemployment rate (4.2%) ticked higher, in line with expectations.
The S&P 500’s reaction was muted, trading down slightly the
following day. On December 11, the Consumer Price Index (CPI) came
in as expected at 2.7% for the trailing 12 months, including a 0.3%
monthly increase. On December 12, an increase in the Producer Price
Index (PPI) was reported as unexpectedly hot at 0.4%. Equity
markets largely shrugged this off while the yield on the 10-year
Treasury Note rose by 1.73% to 4.399%.
While the Federal Open Market Committee (FOMC) statement on
December 18 did not suggest a major pivot, the Committee’s 2025
outlook postulated that markets may have fewer interest rate cuts
to look forward to than had been previously expected. This set off
a tantrum that played out in the markets through the remainder of
the period, with major indices selling off hard and the VIX spiking
above 27. The 2.9% drop in the S&P 500 was its largest since
August 5th and represented only the third time the index closed 2%
or lower since February 21st, 2023. The S&P 500 did finish
moderately lower on the month, by about 1%, though it did manage to
finish 24% higher on the year and generate back-to-back years of
annual returns greater than 20% for the first time since 1998.
Once the dust settled after the FOMC meeting, the VIX
established a new, somewhat higher baseline, hovering just below 18
in the final days of the period and the year. The 10-year Treasury
yield closed at 4.619% – a full 10% higher than where it closed
last period – suggesting that markets are pricing in a “higher for
longer” rate regime even as they wait for new trade and tariff
policies to unfold. The U.S. Dollar Index strengthened once again,
rising 2.14% to 108.00. Front month WTI Crude Oil futures rose by
2.74%, ending the period at $70.60 per contract.
Popular names bought by Schwab clients during the period
included:
- NVIDIA Corp. (NVDA)
- Tesla Inc. (TSLA)
- Palantir Technologies Inc. (PLTR)
- Amazon.com Inc. (AMZN)
- MicroStrategy Inc. (MSTR)
Names net sold by Schwab clients during the period included:
- Apple Inc. (AAPL)
- AT&T Inc. (T)
- Broadcom Inc. (AVGO)
- Microsoft Corp. (MSFT)
- Walt Disney Co. (DIS)
2024 In Review
In 2024, the STAX stayed in a relatively tight range – from
44.73 in January to 54.81 in July. Clients seemed content to
maintain their levels of equity market exposure as major indices
repeatedly hit all-time highs throughout the year, perhaps waiting
on a clear trend to develop so they might trade on that momentum.
On the buy side, technologies including Artificial Intelligence,
semiconductors, cloud computing and electric vehicles consistently
grabbed investors’ attention this year, while on the sell side, the
Consumer Discretionary, Telecommunications, Industrial and Energy
sectors were most popular. In a year with dramatic shifts in Fed
policy, clients demonstrated sensitivity not necessarily by
rotating out of growth and into value stocks but rather by awaiting
better opportunities in the growth and technology names they
favored.
The five most popular names net bought by Schwab clients
throughout the year were:
- NVIDIA Corp. (NVDA)
- Advanced Micro Devices Inc. (AMD)
- Amazon.com Inc. (AMZN)
- Microsoft Corp. (MSFT)
- Palantir Technologies Inc. (PLTR)
The five most popular names net sold throughout the year by
clients included:
- Walt Disney Co. (DIS)
- Bank of America Corp. (BAC)
- Apple Inc. (AAPL)
- Tesla Inc. (TSLA)
- PayPal Holdings Inc. (PYPL)
About the STAX
The STAX value is calculated based on a complex proprietary
formula. Each month, Schwab pulls a sample from its client base of
millions of funded accounts, which includes accounts that completed
a trade in the past month. The holdings and positions of this
statistically significant sample are evaluated to calculate
individual scores, and the median of those scores represents the
monthly STAX.
For more information on the Schwab Trading Activity Index,
please visit www.schwab.com/investment-research/stax. Additionally,
Schwab clients can chart the STAX using the symbol $STAX in either
the thinkorswim® or thinkorswim Mobile platforms.
Investing involves risk, including loss of principal. Past
performance is no guarantee of future results. Content intended for
educational/informational purposes only. Not investment advice, or
a recommendation of any security, strategy, or account type.
Historical data should not be used alone when making investment
decisions. Please consult other sources of information and consider
your individual financial position and goals before making an
independent investment decision.
The STAX is not a tradable index. The STAX should not be used as
an indicator or predictor of future client trading volume or
financial performance for Schwab.
About Charles Schwab
At Charles Schwab, we believe in the power of investing to help
individuals create a better tomorrow. We have a history of
challenging the status quo in our industry, innovating in ways that
benefit investors and the advisors and employers who serve them,
and championing our clients’ goals with passion and integrity.
More information is available at aboutschwab.com. Follow us on
X, Facebook, YouTube, and LinkedIn.
0125-ELME
View source
version on businesswire.com: https://www.businesswire.com/news/home/20250106221369/en/
At the Company Margaret Farrell
Director, Corporate Communications (203) 434-2240
margaret.farrell@schwab.com
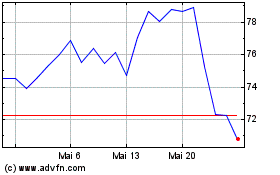
Charles Schwab (NYSE:SCHW)
Historical Stock Chart
Von Dez 2024 bis Jan 2025

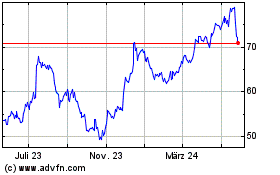
Charles Schwab (NYSE:SCHW)
Historical Stock Chart
Von Jan 2024 bis Jan 2025
