false
0001893448
0001893448
2023-11-09
2023-11-09
iso4217:USD
xbrli:shares
iso4217:USD
xbrli:shares
UNITED
STATES
SECURITIES
AND EXCHANGE COMMISSION
Washington,
D.C. 20549
FORM
8-K
CURRENT
REPORT
PURSUANT
TO SECTION 13 OR 15(d) OF THE SECURITIES EXCHANGE ACT OF 1934
November
9, 2023
Date
of Report (Date of earliest event reported)
STRONG
GLOBAL ENTERTAINMENT, INC.
(Exact
name of registrant as specified in its charter)
| British
Columbia, Canada |
|
001-41688 |
|
N/A |
| (State
or other jurisdiction of |
|
(Commission |
|
(IRS
Employer |
| incorporation
or organization) |
|
File
No.) |
|
Identification
Number) |
| 5960
Fairview Road, Suite 275 |
|
|
| Charlotte,
North Carolina |
|
28210 |
| (Address
of principal executive offices) |
|
(Zip
Code) |
(704)
994-8279
(Registrant’s
telephone number including area code)
N/A
(Former
name or former address, if changed since last report)
Check
the appropriate box below if the Form 8-K filing is intended to simultaneously satisfy the filing obligation of the registrant under
any of the following provisions (see General Instruction A.2. below):
| ☐ |
Written
communications pursuant to Rule 425 under the Securities Act (17 CFR 230.425) |
| |
|
| ☐ |
Soliciting
material pursuant to Rule 14a-12 under the Exchange Act (17 CFR 240.14a-12) |
| |
|
| ☐ |
Pre-commencement
communications pursuant to Rule 14d-2(b) under the Exchange Act (17 CFR 240.14d-2(b)) |
| |
|
| ☐ |
Pre-commencement
communications pursuant to Rule 13e-4(c) under the Exchange Act (17 CFR 240.13e-4(c)) |
Securities
registered pursuant to Section 12(b) of the Act:
| Title
of Each Class |
|
Trading
Symbol(s) |
|
Name
of Each Exchange on Which Registered |
| Class
A Common Voting Shares, without par value |
|
SGE |
|
NYSE
American |
Indicate
by check mark whether the registrant is an emerging growth company as defined in Rule 405 of the Securities Act of 1933 (§230.405
of this chapter) or Rule 12b-2 of the Securities Exchange Act of 1934 (§240.12b-2 of this chapter).
Emerging
growth company ☒
If
an emerging growth company, indicate by check mark if the registrant has elected not to use the extended transition period for complying
with any new or revised financial accounting standards provided pursuant to Section 13(a) of the Exchange Act.
Item
2.02 Results of Operations and Financial Condition
Strong
Global Entertainment, Inc. (the “Company”) issued a press release on November 9, 2023, with earnings information for the
Company’s fiscal quarter ended September 30, 2023. The press release is furnished with this Current Report on Form 8-K (this “Current
Report”) as Exhibit 99.1.
Item
7.01 Regulation FD Disclosure
The
information set forth under Item 2.02 of this Current Report is incorporated herein by reference. In addition, on November 9, 2023, management
of the Company discussed the Company’s financial results for the fiscal quarter ended September 30, 2023, and the Company’s
business plan, strategy and outlook on an earnings conference call with analysts and investors. The supplemental slides referenced
during the conference call are furnished with this Current Report as Exhibit 99.2.
The
information contained in Items 2.02 and 7.01 to this Current Report, including in Exhibits 99.1 and 99.2, is being “furnished”
and, as such, shall not be deemed to be “filed” for the purposes of Section 18 of the Securities Exchange Act of 1934, as
amended (the “Exchange Act”), or otherwise subject to the liabilities of that section, nor shall it be incorporated by reference
into any filing under the Securities Act of 1933, as amended, or the Exchange Act, except as shall be expressly set forth by specific
reference in such filing.
Forward
Looking Statements
In
addition to the historical information in this Current Report and in the exhibits furnished with this Current Report, it includes forward-looking
statements which involve a number of risks and uncertainties, including but not limited to those discussed in the “Risk Factors”
section contained in our final prospectus as filed with the SEC on May 16, 2023 pursuant to Rule 424(b)(5) under the Securities Act,
relating to our Registration Statement on Form S-1, and the following risks and uncertainties: the Company’s ability to maintain
and expand its revenue streams to compensate for the lower demand for the Company’s digital cinema products and installation services;
potential interruptions of supplier relationships or higher prices charged by suppliers; the Company’s ability to successfully
compete and introduce enhancements and new features that achieve market acceptance and that keep pace with technological developments;
the Company’s ability to successfully execute its capital allocation strategy or achieve the returns it expects from these holdings;
the Company’s ability to maintain its brand and reputation and retain or replace its significant customers; challenges associated
with the Company’s long sales cycles; the impact of a challenging global economic environment or a downturn in the markets; the
effects of economic, public health, and political conditions that impact business and consumer confidence and spending, including rising
interest rates, periods of heightened inflation and market instability, the outbreak of any highly infectious or contagious diseases,
such as COVID-19 and its variants or other health epidemics or pandemics, and armed conflicts, such as the ongoing military conflict
in Ukraine and related sanctions; economic and political risks of selling products in foreign countries (including tariffs); risks of
non-compliance with U.S. and foreign laws and regulations, potential sales tax collections and claims for uncollected amounts; cybersecurity
risks and risks of damage and interruptions of information technology systems; the Company’s ability to retain key members of management
and successfully integrate new executives; the Company’s ability to complete acquisitions, strategic investments, entry into new
lines of business, divestitures, mergers or other transactions on acceptable terms, or at all; the impact of economic, public health
and political conditions on the companies in which the Company holds equity stakes; the Company’s ability to utilize or assert
its intellectual property rights, the impact of natural disasters and other catastrophic events, whether natural, man-made, or otherwise
(such as the outbreak of any highly infectious or contagious diseases, or armed conflict); the adequacy of the Company’s insurance;
the impact of having a controlling stockholder and vulnerability to fluctuation in the Company’s stock price. Given the risks and
uncertainties, readers should not place undue reliance on any forward-looking statement and should recognize that the statements are
predictions of future results which may not occur as anticipated. Many of the risks listed above have been, and may further be, exacerbated
by the impact of economic, public health (such as a resurgence of the COVID-19 pandemic) and political conditions (such as the military
conflict in Ukraine) that impact consumer confidence and spending, particularly in the cinema, entertainment, and other industries in
which the Company and its subsidiaries operate, and the worsening economic environment. Actual results could differ materially from those
anticipated in the forward-looking statements and from historical results, due to the risks and uncertainties described herein, as well
as others not now anticipated. New risk factors emerge from time to time and it is not possible for management to predict all such risk
factors, nor can it assess the impact of all such factors on our business or the extent to which any factor, or combination of factors,
may cause actual results to differ materially from those contained in any forward-looking statements. Except where required by law, the
Company assumes no obligation to update forward-looking statements to reflect actual results or changes in factors or assumptions affecting
such forward-looking statements.
Item
9.01. Financial Statements and Exhibits.
(d)
Exhibits.
SIGNATURES
Pursuant
to the requirements of the Securities Exchange Act of 1934, as amended, the registrant has duly caused this report to be signed on its
behalf by the undersigned hereunto duly authorized.
| |
STRONG
GLOBAL ENTERTAINMENT, INC. |
| |
|
|
| Date:
November 13, 2023 |
By: |
/s/
Todd R. Major |
| |
|
Todd
R. Major |
| |
|
Chief
Financial Officer |
Exhibit
99.1

Strong
Global Entertainment Reports Third Quarter 2023 Operating Results
Charlotte,
N.C., – November 9, 2023 – Strong Global Entertainment, Inc. (NYSE American: SGE) (the “Company” or “Strong
Global Entertainment”) today announced operating results for the third quarter ended September 30, 2023.
Operational
Highlights - Quarter and Year-to-Date
| |
● |
Industry
upgrades continue to drive consolidated revenue growth: |
|
○ |
Third
quarter revenue grew 10% and year to date total revenue increased 36% as compared to the same periods of the prior year. |
|
○ |
Third
quarter service revenues increased 32% and year to date service revenues more than doubled as compared to the same periods of the
prior year. |
| |
● |
The
Company expanded its immersive product offerings in the third quarter with the announcement of a new Seismos flooring product line
and securing first commercial installation. |
| |
|
|
| |
● |
Announced
agreement to produce new crime drama series, Endangered, in South Africa. |
| |
|
|
| |
● |
Completed
first two acquisitions following initial public offering (the “IPO”): |
|
○ |
Unbounded
Media Corporation (“Unbounded”), completed in third quarter, which adds production service capabilities to Strong Studios
group; and |
|
○ |
Innovative
Cinema Solutions (“ICS”), completed subsequent to close of third quarter, adding scale to Strong Technical Services group. |
Mark
Roberson, Chief Executive Officer, commented, “We continued to execute on our strategic growth initiatives, growing organically
while also adding scale with the first two acquisitions following our IPO. Our business continues to strengthen as demand for our products
and services increases, and the recent box office success of several summer releases, coupled with more and more people returning to
theaters, is a demonstration of the demand for laser projection and additional enhancements that optimize the viewing experience.”
Mr.
Roberson continued, “We closed two acquisitions over the past two months, adding Unbounded in September and ICS just this week.
These acquisitions are initial steps in a broader growth strategy. We are excited to have both groups join the team as we continue to
expand Strong Global Entertainment.”
Kyle
Cerminara, Chairman of the Board, commented, “We are very excited to see Strong Global Entertainment implementing its growth plans.
We believe that we have a strategy in place and a long-term view of the business that will drive meaningful growth and value for our
shareholders.”
Third
Quarter 2023 Financial Review (Compared to Third Quarter 2022)
| |
● |
Revenue
grew 10.3% to $10.9 million compared to $9.9 million in the third quarter of 2022, as demand from the Company’s cinema customers
continued to strengthen. In addition, Strong Global Entertainment recognized revenue from its first Seismos flooring product line
during the quarter. The Company has been increasing the scope of its services and adding resources to better support its customers
and to increase market share in cinema services. Revenue from installation services increased 68% for the quarter and screen sales
increased 16%. |
Strong Global Entertainment, Inc. – Fiscal Year 2023 Third Quarter 2023 Results | Page 1 to7 |
| |
● |
Gross
profit increased to $2.8 million, or 25.8% of revenues, compared to $2.4 million, or 23.9% of revenue in the third quarter of 2022.
Gross profit from service revenue increased to 21.8% of revenue for the third quarter of 2023 compared to 10.0% of revenues for the
third quarter of 2022. |
| |
|
|
| |
● |
Income
from operations was $0.2 million compared to $0.5 million in the third quarter of 2022, as increased gross profit was offset by increased
selling, general and administrative expenses, including costs of operating as a stand-alone public company. |
| |
|
|
| |
● |
Net
income was breakeven, as compared to $0.7 million or $0.13 per basic and diluted share in the prior year. The reduction in net income
was primarily due to increased selling, general and administrative costs offsetting improved gross margins. |
| |
|
|
| |
● |
Adjusted
Earnings Before Interest, Taxes, Depreciation, and Amortization (“EBITDA”) decreased to $0.5 million as compared to $0.7
million in the prior year, primarily as a result of increased selling, general and administrative expenses in the quarter as the
Company continues to execute on its acquisition strategy. |
Conference
Call
A
conference call to discuss the Company’s 2023 third quarter financial results will be held on Thursday, November 9, 2023, at 4:30
p.m. Eastern Time. Interested parties can listen to the call via live webcast or by phone. To access the webcast, visit the Company’s
website or use the following link: SGE Webcast Link. To access the conference call by phone, dial (877) 545-0320 (domestic)
or (973) 528-0002 (international) and use participant code 375936. Please access the webcast or dial in at least five minutes before
the start of the call to register.
A
replay of the webcast will be available following the conclusion of the live broadcast and accessible on the Company’s website.
About
Strong Global Entertainment, Inc.
Strong
Global Entertainment, Inc., (the “Company”) a subsidiary of FG Group Holdings Inc. (NYSE American: FGH), is a leader
in the entertainment industry, providing mission critical products and services to cinema exhibitors and entertainment venues for over
90 years. The Company manufactures and distributes premium large format projection screens, provides comprehensive managed services,
technical support and related products and services primarily to cinema exhibitors, theme parks, educational institutions, and similar
venues. In addition to traditional projection screens, the Company manufactures and distributes its Eclipse curvilinear screens, which
are specially designed for theme parks, immersive exhibitions, as well as simulation applications. It also provides maintenance, repair,
installation, network support services and other services to cinema operators, primarily in the United States. The Company also owns
Strong Studios, Inc., which develops and produces original feature films and television series.
About
Fundamental Global®
Fundamental
Global® is a private partnership focused on long-term strategic holdings. Fundamental Global® was co-founded
by former T. Rowe Price, Point72 and Tiger Cub portfolio manager Kyle Cerminara and former Chairman and CEO of TD Ameritrade, Joe Moglia.
Its current holdings include FG Financial Group Inc., FG Group Holdings Inc., BK Technologies Corp., GreenFirst Forest Products, Inc.,
iCoreConnect, Inc., FG Acquisition Corp., OppFi Inc., Hagerty Inc., and FG Communities, Inc.
The
FG® logo is a registered trademark of Fundamental Global®.
Use
of Non-GAAP Measures
Strong
Global Entertainment, Inc. prepares its consolidated financial statements in accordance with United States generally accepted accounting
principles (“GAAP”). In addition to disclosing financial results prepared in accordance with GAAP, the Company discloses
information regarding Adjusted EBITDA (“Adjusted EBITDA”), which differs from the commonly used EBITDA (“EBITDA”).
Adjusted EBITDA both adjusts net income (loss) to exclude income taxes, interest, and depreciation and amortization, and excludes share-based
compensation, impairment charges, severance, foreign currency transaction gains (losses), transactional gains and expenses, gains on
insurance recoveries, and other cash and non-cash charges and gains.
Strong Global Entertainment, Inc. – Fiscal Year 2023 Third Quarter 2023 Results | Page 2 to7 |
EBITDA
and Adjusted EBITDA are not measures of performance defined in accordance with GAAP. However, Adjusted EBITDA is used internally in planning
and evaluating the Company’s operating performance. Accordingly, management believes that disclosure of these metrics offers investors,
bankers and other stakeholders an additional view of the Company’s operations that, when coupled with the GAAP results, provides
a more complete understanding of the Company’s financial results.
EBITDA
and Adjusted EBITDA should not be considered as an alternative to net income (loss) or to net cash from operating activities as measures
of operating results or liquidity. The Company’s calculation of EBITDA and Adjusted EBITDA may not be comparable to similarly titled
measures used by other companies, and the measures exclude financial information that some may consider important in evaluating the Company’s
performance.
EBITDA
and Adjusted EBITDA have limitations as analytical tools, and you should not consider them in isolation, or as substitutes for analysis
of the Company’s results as reported under GAAP. Some of these limitations are: (i) they do not reflect the Company’s cash
expenditures, or future requirements for capital expenditures or contractual commitments, (ii) they do not reflect changes in, or cash
requirements for, the Company’s working capital needs, (iii) EBITDA and Adjusted EBITDA do not reflect interest expense, or the
cash requirements necessary to service interest or principal payments, on the Company’s debt, (iv) although depreciation and amortization
are non-cash charges, the assets being depreciated and amortized will often have to be replaced in the future, and EBITDA and Adjusted
EBITDA do not reflect any cash requirements for such replacements, (v) they do not adjust for all non-cash income or expense items that
are reflected in the Company’s statements of cash flows, (vi) they do not reflect the impact of earnings or charges resulting from
matters management considers not to be indicative of the Company’s ongoing operations, and (vii) other companies in the Company’s
industry may calculate these measures differently than the Company does, limiting their usefulness as comparative measures.
Management
believes EBITDA and Adjusted EBITDA facilitate operating performance comparisons from period to period by isolating the effects of some
items that vary from period to period without any correlation to core operating performance or that vary widely among similar companies.
These potential differences may be caused by variations in capital structures (affecting interest expense), tax positions (such as the
impact on periods or companies of changes in effective tax rates or net operating losses) and the age and book depreciation of facilities
and equipment (affecting relative depreciation expense). The Company also presents EBITDA and Adjusted EBITDA because (i) management
believes these measures are frequently used by securities analysts, investors and other interested parties to evaluate companies in the
Company’s industry, (ii) management believes investors will find these measures useful in assessing the Company’s ability
to service or incur indebtedness, and (iii) management uses EBITDA and Adjusted EBITDA internally as benchmarks to evaluate the Company’s
operating performance or compare the Company’s performance to that of its competitors.
Forward-Looking
Statements
In
addition to the historical information included herein, this press release contains “forward-looking statements” that are
subject to substantial risks and uncertainties. All statements, other than statements of historical fact, contained in this press release
are forward-looking statements. Forward-looking statements contained in this press release may be identified by the use of words such
as “anticipate,” “believe,” “contemplate,” “could,” “estimate,” “expect,”
“intend,” “seek,” “may,” “might,” “plan,” “potential,” “predict,”
“project,” “target,” “aim,” “should,” “will” “would,” or the
negative of these words or other similar expressions, although not all forward-looking statements contain these words. Forward-looking
statements are based on the Company’s current expectations and are subject to inherent uncertainties, risks and assumptions that
are difficult to predict. Further, certain forward-looking statements are based on assumptions as to future events that may not prove
to be accurate. These and other risks and uncertainties are described more fully in the section titled “Risk Factors” in
the final prospectus related to the public offering filed with the SEC. Forward-looking statements contained in this announcement are
made as of this date, and the Company undertakes no duty to update such information except as required under applicable law.
Investor
Relations Contacts:
Mark
Roberson
Strong
Global Entertainment, Inc. - Chief Executive Officer
(704)
471-6784
IR@strong-entertainment.com
John
Nesbett/Jennifer Belodeau
IMS
Investor Relations
(203)
972-9200
sge@imsinvestorrelations.com
Strong Global Entertainment, Inc. – Fiscal Year 2023 Third Quarter 2023 Results | Page 3 to7 |
Strong
Global Entertainment, Inc. and Subsidiaries
Condensed
Consolidated Balance Sheets
(In
thousands)
(Unaudited)
| | |
September 30, 2023 | | |
December 31, 2022 | |
| Assets | |
| | | |
| | |
| Current assets: | |
| | | |
| | |
| Cash and cash equivalents | |
$ | 3,110 | | |
$ | 3,615 | |
| Accounts receivable, net | |
| 7,443 | | |
| 6,148 | |
| Inventories, net | |
| 3,597 | | |
| 3,389 | |
| Other current assets | |
| 1,337 | | |
| 4,547 | |
| Total current assets | |
| 15,487 | | |
| 17,699 | |
| Property, plant and equipment, net | |
| 1,522 | | |
| 4,607 | |
| Operating lease right-of-use assets | |
| 4,695 | | |
| 237 | |
| Finance lease right-of-use asset | |
| 1,004 | | |
| 606 | |
| Film and television programming rights, net | |
| 8,205 | | |
| 1,501 | |
| Intangible assets, net | |
| - | | |
| 6 | |
| Goodwill | |
| 2,049 | | |
| 882 | |
| Total assets | |
$ | 32,962 | | |
$ | 25,538 | |
| | |
| | | |
| | |
| Liabilities and Stockholders’ Equity | |
| | | |
| | |
| Current liabilities: | |
| | | |
| | |
| Accounts payable | |
$ | 3,576 | | |
$ | 4,106 | |
| Accrued expenses | |
| 7,326 | | |
| 4,486 | |
| Payable to FG Group Holdings Inc. | |
| 1,818 | | |
| 1,861 | |
| Short-term debt | |
| 2,777 | | |
| 2,510 | |
| Current portion of long-term debt | |
| 37 | | |
| 36 | |
| Current portion of operating lease obligations | |
| 278 | | |
| 64 | |
| Current portion of finance lease obligations | |
| 203 | | |
| 105 | |
| Deferred revenue and customer deposits | |
| 1,515 | | |
| 1,769 | |
| Total current liabilities | |
| 17,530 | | |
| 14,937 | |
| Operating lease obligations, net of current portion | |
| 4,478 | | |
| 234 | |
| Finance lease obligations, net of current portion | |
| 814 | | |
| 502 | |
| Long-term debt, net of current portion | |
| 169 | | |
| 126 | |
| Deferred income taxes | |
| 120 | | |
| 529 | |
| Other long-term liabilities | |
| 525 | | |
| 6 | |
| Total liabilities | |
| 23,636 | | |
| 16,334 | |
| | |
| | | |
| | |
| Equity: | |
| | | |
| | |
| Common stock, no par value | |
| - | | |
| - | |
| Additional paid-in-capital | |
| 15,589 | | |
| - | |
| Accumulated deficit | |
| (807 | ) | |
| - | |
| Accumulated other comprehensive loss | |
| (5,456 | ) | |
| (5,024 | ) |
| Net parent investment | |
| - | | |
| 14,228 | |
| Total equity | |
| 9,326 | | |
| 9,204 | |
| Total liabilities and equity | |
$ | 32,962 | | |
$ | 25,538 | |
Strong Global Entertainment, Inc. – Fiscal Year 2023 Third Quarter 2023 Results | Page 4 to7 |
Strong
Global Entertainment, Inc. and Subsidiaries
Condensed
Consolidated Statements of Operations
(In
thousands, except per share data)
(Unaudited)
| | |
Three Months Ended September 30, | | |
Nine Months Ended September 30, | |
| | |
2023 | | |
2022 | | |
2023 | | |
2022 | |
| Net product sales | |
$ | 7,994 | | |
$ | 7,690 | | |
$ | 23,609 | | |
$ | 22,076 | |
| Net service revenues | |
| 2,926 | | |
| 2,213 | | |
| 15,100 | | |
| 6,370 | |
| Total net revenues | |
| 10,920 | | |
| 9,903 | | |
| 38,709 | | |
| 28,446 | |
| Total cost of products | |
| 5,809 | | |
| 5,541 | | |
| 17,579 | | |
| 16,233 | |
| Total cost of services | |
| 2,289 | | |
| 1,991 | | |
| 8,779 | | |
| 5,538 | |
| Total cost of revenues | |
| 8,098 | | |
| 7,532 | | |
| 26,358 | | |
| 21,771 | |
| Gross profit | |
| 2,822 | | |
| 2,371 | | |
| 12,351 | | |
| 6,675 | |
| Selling and administrative expenses: | |
| | | |
| | | |
| | | |
| | |
| Selling | |
| 500 | | |
| 498 | | |
| 1,652 | | |
| 1,723 | |
| Administrative | |
| 2,139 | | |
| 1,368 | | |
| 9,983 | | |
| 4,138 | |
| Total selling and administrative expenses | |
| 2,639 | | |
| 1,866 | | |
| 11,635 | | |
| 5,861 | |
| Gain on disposal of assets | |
| - | | |
| - | | |
| 1 | | |
| - | |
| Income from operations | |
| 183 | | |
| 505 | | |
| 717 | | |
| 814 | |
| Other (expense) income: | |
| | | |
| | | |
| | | |
| | |
| Interest expense, net | |
| (88 | ) | |
| (31 | ) | |
| (206 | ) | |
| (82 | ) |
| Foreign currency transaction gain (loss) | |
| 126 | | |
| 518 | | |
| (183 | ) | |
| 646 | |
| Other income, net | |
| 18 | | |
| 11 | | |
| 16 | | |
| 15 | |
| Total other income (expense) | |
| 56 | | |
| 498 | | |
| (373 | ) | |
| 579 | |
| Income before income taxes | |
| 239 | | |
| 1,003 | | |
| 344 | | |
| 1,393 | |
| Income tax expense | |
| (205 | ) | |
| (233 | ) | |
| (349 | ) | |
| (417 | ) |
| Net income (loss) | |
$ | 34 | | |
$ | 770 | | |
$ | (5 | ) | |
$ | 976 | |
| | |
| | | |
| | | |
| | | |
| | |
| Net income (loss) per share: | |
| | | |
| | | |
| | | |
| | |
| Basic | |
$ | 0.00 | | |
$ | 0.13 | | |
$ | 0.00 | | |
$ | 0.16 | |
| Diluted | |
$ | 0.00 | | |
$ | 0.13 | | |
$ | 0.00 | | |
$ | 0.16 | |
Strong Global Entertainment, Inc. – Fiscal Year 2023 Third Quarter 2023 Results | Page 5 to7 |
Strong
Global Entertainment, Inc. and Subsidiaries
Condensed
Consolidated Statements of Cash Flows
(In
thousands)
(Unaudited)
| | |
Nine Months Ended September 30, | |
| | |
2023 | | |
2022 | |
| Cash flows from operating activities: | |
| | | |
| | |
| Net (loss) income | |
$ | (5 | ) | |
$ | 976 | |
| Adjustments to reconcile net income to net cash used in operating activities: | |
| | | |
| | |
| (Recovery of) provision for doubtful accounts | |
| (32 | ) | |
| 10 | |
| Benefit from obsolete inventory | |
| (47 | ) | |
| - | |
| Provision for warranty | |
| 131 | | |
| 9 | |
| Depreciation and amortization | |
| 2,438 | | |
| 521 | |
| Amortization and accretion of operating leases | |
| 48 | | |
| 52 | |
| Deferred income taxes | |
| (430 | ) | |
| (116 | ) |
| Stock-based compensation expense | |
| 890 | | |
| 97 | |
| Changes in operating assets and liabilities: | |
| | | |
| | |
| Accounts receivable | |
| (1,223 | ) | |
| (395 | ) |
| Inventories | |
| (158 | ) | |
| (556 | ) |
| Current income taxes | |
| 154 | | |
| 503 | |
| Other assets | |
| (7,864 | ) | |
| 1,133 | |
| Accounts payable and accrued expenses | |
| 5,549 | | |
| (3,572 | ) |
| Deferred revenue and customer deposits | |
| (257 | ) | |
| (420 | ) |
| Operating lease obligations | |
| (57 | ) | |
| (50 | ) |
| Net cash used in operating activities | |
| (863 | ) | |
| (1,808 | ) |
| | |
| | | |
| | |
| Cash flows from investing activities: | |
| | | |
| | |
| Capital expenditures | |
| (288 | ) | |
| (197 | ) |
| Acquisition of programming rights | |
| (511 | ) | |
| (407 | ) |
| Net cash used in investing activities | |
| (799 | ) | |
| (604 | ) |
| | |
| | | |
| | |
| Cash flows from financing activities: | |
| | | |
| | |
| Principal payments on short-term debt | |
| (358 | ) | |
| (228 | ) |
| Principal payments on long-term debt | |
| (27 | ) | |
| (20 | ) |
| Borrowings under credit facility | |
| 6,790 | | |
| - | |
| Repayments under credit facility | |
| (4,483 | ) | |
| - | |
| Payments on finance lease obligations | |
| (99 | ) | |
| - | |
| Proceeds from initial public offering | |
| 2,411 | | |
| - | |
| Payments of withholding taxes for net share settlement of equity awards | |
| (117 | ) | |
| - | |
| Net cash transferred (to) from parent | |
| (3,001 | ) | |
| 1,285 | |
| Net cash provided by financing activities | |
| 1,116 | | |
| 1,037 | |
| | |
| | | |
| | |
| Effect of exchange rate changes on cash and cash equivalents | |
| 41 | | |
| 70 | |
| Net decrease in cash and cash equivalents and restricted cash | |
| (505 | ) | |
| (1,305 | ) |
| Cash and cash equivalents and restricted cash at beginning of period | |
| 3,615 | | |
| 4,494 | |
| Cash and cash equivalents and restricted cash at end of period | |
$ | 3,110 | | |
$ | 3,189 | |
Strong Global Entertainment, Inc. – Fiscal Year 2023 Third Quarter 2023 Results | Page 6 to7 |
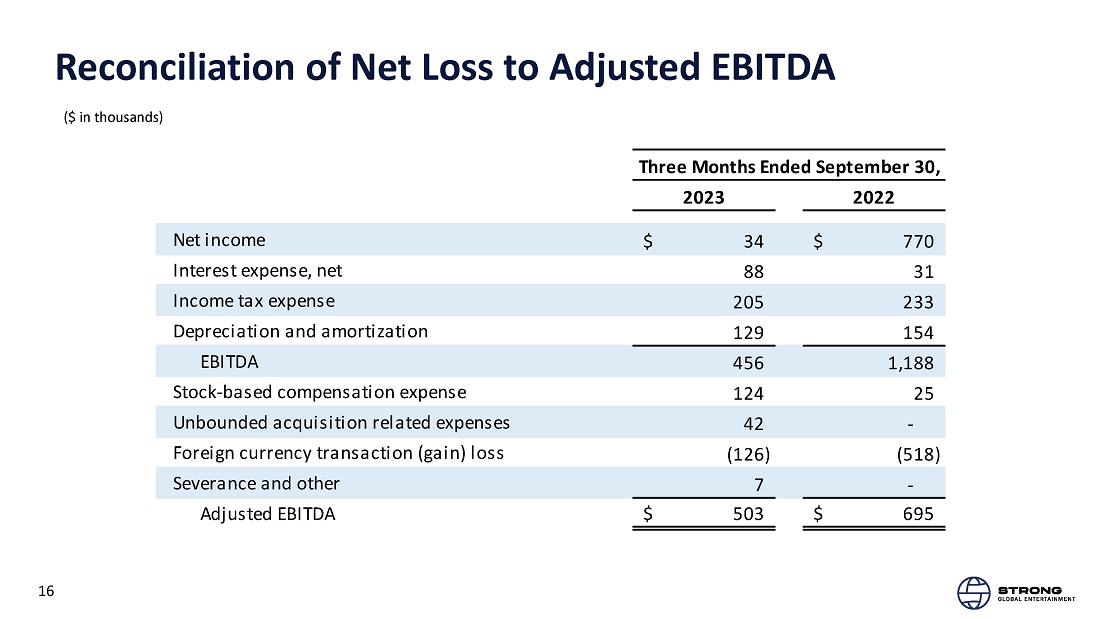
Strong
Global Entertainment, Inc. and Subsidiaries
Reconciliation
of Net Income (Loss) to Adjusted EBITDA
(In
thousands)
(Unaudited)
| | |
Three Months Ended September 30, | | |
Nine Months Ended September 30, | |
| | |
2023 | | |
2022 | | |
2023 | | |
2022 | |
| | |
| | |
| | |
| | |
| |
| Net income (loss) | |
$ | 34 | | |
$ | 770 | | |
$ | (5 | ) | |
$ | 976 | |
| Interest expense, net | |
| 88 | | |
| 31 | | |
| 206 | | |
| 82 | |
| Income tax expense | |
| 205 | | |
| 233 | | |
| 349 | | |
| 417 | |
| Depreciation and amortization | |
| 129 | | |
| 154 | | |
| 2,438 | | |
| 521 | |
| EBITDA | |
| 456 | | |
| 1,188 | | |
| 2,988 | | |
| 1,996 | |
| Stock-based compensation expense | |
| 124 | | |
| 25 | | |
| 890 | | |
| 97 | |
| IPO related expenses | |
| - | | |
| - | | |
| 475 | | |
| - | |
| Unbounded acquisition related expenses | |
| 42 | | |
| - | | |
| 42 | | |
| - | |
| Foreign currency transaction (gain) loss | |
| (126 | ) | |
| (518 | ) | |
| 183 | | |
| (646 | ) |
| Severance and other | |
| 7 | | |
| - | | |
| 7 | | |
| - | |
| Adjusted EBITDA | |
$ | 503 | | |
$ | 695 | | |
$ | 4,585 | | |
$ | 1,447 | |
Exhibit 99.2


v3.23.3
Cover
|
Nov. 09, 2023 |
| Cover [Abstract] |
|
| Document Type |
8-K
|
| Amendment Flag |
false
|
| Document Period End Date |
Nov. 09, 2023
|
| Entity File Number |
001-41688
|
| Entity Registrant Name |
STRONG
GLOBAL ENTERTAINMENT, INC.
|
| Entity Central Index Key |
0001893448
|
| Entity Incorporation, State or Country Code |
A1
|
| Entity Address, Address Line One |
5960
Fairview Road
|
| Entity Address, Address Line Two |
Suite 275
|
| Entity Address, City or Town |
Charlotte
|
| Entity Address, State or Province |
NC
|
| Entity Address, Postal Zip Code |
28210
|
| City Area Code |
(704)
|
| Local Phone Number |
994-8279
|
| Written Communications |
false
|
| Soliciting Material |
false
|
| Pre-commencement Tender Offer |
false
|
| Pre-commencement Issuer Tender Offer |
false
|
| Title of 12(b) Security |
Class
A Common Voting Shares, without par value
|
| Trading Symbol |
SGE
|
| Security Exchange Name |
NYSEAMER
|
| Entity Emerging Growth Company |
true
|
| Elected Not To Use the Extended Transition Period |
false
|
| X |
- DefinitionBoolean flag that is true when the XBRL content amends previously-filed or accepted submission.
| Name: |
dei_AmendmentFlag |
| Namespace Prefix: |
dei_ |
| Data Type: |
xbrli:booleanItemType |
| Balance Type: |
na |
| Period Type: |
duration |
|
| X |
- DefinitionFor the EDGAR submission types of Form 8-K: the date of the report, the date of the earliest event reported; for the EDGAR submission types of Form N-1A: the filing date; for all other submission types: the end of the reporting or transition period. The format of the date is YYYY-MM-DD.
| Name: |
dei_DocumentPeriodEndDate |
| Namespace Prefix: |
dei_ |
| Data Type: |
xbrli:dateItemType |
| Balance Type: |
na |
| Period Type: |
duration |
|
| X |
- DefinitionThe type of document being provided (such as 10-K, 10-Q, 485BPOS, etc). The document type is limited to the same value as the supporting SEC submission type, or the word 'Other'.
| Name: |
dei_DocumentType |
| Namespace Prefix: |
dei_ |
| Data Type: |
dei:submissionTypeItemType |
| Balance Type: |
na |
| Period Type: |
duration |
|
| X |
- DefinitionAddress Line 1 such as Attn, Building Name, Street Name
| Name: |
dei_EntityAddressAddressLine1 |
| Namespace Prefix: |
dei_ |
| Data Type: |
xbrli:normalizedStringItemType |
| Balance Type: |
na |
| Period Type: |
duration |
|
| X |
- DefinitionAddress Line 2 such as Street or Suite number
| Name: |
dei_EntityAddressAddressLine2 |
| Namespace Prefix: |
dei_ |
| Data Type: |
xbrli:normalizedStringItemType |
| Balance Type: |
na |
| Period Type: |
duration |
|
| X |
- Definition
+ References
+ Details
| Name: |
dei_EntityAddressCityOrTown |
| Namespace Prefix: |
dei_ |
| Data Type: |
xbrli:normalizedStringItemType |
| Balance Type: |
na |
| Period Type: |
duration |
|
| X |
- DefinitionCode for the postal or zip code
| Name: |
dei_EntityAddressPostalZipCode |
| Namespace Prefix: |
dei_ |
| Data Type: |
xbrli:normalizedStringItemType |
| Balance Type: |
na |
| Period Type: |
duration |
|
| X |
- DefinitionName of the state or province.
| Name: |
dei_EntityAddressStateOrProvince |
| Namespace Prefix: |
dei_ |
| Data Type: |
dei:stateOrProvinceItemType |
| Balance Type: |
na |
| Period Type: |
duration |
|
| X |
- DefinitionA unique 10-digit SEC-issued value to identify entities that have filed disclosures with the SEC. It is commonly abbreviated as CIK. Reference 1: http://www.xbrl.org/2003/role/presentationRef
-Publisher SEC
-Name Exchange Act
-Number 240
-Section 12
-Subsection b-2
| Name: |
dei_EntityCentralIndexKey |
| Namespace Prefix: |
dei_ |
| Data Type: |
dei:centralIndexKeyItemType |
| Balance Type: |
na |
| Period Type: |
duration |
|
| X |
- DefinitionIndicate if registrant meets the emerging growth company criteria. Reference 1: http://www.xbrl.org/2003/role/presentationRef
-Publisher SEC
-Name Exchange Act
-Number 240
-Section 12
-Subsection b-2
| Name: |
dei_EntityEmergingGrowthCompany |
| Namespace Prefix: |
dei_ |
| Data Type: |
xbrli:booleanItemType |
| Balance Type: |
na |
| Period Type: |
duration |
|
| X |
- DefinitionCommission file number. The field allows up to 17 characters. The prefix may contain 1-3 digits, the sequence number may contain 1-8 digits, the optional suffix may contain 1-4 characters, and the fields are separated with a hyphen.
| Name: |
dei_EntityFileNumber |
| Namespace Prefix: |
dei_ |
| Data Type: |
dei:fileNumberItemType |
| Balance Type: |
na |
| Period Type: |
duration |
|
| X |
- DefinitionTwo-character EDGAR code representing the state or country of incorporation.
| Name: |
dei_EntityIncorporationStateCountryCode |
| Namespace Prefix: |
dei_ |
| Data Type: |
dei:edgarStateCountryItemType |
| Balance Type: |
na |
| Period Type: |
duration |
|
| X |
- DefinitionThe exact name of the entity filing the report as specified in its charter, which is required by forms filed with the SEC. Reference 1: http://www.xbrl.org/2003/role/presentationRef
-Publisher SEC
-Name Exchange Act
-Number 240
-Section 12
-Subsection b-2
| Name: |
dei_EntityRegistrantName |
| Namespace Prefix: |
dei_ |
| Data Type: |
xbrli:normalizedStringItemType |
| Balance Type: |
na |
| Period Type: |
duration |
|
| X |
- DefinitionLocal phone number for entity.
| Name: |
dei_LocalPhoneNumber |
| Namespace Prefix: |
dei_ |
| Data Type: |
xbrli:normalizedStringItemType |
| Balance Type: |
na |
| Period Type: |
duration |
|
| X |
- DefinitionBoolean flag that is true when the Form 8-K filing is intended to satisfy the filing obligation of the registrant as pre-commencement communications pursuant to Rule 13e-4(c) under the Exchange Act. Reference 1: http://www.xbrl.org/2003/role/presentationRef
-Publisher SEC
-Name Exchange Act
-Number 240
-Section 13e
-Subsection 4c
| Name: |
dei_PreCommencementIssuerTenderOffer |
| Namespace Prefix: |
dei_ |
| Data Type: |
xbrli:booleanItemType |
| Balance Type: |
na |
| Period Type: |
duration |
|
| X |
- DefinitionBoolean flag that is true when the Form 8-K filing is intended to satisfy the filing obligation of the registrant as pre-commencement communications pursuant to Rule 14d-2(b) under the Exchange Act. Reference 1: http://www.xbrl.org/2003/role/presentationRef
-Publisher SEC
-Name Exchange Act
-Number 240
-Section 14d
-Subsection 2b
| Name: |
dei_PreCommencementTenderOffer |
| Namespace Prefix: |
dei_ |
| Data Type: |
xbrli:booleanItemType |
| Balance Type: |
na |
| Period Type: |
duration |
|
| X |
- DefinitionTitle of a 12(b) registered security. Reference 1: http://www.xbrl.org/2003/role/presentationRef
-Publisher SEC
-Name Exchange Act
-Number 240
-Section 12
-Subsection b
| Name: |
dei_Security12bTitle |
| Namespace Prefix: |
dei_ |
| Data Type: |
dei:securityTitleItemType |
| Balance Type: |
na |
| Period Type: |
duration |
|
| X |
- DefinitionName of the Exchange on which a security is registered. Reference 1: http://www.xbrl.org/2003/role/presentationRef
-Publisher SEC
-Name Exchange Act
-Number 240
-Section 12
-Subsection d1-1
| Name: |
dei_SecurityExchangeName |
| Namespace Prefix: |
dei_ |
| Data Type: |
dei:edgarExchangeCodeItemType |
| Balance Type: |
na |
| Period Type: |
duration |
|
| X |
- DefinitionBoolean flag that is true when the Form 8-K filing is intended to satisfy the filing obligation of the registrant as soliciting material pursuant to Rule 14a-12 under the Exchange Act. Reference 1: http://www.xbrl.org/2003/role/presentationRef
-Publisher SEC
-Name Exchange Act
-Section 14a
-Number 240
-Subsection 12
| Name: |
dei_SolicitingMaterial |
| Namespace Prefix: |
dei_ |
| Data Type: |
xbrli:booleanItemType |
| Balance Type: |
na |
| Period Type: |
duration |
|
| X |
- DefinitionTrading symbol of an instrument as listed on an exchange.
| Name: |
dei_TradingSymbol |
| Namespace Prefix: |
dei_ |
| Data Type: |
dei:tradingSymbolItemType |
| Balance Type: |
na |
| Period Type: |
duration |
|
| X |
- DefinitionBoolean flag that is true when the Form 8-K filing is intended to satisfy the filing obligation of the registrant as written communications pursuant to Rule 425 under the Securities Act. Reference 1: http://www.xbrl.org/2003/role/presentationRef
-Publisher SEC
-Name Securities Act
-Number 230
-Section 425
| Name: |
dei_WrittenCommunications |
| Namespace Prefix: |
dei_ |
| Data Type: |
xbrli:booleanItemType |
| Balance Type: |
na |
| Period Type: |
duration |
|
Strong Global Entertainm... (AMEX:SGE)
Historical Stock Chart
Von Apr 2024 bis Mai 2024

Strong Global Entertainm... (AMEX:SGE)
Historical Stock Chart
Von Mai 2023 bis Mai 2024
