SECURITIES AND EXCHANGE COMMISSION
WASHINGTON, D.C. 20549
Amendment
No. 1
to
SCHEDULE 13E-3
TRANSACTION STATEMENT UNDER SECTION 13(e) OF THE
SECURITIES EXCHANGE ACT OF 1934 AND
RULE 13e-3 THEREUNDER
Rule 13e-3 Transaction Statement
Under Section 13(e) of the Securities Exchange Act of 1934
HOLLY ENERGY PARTNERS, L.P.
(Name of the Issuer)
Holly Energy
Partners, L.P.
HF Sinclair Corporation
Navajo Pipeline Co., L.P.
Holly Apple Holdings LLC
Holly Logistic Services, L.L.C.
HEP Logistics Holdings, L.P.
(Names of Persons Filing Statement)
Common Units
(Title of
Class of Securities)
435763 10 7
(CUSIP Number of Class of Securities)
|
|
|
| Vaishali S. Bhatia
Executive Vice President, General Counsel and
Secretary HF Sinclair
Corporation 2828 N. Harwood St., Suite 1300
Dallas, Texas 75201 (214)
871-3555 |
|
Vaishali S. Bhatia
Executive Vice President, General Counsel and
Secretary Holly Energy
Partners, L.P. 2828 N. Harwood St., Suite 1300
Dallas, Texas 75201 (214)
871-3555 |
(Name, Address, and Telephone Numbers of Person Authorized to Receive Notices and Communications on Behalf of
the Persons Filing Statement)
With copies to
|
|
|
| Katherine Terrell Frank
E. Ramey Layne
Vinson & Elkins L.L.P.
Trammell Crow Center 2001
Ross Avenue, Suite 3900 Dallas, Texas 75201
(214) 220-7700 |
|
Hillary H. Holmes
Tull R. Florey Gibson,
Dunn & Crutcher LLP 811 Main Street, Suite 3000
Houston, Texas 77002
(346) 718-6600 |
This statement is filed in connection with (check the appropriate box):
|
|
|
|
|
| a. |
|
☒ |
|
The filing of solicitation materials or an information statement subject to Regulation 14A, Regulation 14C or Rule 13e-3(c) under the Securities Exchange Act of 1934. |
|
|
|
| b. |
|
☒ |
|
The filing of a registration statement under the Securities Act of 1933. |
|
|
|
| c. |
|
☐ |
|
A tender offer. |
|
|
|
| d. |
|
☐ |
|
None of the above. |
Check the following box if the soliciting materials or information statement referred to in checking box (a) are
preliminary copies: ☒
Check the following box if the filing is a final amendment reporting the results of the transaction: ☐
Neither the SEC nor any state securities regulatory agency has approved or disapproved the Merger, passed upon the merits or fairness of the Merger or
passed upon the adequacy or accuracy of the disclosure in this document. Any representation to the contrary is a criminal offense.
INTRODUCTION
This Amendment No. 1 to the Rule 13e-3 Transaction Statement on
Schedule 13E-3 (as originally filed on September 22, 2023, and together with the exhibits hereto and thereto, this “Amended Transaction Statement”), is being filed with the U.S. Securities
and Exchange Commission (the “SEC”) pursuant to Section 13(e) of the Securities Exchange Act of 1934, as amended (the “Exchange Act”), by: (i) Holly Energy Partners, L.P., a Delaware limited partnership
(“HEP”) and the issuer of the common units representing limited partner interests in HEP (“HEP Common Units,” and the holders of HEP Common Units, the “HEP Unitholders”) that are subject to the Rule 13e-3 transaction; (ii) HF Sinclair Corporation, a Delaware corporation (“HF Sinclair”); (iii) Navajo Pipeline Co., L.P., a Delaware limited partnership and an indirect wholly owned subsidiary of HF
Sinclair (“HoldCo”); (iv) Holly Logistic Services, L.L.C., a Delaware limited liability company, the general partner (the “General Partner”) of HEP Logistics Holdings, L.P. (“HLH”); (v) HLH, a Delaware limited
partnership and the general partner of HEP; and (vi) Holly Apple Holdings LLC, a wholly owned subsidiary of HoldCo (“Merger Sub”). Collectively, the persons filing this Amended Transaction Statement are referred to as the “filing
persons.”
This Amended Transaction Statement relates to the Agreement and Plan of Merger, dated as of August 15, 2023 (as the same may be
amended or supplemented from time to time, the “Merger Agreement”), by and among HF Sinclair, HEP, HoldCo, the General Partner, HLH and Merger Sub, pursuant to which Merger Sub will merge with and into HEP, with HEP surviving as an
indirect, wholly owned subsidiary of HF Sinclair (the “Merger”).
Under the terms of the Merger Agreement, at the effective time of the
Merger, each outstanding HEP Common Unit other than the HEP Common Units owned by HF Sinclair, HoldCo, HLH, the General Partner and their respective affiliates, will be converted into the right to receive (i) 0.315 (the “Exchange Ratio”)
shares of common stock, par value $0.01 per share, of HF Sinclair (the “HF Sinclair Common Stock” and such issuance, the “HF Sinclair Stock Issuance”) and (ii) $4.00 in cash, without interest (the “Cash Consideration”
and, together with the shares of HF Sinclair Common Stock to be issued in the Merger, the “Merger Consideration”). The receipt of Merger Consideration in exchange for HEP Common Units held by the HEP Unitholders other than HF Sinclair and
its subsidiaries pursuant to the Merger will be a taxable transaction to U.S. Holders. See “United States Federal Income Tax Consequences” in the Joint Proxy Statement/Prospectus (as defined below).
The Merger will become effective upon the filing of a properly executed certificate of merger with the Secretary of State of the State of Delaware or at such
later date and time as may be agreed by HF Sinclair and HEP in writing and set forth in the certificate of merger.
HF Sinclair will not issue any
fractional shares in the Merger. Instead, each holder of HEP Common Units that are converted pursuant to the Merger Agreement who otherwise would have received a fraction of a share of HF Sinclair Common Stock will be entitled to receive, in lieu
thereof, a cash payment (without interest and rounded to the nearest cent) in an amount equal to the product of (i) the aggregated amount of the fractional interest in shares of HF Sinclair Common Stock to which such holder would otherwise be
entitled to receive pursuant to the Merger Agreement and (ii) an amount equal to the average of the volume weighted average price per share of HF Sinclair Common Stock on the New York Stock Exchange (the “NYSE”) (as reported by
Bloomberg L.P., or, if not reported therein, in another authoritative source mutually selected by HF Sinclair and the General Partner) on each of the ten consecutive trading days ending with the complete trading day immediately prior to the closing
date of the Merger.
Holders of shares of HF Sinclair Common Stock prior to the Merger will continue to own their existing shares of HF Sinclair Common
Stock. In connection with the Merger, (i) HLH’s non-economic general partner interest in HEP, (ii) HLH’s special general partner interest in HEP (the “Special General Partner
Interest”), and (iii) the HEP Common Units owned by HF Sinclair and its subsidiaries, including HoldCo, will not be cancelled, will not be converted into the Merger Consideration and will remain outstanding following the Merger as a non-economic general partner interest in HEP, a Special General Partner Interest in HEP and as HEP Common Units, respectively.
The closing of the Merger will take place on the third business day after the satisfaction or waiver of the conditions set forth in the Merger Agreement
(other than conditions that by their nature are to be satisfied at the closing but subject to the satisfaction or waiver of those conditions), or at such other place, date and time as HF Sinclair and HEP may agree.
1
The conflicts committee (the “HF Sinclair Conflicts Committee”) of the board of directors of HF
Sinclair (the “HF Sinclair Board”) has unanimously (i) determined that the Merger Agreement and the various transactions contemplated by the Merger Agreement, including the Merger and the HF Sinclair Stock Issuance (the
“Transactions”), are advisable and in the best interests of HF Sinclair and the HF Sinclair Stockholders, (ii) approved the Merger Agreement and the Transactions, including the Merger and the HF Sinclair Stock Issuance, on the terms
and subject to the conditions set forth in the Merger Agreement, (iii) recommended that the HF Sinclair Board approve the Merger Agreement and the Transactions, including the Merger and the HF Sinclair Stock Issuance, on the terms and subject
to the conditions set forth in the Merger Agreement, and (iv) resolved and recommended that the HF Sinclair Board resolve, to (a) direct that the HF Sinclair Stock Issuance be submitted to a vote of the HF Sinclair Stockholders for
approval at the HF Sinclair Special Meeting and (b) recommend approval of the HF Sinclair Stock Issuance by the HF Sinclair Stockholders at the HF Sinclair Special Meeting (as defined below).
The HF Sinclair Board (acting, in part, based upon the recommendation of the HF Sinclair Conflicts Committee) has unanimously (i) determined that the
Merger Agreement and the Transactions, including the Merger and the HF Sinclair Stock Issuance, are advisable and in the best interests of HF Sinclair and the HF Sinclair Stockholders, (ii) approved the Merger Agreement and the Transactions,
including the Merger and the HF Sinclair Stock Issuance, on the terms and subject to the conditions set forth in the Merger Agreement, (iii) directed that the HF Sinclair Stock Issuance be submitted to a vote of the HF Sinclair Stockholders for
approval at the HF Sinclair Special Meeting and (iv) resolved to recommend approval of the HF Sinclair Stock Issuance by the HF Sinclair Stockholders at the HF Sinclair Special Meeting.
The conflicts committee (the “HEP Conflicts Committee”) of the board of directors of the General Partner (the “GP Board”) has unanimously
and in good faith (i) determined that the Merger Agreement and the transactions contemplated thereby, including the Merger, are in the best interests of HEP, including the HEP Unitholders other than HF Sinclair, HoldCo, HLH, the General Partner
and their respective Affiliates, including officers and directors of such entities and their Affiliates (the “HEP Unaffiliated Unitholders”), (ii) approved the Merger Agreement and the transactions contemplated thereby, including the
Merger (the foregoing constituting “Special Approval” for all purposes of the Second Amended and Restated Agreement of Limited Partnership of HEP, dated as of October 31, 2017, as may be further amended, modified or supplemented from
time to time, including Section 7.9(a) thereof) on the terms and subject to the conditions set forth in the Merger Agreement, (iii) recommended that the GP Board approve the Merger Agreement and the transactions contemplated thereby,
including the Merger, on the terms and subject to the conditions set forth in the Merger Agreement, and (iv) resolved and recommended that the GP Board resolve to (a) direct that the Merger Agreement and the Merger be submitted to a vote
of the HEP Unitholders for approval and (b) recommend approval of the Merger Agreement and the Merger by the HEP Unitholders at the HEP Special Meeting (as defined below).
The GP Board (acting, in part, based upon the recommendation of the HEP Conflicts Committee) has unanimously and in good faith (i) determined that the
Merger Agreement and the transactions contemplated thereby, including the Merger, are in the best interests of HEP, including the HEP Unaffiliated Unitholders, (ii) approved the Merger Agreement and the transactions contemplated thereby,
including the Merger, on the terms and subject to the conditions set forth in the Merger Agreement, (iii) directed that the Merger Agreement and the Merger be submitted to a vote of the HEP Unitholders for approval and (iv) resolved to
recommend approval of the Merger Agreement and the Merger by the HEP Unitholders at the HEP Special Meeting.
In connection with the Merger, HF
Sinclair will hold a special meeting of its stockholders (as the same may be adjourned or postponed, the “HF Sinclair Special Meeting”), and HEP will hold a special meeting of its unitholders (as the same may be adjourned or postponed, the
“HEP Special Meeting”).
At the HF Sinclair Special Meeting, the HF Sinclair Stockholders will be asked to consider and vote on proposals to
(i) approve the issuance of shares of HF Sinclair Common Stock to HEP Unitholders pursuant to the Merger Agreement (the “HF Sinclair Stock Issuance Proposal”) and (ii) approve the adjournment of the HF Sinclair Special Meeting to
a later date or dates, if necessary or appropriate, to solicit additional proxies in the event there are not sufficient votes at the time of the HF Sinclair Special Meeting to approve the HF Sinclair Stock Issuance Proposal. The approval by the HF
Sinclair Stockholders of the HF Sinclair Stock Issuance Proposal is required by the NYSE rules relating to issuances of securities to certain related parties.
2
At the HEP Special Meeting, the HEP Unitholders will be asked to consider and vote on proposals to
(i) approve the Merger Agreement and the transactions contemplated thereby (the “Merger Proposal”) and (ii) approve the adjournment of the HEP Special Meeting to a later date or dates, if necessary or appropriate, to solicit
additional proxies in the event there are not sufficient votes at the time of the HEP Special Meeting to approve the Merger Proposal. Pursuant to the Merger Agreement, HF Sinclair has agreed that it will vote, or cause to be voted, all HEP Common
Units then owned beneficially or of record by HF Sinclair or any of its subsidiaries in favor of the Merger Proposal. HF Sinclair currently holds approximately 47% of the issued and outstanding HEP Common Units through its subsidiaries, along with
the non-economic general partner interest and the Special General Partner Interest.
Concurrently with the
filing of this Amended Transaction Statement, HF Sinclair is filing with the SEC Amendment No. 1 to its Registration Statement on Form S-4 (Registration No. 333-274655), which includes a joint
proxy statement/prospectus of HF Sinclair and HEP (the “Joint Proxy Statement/Prospectus”) in connection with the Merger Agreement and the transactions contemplated thereby. A copy of the Joint Proxy Statement/Prospectus is attached hereto
as Exhibit (a)(1). A copy of the Merger Agreement is attached as Annex A to the Joint Proxy Statement/Prospectus. All references in this Amended Transaction Statement to Items numbered 1001 to 1016 are references to Items contained in Regulation M-A under the Exchange Act.
Pursuant to General Instruction F to Schedule
13E-3, the information contained in the Joint Proxy Statement/Prospectus, including all annexes thereto, is expressly incorporated herein by reference in its entirety and responses to each item herein are
qualified in their entirety by the information contained in the Joint Proxy Statement/Prospectus and the annexes thereto. The cross-references below are being supplied pursuant to General Instruction G to Schedule
13E-3 and show the location in the Joint Proxy Statement/Prospectus of the information required to be included in response to the items of Schedule 13E-3. As of the date hereof, the Joint Proxy
Statement/Prospectus is in preliminary form and is subject to completion. Terms used but not defined in this Amended Transaction Statement have the meanings given to them in the Joint Proxy Statement/Prospectus. As of the date hereof, the Joint
Proxy Statement/Prospectus is in preliminary form and is subject to completion or amendment.
All information concerning HEP contained in, or incorporated
by reference into, this Amended Transaction Statement was supplied by HEP. Similarly, all information concerning any other filing person contained in, or incorporated by reference into, this Amended Transaction Statement was supplied by such filing
person.
| ITEM 1. |
SUMMARY TERM SHEET |
Regulation M-A Item 1001
The information set forth in the Joint Proxy Statement/Prospectus under the following captions is incorporated herein by reference:
“Summary Term Sheet”
“Questions and Answers”
| ITEM 2. |
SUBJECT COMPANY INFORMATION |
Regulation M-A Item 1002
| (a) |
Name and Address. The information set forth in the Joint Proxy Statement/Prospectus under the following
captions is incorporated herein by reference: |
“Summary Term Sheet—The Parties”
“The Parties”
| (b) |
Securities. The information set forth in the Joint Proxy Statement/Prospectus under the following
captions is incorporated herein by reference: |
“Special Meeting of HEP Unitholders”
“Special Factors—Interests of Certain Persons in the Merger”
“Special Factors—Treatment of HEP Equity Awards”
“Comparative Market Prices and Cash Dividend/Distribution Information”
| (c) |
Trading Market and Price. The information set forth in the Joint Proxy Statement/Prospectus under the
following caption is incorporated herein by reference: |
“Comparative Market Prices and Cash
Dividend/Distribution Information”
3
| (d) |
Dividends. The information set forth in the Joint Proxy Statement/Prospectus under the following caption
is incorporated herein by reference: |
“Comparative Market Prices and Cash Dividend/Distribution
Information”
| (e) |
Prior Public Offerings. The information set forth in the Joint Proxy Statement/Prospectus under the
following caption is incorporated herein by reference: |
“Prior Public Offerings”
| (f) |
Prior Stock Purchases. The information set forth in the Joint Proxy Statement/Prospectus under the
following caption is incorporated herein by reference: |
“Comparative Market Prices and Cash
Dividend/Distribution Information”
| ITEM 3. |
IDENTITY AND BACKGROUND OF FILING PERSON |
Regulation M-A Item 1003
| (a) through (b) |
Name and Address; Business and Background of Entities. HEP is the issuer of the equity securities that
are the subject of the Rule 13e-3 transaction reported hereby. |
The information
set forth in the Joint Proxy Statement/Prospectus under the following captions is incorporated herein by reference:
“Summary Term
Sheet—The Parties”
“The Parties”
“Where You Can Find More Information”
| (c) |
Business and Background of Natural Persons. The information set forth in the Joint Proxy
Statement/Prospectus under the following captions is incorporated herein by reference: |
“Business and Background
of Natural Persons”
“Where You Can Find More Information”
| ITEM 4. |
TERMS OF THE TRANSACTION |
Regulation M-A Item 1004
| (a) |
Material Terms. The information set forth in the Joint Proxy Statement/Prospectus under the following
captions is incorporated herein by reference: |
“Summary Term Sheet”
“Questions and Answers”
“Special Factors—Overview of Special Factors”
“Special Factors—Effects of the Merger”
“Special Factors—Background of the Merger”
“Special Factors—Resolution of Conflicts of Interest; Standards of Conduct and Modification of Duties”
“Special Factors—Position of HF Sinclair, HoldCo and Merger Sub as to the Fairness of the Merger”
“Special Factors—Purpose and Reasons of the Parent Entities for the Merger”
“Special Factors—Primary Benefits and Detriments of the Merger”
“Special Factors—Recommendations of the HF Sinclair Conflicts Committee and the HF Sinclair Board and their Reasons for the
Merger”
4
“Special Factors—Recommendations of the HEP Conflicts Committee and the GP
Board and the Reasons for their Recommendations”
“Special Factors—No Appraisal Rights”
“Special Factors—Listing of HF Sinclair Common Stock to be Issued in the Merger; Delisting and Deregistration of HEP Common
Units”
“Special Factors—Accounting Treatment of the Merger”
“Special Factors—Interests of Certain Persons in the Merger”
“Special Factors—Treatment of HEP Equity Awards”
“The Merger Agreement”
“Comparison of the Rights of the HF Sinclair Stockholders and the HEP Unitholders”
“Special Meeting of HF Sinclair Stockholders”
“Special Meeting of HEP Unitholders”
“United States Federal Income Tax Consequences”
“Annex A: Merger Agreement”
| (c) |
Different Terms. The information set forth in the Joint Proxy Statement/Prospectus under the following
captions is incorporated herein by reference: |
“Summary Term Sheet”
“Questions and Answers”
“Special Factors—Overview of Special Factors”
“Special Factors—Interests of Certain Persons in the Merger”
“Special Factors—Provisions for HEP Unaffiliated Unitholders”
“Special Factors—No Appraisal Rights”
“The Merger Agreement”
“Annex A: Merger Agreement”
| (d) |
Appraisal Rights. The information set forth in the Joint Proxy Statement/Prospectus under the following
captions is incorporated herein by reference: |
“Summary Term Sheet—No Appraisal Rights”
“Questions and Answers”
“Special Factors—No Appraisal Rights”
| (e) |
Provisions for Unaffiliated Security Holders. The information set forth in the Joint Proxy
Statement/Prospectus under the following caption is incorporated herein by reference: |
“Special
Factors—Provisions for HEP Unaffiliated Unitholders”
| (f) |
Eligibility for Listing or Trading. The information set forth in the Joint Proxy Statement/Prospectus
under the following captions is incorporated herein by reference: |
“Summary Term Sheet—Listing of HF
Sinclair Common Stock to be Issued in the Merger; Delisting and Deregistration of HEP Common Units”
“Special
Factors—Listing of HF Sinclair Common Stock to be Issued in the Merger; Delisting and Deregistration of HEP Common Units”
“The Merger Agreement—NYSE Listing, Delisting and Deregistration”
| ITEM 5. |
PAST CONTACTS, TRANSACTIONS, NEGOTIATIONS AND AGREEMENTS |
Regulation M-A Item 1005
| (a) |
Transactions. The information set forth in the Joint Proxy Statement/Prospectus under the following
captions is incorporated herein by reference: |
“Summary Term Sheet”
“The Parties”
5
“Special Factors—Interests of Certain Persons in the Merger”
“Past Contacts, Transactions, Negotiations and Agreements”
“Where You Can Find More Information”
| (b) through (c) |
Significant Corporate Events; Negotiations or Contacts. The information set forth in the Joint Proxy
Statement/Prospectus under the following captions is incorporated herein by reference: |
“Summary Term
Sheet”
“Special Factors—Overview of Special Factors”
“Special Factors—Background of the Merger”
“Special Factors—Position of HF Sinclair, HoldCo and Merger Sub as to the Fairness of the Merger”
“Special Factors—Recommendations of the HF Sinclair Conflicts Committee and the HF Sinclair Board and their Reasons for the
Merger”
“Special Factors—Recommendations of the HEP Conflicts Committee and the GP Board and the Reasons for their
Recommendations”
“Special Factors—Financing of the Merger”
“Special Factors—Interests of Certain Persons in the Merger”
“The Merger Agreement”
“Past Contacts, Transactions, Negotiations and Agreements”
“Annex A: Merger Agreement”
| (e) |
Agreements Involving the Subject Company’s Securities. The information set forth in the Joint Proxy
Statement/Prospectus under the following captions is incorporated herein by reference: |
“Summary Term
Sheet”
“Questions and Answers”
“Special Factors—Effects of the Merger”
“Special Factors—Interests of Certain Persons in the Merger”
“Special Factors—Treatment of HEP Equity Awards”
“The Merger Agreement”
“Comparative Market Prices and Cash Dividend/Distribution Information”
“Past Contacts, Transactions, Negotiations and Agreements”
“Where You Can Find More Information”
“Annex A: Merger Agreement”
| ITEM 6. |
PURPOSES OF THE TRANSACTION AND PLANS OR PROPOSALS. |
Regulation M-A Item 1006
| (b) |
Use of Securities Acquired. The information set forth in the Joint Proxy Statement/Prospectus under the
following captions is incorporated herein by reference: |
“Summary Term Sheet”
“Questions and Answers”
“Special Factors—Overview of Special Factors”
“Special Factors—Effects of the Merger”
“Special Factors—Purpose and Reasons of the Parent Entities for the Merger”
“Special Factors—Primary Benefits and Detriments of the Merger”
“Special Factors—Financing of the Merger”
“Special Factors—Listing of HF Sinclair Common Stock to be Issued in the Merger; Delisting and Deregistration of HEP Common
Units”
“Special Factors—Interests of Certain Persons in the Merger”
“The Merger Agreement”
6
“Annex A: Merger Agreement”
| (c)(1) through (8) |
Plans. The information set forth in the Joint Proxy Statement/Prospectus under the following captions is
incorporated herein by reference: |
“Summary Term Sheet”
“Questions and Answers”
“Comparative Market Prices and Cash Dividend/Distribution Information”
“Special Factors—Effects of the Merger”
“Special Factors—Background of the Merger”
“Special Factors—Position of HF Sinclair, HoldCo and Merger Sub as to the Fairness of the Merger”
“Special Factors—Primary Benefits and Detriments of the Merger”
“Special Factors—Purpose and Reasons of the Parent Entities for the Merger”
“Special Factors—Recommendations of the HF Sinclair Conflicts Committee and the HF Sinclair Board and their Reasons for the
Merger”
“Special Factors—Recommendations of the HEP Conflicts Committee and the GP Board and the Reasons for their
Recommendations”
“Special Factors—Interests of Certain Persons in the Merger”
“Special Factors—Financing of the Merger”
“Special Factors—Listing of HF Sinclair Common Stock to be Issued in the Merger; Delisting and Deregistration of HEP Common
Units”
“The Merger Agreement”
“Special Meeting of HF Sinclair Stockholders”
“Special Meeting of HEP Unitholders”
“Annex A: Merger Agreement”
| ITEM 7. |
PURPOSES, ALTERNATIVES, REASONS AND EFFECTS |
Regulation M-A Item 1013
| (a) |
Purposes. The information set forth in the Joint Proxy Statement/Prospectus under the following captions
is incorporated herein by reference: |
“Summary Term Sheet”
“Questions and Answers”
“Special Factors—Effects of the Merger”
“Special Factors—Background of the Merger”
“Special Factors—Position of HF Sinclair, HoldCo and Merger Sub as to the Fairness of the Merger”
“Special Factors—Primary Benefits and Detriments of the Merger”
“Special Factors—Purpose and Reasons of the Parent Entities for the Merger”
“Special Factors—Recommendations of the HF Sinclair Conflicts Committee and the HF Sinclair Board and their Reasons for the
Merger”
“Special Factors—Recommendations of the HEP Conflicts Committee and the GP Board and the Reasons for their
Recommendations”
“Special Factors—Interests of Certain Persons in the Merger”
| (b) |
Alternatives. The information set forth in the Joint Proxy Statement/Prospectus under the following
captions is incorporated herein by reference: |
“Summary Term Sheet”
“Special Factors—Background of the Merger”
“Special Factors—Position of HF Sinclair, HoldCo and Merger Sub as to the Fairness of the Merger”
“Special Factors—Primary Benefits and Detriments of the Merger”
“Special Factors—Purpose and Reasons of the Parent Entities for the Merger”
7
“Special Factors—Recommendations of the HF Sinclair Conflicts Committee and
the HF Sinclair Board and their Reasons for the Merger”
“Special Factors—Recommendations of the HEP Conflicts
Committee and the GP Board and the Reasons for their Recommendations”
“Special Factors—Financial Advisor Discussion
Materials Provided to HF Sinclair”
“Special Factors—Opinion of the Financial Advisor to the HEP Conflicts
Committee”
“Annex B: Opinion of Intrepid Partners, LLC”
| (c) |
Reasons. The information set forth in the Joint Proxy Statement/Prospectus under the following captions
is incorporated herein by reference: |
“Summary Term Sheet”
“Questions and Answers”
“Special Factors—Effects of the Merger”
“Special Factors—Background of the Merger”
“Special Factors—Position of HF Sinclair, HoldCo and Merger Sub as to the Fairness of the Merger”
“Special Factors—Primary Benefits and Detriments of the Merger”
“Special Factors—Purpose and Reasons of the Parent Entities for the Merger”
“Special Factors—Recommendations of the HF Sinclair Conflicts Committee and the HF Sinclair Board and their Reasons for the
Merger”
“Special Factors—Recommendations of the HEP Conflicts Committee and the GP Board and the Reasons for their
Recommendations”
“Special Factors—Financial Advisor Discussion Materials Provided to HF Sinclair”
“Special Factors—Opinion of the Financial Advisor to the HEP Conflicts Committee”
“Special Factors—Interests of Certain Persons in the Merger”
“Annex B: Opinion of Intrepid Partners, LLC”
| (d) |
Effects. The information set forth in the Joint Proxy Statement/Prospectus under the following captions
is incorporated herein by reference: |
“Summary Term Sheet”
“Questions and Answers”
“Special Factors—Effects of the Merger”
“Special Factors—Background of the Merger”
“Special Factors—Position of HF Sinclair, HoldCo and Merger Sub as to the Fairness of the Merger”
“Special Factors—Primary Benefits and Detriments of the Merger”
“Special Factors—Purpose and Reasons of the Parent Entities for the Merger”
“Special Factors—Recommendations of the HF Sinclair Conflicts Committee and the HF Sinclair Board and their Reasons for the
Merger”
“Special Factors—Recommendations of the HEP Conflicts Committee and the GP Board and the Reasons for their
Recommendations”
“Special Factors—Interests of Certain Persons in the Merger”
“Special Factors—Financing of the Merger”
“Special Factors—Listing of HF Sinclair Common Stock to be Issued in the Merger; Delisting and Deregistration of HEP Common
Units”
“The Merger Agreement”
“United States Federal Income Tax Consequences”
“Annex A: Merger Agreement”
8
| ITEM 8. |
FAIRNESS OF THE TRANSACTION |
Regulation M-A Item 1014
| (a) through (b) |
Fairness; Factors Considered in Determining Fairness. Barclays Capital, Inc. (“Barclays”) was
not requested to, and it did not, provide to HF Sinclair or any other person any (i) opinion (whether as to the fairness of any consideration, including, without limitation, the Merger Consideration, or otherwise), (ii) valuation of HEP for the
purpose of assessing the fairness of the Merger Consideration to any person, or (iii) recommendation as to how to vote or act on any matters relating to the proposed Merger or otherwise. Barclay’s discussion materials dated August 14,
2023 should not be construed as creating any fiduciary duty on Barclays’ part to HF Sinclair or any other person and such materials are not intended to be, and do not constitute, a recommendation to HF Sinclair or any other person in respect of
the Merger, including as to how any HEP Unitholder should act or vote in respect of the Merger Proposal or as to how any HF Sinclair Stockholder should act or vote in respect of the HF Sinclair Stock Issuance Proposal. |
The information set forth in the Joint Proxy Statement/Prospectus under the following captions is incorporated herein by reference:
“Summary Term Sheet”
“Special Factors—Background of the Merger”
“Special Factors—Position of HF Sinclair, HoldCo and Merger Sub as to the Fairness of the Merger”
“Special Factors—Primary Benefits and Detriments of the Merger”
“Special Factors—Purpose and Reasons of the Parent Entities for the Merger”
“Special Factors—Recommendations of the HF Sinclair Conflicts Committee and the HF Sinclair Board and their Reasons for the
Merger”
“Special Factors—Recommendations of the HEP Conflicts Committee and the GP Board and the Reasons for their
Recommendations”
“Special Factors—Opinion of the Financial Advisor to the HEP Conflicts Committee”
“Special Factors—Financial Advisor Discussion Materials Provided to HF Sinclair”
“Special Factors—Interests of Certain Persons in the Merger”
“Annex B: Opinion of Intrepid Partners, LLC”
| (c) |
Approval of Security Holders. The information set forth in the Joint Proxy Statement/Prospectus under
the following captions is incorporated herein by reference: |
“Questions and Answers”
“Special Factors—Primary Benefits and Detriments of the Merger”
“Special Factors—Purpose and Reasons of the Parent Entities for the Merger”
“Special Factors—Recommendations of the HEP Conflicts Committee and the GP Board and the Reasons for their Recommendations”
“The Merger Agreement—HEP Unitholder Approval”
“Special Meeting of HEP Unitholders”
| (d) |
Unaffiliated Representative. The information set forth in the Joint Proxy Statement/Prospectus under the
following captions is incorporated herein by reference: |
“Summary Term Sheet”
“Special Factors—Effects of the Merger”
“Special Factors—Background of the Merger”
“Special Factors—Recommendations of the HEP Conflicts Committee and the GP Board and their Reasons for the Merger”
“Special Factors—Opinion of the Financial Advisor to the HEP Conflicts Committee”
“Special Factors—Interests of Certain Persons in the Merger”
“The Merger Agreement”
“Annex B: Opinion of Intrepid Partners, LLC”
9
| (e) |
Approval of Directors. The information set forth in the Joint Proxy Statement/Prospectus under the
following captions is incorporated herein by reference: |
“Summary Term Sheet”
“Questions and Answers”
“Special Factors—Background of the Merger”
“Special Factors—Recommendations of the HEP Conflicts Committee and the GP Board and the Reasons for their Recommendations”
“Special Factors—Recommendations of the HF Sinclair Conflicts Committee and the HF Sinclair Board and their Reasons for
the Merger”
“Special Factors—Position of HF Sinclair, HoldCo and Merger Sub as to the Fairness of the Merger”
| (f) |
Other Offers. Not Applicable. |
| ITEM 9. |
REPORTS, OPINIONS, APPRAISALS AND CERTAIN NEGOTIATIONS |
Regulation M-A Item 1015
| (a) through (b) |
Report, Opinion or Appraisal; Preparer and Summary of the Report, Opinion or Appraisal. The discussion
materials prepared by Barclays and provided to HF Sinclair, the HF Sinclair Conflicts Committee and the HF Sinclair Board, dated as of August 14, 2023, are set forth as Exhibit (c)(2) and incorporated herein by reference. The discussion
materials prepared by Intrepid Partners, LLC and provided to the HEP Conflicts Committee, dated as of June 1, 2023, June 26, 2023, July 13, 2023, July 14, 2023, July 24, 2023, July 27, 2023, August 2, 2023,
August 9, 2023, August 11, 2023 and August 15, 2023 are set forth as Exhibits (c)(3)(A) through (c)(3)(J) hereto and are incorporated herein by reference. |
The information set forth in the Joint Proxy Statement/Prospectus under the following captions is incorporated herein by reference:
“Summary Term Sheet—Effects of the Merger”
“Summary Term Sheet—Position of HF Sinclair, HoldCo and Merger Sub as to the Fairness of the Merger”
“Special Factors—Purpose and Reasons of the Parent Entities for the Merger”
“Summary Term Sheet—Recommendations of the HF Sinclair Conflicts Committee and the HF Sinclair Board and their Reasons for the
Merger”
“Summary Term Sheet—Recommendations of the HEP Conflicts Committee and the GP Board and the Reasons for
their Recommendations”
“Summary Term Sheet—Financial Advisor Discussion Materials Provided to HF Sinclair”
“Summary Term Sheet—Opinion of the Financial Advisor to the HEP Conflicts Committee”
“Special Factors—Effects of the Merger”
“Special Factors—Background of the Merger”
“Special Factors—Opinion of the Financial Advisor to the HEP Conflicts Committee”
“Special Factors—Position of HF Sinclair, HoldCo and Merger Sub as to the Fairness of the Merger”
“Special Factors—Recommendations of the HF Sinclair Conflicts Committee and the HF Sinclair Board and their Reasons for the
Merger”
“Special Factors—Recommendations of the HEP Conflicts Committee and the GP Board and the Reasons for their
Recommendations”
“Special Factors—Financial Advisor Discussion Materials Provided to HF Sinclair”
“Special Factors—Fees and Expenses”
“Where You Can Find More Information”
“Annex B: Opinion of Intrepid Partners, LLC”
The written opinion of Intrepid Partners, LLC is attached to the Joint Proxy Statement/Prospectus as Annex B and is incorporated herein by
reference.
10
| (c) |
Availability of Documents. The reports, opinions or appraisals referenced in this Item 9 are filed
herewith and will be made available for inspection and copying at the principal executive offices of HF Sinclair and HEP during its regular business hours by any interested equity security holder of HEP Common Units or by any representative who has
been so designated in writing upon written request and at the expense of the requesting security holder. |
| ITEM 10. |
SOURCE AND AMOUNTS OF FUNDS OR OTHER CONSIDERATION |
Regulation M-A Item 1007
| (a) through (b),(d) |
Source of Funds; Conditions; Borrowed Funds. The information set forth in the Joint Proxy
Statement/Prospectus under the following captions is incorporated herein by reference: |
“Summary Term
Sheet—The Merger Consideration”
“Summary Term Sheet—The Merger Agreement”
“Summary Term Sheet—Fees and Expenses”
“Summary Term Sheet—Financing of the Merger”
“Special Factors—Background of the Merger”
“Special Factors—Recommendations of the HEP Conflicts Committee and the GP Board and the Reasons for their Recommendations”
“Special Factors—Interests of Certain Persons in the Merger”
“Special Factors—Fees and Expenses”
“Special Factors—Financing of the Merger”
| (c) |
Expenses. The information set forth in the Joint Proxy Statement/Prospectus under the following captions
is incorporated herein by reference: |
“Summary Term Sheet—Fees and Expenses”
“Summary Term Sheet—Financing of the Merger”
“Special Factors—Fees and Expenses”
“Special Factors—Financing of the Merger”
“Special Meeting of HF Sinclair Stockholders—Solicitation of Proxies”
“Special Meeting of HEP Unitholders—Solicitation of Proxies”
“The Merger Agreement—Effect of Termination; Termination Expenses”
| ITEM 11. |
INTEREST IN SECURITIES OF THE SUBJECT COMPANY |
Regulation M-A Item 1008
| (a) through (b) |
Securities Ownership; Securities Transactions. The information set forth in the Joint Proxy
Statement/Prospectus under the following captions is incorporated herein by reference: |
“Summary Term
Sheet—The Parties”
“Summary Term Sheet—The Merger”
“The Parties”
“Special Factors—Effects of the Merger”
“Special Factors—Interests of Certain Persons in the Merger”
“Special Factors—Treatment of HEP Equity Awards”
“Special Factors—Certain Beneficial Owners of HEP Common Units”
“The Merger Agreement”
“Comparative Market Prices and Cash Dividend/Distribution Information”
| ITEM 12. |
THE SOLICITATION OR RECOMMENDATION |
Regulation M-A Item 1012
| (d) |
Intent to Tender or Vote in a Going-Private Transaction. The information set forth in the Joint Proxy
Statement/Prospectus under the following captions is incorporated herein by reference: |
11
“Questions and Answers”
“Special Meeting of HEP Unitholders”
| (e) |
Recommendations of Others. The information set forth in the Joint Proxy Statement/Prospectus under the
following captions is incorporated herein by reference: |
“Summary Term Sheet”
“Questions and Answers”
“Special Factors—Position of HF Sinclair, HoldCo and Merger Sub as to the Fairness of the Merger”
“Special Factors—Purpose and Reasons of the Parent Entities for the Merger”
“Special Factors—Recommendations of the HF Sinclair Conflicts Committee and the HF Sinclair Board and their Reasons for the
Merger”
“Special Factors—Recommendations of the HEP Conflicts Committee and the GP Board and the Reasons for their
Recommendations”
“Special Factors—Interests of Certain Persons in the Merger”
“The Merger Agreement—Conditions to Completion of the Merger”
| ITEM 13. |
FINANCIAL INFORMATION |
Regulation M-A Item 1010
| (a) |
Financial Statements. The information set forth in the Joint Proxy Statement/Prospectus under the
following captions is incorporated herein by reference: |
“Special Factors—Effects of the Merger”
“Selected Historical Consolidated Financial Data of HEP”
“Where You Can Find More Information”
HEP’s Annual Report on Form 10-K for the year ended December 31, 2022 and Quarterly Report
on Form 10-Q for the quarterly period ended June 30, 2023 are incorporated herein by reference.
| (b) |
Pro Forma Information. Not applicable. |
| ITEM 14. |
PERSONS/ASSETS, RETAINED, EMPLOYED, COMPENSATED OR USED |
Regulation M-A Item 1009
| (a) through (b) |
Solicitations or Recommendations; Employees and Corporate Assets. The information set forth in the Joint
Proxy Statement/Prospectus under the following captions is incorporated herein by reference: |
“Summary Term
Sheet”
“Questions and Answers”
“Special Factors—Background of the Merger”
“Special Factors—Position of HF Sinclair, HoldCo and Merger Sub as to the Fairness of the Merger”
“Special Factors—Recommendations of the HF Sinclair Conflicts Committee and the HF Sinclair Board and their Reasons for the
Merger”
“Special Factors—Recommendations of the HEP Conflicts Committee and the GP Board and the Reasons for their
Recommendations”
“Special Factors—Interests of Certain Persons in the Merger”
“Special Factors—Fees and Expenses”
12
| ITEM 15. |
ADDITIONAL INFORMATION |
Regulation M-A Item 1011
| (c) |
Golden Parachute Compensation. The information set forth in the Joint Proxy Statement/Prospectus under
the following caption is incorporated herein by reference. |
“Special Factors—Interests of Certain Persons
in the Merger”
“Special Factors—No Golden Parachute Compensation Payable to the HEP Named Executive Officers in
Connection with the Merger”
| (c) |
Other Material Information. The information set forth in the Joint Proxy Statement/Prospectus, including
all annexes thereto, is incorporated herein by reference. |
Regulation M-A Item 1016
|
|
|
| Exhibit No. |
|
Description |
|
|
| (a)(1) |
|
Joint Proxy Statement/Prospectus of HF Sinclair Corporation and Holly Energy Partners, L.P. (incorporated herein by reference to Amendment No. 1
to the Registration Statement on Form S-4 of HF Sinclair Corporation filed with the SEC concurrently with this Amended Transaction Statement). |
|
|
| (a)(2) |
|
Joint Letter to the Stockholders of HF Sinclair Corporation and the Unitholders of Holly Energy Partners, L.P. (incorporated herein by reference
to the Joint Proxy Statement/Prospectus). |
|
|
| (a)(4) |
|
Form of Proxy Card and Voting Instructions for the HF Sinclair Special Meeting (incorporated herein by reference to the Joint Proxy Statement/Prospectus).
|
|
|
| (a)(5) |
|
Form of Proxy Card and Voting Instructions for the HEP Special Meeting (incorporated herein by reference to the Joint Proxy Statement/Prospectus).
|
|
|
| (a)(6)* |
|
Notice of Special Meeting of Unitholders of Holly Energy Partners, L.P. (incorporated herein by reference to the Joint Proxy Statement/Prospectus).
|
|
|
| (a)(7)* |
|
Press Release of Holly Energy Partners, L.P. dated May
4, 2023 (incorporated herein by reference to Exhibit 99.1 to Holly Energy Partners, L.P.’s Current Report on Form 8-K filed with the SEC on May 4, 2023 (File No.
001-32225)). |
|
|
| (a)(8)* |
|
Press Release of HF Sinclair Corporation dated May
4, 2023 (incorporated herein by reference to Exhibit 99.1 to HF Sinclair Corporation’s Current Report on Form 8-K filed with the SEC on May 4, 2023 (File No.
001-41325)). |
|
|
| (a)(9)* |
|
Earnings Release of HF Sinclair Corporation dated May
4, 2023 (incorporated herein by reference to Exhibit 99.1 to HF Sinclair Corporation’s Current Report on Form 8-K filed with the SEC on May 4, 2023 (File No.
001-41325)). |
|
|
| (a)(10)* |
|
Communication to Employees of Holly Energy Partners, L.P. from the Chief Executive Officer and President of Holly Energy Partners, L.P., dated
May 4, 2023 (incorporated herein by reference to Holly Energy Partners, L.P.’s Communication pursuant to Rule 425 of the Securities Act filed with the SEC on May 4, 2023 (File
No. 001-32225)). |
|
|
| (a)(11)* |
|
Communication to Employees of HF Sinclair Corporation from HF Sinclair Corporation, dated May
4, 2023 (incorporated herein by reference to HF Sinclair Corporation’s Communication pursuant to Rule 425 of the Securities Act filed with the SEC on May 4, 2023 (File No. 001-32225)).
|
|
|
| (a)(12)* |
|
Excerpt of the Joint Earnings Call Transcript held on May
4, 2023 (incorporated herein by reference to Holly Energy Partners, L.P.’s Communication pursuant to Rule 425 of the Securities Act filed with the SEC on May 5, 2023 (File No. 001-32225)).
|
|
|
| (a)(13)* |
|
Letter to certain employees of Holly Energy Partners, L.P., dated August
16, 2023 (incorporated herein by reference to Exhibit 99.1 to Holly Energy Partners, L.P.’s Current Report on Form 8-K filed with the SEC on August
16, 2023 (File No. 001-32225)). |
|
|
| (a)(14)* |
|
Letter to certain employees of HF Sinclair Corporation and Holly Energy Partners, L.P., dated August
16, 2023 (incorporated herein by reference to Exhibit 99.1 to HF Sinclair Corporation’s Current Report on Form 8-K filed with the SEC on August 16, 2023 (File No.
001-41325)). |
|
|
| (a)(15)* |
|
Joint Press Release of HF Sinclair Corporation and Holly Energy Partners, L.P., dated August
16, 2023 (incorporated herein by reference to Exhibit 99.1 to HF Sinclair Corporation’s Current Report on Form 8-K filed with the SEC on August 16, 2023 (File No.
001-41325)). |
13
|
|
|
| Exhibit No. |
|
Description |
|
|
| (c)(1) |
|
Opinion of Intrepid Partners, LLC (incorporated herein by reference to Annex B of the Joint Proxy Statement/Prospectus).
|
|
|
| (c)(2)* |
|
Discussion materials prepared by Barclays Capital, Inc., dated August
14, 2023, for the Board of Directors of HF Sinclair Corporation. |
|
|
| (c)(2)(A) |
|
Discussion materials prepared by Barclays Capital, Inc., dated May 1, 2023, for the Board of Directors of HF Sinclair Corporation and the Conflicts Committee of the Board of Directors of HF Sinclair Corporation.
|
|
|
| (c)(2)(B) |
|
Discussion materials prepared by Barclays Capital, Inc., dated July 19, 2023, for the Conflicts Committee of the Board of Directors of HF Sinclair Corporation. |
|
|
| (c)(2)(C) |
|
Discussion materials prepared by Barclays Capital, Inc., dated July 21, 2023, for the Conflicts Committee of the Board of Directors of HF Sinclair Corporation. |
|
|
| (c)(2)(D) |
|
Discussion materials prepared by Barclays Capital, Inc., dated August 1, 2023, for the Conflicts Committee of the Board of Directors of HF Sinclair Corporation. |
|
|
| (c)(2)(E) |
|
Discussion materials prepared by Barclays Capital, Inc., dated August 11, 2023, for the Conflicts Committee of the Board of Directors of HF Sinclair Corporation. |
|
|
| (c)(3)(A)* |
|
Discussion materials prepared by Intrepid Partners, LLC, dated June
1, 2023, for the Conflicts Committee of the Board of Directors of Holly Logistic Services, L.L.C. |
|
|
| (c)(3)(B)* |
|
Discussion materials prepared by Intrepid Partners, LLC, dated June
26, 2023, for the Conflicts Committee of the Board of Directors of Holly Logistic Services, L.L.C. |
|
|
| (c)(3)(C)* |
|
Discussion materials prepared by Intrepid Partners, LLC, dated July
13, 2023, for the Conflicts Committee of the Board of Directors of Holly Logistic Services, L.L.C. |
|
|
| (c)(3)(D)* |
|
Discussion materials prepared by Intrepid Partners, LLC, dated July
14, 2023, for the Conflicts Committee of the Board of Directors of Holly Logistic Services, L.L.C. |
|
|
| (c)(3)(E)* |
|
Discussion materials prepared by Intrepid Partners, LLC, dated July
24, 2023, for the Conflicts Committee of the Board of Directors of Holly Logistic Services, L.L.C. |
|
|
| (c)(3)(F)* |
|
Discussion materials prepared by Intrepid Partners, LLC, dated July
27, 2023, for the Conflicts Committee of the Board of Directors of Holly Logistic Services, L.L.C. |
|
|
| (c)(3)(G)* |
|
Discussion materials prepared by Intrepid Partners, LLC, dated August
2, 2023, for the Conflicts Committee of the Board of Directors of Holly Logistic Services, L.L.C. |
|
|
| (c)(3)(H)* |
|
Discussion materials prepared by Intrepid Partners, LLC, dated August
9, 2023, for the Conflicts Committee of the Board of Directors of Holly Logistic Services, L.L.C. |
|
|
| (c)(3)(I)* |
|
Discussion materials prepared by Intrepid Partners, LLC, dated August
11, 2023, for the Conflicts Committee of the Board of Directors of Holly Logistic Services, L.L.C. |
|
|
| (c)(3)(J)* |
|
Presentation prepared by Intrepid Partners, LLC, dated August
15, 2023, for the Conflicts Committee of the Board of Directors of Holly Logistic Services, L.L.C. |
|
|
| (d)(1) |
|
Agreement and Plan of Merger, dated August 15, 2023, by and among HF Sinclair Corporation, Navajo Pipeline Co., L.P., Holly Apple Holdings
LLC, Holly Energy Partners, L.P., HEP Logistics Holdings, L.P., and Holly Logistic Services, L.L.C. (included as Annex A to the Joint Proxy Statement/Prospectus and incorporated herein by reference). |
|
|
| (d)(2)* |
|
Unitholders Agreement, dated as of August
2, 2021, by and among Holly Energy Partners, L.P., Holly Logistic Services, L.L.C., Navajo Pipeline Co., L.P., The Sinclair Companies, and the unitholders set forth on Schedule I thereto, as may be amended from time to time (incorporated herein by reference
to Exhibit 10.1 to Holly Energy Partners, L.P.’s Current Report on Form 8-K (File No. 001-32225) filed with the SEC on August 3, 2021). |
|
|
| (f)(1)* |
|
Second Amended and Restated Agreement of the Limited Partnership of Holly Energy Partners, L.P. (incorporated herein by reference
to Exhibit 3.1 to Holly Energy Partners, L.P.’s Current Report on Form 8-K (File No. 001-32225) filed with the SEC on November 1, 2017). |
|
|
| (f)(2)* |
|
Delaware Code Title 6 § 17-212. |
|
|
| (g) |
|
None. |
|
|
| 107* |
|
Filing Fee Table. |
14
SIGNATURES
After due inquiry and to the best of each of the undersigned’s knowledge and belief, each of the undersigned certifies that the
information set forth in this statement is true, complete and correct.
Dated as of October 16, 2023
|
|
|
| HF SINCLAIR CORPORATION |
|
|
| By: |
|
/s/ Atanas H. Atanasov |
| Name: |
|
Atanas H. Atanasov |
| Title: |
|
Executive Vice President and Chief Financial Officer |
|
| NAVAJO PIPELINE CO., L.P. |
|
|
| By: |
|
/s/ Atanas H. Atanasov |
| Name: |
|
Atanas H. Atanasov |
| Title: |
|
Executive Vice President and Chief Financial Officer |
|
| HOLLY APPLE HOLDINGS LLC |
|
|
| By: |
|
/s/ Atanas H. Atanasov |
| Name: |
|
Atanas H. Atanasov |
| Title: |
|
Executive Vice President and Chief Financial Officer |
|
| HOLLY ENERGY PARTNERS, L.P. |
|
|
| By: |
|
HEP LOGISTICS HOLDINGS, L.P., |
|
|
its General Partner |
|
|
| By: |
|
HOLLY LOGISTIC SERVICES, L.L.C., |
|
|
its General Partner |
|
|
| By: |
|
/s/ Michael C. Jennings |
| Name: |
|
Michael C. Jennings |
| Title: |
|
Chief Executive Officer and President |
|
| HOLLY LOGISTIC SERVICES, L.L.C. |
|
|
| By: |
|
/s/ Michael C. Jennings |
| Name: |
|
Michael C. Jennings |
| Title: |
|
Chief Executive Officer and President |
|
| HEP LOGISTICS HOLDINGS, L.P. |
|
|
| By: |
|
HOLLY LOGISTIC SERVICES, L.L.C., |
|
|
its General Partner |
|
|
| By: |
|
/s/ Michael C. Jennings |
| Name: |
|
Michael C. Jennings |
| Title: |
|
Chief Executive Officer and President |
15

Exhibit (c)(2)(A) BOARD PRESENTATION May 1, 2023 NYSE: DINO

Important Notice This presentation (this “Presentation”) was
prepared by Barclays Capital Inc. (“we” or “Barclays”), at the request of HF Sinclair Corporation (the “Company”) in the context of an evaluation of the potential acquisition by the Company of the equity interests
of Holly Energy Partners L.P. (the “Target”) not currently owned by the Company (the “Potential Transaction”). This Presentation is the intellectual property of Barclays and was prepared exclusively by Barclays in order to
assist the Company in the context of an evaluation of the Potential Transaction. The effective date of this Presentation is May 1, 2023 and it is valid only for the date specified herein. In connection with the Presentation Barclays has reviewed (a)
a comparison of the historical financial results and present financial condition of the Target and the Company with those of other companies that we deemed relevant, (b) a comparison of the financial terms of the proposed transaction with the
financial terms of certain other transactions that we deemed relevant, and (c) published estimates of independent research analysts with respect to the future financial performance and price targets of the Company and the Target. Barclays may also
have obtained information not made available by the Company, including, among other items, demographic, macroeconomic, regulatory, and market information related to the Target and its business mentioned in this Presentation from acknowledged and
reliable public sources or from sources that to Barclays’ best knowledge were considered reliable. Barclays did not conduct any independent verification of any such information or any other information received from the Company or the Target
involved in the execution of this Presentation. Barclays does not assume liability or responsibility for the precision, accuracy, or completeness of such information, nor does it express any opinion about the reliability of the information supplied
and highlights that any errors or changes in such information could significantly affect Barclays’ analysis. In addition, in preparing this Presentation, we have not conducted a physical inspection of the properties and facilities of the
Company or the Target and have not made or obtained any evaluations or appraisals of the assets or liabilities of the Company or the Target. Barclays’ work does not intend to be an audit of financial statements or any other information
supplied to us by the Company or the Target. Our work took into account the relevance of each item, and therefore assets, rights, and obligations of low relative relevance may not have been the object of detailed analysis. During the preparation of
this Presentation, Barclays has adopted as an assumption, with the express consent of the Company, the reliability, accuracy, veracity, completeness, sufficiency, and integrity of all data which was prepared or discussed, and Barclays has not made
or obtained any independent evaluation or appraisal of the assets or liabilities of the Company or the Target or their solvency and has further relied upon the assurances of the management of the Company that they are not aware of any facts or
circumstances that would make any such information inaccurate or misleading. The estimates and forecasts contained in this Presentation are inherently subject to uncertainties and various events or factors that are beyond the control of the Company
and the Target, as well as of Barclays, especially those whose occurrence depend on future and uncertain events. There is no guarantee that the estimates and projections used in this Presentation will be effectively achieved. The information herein
contained relating to the accounting and financial position of the Company, the Target and their markets, are those available as of May 1, 2023 unless otherwise stated herein. Any changes in those positions can affect the results of this
Presentation. Barclays does not assume any obligation of updating, reviewing, reaffirming or amending this Presentation, as a result of disclosure of any subsequent information after the date hereof or as result of any other subsequent event or
circumstances that may occur after the date of this Presentation. This Presentation was generated according to the economic and market conditions, among others, existing on the date of its preparation, so the conclusion presented is subject to
variations of several factors, over which Barclays does not have any control. There is no guarantee that the assumptions, estimates, forecasts, partial or total results, or conclusions used or presented in this Presentation will be effectively
reached or verified, in part or in whole. The future results of the Company and the Target may be different from the results included in the projections, and differences may be significant, as a result of several factors, including, but not limited
to, changes in the market conditions. This Presentation was prepared to assist the Company in evaluating the Target, but it does not intend to be the only reference for such evaluation, and is not in any way a guarantee in relation to the past or
future performance of the Company or the Target nor a formal appraisal, and therefore, it does not contain all the information necessary for such objective, and consequently does not represent nor constitute a proposal, solicitation, suggestion,
advice, recommendation, fairness opinion or solvency opinion by Barclays in connection with the proposed transaction referred to herein or any other transaction related to such transaction, as such decision is the sole responsibility of the Company,
and Barclays does not assume any responsibility for such decision. The Company shall make its own analysis in relation to any transaction involving the Target, and shall consult its own accounting, tax, and legal advisors before making its own
decision about such transaction. This Presentation is confidential and cannot be circulated, copied, published, reproduced or used in any form, neither can it be archived, included or referenced, in whole or in part, in any document, without the
previous written consent of Barclays. Barclays highlights that its services do not include advisory services of any nature, such as legal, tax or accounting. Barclays accepts no liability whatsoever for any losses arising from the use of this
Presentation or reliance on information contained herein. This Presentation shall be read and interpreted according to the restrictions and qualifications previously mentioned. The reader shall take into account the restrictions and characteristics
of the information sources utilized. 1

Executive Summary

Simplified Organizational Structure HF Sinclair (“DINO”)
will acquire unaffiliated units of Holly Energy Partners (“HEP”), and HEP will become an indirect, wholly owned subsidiary of DINO DINO Status Quo DINO Pro Forma DINO DINO Shareholders Shareholders HF Sinclair HF Sinclair Corporation
Corporation (DINO) (DINO) General Partner (GP) General Partner (GP) REH + Public Holly Logistics Holly Logistics Unitholders Services L.L.C. Services L.L.C. 47% 53% 100% Holly Holly Energy Energy Partners, L.P. Partners, L.P. (HEP) (HEP) $ in
millions $ in millions (1) Ownership Units $ Value Ownership Units $ Value HF Sinclair 59.6 $993 HF Sinclair 126.6 $2,109 REH Company 21.0 350 REH Company - - Pubic Unitholders 46.0 766 Pubic Unitholders - - Total 126.6 $2,109 Total 126.6 $2,109
Source: Company filing. Market data as of 4/28/2023. 1. Pro Forma $ Value assumes buy-in completed at current market price. 2

Transaction Rationale and Considerations DINO HEP ✓ Continues the
strategic imperative to integrate (Puget ✓ Potential for upfront premium creates possibility of Sound, Sinclair, HEP) immediate upside for HEP unitholders Benefits ✓ Provides flexibility in capital allocation to maximize ✓
Opportunity to participate in future growth without shareholder value reliance on 3rd party M&A and need for external funding ✓ Strong cash flow profile of combined entity would enable the company to fund growth, reduce leverage, ✓
Simplified structure provides more streamlined and/or improve shareholder returns corporate governance ✓ Synergies for interest expense✓ Larger, more diversified entity ✓ Simplifies DINO’s corporate structure and reduces
✓ Higher trading liquidity public company costs ✓ Unitholders benefit from enhanced governance rights in ✓ Simplifies and streamlines current intercompany corporate structure operations (refining units, refinery tankage),
commercial (shortfall fees, new deal structuring) and project execution ✓ Potential for DINO to receive a “step-up” and accelerated bonus depreciation to shield a portion of future taxable income at the pro forma entity ✓
No expected change to DINO credit rating O Buy-in potentially at a premium to current unit priceO Taxable transaction to HEP unitholders ConsiderationsO Loss of MLP strategic optionalityO C-corp shares received for MLP may be less
desirable for HEP investors O Potential DINO share price volatility if HEP unitholders sell DINO shares received after closeO Exposure to integrated refiner rather than midstream company O Securities law limitations on share repurchases
by DINO during pendency of transaction 3

HEP / DINO | Historical Exchange Ratio Analysis Number of DINO shares
per HEP unit “Heads-Up” Exchange Ratio (HEP / DINO) 5-Year Average 0.4435x 2-Year Average 0.4356x Current 0.3777x 1-Year Average 0.3469x Implied Premium Analysis Implied Premium / Discount to Heads-Up Historical Prices / Heads-Up
Exchange Ratio HEP DINO Exchange - 5% 10% 15% 20% 25% - 5% 10% 15% 20% 25% (1) Period ($/unit) ($/share) Ratio $16.66 $17.49 $18.33 $19.16 $19.99 $20.83 0.3777x 0.3966x 0.4155x 0.4343x 0.4532x 0.4721x Current (4/28/2023) $16.66 $44.11 0.3777x - 5.0%
10.0% 15.0% 20.0% 25.0% - 5.0% 10.0% 15.0% 20.0% 25.0% 5-Day VWAP $16.97 $44.01 0.3856x (1.8%) 3.1% 8.0% 12.9% 17.8% 22.7% (2.1%) 2.8% 7.7% 12.6% 17.5% 22.4% 10-Day VWAP $17.04 $44.40 0.3838x (2.2%) 2.6% 7.5% 12.4% 17.3% 22.2% (1.6%) 3.3% 8.2% 13.2%
18.1% 23.0% 20-Day VWAP $17.10 $45.37 0.3770x (2.6%) 2.3% 7.1% 12.0% 16.9% 21.7% 0.2% 5.2% 10.2% 15.2% 20.2% 25.2% 30-Day VWAP $17.21 $46.38 0.3711x (3.2%) 1.6% 6.5% 11.3% 16.1% 21.0% 1.8% 6.9% 11.9% 17.0% 22.1% 27.2% 60-Day VWAP $17.63 $47.94
0.3676x (5.5%) (0.8%) 4.0% 8.7% 13.4% 18.1% 2.7% 7.9% 13.0% 18.1% 23.3% 28.4% 1-Year VWAP $17.78 $51.26 0.3469x (6.3%) (1.6%) 3.1% 7.8% 12.4% 17.1% 8.9% 14.3% 19.8% 25.2% 30.7% 36.1% 2-Year VWAP $18.40 $42.25 0.4356x (9.5%) (4.9%) (0.4%) 4.1% 8.6%
13.2% (13.3%) (9.0%) (4.6%) (0.3%) 4.1% 8.4% 5-Year VWAP $19.38 $43.68 0.4435x (14.0%) (9.7%) (5.4%) (1.1%) 3.2% 7.5% (14.8%) (10.6%) (6.3%) (2.1%) 2.2% 6.4% 52-Week High $20.00 $66.19 0.3022x (16.7%) (12.5%) (8.4%) (4.2%) (0.0%) 4.1% 25.0% 31.2%
37.5% 43.7% 50.0% 56.2% Research Analyst Target $19.50 $57.00 0.3421x (14.6%) (10.3%) (6.0%) (1.7%) 2.5% 6.8% 10.4% 15.9% 21.4% 27.0% 32.5% 38.0% Source: FactSet as of 4/28/2023. 1. Calculations based on calendar days. 4 Better for HEP Better for
DINO

HEP | Relative Valuation EV / EBITDA Debt / EBITDA 2022A 2023E
2023E-2025E Debt / 2022A EBITDA 1.8% 2.5% 8.7% 3.2% 2.0% EBITDA CAGR Median: 4.0x 3.8x 6.0x Debt / 2023E EBITDA 5.4x 2023E 2024E 2025E EV / 2023E EBITDA Median: 8.9x 8.2x 8.0x 5.0x EV / 2024E EBITDA 12.0x 4.3x 4.5x 4.3x 10.5x 10.2x 10.0x EV / 2025E
EBITDA 9.6x 4.0x 10.0x 3.8x 3.5x 3.5x 3.2x 3.4x 8.5x 8.2x 8.4x 8.3x 8.1x 7.9x 8.1x 3.2x 8.1x 7.6x 7.8x 7.8x 8.0x 3.0x 6.0x 2.0x 4.0x 1.0x 2.0x 0.0x 0.0x Latest Quarterly Distribution Yield Levered FCF Yield LQA DCF 2023E Levered FCF Yield 2023E
2024E 2025E 1.9x 2.0x 1.2x 2.2x 1.6x Coverage Median: 11.7% 14.9% 15.0% 2024E Levered FCF Yield 20% 12.0% Median: 8.5% 17.0% 2025E Levered FCF Yield 16.6% 16.4% 10.0% 15.4% 15.1% 14.7% 15.0% 15.1% 15.0% 15% 8.7% 8.4% 9.0% 8.3% 12.9% 7.5% 10.8% 10.4%
10.6% 9.6% 10% 6.0% 5% 3.0% NA 0.0% 0% Source: Public filings, FactSet, and Wall Street research as of 4/28/2023. 5

DINO | Relative Valuation EV / EBITDA (EV / EBITDA) 2023E 2024E 2025E EV
/ 2023E EBITDA EV / 2024E EBITDA Median: 4.3x 5.3x 6.5x EV / 2025E EBITDA 7.6x 7.0x 7.0x 8.0x 6.6x 6.5x 6.0x 5.8x 5.7x 5.7x 5.3x 5.2x 5.1x 6.0x 4.9x 4.9x 4.6x 4.4x 4.5x 4.3x 3.8x 3.7x 3.5x 4.0x 3.0x 2.4x 1.8x 2.0x 0.0x (1) (2) Price / Parent CFPS
(Price / Parent CFPS) 2023E 2024E 2025E Price / 2023E Parent CFPS Median: 3.2x 3.4x 4.5x Price / 2024E Parent CFPS Price / 2025E Parent CFPS 7.2x 8.0x 6.2x 6.0x 5.7x 5.5x 5.4x 5.3x 6.0x 5.1x 4.7x 4.5x 4.6x 4.5x 4.4x 4.3x 4.2x 3.9x 3.7x 3.3x 3.4x
3.4x 4.0x 3.2x 3.0x 1.9x 2.0x 2.0x 0.0x (1) Consolidated Debt / 1.1x 1.7x 1.7x 3.3x 1.6x 0.8x 1.1x 0.6x (3) 2023E EBITDA Consolidated Net Debt / 2023E 0.6x 1.2x 1.0x 2.4x 1.1x 0.5x 0.7x (0.1)x (4) EBITDA Source: Company filings, FactSet, and Wall
Street research as of 4/28/2023. Reflects median Wall Street research consensus estimates. 1. PSX / DCP PF for DCP shares acquisition funded by cash and debt; assume $2bn of cash and $1.8bn of debt used to maintain investment grade credit rating;
PSX financials consolidate DCP Midstream Class A segment. 2. Adj. CFPS is adjusted to remove third-party distributions to unaffiliated MLP public unitholders. Adj. CFPS based on Adj. CFFO per share based on shares outstanding from Management
projections. Remaining peers calculated from median consensus. 3. Calculated as current Consolidated Debt / Projected Consolidated EBITDA. 4. Calculated as Consolidated Debt less Cash / Projected Consolidated EBITDA. 6

Selected Precedent Transactions Selected MLP Buy-in Transactions Total
Initial Initial Premium Paid Premium Paid - (2) (3) Announced Transaction Enterprise Value Price Premium Final (Days Prior to Initial Ann.) (Days Prior to Final Ann.) EV / FY+1 30-Day 30-Day (1) Date Acquirer Target Value ($MM) Acquirer Target
Offered Offered Price 1-Day 1-Day EBITDA Consideration Process VWAP VWAP 8/17/2022 $3,783 $68,412 $14,229 $34.75 0.0% $41.75 20.1% 24.0% 6.2% 8.2% 8.4x 100% Cash Ann. then Negotiate (4) 7/28/2022 $579 $7,229 $1,690 $15.14 13.4% $17.66 32.3% 11.0%
(3.4%) 9.9% 7.3x Cash and Unit Exchange Ann. then Negotiate 7/6/2022 $131 NA $824 $17.90 (0.3%) $25.00 39.3% 42.8% 2.8% 8.6% 10.3x 100% Cash Ann. then Negotiate 4/22/2022 $400 NA $595 $3.32 0.9% $4.65 41.3% 42.7% 40.9% 40.7% 11.1x 100% Cash Ann.
then Negotiate (5) 2/11/2022 $2,608 $237,598 $9,749 $12.89 0.0% $15.85 23.0% 23.5% 9.6% 11.6% 12.6x 100% Cash Ann. then Negotiate 10/27/2021 $3,466 $16,829 $13,076 $32.57 0.0% $41.11 4.8% 7.6% 4.8% 7.6% 9.7x 100% Unit Exchange Negotiate then Ann.
(6) 8/5/2021 $874 $126,182 $1,694 $13.01 0.0% $15.12 16.2% 8.9% 17.1% 17.2% 9.7x 100% Unit Exchange Ann. then Negotiate (7) 2/5/2021 $1,149 $201,401 $2,872 $12.47 0.0% $14.56 16.7% 18.7% (3.3%) 5.8% 7.4x 100% Unit Exchange Ann. then Negotiate (8)
10/5/2020 $2,829 $74,892 $3,361 $27.31 5.4% $30.95 19.5% 15.1% 0.6% (0.7%) 10.1x 100% Unit Exchange Ann. then Negotiate 7/27/2020 $693 $4,419 $1,312 $8.38 4.5% $8.47 28.1% 29.1% 28.1% 29.1% 7.3x 100% Unit Exchange Negotiate then Ann. 11/26/2018 $536
NA $1,246 $38.00 4.4% $41.00 12.6% 9.5% 12.6% 9.5% 10.6x 100% Cash Negotiate then Ann. 11/8/2018 $8,965 $7,251 $12,230 $43.77 5.0% $50.33 7.6% 14.3% 7.6% 14.3% 11.2x 100% Unit Exchange Negotiate then Ann. 10/18/2018 $1,850 $50,344 $3,660 $40.00
10.7% $42.25 6.0% 10.2% 6.0% 10.2% 10.2x 100% Cash Negotiate then Ann. 9/19/2018 $2,634 $86,611 $6,683 $17.75 0.0% $18.22 2.6% 8.8% 0.5% 1.0% 29.6x 100% Unit Exchange Ann. then Negotiate (9) 8/1/2018 $60,345 $26,932 $80,353 $21.32 5.0% $23.59 11.2%
17.5% 11.2% 17.5% 7.0x 100% Unit Exchange Negotiate then Ann. (10) 5/29/2018 $300 $5,332 $3,262 $21.86 (1.1%) $21.86 (1.1%) 9.2% (1.1%) 9.2% 6.2x 100% Unit Exchange Tender Offer (11) 5/17/2018 $4,779 $123,056 $27,256 $33.10 0.0% $40.00 20.8% 18.4%
5.7% 6.8% 14.3x 100% Unit Exchange Ann. then Negotiate (12) 5/17/2018 $10,010 $121,978 $14,694 $10.08 0.0% $11.48 13.9% 16.4% 2.1% 0.3% 10.1x 100% Unit Exchange Ann. then Negotiate 5/17/2018 $15,105 $29,816 $55,383 $36.94 5.2% $40.89 6.4% 11.2% 6.4%
11.2% 11.8x 100% Unit Exchange Negotiate then Ann. 3/27/2018 $3,224 $3,418 $4,942 $41.34 (0.5%) $35.42 0.6% (8.1%) 0.6% (8.1%) 6.3x 100% Unit Exchange Negotiate then Ann. Source: Price data per FactSet. Transaction value and consideration paid based
on public filings, company press releases, and investor presentations. 1. Transaction value includes only un-affiliated and proportional net debt. 2. Premium paid to initial announcement represents the premium based on the final agreed upon price
relative to the original offer’s unaffected date. 3. Premium paid to final announcement represents the premium based on the final agreed upon price relative to the final announcement’s unaffected date. 4. Initial price offered not yet
disclosed. Transaction value and premium reflect unaffected DINO price as of 7/27/2022. Initial announcement date reflects filing of Schedule 13D/A on June 24, 2022. 5. Shell / Shell Midstream Partners LP based on revised offer announced 7/25/2022.
Premium paid based on closing price prior to original announcement on 2/11/2022. 6. BP / BP Midstream Partners LP based on revised offer announced 12/20/2021. Premium paid based on closing price prior to original announcement on 8/4/2021. 7. Chevron
/ Noble Midstream Partners based on revised offer announced 3/5/2021. Premium paid based on closing price prior to original announcement on 2/4/2021. 8. TC Energy / TC Pipeline based on revised offer announced 12/15/2020. Premium paid based on
closing price prior to original announcement on 10/5/2020. 9. Dominion Energy / Dominion Energy Midstream based on revised offer announced 11/23/2018. Premium paid based on closing price prior to original announcement on 9/8/2018. 10. Reflects the
5/29/18 exchange offer; CVI announced it would exercise the call right on 1/17/19. 11. Enbridge / Spectra premiums based on revised offer announced on 8/24/2018. Enbridge price performance based on original announcement on 5/17/2018. 12. Enbridge /
Enbridge Energy Partners based on revised offer announced 9/18/2018. Enbridge price performance based on original announcement on 5/17/2018. 7

Selected Precedent Transactions (Cont’d) Selected MLP Buy-in
Transactions Total Initial Initial Premium Paid Premium Paid (2) (3) Announced Transaction Enterprise Value Price Premium Final EV / FY+1 (Days Prior to Initial Ann.) (Days Prior to Final Ann.) 30-Day 30-Day (1) Date Acquirer Target Value ($MM)
Acquirer Target Offered Offered Price 1-Day 1-Day EBITDA Consideration Process VWAP VWAP 11/8/2017 $173 $3,189 $845 $11.80 3.0% $13.92 3.0% 11.5% 3.0% 11.5% 4.6x 100% Unit Exchange Negotiate then Ann. 8/29/2017 $736 NA $736 $14.50 0.4% $16.50 15.2%
12.4% 15.2% 12.4% 12.3x 100% Cash Negotiate then Ann. 5/18/2017 $651 NA $963 $20.00 20.1% $20.00 20.1% 20.4% 20.1% 20.4% 12.3x 100% Cash Tender Offer 4/4/2017 $157 NA $594 $16.80 5.8% $17.30 5.8% 5.6% 5.8% 5.6% 9.1x 100% Cash Tender Offer 3/2/2017
$781 NA $1,470 $18.75 1.9% $19.50 6.0% 5.6% 4.3% 3.4% 9.3x 100% Cash Ann. then Negotiate 1/27/2017 $1,656 $77,129 $1,656 $6.25 (4.6%) $8.00 (8.6%) 1.8% (8.6%) 1.8% 11.0x 100% Cash Negotiate then Ann. 11/1/2016 $5,180 $77,381 $9,684 $15.75 2.9%
$17.00 11.1% 16.0% 6.3% 5.2% 18.0x 100% Cash Ann. then Negotiate Selected MLP Transactions From 2016 - 2023 YTD Mean 3.0% 13.9% 15.0% 7.5% 10.0% 10.7x Median 0.9% 12.6% 12.4% 5.8% 9.2% 10.1x High 20.1% 41.3% 42.8% 40.9% 40.7% 29.6x Low (4.6%) (8.6%)
(8.1%) (8.6%) (8.1%) 4.6x Selected 100% Stock MLP Transactions From 2016 - 2023 YTD Mean 1.9% 10.8% 12.8% 6.0% 8.8% 10.4x Median 0.0% 9.4% 12.9% 3.9% 8.4% 9.7x High 5.4% 28.1% 29.1% 28.1% 29.1% 29.6x Low (1.1%) (1.1%) (8.1%) (3.3%) (8.1%) 4.6x
Source: Price data per FactSet. Transaction value and consideration paid based on public filings, company press releases, and investor presentations. 1. Transaction value includes only un-affiliated and proportional net debt. 2. Premium paid to
initial announcement represents the premium based on the final agreed upon price relative to the original offer’s unaffected date. 8

HEP | Indicative Purchase Price Ratio Analysis Indicative Purchase
Price Ratio Analysis (1) DINO SQ ($ in millions, except per share data) HEP SQ Premium to HEP 12/31/22 12/31/22 5% 10% 15% 20% 25% Price as of 4/28/23 $44.11 $16.66 $17.49 $18.33 $19.16 $19.99 $20.83 Common Shares / Units Outstanding 196.0 126.6
126.6 126.6 126.6 126.6 126.6 Total Equity Value $8,648 $2,109 $2,215 $2,320 $2,426 $2,531 $2,636 Total Debt (Consolidated) 3,276 1,568 1,568 1,568 1,568 1,568 1,568 Preferred Equity - 61 61 61 61 61 61 Non-Controlling Interest 1,113 70 70 70 70 70
70 Cash (Consolidated) (1,565) (11) (11) (11) (11) (11) (11) Enterprise Value $11,471 $3,796 $3,902 $4,007 $4,113 $4,218 $4,324 REH Owned Units 21.0 21.0 21.0 21.0 21.0 21.0 Total Value of REH Owned Units $350 $367 $385 $402 $420 $437 Public Units
Outstanding 46.0 46.0 46.0 46.0 46.0 46.0 Total Value of Public Units $766 $804 $842 $881 $919 $957 Total Value of Unaffiliated Units $1,116 $1,171 $1,227 $1,283 $1,339 $1,395 Implied Exchange Ratio 0.3777x 0.3966x 0.4155x 0.4343x 0.4532x 0.4721x
Precedent Premium Median Mean Premium / Discount to: Current (4/20/2023) - - 5.0% 10.0% 15.0% 20.0% 25.0% 12.6% 13.9% 52-Week High (33.4%) (16.7%) (12.5%) (8.4%) (4.2%) (0.0%) 4.1% Research Analyst Target (22.6%) (14.6%) (10.3%) (6.0%) (1.7%) 2.5%
6.8% Trading Comparables (1) (2) (2) DINO SQ HEP SQ Peer Peer Transaction Median Mean Comparables Enterprise Value as a Multiple of: Data Data EBITDA 2023E 3,007 3.8x $446 8.5x 8.7x 9.0x 9.2x 9.5x 9.7x 8.9x 9.1x 10.1x 2024E 2,513 4.6x 471 8.1x 8.3x
8.5x 8.7x 8.9x 9.2x 8.2x 8.6x 2025E 2,338 4.9x 463 8.2x 8.4x 8.7x 8.9x 9.1x 9.3x 8.0x 8.4x Equity Value as a Multiple of: Earnings per Share 2023E $8.32 5.3x $2.04 8.2x 8.6x 9.0x 9.4x 9.8x 10.2x 10.7x 11.3x 2024E 6.92 6.4x 2.26 7.4x 7.7x 8.1x 8.5x
8.8x 9.2x 9.6x 10.3x 2025E 5.25 8.4x 2.15 7.7x 8.1x 8.5x 8.9x 9.3x 9.7x 9.9x 10.5x Yield Analysis: Dividends LQA $1.80 4.1% $1.40 8.4% 8.0% 7.6% 7.3% 7.0% 6.7% 8.5% 8.6% 2023E 1.80 4.1% 1.55 9.3% 8.9% 8.5% 8.1% 7.8% 7.4% 2024E 1.89 4.3% 1.75 10.5%
10.0% 9.5% 9.1% 8.8% 8.4% 2025E 1.98 4.5% 1.86 11.2% 10.6% 10.1% 9.7% 9.3% 8.9% YE Leverage Total Debt / EBITDA 2022A $3,276 0.7x $1,568 3.8x 3.8x 3.8x 3.8x 3.8x 3.8x 4.0x 4.2x 2023E 3,276 1.1x 1,568 3.5x 3.5x 3.5x 3.5x 3.5x 3.5x 3.8x 3.8x Source:
Projections and balance sheet data per company filings, FactSet and Wall Street research. Market data as of 4/28/2023. Balance sheet as of 12/31/2022. 1. Pro-forma for DINO’s ~$100mm share repurchases from REH announced on 3/2/2023. 2. Peers
include DKL, MMP, NS and PAA. 9

Investor Overlap Analysis | DINO vs. HEP REH and Invesco are the only
investors with material holdings in both DINO and HEP DINO – Top 20 Shareholders HEP – Top 20 Unitholders Shares Held Mkt. Val. Units Held Mkt. Val. (000s) Held ($mm) % O/S (000s) Held ($mm) % O/S Institution Institution REH Co. 34,828
1,536.3 17.8% Hf Sinclair Corp 59,630 $993.4 47.1% The Vanguard Group, Inc. 13,935 614.7 7.1% REH Co. 21,026 350.3 16.6% Turtle Creek Management LLC 12,308 542.9 6.3% ALPS Advisors, Inc. 6,830 113.8 5.4% BlackRock Fund Advisors 11,945 526.9 6.1%
Global X Management Co. LLC 4,605 76.7 3.6% Fidelity Management & Research Co. LLC 7,992 352.5 4.1% Energy Income Partners LLC 3,750 62.5 3.0% Capital Research & Management Co. (World Investors) 7,292 321.7 3.7% Invesco Advisers, Inc. 3,216
53.6 2.5% SSgA Funds Management, Inc. 6,749 297.7 3.4% Harvest Fund Advisors LLC 3,133 52.2 2.5% Dimensional Fund Advisors LP 5,849 258.0 3.0% ClearBridge Investments LLC 1,115 18.6 0.9% LSV Asset Management 5,209 229.8 2.7% Morgan Stanley
(Strategic Investments) 1,032 17.2 0.8% First Trust Advisors LP 2,736 120.7 1.4% JPMorgan Securities LLC (Investment Management) 708 11.8 0.6% AllianceBernstein LP 2,437 107.5 1.2% Goldman Sachs Asset Management LP 680 11.3 0.5% Geode Capital
Management LLC 1,926 85.0 1.0% UBS Financial Services, Inc. 660 11.0 0.5% Norges Bank Investment Management 1,865 82.3 1.0% The Bollard Group LLC 609 10.2 0.5% Zimmer Partners LP 1,856 81.9 0.9% Eagle Global Advisors LLC 583 9.7 0.5% Acadian Asset
Management LLC 1,837 81.0 0.9% Goldman Sachs & Co. LLC (Private Banking) 554 9.2 0.4% Parametric Portfolio Associates LLC 1,691 74.6 0.9% Strategic Income Management LLC 493 8.2 0.4% Pacer Advisors, Inc. 1,612 71.1 0.8% Infrastructure Capital
Advisors LLC 435 7.3 0.3% Millennium Management LLC 1,496 66.0 0.8% Arkfeld Wealth Strategies LLC 432 7.2 0.3% Invesco Capital Management LLC 1,349 59.5 0.7% CIBC Private Wealth Advisors, Inc. 408 6.8 0.3% Principal Global Investors LLC 1,234 54.4
0.6% Miller/Howard Investments, Inc. 295 4.9 0.2% Top 20 Shareholders 126,146 $5,564.4 64.3% Top 20 Unitholders 110,195 $1,835.9 87.0% Top 20 Shareholder Overlap (DINO shares owned by HEP unitholders) 18.5% Top 20 Unitholder Overlap (HEP units owned
by DINO shareholders) 19.1% Top 20 Shareholder Overlap Excl. REH (DINO shares owned by HEP unitholders) 0.7% Top 20 Unitholder Overlap Excl. REH (HEP units owned by DINO shareholders) 2.5% Source: FactSet as of 4/28/2023. Note: Shading represents
shareholder overlap. Shareholder summary includes only common share ownership and excludes economic ownership or exposure through derivatives contracts. 10

Appendices

DINO / HEP | Historical Exchange Ratio Analysis Number of HEP units per
DINO share “Heads-Up” Exchange Ratio (DINO / HEP) 1-Year Average 2.8829x Current 2.6477x 2-Year Average 2.2958x 5-Year Average 2.2547x Implied Premium Analysis Implied Premium / Discount to (2) Heads-Up HEP Historical Prices / Heads-Up
Exchange Ratio DINO HEP Exchange - 5% 10% 15% 20% 25% - 5% 10% 15% 20% 25% (1) Period ($/share) ($/unit) Ratio $16.66 $17.49 $18.33 $19.16 $19.99 $20.83 2.6477x 2.5216x 2.4070x 2.3023x 2.2064x 2.1181x Current (4/28/2023) $44.11 $16.66 2.6477x - 5.0%
10.0% 15.0% 20.0% 25.0% - 5.0% 10.0% 15.0% 20.0% 25.0% 5-Day VWAP $44.01 $16.97 2.5933x (1.8%) 3.1% 8.0% 12.9% 17.8% 22.7% (2.1%) 2.8% 7.7% 12.6% 17.5% 22.4% 10-Day VWAP $44.40 $17.04 2.6053x (2.2%) 2.6% 7.5% 12.4% 17.3% 22.2% (1.6%) 3.3% 8.2% 13.2%
18.1% 23.0% 20-Day VWAP $45.37 $17.10 2.6525x (2.6%) 2.3% 7.1% 12.0% 16.9% 21.7% 0.2% 5.2% 10.2% 15.2% 20.2% 25.2% 30-Day VWAP $46.38 $17.21 2.6944x (3.2%) 1.6% 6.5% 11.3% 16.1% 21.0% 1.8% 6.9% 11.9% 17.0% 22.1% 27.2% 60-Day VWAP $47.94 $17.63
2.7201x (5.5%) (0.8%) 4.0% 8.7% 13.4% 18.1% 2.7% 7.9% 13.0% 18.1% 23.3% 28.4% 1-Year VWAP $51.26 $17.78 2.8829x (6.3%) (1.6%) 3.1% 7.8% 12.4% 17.1% 8.9% 14.3% 19.8% 25.2% 30.7% 36.1% 2-Year VWAP $42.25 $18.40 2.2958x (9.5%) (4.9%) (0.4%) 4.1% 8.6%
13.2% (13.3%) (9.0%) (4.6%) (0.3%) 4.1% 8.4% 5-Year VWAP $43.68 $19.38 2.2547x (14.0%) (9.7%) (5.4%) (1.1%) 3.2% 7.5% (14.8%) (10.6%) (6.3%) (2.1%) 2.2% 6.4% 52-Week High $66.19 $20.00 3.3095x (16.7%) (12.5%) (8.4%) (4.2%) (0.0%) 4.1% 25.0% 31.2%
37.5% 43.7% 50.0% 56.2% Research Analyst Target $57.00 $19.50 2.9231x (14.6%) (10.3%) (6.0%) (1.7%) 2.5% 6.8% 10.4% 15.9% 21.4% 27.0% 32.5% 38.0% Source: FactSet as of 4/28/2023. 1. Calculations based on calendar days. 2. Exchange ratio calculated
as DINO prices divided by the product of premium %s and HEP prices. 11 Better for DINO Better for HEP

HEP / DINO | Relative Trading Performance Trading Performance: Last
Twelve Months Recent Trading HEP Peer DINO Peer AMZ MLP (1) Performance Median Median Index 30-Day (10.2%) (5.1%) (4.9%) 2.7% 3.7% 4.6% 3.2% (16.3%) 1.8% 45-Day (6.3%) (8.1%) (10.8%) 1.3% 5.0% 4.5% 2.9% (10.3%) 1.4% YTD (15.0%) (8.1%) 3.9% 0.5%
11.1% 9.7% 6.8% (9.6%) 2.9% 14.7% Last Twelve Months (6.1%) (7.8%) 3.4% 9.2% 20.6% 6.3% 13.5% 5.5% (Indexed Price Performance) 180% 170% 160% 150% 140% 130% DINO: 14.7% (2) 120% DINO Peers: 13.5% (3) HEP Peers: 110% 6.3% AMZ: 5.5% 100% HEP: (6.1)%
90% 80% 4/28/2022 6/7/2022 7/18/2022 8/27/2022 10/7/2022 11/16/2022 12/27/2022 2/5/2023 3/18/2023 4/28/2023 DINO HEP HEP Peers DINO Peers AMZ Source: FactSet as of 4/28/2023. 1. Represents calendar days. 2. DINO Peers include CVI, DK, MPC, PARR,
PBF, PSX and VLO. 3. HEP Peers include DKL, MMP, NS and PAA. 12

HEP | Unitholder Cost Basis Unit Price Histogram: Last 12 Months
Average Daily Volume 161,424 VWAP Current (4/28/2023) $17.78 Total Volume ('000s) 40,679 $16.66 Units Outstanding Traded (x) 0.3x 12-Month High $20.00 40% 29.2% 27.6% 30% 20.4% 20% 12.1% 7.6% 10% 2.0% 1.1% 0% $15.00 - $15.80 $15.81 - $16.60 $16.61 -
$17.40 $17.41 - $18.20 $18.21 - $19.00 $19.01 - $19.80 $19.81 - $20.60 Volume ('000) 0.8 4.9 8.3 11.2 11.9 3.1 0.4 % Units Traded 2.0% 12.1% 20.4% 27.6% 29.2% 7.6% 1.1% Cumulative 2.0% 14.0% 34.5% 62.1% 91.3% 98.9% 100.0% Unit Price Histogram: Last
6 Months Average Daily Volume 146,878 VWAP Total Volume ('000s) 18,360 $18.24 6-Month High Units Outstanding Traded (x) 0.1x Current (4/28/2023) $19.72 $16.66 60% 41.3% 33.7% 40% 12.4% 12.5% 20% 0.0% 0.0% 0.0% 0% $15.00 - $15.80 $15.81 - $16.60
$16.61 - $17.40 $17.41 - $18.20 $18.21 - $19.00 $19.01 - $19.80 $19.81 - $20.60 Volume ('000) - - 2.3 6.2 7.6 2.3 - % Units Traded - - 12.4% 33.7% 41.3% 12.5% - Cumulative - - 12.4% 46.1% 87.5% 100.0% 100.0% Source: FactSet as of 4/28/2023. Units
Outstanding Traded based on HEP common units outstanding per public filings. 13 Trading Volume as a Trading Volume as a % of Total % of Total

HEP | Equity Analyst Price Targets (1) (2) Research Price Targets
Premium / (Discount) % to Current Price Price Targets ($ / share) Median Analyst Target Price Premium / (Discount) to: Current Price 17% Current: $55.80 $70.00 0.35 Current: $58.00 0.3 $60.00 $47.03 Current: $16.08 Current: 0.25 $48.00 $50.00 20%
$12.90 0.2 16% $40.00 14% 0.15 12% Median Price $30.00 8% Target: 0.1 $23.00 $19.50 $20.00 $19.00 $18.00 $20.00 4% 2% 0.05 $15.00 $18.00 Current $10.00 HEP: 0 $16.66 $0.00 -0.05 1 2 3 4 5 6 7 8 Analyst 1 Analyst 2 Analyst 3 Analyst 4 4/5/2023
4/3/2023 3/6/2023 2/24/2023 Analyst Recommendation 0 1 3 2 Buy ✓ 1 3 3 4 Hold ~ 0 1 0 0 Sell OO 1 5 6 6 Source: FactSet as of 4/28/2023. 1. Includes available reports from reputable brokers since Q4’22 earnings release that have
provided a price target. 2. Peer group price targets reflect average analyst price target. 14

DINO | Equity Analyst Price Targets (1) (2) Research Price Targets
Premium / (Discount) % to Current Price Price Targets ($ / share) Median Analyst Target Price Premium / (Discount) to: Current Price 29% Current: Current: Current: Current: Current: Current: Current: $122.00 $99.00 $114.67 $26.34 $21.75 $34.86
$23.43 $150.00 $123.00 $159.00 0.7 $80.00 $73.00 $68.00 $70.00 65% $66.00 0.6 Median Analyst: $57.00 $60.00 $56.00 $55.00 $57.00 0.5 54% $52.00 50% $50.00 41% $47.00 $50.00 39% 0.4 35% Current $40.00 DINO: $32.00 $33.00 0.3 $44.11 24% 23% $27.00
$30.00 29% Peers 24% Median: 0.2 25% 27% 21% 24% $20.00 13% 18% 0.1 $10.00 0 $0.00 Analyst 1 Analyst 2 Analyst 3 Analyst 4 Analyst 5 Analyst 6 Analyst 7 Analyst 8 4/19/23 4/18/23 4/17/23 4/13/23 4/12/23 4/12/23 4/10/23 4/7/23 Analyst Recommendation
9 6 9 0 1 3 3 Buy ✓✓✓✓✓✓ 2 4 2 2 5 4 1 Hold ~ ~ 0 0 0 0 2 0 0 Sell Source: FactSet as of 4/28/2023. 11 10 11 2 8 7 4 1. Includes available reports from reputable brokers since Q4’22 earnings release
that have provided a price target. 2. Peer group price targets reflect average analyst price target. 15

DINO | Comparable Companies Comparable Company ($ in millions, except
per share values) (2) (3) (4) (5) (6) HF Sinclair Marathon Phillips 66 PBF Energy Par Pacific Valero CVR Energy Delek Peer Median Stock Price as of 4/28/2023 $44.11 $122.00 $99.00 $114.67 $34.86 $26.34 $21.75 $23.43 Diluted Shares Outstanding 196
449 469 386 133 103 70 62 Total Equity Value $8,648 $54,762 $46,402 $44,208 $4,626 $2,708 $1,513 $1,454 Total Debt 3,276 28,680 20,185 11,719 1,470 1,598 3,121 550 Cash 1,565 11,770 5,083 4,862 1,646 510 864 215 Net Debt 1,711 16,910 15,102 6,857
(176) 1,088 2,257 335 (1) Minority Interest 1,113 12,373 -- -- -- 597 435 -- Enterprise Value $11,471 $84,045 $61,504 $51,065 $4,450 $4,394 $4,205 $1,788 Enterprise Value to: 2023E EBITDA 3.8x 4.9x 5.1x 3.7x 1.8x 4.3x 4.4x 3.5x 4.3x 2024E EBITDA
4.6x 7.0x 6.0x 5.2x 2.4x 5.3x 5.8x 4.5x 5.3x 2025E EBITDA 4.9x 7.6x 6.6x 6.5x 3.0x 5.7x 7.0x 5.7x 6.5x 2023E EBIT 5.0x 6.1x 6.2x 4.5x 2.3x 5.8x 6.4x 5.2x 5.8x 2024E EBIT 6.0x 9.4x 7.3x 7.3x 3.1x 7.5x 9.9x 8.0x 7.5x 2025E EBIT 6.6x 10.1x 7.7x 9.3x
4.1x 8.1x 15.2x 8.5x 8.5x Equity Value to: 2023E CFFO 4.0x 3.9x 5.3x 3.7x 2.0x 3.4x 1.9x 3.2x 3.4x 2024E CFFO 4.2x 5.0x 5.5x 4.7x 3.0x 4.5x 3.0x 4.4x 4.5x 2025E CFFO 4.7x 5.2x 6.2x 5.4x 3.4x 7.2x 3.6x 4.6x 5.2x 2023E Net Income 5.3x 5.9x 6.6x 4.9x
3.4x 6.9x 4.8x 4.1x 4.9x 2024E Net Income 6.4x 9.4x 7.5x 7.8x 4.8x 11.3x 12.8x 6.5x 7.8x 2025E Net Income 8.4x 11.5x 8.7x 9.9x 6.7x 13.1x N/M 7.5x 9.3x Source: Company filings, FactSet, Wall Street research and investor presentations as of
4/28/2023. 1. Reflects market value of public interest in MLP. Does not include preferred equity held by subsidiaries. 2. PF for DINO’s ~$100mm share repurchases from REH announced on 3/2/2023. 3. Reflects MPLX's senior notes issuance ($1.1
billion aggregate) announced on February 2, 2023. 4. Reflects PSX's buy-in of DCP announced on January 6, 2023. 5. Reflects redemption of all $525 million outstanding HEP 2023 Senior Notes announced on February 2, 2023; reflects DINO Energy's Class
A share repurchases through February 16, 2023. 6. Reflects PARR's acquisition of ExxonMobil Billings Refinery announced on October 20, 2022; reflects issuance of $550 million senior secured Term Loan B facility due 2030 and refinancing of existing
term loan B and outstanding senior secured notes announced on March 1, 2023. 16

HEP | Comparable Companies Trading Comparables ($ in millions except
per unit data) Peer Median Unit Price as of 4/28/23 $16.66 $47.03 $16.08 $55.80 $12.90 % of 52-week high (Close) 83% 75% 93% 99% 96% 95% Fully Diluted Units Outstanding 127 44 111 203 698 Total Equity Value $2,109 $2,049 $1,783 $11,344 $9,009 Debt
1,568 1,674 3,276 5,032 8,092 Preferred Equity 61 - 1,199 - 2,666 Noncontrolling Interest 70 - - - - Cash (11) (8) ( 14) (9) ( 272) Enterprise Value $3,796 $3,715 $6,243 $16,367 $19,495 Enterprise Value / 2023E EBITDA 8.5 x 9.6 x 8.3 x 10.5 x 8.1 x
8.9 x 2024E EBITDA 8.1 x 8.4 x 7.9 x 10.2 x 7.6 x 8.2 x 2025E EBITDA 8.2 x 8.1 x 7.8 x 10.0 x 7.8 x 8.0 x Valuation Metrics LQA Yield 8.40% 8.68% 9.95% 7.51% 8.29% 8.48% 2023E Yield 9.30% 8.80% 9.95% 7.54% 8.29% 8.55% 2024E Yield 10.50% 9.12% 9.95%
7.62% 9.46% 9.29% 2025E Yield 11.16% 9.72% 9.95% 7.69% 10.62% 9.83% 2023E DCF Yield 15.48% 14.55% 21.05% 10.78% 18.66% 16.61% 2024E DCF Yield 16.74% 16.87% 21.48% 11.19% 20.62% 18.75% 2025E DCF Yield 15.80% NA 21.69% 11.50% 20.21% 20.21% 2023E FCF
Yield 15.10% 10.55% 12.92% 9.61% 15.05% 11.74% 2024E FCF Yield 16.36% 15.01% 14.75% 10.43% 17.02% 14.88% 2025E FCF Yield 15.42% NA 14.96% 10.75% 16.60% 14.96% 2023E EPS $2.04 $4.81 $1.14 $5.03 $1.25 $4.81 2024E EPS 2.26 5.52 1.20 5.26 1.50 5.20
2025E EPS 2.15 4.90 1.22 5.42 1.45 4.90 Coverage 2023E Coverage 1.66 x 1.65 x 2.12 x 1.43 x 2.25 x 1.88 x 2024E Coverage 1.59 x 1.85 x 2.16 x 1.47 x 2.18 x 2.00 x 2025E Coverage 1.42 x NA 2.18 x 1.50 x 1.90 x 1.90 x Credit Statistics Debt / 2022A
EBITDA 3.8 x 5.4 x 4.5 x 3.5 x 3.2 x 4.0 x Debt / 2023E EBITDA 3.5 x 4.3 x 4.3 x 3.2 x 3.4 x 3.8 x Source: Company filings, FactSet, and Wall Street research. Note: Market data as of 4/28/2023. Balance sheet data as of 12/31/2022. 17

Disclaimer The preceding pages contain material that was provided to
the Board of Directors (the “Board”) of HF Sinclair Corporation (the “Company”) by Barclays Capital Inc. (“Barclays”). The accompanying material and any Barclays presentation related to the material was compiled
or prepared on a confidential basis solely for consideration by the Board and no part of it may be reproduced, distributed or transmitted without the prior written consent of Barclays. The information contained in this material was obtained from the
Company and/or publicly available sources, and Barclays has relied upon such information without independent verification thereof and does not assume any liability for any such information. These materials are being provided in connection with an
actual corporate engagement and may not be used or relied upon for any purpose other than as specifically contemplated by a written agreement with Barclays. Moreover, any information provided herein was not prepared for or intended for use by any
individual for personal, family or household purposes. Any estimates, historical financial information, projections and other information contained herein have been prepared by management of the Company or were obtained from publicly available
sources (approved for Barclays’ use by the Company) or are based upon such estimates and projections. With respect to such estimates and projections, Barclays has assumed that they have been reasonably prepared on a basis reflecting the best
currently available estimates, projections and judgment of the management of the Company. The projections contained herein may or may not be achieved and differences between projected results and those actually achieved may be material. No
representation or warranty, expressed or implied, is made as to the accuracy or completeness of such information and nothing contained herein is, or shall be relied upon as, a promise or representation, whether as to the past or the future. The
analysis contained herein is based on current market conditions which are subject to change and Barclays assumes no obligation to update or otherwise revise these materials. Nothing in these materials shall be deemed to constitute a recommendation
or investment, legal, tax, financial, accounting or other advice. Because these materials were prepared for use in the context of a presentation to the Board, these materials are incomplete without reference to, and should be assessed solely in
conjunction with, the oral briefing provided by Barclays to the Board (in their capacity as directors and not in any individual capacity and is not for the benefit of any individual, including any individual officer, director, shareholder or any
other person). These materials were not prepared for or intended for use by any individual for personal, family or household purposes nor were they prepared to comply with the disclosure standards under state and federal securities laws or any other
applicable laws and, to the extent the material may be considered by readers not as familiar with the business and affairs of the Company as the Board, none of the Company, Barclays, their respective affiliates or any of their respective legal or
financial advisors or accountants takes any responsibility for the accuracy or completeness of any of the material if used by persons other than the Board. These materials are not intended to provide the sole basis for evaluation of the proposed
corporate transaction and do not purport to contain all information that may be required and should not be considered a recommendation with respect to the proposed corporate transaction. Barclays has not made or obtained any evaluations or
appraisals of the assets or liabilities of the Company or any other party to any corporate transaction or any of their respective affiliates and has no obligation to evaluate the solvency of the Company or any other party to any transaction under
any state or federal laws relating to bankruptcy, insolvency or similar matters. The analyses contained herein do not purport to be appraisals nor do they necessarily reflect the prices at which businesses or securities actually may be sold or
purchased. Barclays’ role in any due diligence review is limited solely to performing such a review as it shall deem necessary to support its own advice and analysis and shall not be on behalf of the Company, the Board or any individual
officer, director, shareholder or any other person. Barclays, its subsidiaries and affiliates engage in a wide range of businesses from investment and commercial banking, lending, asset management and other financial and non-financial services. In
the ordinary course of its business, Barclays and its affiliates may actively trade and effect transactions in the equity, debt and/or other securities (and any derivatives thereof) and financial instruments (including loans and other obligations)
of the Company for its own account and for the accounts of its customers and, accordingly, may at any time hold long or short positions and investments in such securities and financial instruments or in other financial products and instruments.
Unless otherwise expressly agreed or provided for in other applicable Barclays disclosures governing such corporate transactions or required by law or regulation, Barclays conducts these activities as principal and executes its principal
transactions as an arm’s length counterparty. Barclays does not act as a fiduciary in relation to these corporate transactions. These materials do not constitute investment advice nor do they form part of an offer to sell or purchase, or the
solicitation of an offer to sell or purchase, any securities or any of the businesses or assets described herein or an offer of financing or an offer or recommendation to enter into any corporate transaction described herein. Barclays Capital Inc.
is the United States investment bank of Barclays Bank PLC. Barclays Bank PLC is authorised by the Prudential Regulation Authority and regulated by the Financial Conduct Authority and the Prudential Regulation Authority (Financial Services Register
No. 122702). Registered in England. Registered No. 1026167. Registered office: 1 Churchill Place, London E14 5HP. Copyright Barclays Bank PLC, 2023 (all rights reserved). 18

Exhibit (c)(2)(B) Board Presentation July 19, 2023

Apple | Proposal Summaries Spot Price Initial Offer Initial Offer
Counteroffer Undisturbed Price Current Price Current Price as of 5/3/23 as of 7/14/23 as of 7/14/23 DINO Spot Price $41.91 $46.21 $46.21 Exchange Ratio 0.3714x 0.3714x 0.3714x Stock Consideration per Unit $15.57 $17.16 $17.16 Cash Consideration per
Unit - - 7.00 Total Consideration per Unit $15.57 $17.16 $24.16 Implied Exchange Ratio 0.3714x 0.3714x 0.5229x (1) Premium / (Discount) to Undisturbed Spot Price as of 5/3/23 (2.2%) 7.8% 51.8% (2) Premium / (Discount) to Spot Price as of 7/14/23
(17.5%) (9.0%) 28.0% Total Unaffiliated Units Outstanding (mm) 67.0 67.0 67.0 Total Stock Consideration ($mm) $1,042 $1,149 $1,149 Total Cash Consideration ($mm) - - 469 Total Consideration ($mm) $1,042 $1,149 $1,618 Total DINO Shares Issued (mm)
24.9 24.9 24.9 30-Day VWAP Initial Offer Initial Offer Counteroffer Undisturbed Price Current Price Current Price as of 5/3/23 as of 7/14/23 as of 7/14/23 DINO 30-Day VWAP $45.97 $44.62 $44.62 Exchange Ratio 0.3714x 0.3714x 0.3714x Stock
Consideration per Unit $17.07 $16.57 $16.57 Cash Consideration per Unit - - 7.00 Total Consideration per Unit $17.07 $16.57 $23.57 Implied Exchange Ratio 0.3714x 0.3714x 0.5283x (3) Premium / (Discount) to Undisturbed 30-Day VWAP as of 5/3/23 -
(2.9%) 38.1% (4) Premium / (Discount) to 30-Day VWAP as of 7/14/23 (6.4%) (9.2%) 29.2% Total Unaffiliated Units Outstanding (mm) 67.0 67.0 67.0 Total Stock Consideration ($mm) $1,143 $1,110 $1,110 Total Cash Consideration ($mm) - - 469 Total
Consideration ($mm) $1,143 $1,110 $1,579 Total DINO Shares Issued (mm) 24.9 24.9 24.9 1. Undisturbed Spot Price as of 5/3/23: $15.92 per unit. 2. Spot Price as of 7/14/23: $18.87 per unit. 3. Undisturbed 30-Day VWAP as of 5/3/23: $17.07 per unit. 4.
30-Day VWAP as of 7/14/23: $18.24 per unit. 1

HEP | Relative Trading Performance Trading Performance: Last Twelve
Months Recent Trading HEP - Peer (2) HEP Peer AMZ MLP (3) (1) Performance Median Adj. HEP - AMZ Adj. Median Index 30-Day 7.2% 6.6% 3.8% 6.8% (2.7%) 0.5% 2.1% 6.5% 0.5% 3.3% OKE/MMP Announcement (5/12/2023) 14.6% 1.2% 6.8% 15.4% 24.0% 9.9% - 13.4%
13.4% 7.9% Initial Offer Announcement (5/3/23) 18.5% 4.0% 11.3% 10.3% 14.6% 10.6% 1.0% 16.0% 14.6% 7.2% (10.9%) YTD 4.1% (10.8%) (3.2%) 14.9% 7.6% 10.4% 21.9% 14.9% 7.3% 8.5% 16.6% (6.1%) (7.2%) 7.3% 22.6% 15.8% 45.6% 22.6% 23.8% Last Twelve Months
(Indexed Price Performance) Initial Offer Announcement (Pre-Market Open on 5/4/2023) OKE / MMP Announcement (5/12/2023) Source: FactSet as of 7/14/2023. 1. Represents trading days. 2. Magellan reflects performance to unaffected date of Oneok
transaction, 5/12/2023. 3. HEP Peers include DKL, NS and PAA. Note: MMP not included in HEP Peer Median. 2

HEP / DINO | Historical Exchange Ratio Analysis Number of DINO shares
per HEP unit “Heads-Up” Exchange Ratio (HEP / DINO) Initial Offer Announcement (Pre-Market Open on 5/4/2023) Counter (VWAP) (1) 0.5283x Counter (Spot) (2) 0.5229x Current 0.4084x Initial Offer 0.3714x 1-Year VWAP 0.3550x Implied Premium
Analysis Implied Premium / Discount to Heads-Up Historical Prices / Heads-Up Exchange Ratio HEP DINO Exchange $17.16 $18.87 $20.76 $22.64 $24.16 $24.53 0.3714x 0.4084x 0.4492x 0.4900x 0.5229x 0.5309x (3) Period ($/unit) ($/share) Ratio (9.0%) -
10.0% 20.0% 28.0% 30.0% (9.0%) - 10.0% 20.0% 28.0% 30.0% Current (7/14/2023) $18.87 $46.21 0.4084x (9.0%) - 10.0% 20.0% 28.0% 30.0% (9.0%) - 10.0% 20.0% 28.0% 30.0% Undisturbed Price (5/3/2023) $15.92 $41.91 0.3799x 7.8% 18.5% 30.4% 42.2% 51.8%
54.1% (2.2%) 7.5% 18.3% 29.0% 37.7% 39.8% Offer Price (30-day VWAP as of 5/3/2023) $17.07 $45.97 0.3714x 0.5% 10.5% 21.6% 32.6% 41.5% 43.7% (0.0%) 9.9% 20.9% 31.9% 40.8% 42.9% 5-Day VWAP $18.96 $46.39 0.4086x (9.5%) (0.4%) 9.5% 19.5% 27.5% 29.4%
(9.1%) (0.1%) 9.9% 19.9% 28.0% 29.9% 10-Day VWAP $18.71 $45.70 0.4093x (8.3%) 0.9% 11.0% 21.0% 29.2% 31.1% (9.3%) (0.2%) 9.7% 19.7% 27.7% 29.7% 20-Day VWAP $18.37 $44.75 0.4106x (6.6%) 2.7% 13.0% 23.3% 31.5% 33.5% (9.5%) (0.5%) 9.4% 19.4% 27.4%
29.3% 30-Day VWAP $18.24 $44.62 0.4089x (5.9%) 3.4% 13.8% 24.1% 32.5% 34.5% (9.2%) (0.1%) 9.9% 19.9% 27.9% 29.8% 60-Day VWAP $17.53 $42.91 0.4086x (2.1%) 7.6% 18.4% 29.2% 37.8% 39.9% (9.1%) (0.0%) 9.9% 19.9% 28.0% 29.9% 1-Year VWAP $17.84 $50.26
0.3550x (3.8%) 5.8% 16.3% 26.9% 35.4% 37.5% 4.6% 15.0% 26.5% 38.0% 47.3% 49.5% 2-Year VWAP $17.84 $43.71 0.4081x (3.8%) 5.8% 16.4% 26.9% 35.5% 37.5% (9.0%) 0.1% 10.1% 20.1% 28.1% 30.1% 5-Year VWAP $19.12 $41.64 0.4593x (10.3%) (1.3%) 8.5% 18.4%
26.4% 28.3% (19.1%) (11.1%) (2.2%) 6.7% 13.8% 15.6% 52-Week High $19.72 $66.19 0.2979x (13.0%) (4.3%) 5.3% 14.8% 22.5% 24.4% 24.7% 37.1% 50.8% 64.5% 75.5% 78.2% Research Analyst Target $19.50 $57.00 0.3421x (12.0%) (3.2%) 6.4% 16.1% 23.9% 25.8% 8.6%
19.4% 31.3% 43.2% 52.8% 55.2% Source: FactSet as of 7/14/2023. 1. Reflecting 0.3714x exchange ratio on DINO’s 30-day VWAP of $44.62 as of 7/14/2023 plus $7.00 cash per unit. (4) (2) Initial Offer Counteroffer 2. Reflecting 0.3714x exchange
ratio on DINO’s share price of $46.21 as of 7/14/2023 plus $7.00 cash per unit. 3. 5-day, 10-day, 20-day, 30-day and 60-day reflecting trading days. 1-year, 2-year and 3-year reflecting calendar days. 4. Initial offer of $17.16 per unit
reflecting 0.3714x exchange ratio on DINO’s share price of $46.21 as of 7/14/2023. Initial offer equal to $17.07 based on 30-day VWAP as of undisturbed date of 5/3/2023. 3 Better for HEP Better for DINO

HEP | Relative Valuation EV / EBITDA Debt + Pref. / EBITDA 2022A 2023E
2023E-2025E Debt + Pref. / 2022A EBITDA 1.7% 2.5% 3.3% 3.3% 0.8% EBITDA CAGR Median: 4.9x 4.1x Debt + Pref. / 2023E EBITDA 7.0x 2023E 2024E 2025E EV / 2023E EBITDA 5.9x Median: 9.2x 8.7x 8.8x 6.0x 5.5x EV / 2024E EBITDA 12.0x 4.9x 10.5x 10.2x 10.2x
5.0x 10.0x EV / 2025E EBITDA 9.5x 10.0x 9.6x 4.4x 4.3x 8.7x 8.4x 8.4x 3.7x 8.2x 8.1x 7.9x 4.0x 3.7x 7.8x 7.9x 7.7x 3.6x 8.0x 3.3x 3.3x 3.0x 6.0x 2.0x 4.0x 2.0x 1.0x 0.0x 0.0x Latest Quarterly Distribution Yield Levered FCF Yield LQA DCF 2023E
Levered FCF Yield 2023E 2024E 2025E 1.9x 2.3x 1.2x 2.2x 1.6x Coverage Median: 10.8% 12.6% 14.0% 2024E Levered FCF Yield 20% 12.0% Median: 8.0% 2025E Levered FCF Yield 9.3% 15.1% 14.6% 14.6% 14.1% 15% 13.8% 14.0% 13.8% 9.0% 7.9% 7.4% 7.6% 7.5% 12.0%
11.9% 11.5% 10.9% 10.6% 9.7% 10% 8.8% 6.0% 5% 3.0% NA 0.0% 0% Source: HEP per DINO Management forecast. Peers per Public filings, FactSet, and Wall Street research as of 7/14/2023. Magellan share price as of the unaffected date of the Oneok
acquisition, 5/12/2023. 4
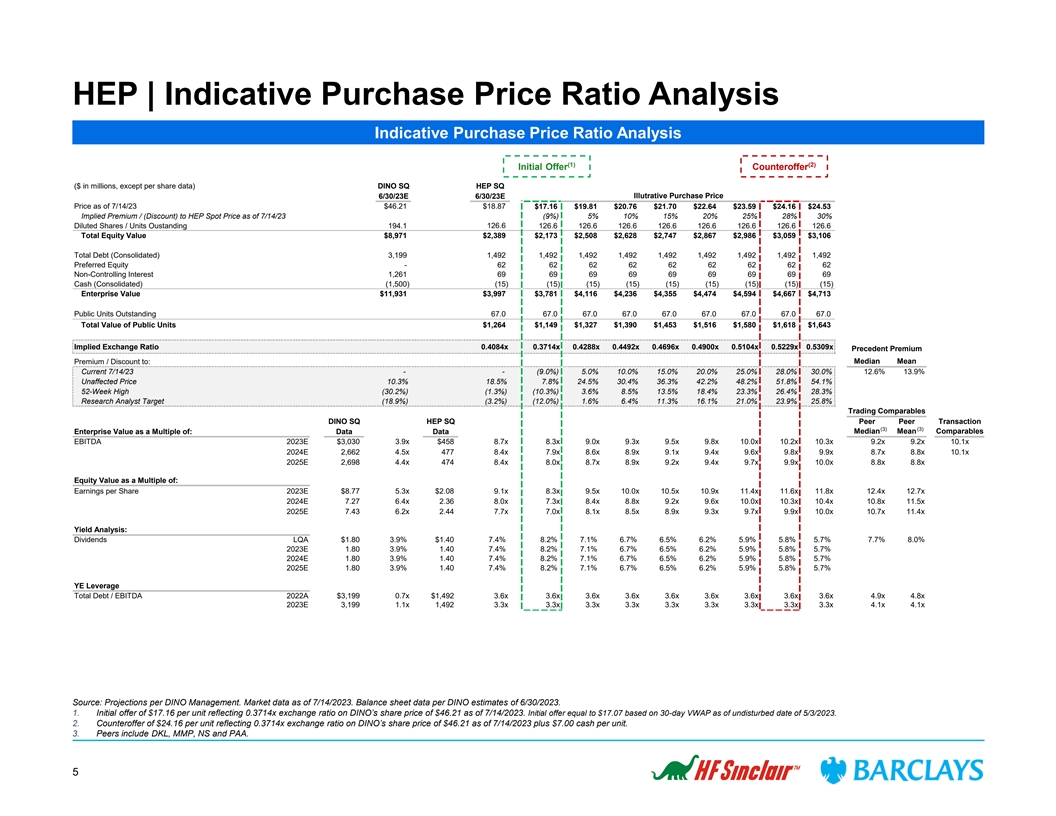
HEP | Indicative Purchase Price Ratio Analysis Indicative Purchase Price
Ratio Analysis (1) (2) Initial Offer Counteroffer ($ in millions, except per share data) DINO SQ HEP SQ 6/30/23E 6/30/23E Illutrative Purchase Price Price as of 7/14/23 $46.21 $18.87 $17.16 $19.81 $20.76 $21.70 $22.64 $23.59 $24.16 $24.53 Implied
Premium / (Discount) to HEP Spot Price as of 7/14/23 (9%) 5% 10% 15% 20% 25% 28% 30% 126.6 Diluted Shares / Units Oustanding 194.1 126.6 126.6 126.6 126.6 126.6 126.6 126.6 126.6 Total Equity Value $8,971 $2,389 $2,173 $2,508 $2,628 $2,747 $2,867
$2,986 $3,059 $3,106 Total Debt (Consolidated) 3,199 1,492 1,492 1,492 1,492 1,492 1,492 1,492 1,492 1,492 Preferred Equity - 62 62 62 62 62 62 62 62 62 Non-Controlling Interest 1,261 69 69 69 69 69 69 69 69 69 Cash (Consolidated) (1,500) (15) (15)
(15) (15) (15) (15) (15) (15) (15) Enterprise Value $11,931 $3,997 $3,781 $4,116 $4,236 $4,355 $4,474 $4,594 $4,667 $4,713 Public Units Outstanding 67.0 67.0 67.0 67.0 67.0 67.0 67.0 67.0 67.0 Total Value of Public Units $1,264 $1,149 $1,327 $1,390
$1,453 $1,516 $1,580 $1,618 $1,643 Implied Exchange Ratio 0.4084x 0.3714x 0.4288x 0.4492x 0.4696x 0.4900x 0.5104x 0.5229x 0.5309x Precedent Premium Premium / Discount to: Median Mean Current 7/14/23 - - (9.0%) 5.0% 10.0% 15.0% 20.0% 25.0% 28.0%
30.0% 12.6% 13.9% Unaffected Price 10.3% 18.5% 7.8% 24.5% 30.4% 36.3% 42.2% 48.2% 51.8% 54.1% 52-Week High (30.2%) (1.3%) (10.3%) 3.6% 8.5% 13.5% 18.4% 23.3% 26.4% 28.3% Research Analyst Target (18.9%) (3.2%) (12.0%) 1.6% 6.4% 11.3% 16.1% 21.0%
23.9% 25.8% Trading Comparables DINO SQ HEP SQ Peer Peer Transaction (3) (3) Median Mean Comparables Enterprise Value as a Multiple of: Data Data EBITDA 2023E $3,030 3.9x $458 8.7x 8.3x 9.0x 9.3x 9.5x 9.8x 10.0x 10.2x 10.3x 9.2x 9.2x 10.1x 2024E
2,662 4.5x 477 8.4x 7.9x 8.6x 8.9x 9.1x 9.4x 9.6x 9.8x 9.9x 8.7x 8.8x 10.1x 2025E 2,698 4.4x 474 8.4x 8.0x 8.7x 8.9x 9.2x 9.4x 9.7x 9.9x 10.0x 8.8x 8.8x Equity Value as a Multiple of: Earnings per Share 2023E $8.77 5.3x $2.08 9.1x 8.3x 9.5x 10.0x
10.5x 10.9x 11.4x 11.6x 11.8x 12.4x 12.7x 2024E 7.27 6.4x 2.36 8.0x 7.3x 8.4x 8.8x 9.2x 9.6x 10.0x 10.3x 10.4x 10.8x 11.5x 2025E 7.43 6.2x 2.44 7.7x 7.0x 8.1x 8.5x 8.9x 9.3x 9.7x 9.9x 10.0x 10.7x 11.4x Yield Analysis: Dividends LQA $1.80 3.9% $1.40
7.4% 8.2% 7.1% 6.7% 6.5% 6.2% 5.9% 5.8% 5.7% 7.7% 8.0% 2023E 1.80 3.9% 1.40 7.4% 8.2% 7.1% 6.7% 6.5% 6.2% 5.9% 5.8% 5.7% 2024E 1.80 3.9% 1.40 7.4% 8.2% 7.1% 6.7% 6.5% 6.2% 5.9% 5.8% 5.7% 2025E 1.80 3.9% 1.40 7.4% 8.2% 7.1% 6.7% 6.5% 6.2% 5.9% 5.8%
5.7% YE Leverage Total Debt / EBITDA 2022A $3,199 0.7x $1,492 3.6x 3.6x 3.6x 3.6x 3.6x 3.6x 3.6x 3.6x 3.6x 4.9x 4.8x 2023E 3,199 1.1x 1,492 3.3x 3.3x 3.3x 3.3x 3.3x 3.3x 3.3x 3.3x 3.3x 4.1x 4.1x Source: Projections per DINO Management. Market data
as of 7/14/2023. Balance sheet data per DINO estimates of 6/30/2023. 1. Initial offer of $17.16 per unit reflecting 0.3714x exchange ratio on DINO’s share price of $46.21 as of 7/14/2023. Initial offer equal to $17.07 based on 30-day VWAP as
of undisturbed date of 5/3/2023. 2. Counteroffer of $24.16 per unit reflecting 0.3714x exchange ratio on DINO’s share price of $46.21 as of 7/14/2023 plus $7.00 cash per unit. 3. Peers include DKL, MMP, NS and PAA. 5

Appendix

DINO | Comparable Companies DINO Trading Comparables ($ in millions,
except per share values) Peer Median Stock Price as of 7/14/2023 $46.21 $118.41 $100.46 $113.48 $39.90 $30.74 $23.09 $26.85 Diluted Shares Outstanding 194 428 464 362 131 103 68 63 Total Equity Value $8,971 $50,629 $46,587 $41,025 $5,223 $3,161
$1,578 $1,681 Total Debt 3,199 27,659 18,730 11,431 1,469 1,597 2,840 550 Cash 1,500 11,452 6,705 5,521 1,616 601 885 661 Net Debt 1,699 16,207 12,025 5,910 (147) 996 1,954 (111) (1) Minority Interest 1,261 12,200 -- -- -- 564 481 -- Enterprise
Value $11,931 $79,036 $58,612 $46,935 $5,077 $4,721 $4,014 $1,570 Enterprise Value to: 2023E EBITDA 3.9x 4.8x 5.2x 3.5x 2.3x 4.6x 4.3x 3.0x 4.3x 2024E EBITDA 4.5x 6.7x 6.0x 5.1x 2.9x 6.4x 5.4x 3.9x 5.4x 2025E EBITDA 4.4x 7.2x 6.3x 5.9x 3.7x 6.3x
6.1x 5.1x 6.1x 2023E EBIT 4.1x 6.2x 6.1x 4.4x 3.0x 6.0x 7.1x 3.9x 6.0x 2024E EBIT 4.6x 9.2x 7.0x 6.9x 4.4x 8.7x 10.9x 6.1x 7.0x 2025E EBIT 4.6x 10.4x 7.5x 8.4x 6.5x 9.7x 15.1x 8.5x 8.5x Equity Value to: 2023E CFFO 4.6x 4.0x 5.5x 3.9x 3.1x 3.8x 2.5x
3.7x 3.8x 2024E CFFO 4.9x 4.8x 5.8x 5.0x 3.8x 5.8x 3.2x 4.7x 4.8x 2025E CFFO 4.8x 4.9x 6.0x 5.4x 4.2x 8.5x 3.4x 5.6x 5.4x 2023E Net Income 5.3x 6.3x 7.1x 5.2x 4.5x 7.8x 6.9x 4.8x 6.3x 2024E Net Income 6.4x 9.0x 8.4x 8.7x 6.4x 14.3x 15.4x 8.7x 8.7x
2025E Net Income 6.2x 10.2x 8.4x 10.3x 8.9x 15.7x 25.4x 11.8x 10.3x Source: DINO Management, Company filings, FactSet, Wall Street research and investor presentations as of 7/14/2023. DINO balance sheet data per management estimates of 6/30/2023. 1.
Reflects market value of public interest in MLP. Does not include preferred equity held by subsidiaries. 6

HEP | Comparable Companies HEP Trading Comparables ($ in millions except
per unit data) Peer Median (1) Unit Price as of 7/14/23 $18.87 $52.01 $17.22 $55.41 $14.34 % of 52-week high (Close) 96% 83% 98% 98% 97% 98% Fully Diluted Units Outstanding 127 44 111 202 698 Total Equity Value $2,389 $2,266 $1,910 $11,198 $10,015
Debt 1,492 1,717 3,094 5,112 8,041 Preferred Equity 62 - 1,199 - 2,666 Noncontrolling Interest 69 - - - - Cash (15) ( 11) ( 5) (7) (526) Enterprise Value $3,997 $3,972 $6,198 $16,303 $20,196 Enterprise Value / 2023E EBITDA 8.7 x 10.2 x 8.2 x 10.5 x
8.1 x 9.2 x 2024E EBITDA 8.4 x 9.5 x 7.9 x 10.2 x 7.8 x 8.7 x 2025E EBITDA 8.4 x 9.6 x 7.7 x 10.0 x 7.9 x 8.8 x Valuation Metrics LQA Yield 7.42% 7.88% 9.29% 7.56% 7.46% 7.72% 2023E Yield 7.42% 7.96% 9.29% 7.60% 7.46% 7.78% 2024E Yield 7.42% 8.25%
9.29% 7.67% 8.51% 8.38% 2025E Yield 7.42% 8.77% 9.29% 7.74% 9.55% 9.03% 2023E DCF Yield 13.89% 11.59% 19.64% 11.05% 16.05% 13.82% 2024E DCF Yield 14.61% 13.68% 20.05% 11.46% 18.45% 16.06% 2025E DCF Yield 15.09% NA 20.26% 11.79% 17.97% 17.97% 2023E
FCF Yield 13.76% 8.76% 12.04% 9.73% 11.86% 10.80% 2024E FCF Yield 14.61% 11.47% 13.77% 10.57% 14.61% 12.62% 2025E FCF Yield 15.09% NA 13.98% 10.89% 14.13% 13.98% 2023E EPS $2.08 $3.91 $1.14 $5.03 $1.24 $3.91 2024E EPS 2.36 4.67 1.20 5.26 1.42 4.67
2025E EPS 2.44 4.89 1.22 5.42 1.34 4.89 Coverage 2023E Coverage 1.87 x 1.46 x 2.11 x 1.45 x 2.15 x 1.78 x 2024E Coverage 1.97 x 1.66 x 2.16 x 1.49 x 2.17 x 1.91 x 2025E Coverage 2.03 x NA 2.18 x 1.52 x 1.88 x 1.88 x Credit Statistics Debt / 2022A
EBITDA 3.6 x 5.5 x 4.3 x 3.6 x 3.2 x 3.9 x Debt / 2023E EBITDA 3.3 x 4.4 x 4.1 x 3.3 x 3.2 x 3.7 x Debt + Pref / 2023A EBITDA 3.7 x 5.5 x 5.9 x 3.6 x 4.3 x 4.9 x Debt + Pref / 2023E EBITDA 3.3 x 4.4 x 4.9 x 3.3 x 3.7 x 4.1 x Source: DINO Management,
Company filings, FactSet, Wall Street research and investor presentations as of 7/14/2023. HEP balance sheet data per management estimates of 6/30/2023. 1. Magellan unaffected share price as of 5/12/2023 prior to Oneok acquisition. 7

HEP | Equity Analyst Price Targets (1) (2) Research Price Targets
Premium / (Discount) % to Current Price ($ / share) Median Analyst Target Price Premium / (Discount) to: Current Price 3% (3) Current: $55.41 $70.00 0.35 $64.00 Current: $52.01 0.3 $60.00 0.25 Current: Current: $50.00 $47.00 $14.34 $17.22 0.2 16%
$40.00 0.15 12% 10% Median 0.1 $30.00 Price 6% 6% Target: 0.05 $19.50 $19.00 $19.00 $20.00 $20.00 $18.00 $20.00 $16.00 0 Current 1% HEP: $10.00 $18.87 -0.05 (10%) (5%) $0.00 -0.1 Analyst 1 Analyst 2 Analyst 3 Analyst 4 5/6/2023 5/4/2023 5/4/2023
4/3/2023 Analyst Recommendation 0 2 1 4 Buy ✓ 1 3 4 2 Hold ~ 0 1 1 0 Sell OO 1 6 6 6 Source: FactSet as of 7/14/2023. 1. Includes available reports from reputable brokers that have provided a price target. 2. Peer group price targets reflect
average analyst price target. 3. Reflects unaffected price from 5/12/2023 prior to Oneok acquisition. 8

DINO | Equity Analyst Price Targets (1) (2) Research Price Targets
Premium / (Discount) % to Current Price Price Targets ($ / share) Median Analyst Target Price Premium / (Discount) to: Current Price 21% Current: Current: Current: Current: Current: Current: Current: $118.41 $100.46 $113.48 $30.74 $23.09 $39.90
$26.65 $146.00 $121.50 $145.00 0.7 $80.00 $70.00 0.6 $62.00 Median Analyst: $59.00 $59.00 $60.00 $56.00 $56.00 $57.00 $55.00 0.5 $50.00 $47.00 $48.00 $50.00 0.4 $42.00 $43.00 Current $40.00 DINO: 28% 0.3 $46.21 $31.00 34% 23% $29.00 23% $30.00 21%
$26.00 19% 25% 18% 0.2 28% 15% $20.00 Peers 13% 21% Median: 17% 0.1 $10.00 8% 0 $0.00 4% Analyst 1 Analyst 2 Analyst 3 Analyst 4 Analyst 5 Analyst 6 Analyst 7 Analyst 8 Analyst 9 Analyst 10 6/9/23 6/7/23 6/1/23 6/1/23 5/23/23 5/16/23 5/12/23 5/4/23
5/5/23 4/7/23 Analyst Recommendation 9 7 9 0 1 2 3 Buy ✓✓✓✓✓✓✓ 2 3 2 3 5 6 1 Hold ~ ~ 0 0 0 0 2 0 0 Sell O Source: FactSet as of 7/14/2023. 11 10 11 3 8 8 4 1. Includes available reports from
reputable brokers since Q1’23 earnings release that have provided a price target. 2. Peer group price targets reflect median analyst price target. 9

HEP | Comparable Transaction Analysis Selected MLP Buy-in Transactions
Total Initial Initial Premium Paid Premium Paid - (2) (3) Announced Transaction Enterprise Value Price Premium Final (Days Prior to Initial Ann.) (Days Prior to Final Ann.) EV / FY+1 30-Day 30-Day (1) Date Acquirer Target Value ($MM) Acquirer Target
Offered Offered Price 1-Day 1-Day EBITDA Consideration Process VWAP VWAP 8/17/2022 $3,783 $68,412 $14,229 $34.75 0.0% $41.75 20.1% 24.0% 6.2% 8.2% 8.4x 100% Cash Ann. then Negotiate (4) 7/28/2022 $579 $7,229 $1,690 $15.14 13.4% $17.66 32.3% 11.0%
(3.4%) 9.9% 7.3x Cash and Unit Exchange Ann. then Negotiate 7/6/2022 $131 NA $824 $17.90 (0.3%) $25.00 39.3% 42.8% 2.8% 8.6% 10.3x 100% Cash Ann. then Negotiate 4/22/2022 $400 NA $595 $3.32 0.9% $4.65 41.3% 42.7% 40.9% 40.7% 11.1x 100% Cash Ann.
then Negotiate (5) 2/11/2022 $2,608 $237,598 $9,749 $12.89 0.0% $15.85 23.0% 23.5% 9.6% 11.6% 12.6x 100% Cash Ann. then Negotiate 10/27/2021 $3,466 $16,829 $13,076 $32.57 0.0% $41.11 4.8% 7.6% 4.8% 7.6% 9.7x 100% Unit Exchange Negotiate then Ann.
(6) 8/5/2021 $874 $126,182 $1,694 $13.01 0.0% $15.12 16.2% 8.9% 17.1% 17.2% 9.7x 100% Unit Exchange Ann. then Negotiate (7) 2/5/2021 $1,149 $201,401 $2,872 $12.47 0.0% $14.56 16.7% 18.7% (3.3%) 5.8% 7.4x 100% Unit Exchange Ann. then Negotiate (8)
10/5/2020 $2,829 $74,892 $3,361 $27.31 5.4% $30.95 19.5% 15.1% 0.6% (0.7%) 10.1x 100% Unit Exchange Ann. then Negotiate 7/27/2020 $693 $4,419 $1,312 $8.38 4.5% $8.47 28.1% 29.1% 28.1% 29.1% 7.3x 100% Unit Exchange Negotiate then Ann. 11/26/2018 $536
NA $1,246 $38.00 4.4% $41.00 12.6% 9.5% 12.6% 9.5% 10.6x 100% Cash Negotiate then Ann. 11/8/2018 $8,965 $7,251 $12,230 $43.77 5.0% $50.33 7.6% 14.3% 7.6% 14.3% 11.2x 100% Unit Exchange Negotiate then Ann. 10/18/2018 $1,850 $50,344 $3,660 $40.00
10.7% $42.25 6.0% 10.2% 6.0% 10.2% 10.2x 100% Cash Negotiate then Ann. 9/19/2018 $2,634 $86,611 $6,683 $17.75 0.0% $18.22 2.6% 8.8% 0.5% 1.0% 29.6x 100% Unit Exchange Ann. then Negotiate (9) 8/1/2018 $60,345 $26,932 $80,353 $21.32 5.0% $23.59 11.2%
17.5% 11.2% 17.5% 7.0x 100% Unit Exchange Negotiate then Ann. (10) 5/29/2018 $300 $5,332 $3,262 $21.86 (1.1%) $21.86 (1.1%) 9.2% (1.1%) 9.2% 6.2x 100% Unit Exchange Tender Offer (11) 5/17/2018 $4,779 $123,056 $27,256 $33.10 0.0% $40.00 20.8% 18.4%
5.7% 6.8% 14.3x 100% Unit Exchange Ann. then Negotiate (12) 5/17/2018 $10,010 $121,978 $14,694 $10.08 0.0% $11.48 13.9% 16.4% 2.1% 0.3% 10.1x 100% Unit Exchange Ann. then Negotiate 5/17/2018 $15,105 $29,816 $55,383 $36.94 5.2% $40.89 6.4% 11.2% 6.4%
11.2% 11.8x 100% Unit Exchange Negotiate then Ann. 3/27/2018 $3,224 $3,418 $4,942 $41.34 (0.5%) $35.42 0.6% (8.1%) 0.6% (8.1%) 6.3x 100% Unit Exchange Negotiate then Ann. Source: Price data per FactSet. Transaction value and consideration paid based
on public filings, company press releases, and investor presentations. 1. Transaction value includes only un-affiliated and proportional net debt. 2. Premium paid to initial announcement represents the premium based on the final agreed upon price
relative to the original offer’s unaffected date. 3. Premium paid to final announcement represents the premium based on the final agreed upon price relative to the final announcement’s unaffected date. 4. Initial price offered not yet
disclosed. Transaction value and premium reflect unaffected DINO price as of 7/27/2022. Initial announcement date reflects filing of Schedule 13D/A on June 24, 2022. 5. Shell / Shell Midstream Partners LP based on revised offer announced 7/25/2022.
Premium paid based on closing price prior to original announcement on 2/11/2022. 6. BP / BP Midstream Partners LP based on revised offer announced 12/20/2021. Premium paid based on closing price prior to original announcement on 8/4/2021. 7. Chevron
/ Noble Midstream Partners based on revised offer announced 3/5/2021. Premium paid based on closing price prior to original announcement on 2/4/2021. 8. TC Energy / TC Pipeline based on revised offer announced 12/15/2020. Premium paid based on
closing price prior to original announcement on 10/5/2020. 9. Dominion Energy / Dominion Energy Midstream based on revised offer announced 11/23/2018. Premium paid based on closing price prior to original announcement on 9/8/2018. 10. Reflects the
5/29/18 exchange offer; CVI announced it would exercise the call right on 1/17/19. 11. Enbridge / Spectra premiums based on revised offer announced on 8/24/2018. Enbridge price performance based on original announcement on 5/17/2018. 12. Enbridge /
Enbridge Energy Partners based on revised offer announced 9/18/2018. Enbridge price performance based on original announcement on 5/17/2018. 10

HEP | Comparable Transaction Analysis (Cont’d) Selected MLP
Buy-in Transactions Total Initial Initial Premium Paid Premium Paid (2) (3) Announced Transaction Enterprise Value Price Premium Final (Days Prior to Initial Ann.) (Days Prior to Final Ann.) EV / FY+1 30-Day 30-Day (1) Date Acquirer Target Acquirer
Target Offered Offered Price 1-Day 1-Day EBITDA Consideration Process Value ($MM) VWAP VWAP 11/8/2017 $173 $3,189 $845 $11.80 3.0% $13.92 3.0% 11.5% 3.0% 11.5% 4.6x 100% Unit Exchange Negotiate then Ann. 8/29/2017 $736 NA $736 $14.50 0.4% $16.50
15.2% 12.4% 15.2% 12.4% 12.3x 100% Cash Negotiate then Ann. 5/18/2017 $651 NA $963 $20.00 20.1% $20.00 20.1% 20.4% 20.1% 20.4% 12.3x 100% Cash Tender Offer 4/4/2017 $157 NA $594 $16.80 5.8% $17.30 5.8% 5.6% 5.8% 5.6% 9.1x 100% Cash Tender Offer
3/2/2017 $781 NA $1,470 $18.75 1.9% $19.50 6.0% 5.6% 4.3% 3.4% 9.3x 100% Cash Ann. then Negotiate 1/27/2017 $1,656 $77,129 $1,656 $6.25 (4.6%) $8.00 (8.6%) 1.8% (8.6%) 1.8% 11.0x 100% Cash Negotiate then Ann. 11/1/2016 $5,180 $77,381 $9,684 $15.75
2.9% $17.00 11.1% 16.0% 6.3% 5.2% 18.0x 100% Cash Ann. then Negotiate Selected MLP Transactions From 2016 - 2023 YTD Mean 3.0% 13.9% 15.0% 7.5% 10.0% 10.7x Median 0.9% 12.6% 12.4% 5.8% 9.2% 10.1x High 20.1% 41.3% 42.8% 40.9% 40.7% 29.6x Low (4.6%)
(8.6%) (8.1%) (8.6%) (8.1%) 4.6x Selected 100% Stock MLP Transactions From 2016 - 2023 YTD Mean 1.9% 10.8% 12.8% 6.0% 8.8% 10.4x Median 0.0% 9.4% 12.9% 3.9% 8.4% 9.7x High 5.4% 28.1% 29.1% 28.1% 29.1% 29.6x Low (1.1%) (1.1%) (8.1%) (3.3%) (8.1%)
4.6x Selected MLP Transactions From 2021 - 2023 YTD Mean 1.8% 24.2% 22.4% 9.4% 13.7% 9.6x Median 0.0% 21.6% 21.1% 5.5% 9.3% 9.7x High 13.4% 41.3% 42.8% 40.9% 40.7% 12.6x Low (0.3%) 4.8% 7.6% (3.4%) 5.8% 7.3x Source: Price data per FactSet.
Transaction value and consideration paid based on public filings, company press releases, and investor presentations. HEP data per DINO Management forecast. 1. Transaction value includes only un-affiliated and proportional net debt. 2. Premium paid
to initial announcement represents the premium based on the final agreed upon price relative to the original offer’s unaffected date. 3. Premium paid to final announcement represents the premium based on the final agreed upon price relative to
the final offer’s unaffected date. 4. Reflects DINO management estimates of balance sheet data for 6/30/2023. 11

Proposed OKE / MMP Transaction Summary Transaction Summary 1-Day
Trading Performance — On May 14, 2023, ONEOK, Inc. (“ONEOK”) announced that it will Buyers Targets acquire all outstanding units of Magellan Midstream Partners, L.P. (“Magellan”) for ~$18.8bn, including assumed debt
15.0% 8.0% ¡ Consideration will consist of $25.00 in cash and 0.6670 shares of ONEOK common stock for each outstanding Magellan common unit 4.0% 12.0% Transaction & ¡ Implied premium of ~22% to Magellan’s closing share price
Purchase Price th on Friday, May 12 (~15% premium based on ONEOK’s 0.0% 9.0% th closing sharing price on Monday, May 15 ) (0.6%) ¡ ONEOK has secured $5.25 billion of fully-committed bridge (4.0%) 6.0% financing for the proposed cash
consideration (a Notes offering is expected prior to closing) (8.0%) ¡ Transaction expected to close in Q3 2023 3.0% (9.1%) — Expected to be accretive to earnings per share beginning in 2024 (12.0%) 0.0% with EPS accretion of 3-7% per year
in 2025-2027 — Expected to be free cash flow per share accretive, averaging more than 20% 2024-2027 Transaction — Forecasted synergies are expected to total at least $200mm Consequences annually, with potential to move as high as $400mm
MMP Enterprise Value Build & Multiples — Benefit from the tax basis step-up has an estimated total value of ($ in millions) ~$3.0bn 5/12/23 Close Offer Price 5/15/23 Close Share Price $55.41 $55.41 $62.61 — Pro forma 2024 year-end Net
Debt / EBITDA of ~4.0x Implied Premium to 5/12/2023 Close - 21.8% 14.9% Offer Price $55.41 $67.50 $63.65 — Adds a leading, and primarily fee-based, refining products and Units Outstanding 202 202 202 crude oil transportation business to ONEOK
Equity Value $11,198 $13,642 $12,864 (1) — Complementary and diversified asset positions, presenting Plus: Debt 5,112 5,112 5,112 significant potential for enhanced customer product offerings and Less: Cash (7) (7) (7) increased international
export opportunities Enterprise Value $16,303 $18,747 $17,969 Disclosed MMP — Expected immediate financial benefits, including cost, operational, Enterprise Value as a Mult. of: Statistic Rationale and tax synergies, supporting meaningful
expected accretion 2024E EBITDA $1,599 10.2x 11.7x 11.2x — A significant increase in free cash flow, which provides additional 2025E EBITDA 1,630 10.0x 11.5x 11.0x cash for debt reduction, growth capital, and value returned to (2) 2024E EBITDA
Adj. for Synergies $1,899 8.6x 9.9x 9.5x (2) shareholders through dividends and/or repurchasing shares 2025E EBITDA Adj. for Synergies 1,930 8.4x 9.7x 9.3x — Strong IG credit ratings with enhanced scale and diversification Equity Value as a
Mult. of: 2024E DCF $1,283 11.5% 9.4% 10.0% — $275mm breakup fee Other Key 2025E DCF 1,320 11.8% 9.7% 10.3% Merger — Magellan will be merged into a newly created 100% wholly-owned Agreement Items subsidiary of ONEOK Source: Company
filings, Wall Street Research, and FactSet. 1. Includes $112mm in long-term lease liabilities. 2. Assumes $300mm in synergies. Excludes tax savings. 12 PAA 5.2% ET 1.5% TRP 0.7% ENB 0.5% EPD 0.1% KMI OKE MMP 13.0% CEQP 8.6% PAA 5.2% NS 4.1% KNTK
3.6% WES 2.6% HEP 2.1% DTM 1.8% TRGP 1.3%

Disclaimer This document has been prepared by Barclays Capital Inc.
(“Barclays”) for information purposes only. This document is confidential and for the sole and exclusive benefit and internal use of the Recipient in connection with the matter or possible transaction to which this document relates, and
no part of it may be reproduced, distributed or transmitted without the prior written permission of Barclays. This document is an indicative summary of the terms and conditions of the transaction described herein and may be amended, superseded or
replaced by subsequent summaries. The final terms and conditions of the transaction will be set out in full in the applicable binding transaction document(s). This document is incomplete without reference to, and should be assessed solely in
conjunction with, the oral briefing provided by Barclays. Neither Barclays nor any of its subsidiaries or affiliates shall be obliged by having made this document available to you to provide any financial advisory services (whether in relation to
the matter or possible transaction to which this document relates or otherwise) or to sell, acquire, place or underwrite any securities or to lend moneys or to provide any other commitment, facility, product, risk management solution or service, nor
does Barclays represent by providing this document to the Recipient that it will be possible for Barclays to provide, arrange or undertake any of the aforementioned services, activities, products or solutions. Any commitment by Barclays to provide,
arrange or undertake any of the aforementioned services, activities, products or solutions would be subject to Barclays signing appropriate documentation, obtaining all necessary internal approvals and completing due diligence, in each case in a
manner satisfactory to Barclays. This document was prepared on the basis of information and data, obtained from publicly available sources and, where applicable, from the Recipient and/or any other entity that may be involved in any transaction or
matter contemplated by this document (and/or any of the Recipient’s or the aforementioned entities’ affiliates), in each case prior to or on the date hereof. Barclays makes no warranty or representation, express or implied, as to the
accuracy or completeness of information which is contained in this document and which is stated to have been obtained from or is based upon trade and statistical services or other third party sources. The information in this document has not been
independently verified by Barclays and Barclays does not assume any liability for any such information. Any data on past performance, modeling or back-testing contained herein is no indication as to future performance. No representation is made as
to the reasonableness of the assumptions made within or the accuracy or completeness of any modeling or back-testing or any other information contained herein. All opinions and estimates are given as of the date hereof and are subject to change and
Barclays assumes no obligation to update this document to reflect any such changes. The value of any investment may fluctuate as a result of market changes. The information herein is not intended to predict actual results and no assurances are given
with respect thereto. Nothing herein shall be deemed to constitute investment, legal, tax, financial, accounting or other advice. The Recipient is responsible for making its own independent investigation and appraisal of the risks, benefits,
appropriateness and suitability of any transaction or matter contemplated by this document and Barclays is not making any recommendation (personal or otherwise) or giving any investment advice and will have no liability with respect thereto. The
decision to proceed with any transaction or action contemplated by this document must be made by the Recipient in the light of its own commercial assessments and Barclays will not be responsible for such assessments. Neither Barclays nor any of its
subsidiaries or affiliates, nor any of their respective directors, officers, employees, advisors or other representatives (Barclays together with such persons being the “Barclays Group”) accepts any liability whatsoever for any direct,
indirect or consequential losses (in contract, tort or otherwise) arising from the use of this document or its contents or any reliance on the information contained herein. Barclays Group is not responsible for any specialized advice (including
financial, tax, legal and accounting, among other advice). This document does not constitute nor does it form part of an offer to sell or purchase, or the solicitation of an offer to sell or purchase, any securities or any of the businesses or
assets described herein or an offer or recommendation to enter into any transaction described herein nor does this document constitute an offer or commitment to provide, arrange or underwrite any financing. Members of the Barclays Group are involved
in a wide range of commercial banking, investment banking and other activities out of which conflicting interests or duties may arise. In the ordinary course of its business, the Barclays Group may provide services to any other entity or person
whether or not a member of the same group as the Recipient (a “Third Party”), engage in any transaction (whether on its own account, on behalf of any Third Party or otherwise, and including any transaction or matter contemplated by this
document), notwithstanding that such services, transactions or actions may be adverse to the Recipient or any member of the Recipient’s group, and the Barclays Group may retain for its own benefit any related remuneration or profit. The
Barclays Group operates in accordance with a conflicts of interest policy which identifies conflicts of interest it faces in the ordinary course of its business, and establishes organisational and procedural measures to manage those conflicts where
it is reasonably able to do so. Neither Barclays nor any other part of the Barclays Group shall have any duty to disclose to the Recipient or utilise for the Recipient’s benefit any non-public information acquired in the course of providing
services to any other person, engaging in any transaction (on its own account or otherwise) or otherwise carrying on its business. The Barclays Group’s research analysts and research departments are independent from its banking business and
are subject to certain regulations and internal policies. The Barclays Group’s research analysts may hold opinions and make statements or investment recommendations and/or publish research reports with respect to any company referred to
herein, the transactions contemplated herein or any person or entity involved therein or related thereto that differ from or are inconsistent with the views or advice communicated by the Barclays Group’s banking business. Barclays is a full
service securities firm and as such from time to time may effect transactions for its own account or the account of its clients and hold long or short positions in debt, equity or other securities of the companies referred to herein or in other
financial products and instruments. Unless otherwise expressly agreed or provided for in other applicable Barclays disclosures governing such transactions or required by law or regulation, Barclays conducts these activities as principal and executes
its principal transactions as an arm’s length counterparty. Barclays does not act as a fiduciary in relation to these transactions. THIS DOCUMENT DOES NOT DISCLOSE ALL THE RISKS AND OTHER SIGNIFICANT ISSUES RELATED TO AN INVESTMENT IN THE
SECURITIES, FINANCIAL INSTRUMENTS OR TRANSACTIONS DESCRIBED HEREIN. PRIOR TO TRANSACTING, YOU SHOULD ENSURE THAT YOU FULLY UNDERSTAND THE TERMS OF THE TRANSACTION AND ANY APPLICABLE RISKS. The information contained herein is not intended to be
distributed to any prospective or actual investors and, accordingly, may not be shown or given to any person other than the recipient, and is not to be forwarded to any other person (including any retail investor or customer), copied or otherwise
reproduced or distributed to any such person in any manner whatsoever. FAILURE TO COMPLY WITH THIS DIRECTIVE CAN RESULT IN A VIOLATION OF THE SECURITIES ACT OF 1933, AS AMENDED. These materials have not been produced by the Barclays Group’s
research department and do not constitute investment research or a research recommendation for the purposes of the Financial Conduct Authority rules or a research report under applicable U.S. law. Barclays Capital Inc. is the United States
investment bank of Barclays Bank PLC. Barclays Bank PLC is authorised by the Prudential Regulation Authority and regulated by the Financial Conduct Authority and the Prudential Regulation Authority (Financial Services Register No. 122702).
Registered in England. Registered No. 1026167. Registered office: 1 Churchill Place, London E14 5HP. Copyright Barclays Bank PLC, 2023 (all rights reserved). 13

Exhibit (c)(2)(C) Board Presentation July 21, 2023

Apple | Proposal Summaries Spot Price Initial Offer Initial Offer
Counteroffer Undisturbed Price Current Price Current Price as of 5/3/23 as of 7/20/23 as of 7/20/23 DINO Spot Price $41.91 $48.34 $48.34 Exchange Ratio 0.3714x 0.3714x 0.3714x Stock Consideration per Unit $15.57 $17.95 $17.95 Cash Consideration per
Unit - - 7.00 Total Consideration per Unit $15.57 $17.95 $24.95 Implied Exchange Ratio 0.3714x 0.3714x 0.5162x (1) Premium / (Discount) to Undisturbed Spot Price as of 5/3/23 (2.2%) 12.8% 56.7% (2) Premium / (Discount) to Spot Price as of 7/20/23
(17.6%) (5.0%) 32.1% Total Unaffiliated Units Outstanding (mm) 67.0 67.0 67.0 Total Stock Consideration ($mm) $1,042 $1,202 $1,202 Total Cash Consideration ($mm) - - 469 Total Consideration ($mm) $1,042 $1,202 $1,671 Total DINO Shares Issued (mm)
24.9 24.9 24.9 30-Day VWAP Initial Offer Initial Offer Counteroffer Undisturbed Price Current Price Current Price as of 5/3/23 as of 7/20/23 as of 7/20/23 DINO 30-Day VWAP $45.97 $45.16 $45.16 Exchange Ratio 0.3714x 0.3714x 0.3714x Stock
Consideration per Unit $17.07 $16.77 $16.77 Cash Consideration per Unit - - 7.00 Total Consideration per Unit $17.07 $16.77 $23.77 Implied Exchange Ratio 0.3714x 0.3714x 0.5264x (3) Premium / (Discount) to Undisturbed 30-Day VWAP as of 5/3/23 -
(1.8%) 39.2% (4) Premium / (Discount) to 30-Day VWAP as of 7/20/23 (7.0%) (8.6%) 29.6% Total Unaffiliated Units Outstanding (mm) 67.0 67.0 67.0 Total Stock Consideration ($mm) $1,143 $1,123 $1,123 Total Cash Consideration ($mm) - - 469 Total
Consideration ($mm) $1,143 $1,123 $1,592 Total DINO Shares Issued (mm) 24.9 24.9 24.9 1. Undisturbed Spot Price as of 5/3/23: $15.92 per unit. 2. Spot Price as of 7/20/23: $18.89 per unit. 3. Undisturbed 30-Day VWAP as of 5/3/23: $17.07 per unit. 4.
30-Day VWAP as of 7/20/23: $18.35 per unit. 1

HEP | Relative Trading Performance Trading Performance: Last Twelve
Months Recent Trading HEP - Peer (2) HEP Peer AMZ MLP (3) Performance Median Adj. HEP - AMZ Adj. Median Index (1) 30-Day 3.5% 2.9% (0.0%) 5.0% (11.6%) 0.6% 2.1% 6.1% 0.6% 3.5% OKE/MMP Announcement (5/12/2023) 14.8% 1.4% 4.9% 20.7% 13.3% 11.5% -
16.5% 13.3% 9.8% Initial Offer Announcement (5/3/23) 18.7% 6.5% 9.5% 15.3% 4.7% 12.2% 1.0% 19.1% 12.2% 9.2% (6.8%) YTD 4.2% (4.9%) (5.0%) 5.1% 9.2% 10.4% 25.2% 9.2% 9.3% 5.4% 10.6% (7.4%) (7.2%) (4.9%) 18.0% 15.8% 35.3% 18.0% 17.8% Last Twelve
Months (Indexed Price Performance) Initial Offer Announcement (Pre-Market Open on 5/4/2023) OKE / MMP Announcement (5/12/2023) Source: FactSet as of 7/20/2023. 1. Represents trading days. 2. Magellan reflects performance to unaffected date of Oneok
transaction, 5/12/2023. 3. HEP Peers include DKL, NS and PAA. Note: MMP not included in HEP Peer Median. 2

HEP / DINO | Historical Exchange Ratio Analysis Number of DINO shares
per HEP unit “Heads-Up” Exchange Ratio (HEP / DINO) Initial Offer Announcement (Pre-Market Open on 5/4/2023) Counter (VWAP) (1) 0.5264x Counter (Spot) (2) 0.5162x Current 0.3908x Initial Offer 0.3714x 1-Year VWAP 0.3553x Implied Premium
Analysis Implied Premium / Discount to Heads-Up Historical Prices / Heads-Up Exchange Ratio HEP DINO Exchange $17.95 $18.89 $20.78 $22.67 $24.56 $24.95 0.3714x 0.3908x 0.4299x 0.4689x 0.5080x 0.5162x (3) Period ($/unit) ($/share) Ratio (5.0%) -
10.0% 20.0% 30.0% 32.1% (5.0%) - 10.0% 20.0% 30.0% 32.1% Current (7/20/2023) $18.89 $48.34 0.3908x (5.0%) - 10.0% 20.0% 30.0% 32.1% (5.0%) - 10.0% 20.0% 30.0% 32.1% Undisturbed Price (5/3/2023) $15.92 $41.91 0.3799x 12.8% 18.7% 30.5% 42.4% 54.3%
56.7% (2.2%) 2.9% 13.2% 23.4% 33.7% 35.9% Offer Price (30-day VWAP as of 5/3/2023) $17.07 $45.97 0.3714x 5.2% 10.6% 21.7% 32.8% 43.8% 46.2% (0.0%) 5.2% 15.7% 26.3% 36.8% 39.0% 5-Day VWAP $18.82 $46.93 0.4012x (4.6%) 0.3% 10.4% 20.4% 30.4% 32.6%
(7.4%) (2.6%) 7.2% 16.9% 26.6% 28.7% 10-Day VWAP $18.87 $46.57 0.4053x (4.9%) 0.1% 10.1% 20.1% 30.1% 32.2% (8.4%) (3.6%) 6.1% 15.7% 25.3% 27.4% 20-Day VWAP $18.45 $44.95 0.4105x (2.7%) 2.4% 12.6% 22.9% 33.1% 35.2% (9.5%) (4.8%) 4.7% 14.2% 23.8%
25.7% 30-Day VWAP $18.35 $45.16 0.4063x (2.2%) 2.9% 13.2% 23.5% 33.8% 36.0% (8.6%) (3.8%) 5.8% 15.4% 25.0% 27.0% 60-Day VWAP $17.59 $42.96 0.4094x 2.1% 7.4% 18.1% 28.9% 39.6% 41.9% (9.3%) (4.5%) 5.0% 14.5% 24.1% 26.1% 1-Year VWAP $17.87 $50.31
0.3553x 0.4% 5.7% 16.3% 26.8% 37.4% 39.6% 4.5% 10.0% 21.0% 32.0% 43.0% 45.3% 2-Year VWAP $17.82 $43.85 0.4063x 0.8% 6.0% 16.6% 27.2% 37.8% 40.0% (8.6%) (3.8%) 5.8% 15.4% 25.0% 27.0% 5-Year VWAP $19.09 $41.52 0.4597x (5.9%) (1.0%) 8.9% 18.8% 28.7%
30.7% (19.2%) (15.0%) (6.5%) 2.0% 10.5% 12.3% 52-Week High $19.72 $66.19 0.2979x (9.0%) (4.2%) 5.4% 14.9% 24.5% 26.5% 24.7% 31.2% 44.3% 57.4% 70.5% 73.3% Research Analyst Target $19.50 $56.00 0.3482x (7.9%) (3.1%) 6.6% 16.2% 25.9% 28.0% 6.7% 12.2%
23.4% 34.7% 45.9% 48.2% Source: FactSet as of 7/20/2023. 1. Reflecting 0.3714x exchange ratio on DINO’s 30-day VWAP of $45.16 as of 7/20/2023 plus $7.00 cash per unit. (4) (2) Initial Offer Counteroffer 2. Reflecting 0.3714x exchange ratio on
DINO’s share price of $48.34 as of 7/20/2023 plus $7.00 cash per unit. 3. 5-day, 10-day, 20-day, 30-day and 60-day reflecting trading days. 1-year, 2-year and 3-year reflecting calendar days. 4. Initial offer of $17.95 per unit reflecting
0.3714x exchange ratio on DINO’s share price of $48.34 as of 7/20/2023. Initial offer equal to $17.07 based on 30-day VWAP as of undisturbed date of 5/3/2023. 3 Better for HEP Better for DINO

DINO | Relative Valuation (1) EV / EBITDA (EV / EBITDA) 2023E 2024E
2025E EV / 2023E EBITDA EV / 2024E EBITDA Median: 4.4x 5.6x 6.3x EV / 2025E EBITDA 7.4x 7.0x 8.0x 6.8x 6.6x 6.5x 6.3x 6.2x 6.2x 5.6x 5.5x 5.5x 5.3x 5.3x 6.0x 4.6x 4.6x 4.6x 4.4x 4.1x 4.1x 4.0x 3.7x 3.2x 3.2x 4.0x 2.5x 2.0x 0.0x (2) Price / Parent
CFPS (Price / Parent CFPS) 2023E 2024E 2025E Price / 2023E Parent CFPS Median: 4.6x 5.4x 7.3x Price / 2024E Parent CFPS Price / 2025E Parent CFPS 15.2x 10.8x 12.0x 8.0x 9.0x 7.5x 7.3x 7.1x 6.7x 6.6x 6.5x 6.0x 5.4x 5.2x 5.2x 5.0x 4.7x 4.8x 4.6x 4.6x
6.0x 4.4x 4.2x 4.1x 4.2x 4.0x 2.5x 3.0x 0.0x Consolidated Debt / 1. 1x 1.7x 1.8x 1.5x 3.1x 0.9x 1.1x 0.7x (3) 2023E EBITDA Consolidated Net Debt / 2023E 0.6x 1.1x 1.0x 0.9x 2.1x 0.4x (0.2)x (0.1)x (4) EBITDA Source: Management projections, company
filings, FactSet, and Wall Street research as of 7/20/2023. 1. DINO EBITDA reflecting management estimates. Peers per FactSet consensus. 2. DINO and peers reflecting FactSet consensus. Adj. CFPS is adjusted to remove third-party distributions to
unaffiliated MLP public unitholders. Adj. CFPS based on Adj. CFFO per share based on shares outstanding from Management projections. Remaining peers calculated from median consensus. 3. Calculated as current Consolidated Debt / Projected
Consolidated EBITDA. 4. Calculated as Consolidated Debt less Cash / Projected Consolidated EBITDA. 4

HEP | Relative Valuation EV / EBITDA Debt + Pref. / EBITDA 2022A 2023E
2023E-2025E Debt + Pref. / 2022A EBITDA 1.7% 2.5% 3.3% 3.3% 0.8% EBITDA CAGR Median: 4.9x 4.1x Debt + Pref. / 2023E EBITDA 7.0x 2023E 2024E 2025E EV / 2023E EBITDA 5.9x Median: 9.0x 8.5x 8.6x 6.0x 5.5x EV / 2024E EBITDA 12.0x 4.9x 10.5x 10.2x 5.0x
10.0x EV / 2025E EBITDA 9.7x 10.0x 4.4x 9.0x 4.3x 9.1x 8.7x 8.4x 8.4x 8.2x 3.7x 8.2x 7.9x 7.9x 8.0x 4.0x 3.7x 7.7x 3.6x 8.0x 3.3x 3.3x 3.0x 6.0x 2.0x 4.0x 2.0x 1.0x 0.0x 0.0x Latest Quarterly Distribution Yield Levered FCF Yield LQA DCF 2023E
Levered FCF Yield 2023E 2024E 2025E 1.9x 2.3x 1.4x 1.3x 2.7x Coverage Median: 10.6% 13.1% 13.8% 2024E Levered FCF Yield 20% 12.0% Median: 8.0% 2025E Levered FCF Yield 15.1% 9.2% 14.6% 14.2% 13.8% 15% 13.6% 13.8% 13.7% 8.6% 9.0% 12.5% 7.4% 7.6% 7.3%
11.9% 11.6% 10.9% 10.6% 9.7% 9.6% 10% 6.0% 5% 3.0% NA 0.0% 0% Source: HEP per DINO Management forecast. Peers per Public filings, FactSet, and Wall Street research as of 7/20/2023. Magellan share price as of the unaffected date of the Oneok
acquisition, 5/12/2023. 5

HEP | Indicative Purchase Price Ratio Analysis Indicative Purchase Price
Ratio Analysis (1) (2) Initial Offer Counteroffer ($ in millions, except per share data) DINO SQ HEP SQ 6/30/23E 6/30/23E Illutrative Purchase Price Price as of 7/20/23 $48.34 $18.89 $17.95 $19.83 $20.78 $21.72 $22.67 $23.61 $24.56 $24.95 Implied
Premium / (Discount) to HEP Spot Price as of 7/20/23 (5%) 5% 10% 15% 20% 25% 30% 32% 126.6 Diluted Shares / Units Oustanding 194.1 126.6 126.6 126.6 126.6 126.6 126.6 126.6 126.6 Total Equity Value $9,384 $2,391 $2,273 $2,511 $2,631 $2,750 $2,870
$2,989 $3,109 $3,159 Total Debt (Consolidated) 3,199 1,492 1,492 1,492 1,492 1,492 1,492 1,492 1,492 1,492 Preferred Equity - 62 62 62 62 62 62 62 62 62 Non-Controlling Interest 1,262 69 69 69 69 69 69 69 69 69 Cash (Consolidated) (1,500) (15) (15)
(15) (15) (15) (15) (15) (15) (15) Enterprise Value $12,345 $3,999 $3,881 $4,119 $4,238 $4,358 $4,478 $4,597 $4,717 $4,767 Public Units Outstanding 67.0 67.0 67.0 67.0 67.0 67.0 67.0 67.0 67.0 Total Value of Public Units $1,265 $1,202 $1,328 $1,392
$1,455 $1,518 $1,581 $1,645 $1,671 Implied Exchange Ratio 0.3908x 0.3714x 0.4103x 0.4299x 0.4494x 0.4689x 0.4885x 0.5080x 0.5162x Precedent Premium Premium / Discount to: Median Mean Current 7/20/23 - - (5.0%) 5.0% 10.0% 15.0% 20.0% 25.0% 30.0%
32.1% 12.6% 13.9% Unaffected Price 15.3% 18.7% 12.8% 24.6% 30.5% 36.5% 42.4% 48.3% 54.3% 56.7% 52-Week High (27.0%) (1.0%) (5.9%) 3.9% 8.9% 13.8% 18.8% 23.7% 28.7% 30.7% Research Analyst Target (13.7%) 2.1% (3.0%) 7.2% 12.3% 17.4% 22.5% 27.6% 32.7%
34.9% Trading Comparables (3) (3) DINO SQ HEP SQ Peer Peer Transaction Median Mean Comparables Enterprise Value as a Multiple of: Data Data EBITDA 2023E $3,030 4.1x $458 8.7x 8.5x 9.0x 9.3x 9.5x 9.8x 10.0x 10.3x 10.4x 9.0x 9.2x 10.1x 2024E 2,662
4.6x 477 8.4x 8.1x 8.6x 8.9x 9.1x 9.4x 9.6x 9.9x 10.0x 8.5x 8.8x 10.1x 2025E 2,698 4.6x 474 8.4x 8.2x 8.7x 9.0x 9.2x 9.5x 9.7x 10.0x 10.1x 8.6x 8.7x Equity Value as a Multiple of: Earnings per Share 2023E $8.77 5.5x $2.08 9.1x 8.6x 9.6x 10.0x 10.5x
10.9x 11.4x 11.8x 12.0x 12.0x 12.6x 2024E 7.27 6.7x 2.36 8.0x 7.6x 8.4x 8.8x 9.2x 9.6x 10.0x 10.4x 10.6x 10.4x 11.4x 2025E 7.43 6.5x 2.44 7.7x 7.4x 8.1x 8.5x 8.9x 9.3x 9.7x 10.1x 10.2x 10.6x 11.3x Yield Analysis: Dividends LQA $1.80 3.7% $1.40 7.4%
7.8% 7.1% 6.7% 6.4% 6.2% 5.9% 5.7% 5.6% 8.1% 8.2% 2023E 1.80 3.7% 1.40 7.4% 7.8% 7.1% 6.7% 6.4% 6.2% 5.9% 5.7% 5.6% 2024E 1.80 3.7% 1.40 7.4% 7.8% 7.1% 6.7% 6.4% 6.2% 5.9% 5.7% 5.6% 2025E 1.80 3.7% 1.40 7.4% 7.8% 7.1% 6.7% 6.4% 6.2% 5.9% 5.7% 5.6%
YE Leverage Total Debt / EBITDA 2022A $3,199 0.7x $1,492 3.6x 3.6x 3.6x 3.6x 3.6x 3.6x 3.6x 3.6x 3.6x 4.9x 4.8x 2023E 3,199 1.1x 1,492 3.3x 3.3x 3.3x 3.3x 3.3x 3.3x 3.3x 3.3x 3.3x 4.1x 4.1x Source: Projections per DINO Management. Market data as of
7/20/2023. Balance sheet data per DINO estimates of 6/30/2023. 1. Initial offer of $17.95 per unit reflecting 0.3714x exchange ratio on DINO’s share price of $48.34 as of 7/20/2023. Initial offer equal to $17.07 based on 30-day VWAP as of
undisturbed date of 5/3/2023. 2. Counteroffer of $24.95 per unit reflecting 0.3714x exchange ratio on DINO’s share price of $48.34 as of 7/20/2023 plus $7.00 cash per unit. 3. Peers include DKL, MMP, NS and PAA. 6

Appendix

DINO | Comparable Companies DINO Trading Comparables ($ in millions,
except per share values) Peer Median Stock Price as of 7/20/2023 $48.34 $124.25 $104.05 $120.73 $42.73 $33.35 $24.99 $28.70 Diluted Shares Outstanding 194 428 464 362 131 103 68 63 Total Equity Value $9,384 $53,132 $48,269 $43,646 $5,612 $3,429
$1,708 $1,800 Total Debt 3,199 27,659 18,730 11,431 1,469 1,597 2,840 550 Cash 1,500 11,452 6,705 5,521 1,616 601 885 661 Net Debt 1,699 16,207 12,025 5,910 (147) 996 1,954 (111) (1) Minority Interest 1,262 12,289 -- -- -- 587 440 -- Enterprise
Value $12,345 $81,627 $60,294 $49,556 $5,466 $5,012 $4,103 $1,688 Enterprise Value to: 2023E EBITDA 4.1x 5.3x 5.3x 3.7x 2.5x 4.6x 4.4x 3.2x 4.4x 2024E EBITDA 4.6x 7.0x 6.2x 5.5x 3.2x 6.8x 5.6x 4.1x 5.6x 2025E EBITDA 4.6x 7.4x 6.5x 6.3x 4.0x 6.6x
6.2x 5.5x 6.3x 2023E EBIT 4.2x 6.5x 6.2x 4.6x 3.3x 6.1x 7.4x 4.2x 6.1x 2024E EBIT 6.4x 10.0x 7.4x 7.3x 4.8x 9.3x 11.3x 6.6x 7.4x 2025E EBIT 6.3x 10.7x 7.7x 9.0x 7.0x 10.3x 15.4x 9.1x 9.1x Equity Value to: 2023E CFFO 4.8x 4.2x 5.7x 4.2x 3.4x 4.1x
2.7x 3.9x 4.1x 2024E CFFO 5.1x 5.0x 6.0x 5.4x 4.1x 6.3x 3.5x 5.1x 5.1x 2025E CFFO 5.0x 5.2x 6.2x 5.7x 4.5x 9.2x 3.7x 6.0x 5.7x 2023E Net Income 5.5x 6.6x 7.5x 5.6x 4.9x 7.7x 7.7x 5.1x 6.6x 2024E Net Income 6.7x 9.6x 8.7x 9.3x 6.8x 15.5x 18.9x 8.7x
9.3x 2025E Net Income 6.5x 10.5x 8.7x 11.0x 9.5x 17.0x N/M 12.6x 10.7x Source: DINO Management, Company filings, FactSet, Wall Street research and investor presentations as of 7/20/2023. DINO balance sheet data per management estimates of 6/30/2023.
1. Reflects market value of public interest in MLP. Does not include preferred equity held by subsidiaries. 7

HEP | Comparable Companies HEP Trading Comparables ($ in millions
except per unit data) Peer Median (1) Unit Price as of 7/20/23 $18.89 $47.55 $17.47 $55.41 $14.72 % of 52-week high (Close) 96% 76% 100% 100% 100% 100% Fully Diluted Units Outstanding 127 44 111 202 698 Total Equity Value $2,391 $2,072 $1,938
$11,198 $10,280 Debt 1,492 1,717 3,094 5,112 8,041 Preferred Equity 62 - 1,199 - 2,666 Noncontrolling Interest 69 - - - - Cash (15) ( 11) ( 5) (7) (526) Enterprise Value $3,999 $3,778 $6,225 $16,303 $20,461 Enterprise Value / 2023E EBITDA 8.7 x 9.7
x 8.2 x 10.5 x 8.2 x 9.0 x 2024E EBITDA 8.4 x 9.0 x 7.9 x 10.2 x 7.9 x 8.5 x 2025E EBITDA 8.4 x 9.1 x 7.7 x 10.0 x 8.0 x 8.6 x Valuation Metrics LQA Yield 7.41% 8.62% 9.16% 7.56% 7.27% 8.09% 2023E Yield 7.41% 8.71% 9.16% 7.60% 7.27% 8.15% 2024E
Yield 7.41% 9.02% 9.16% 7.67% 8.29% 8.66% 2025E Yield 7.41% 9.59% 9.16% 7.74% 9.31% 9.23% 2023E DCF Yield 13.88% 12.67% 19.35% 11.05% 15.64% 14.16% 2024E DCF Yield 14.60% 14.96% 19.77% 11.46% 17.97% 16.47% 2025E DCF Yield 15.07% NA 19.97% 11.79%
17.51% 17.51% 2023E FCF Yield 13.74% 9.58% 11.87% 9.73% 11.56% 10.64% 2024E FCF Yield 14.60% 12.55% 13.57% 10.57% 14.23% 13.06% 2025E FCF Yield 15.07% NA 13.78% 10.89% 13.76% 13.76% 2023E EPS $2.08 $3.91 $1.14 $5.03 $1.24 $3.91 2024E EPS 2.36 4.67
1.20 5.26 1.42 4.67 2025E EPS 2.44 4.89 1.22 5.42 1.34 4.89 Coverage 2023E Coverage 1.87 x 1.46 x 2.11 x 1.45 x 2.15 x 1.78 x 2024E Coverage 1.97 x 1.66 x 2.16 x 1.49 x 2.17 x 1.91 x 2025E Coverage 2.03 x NA 2.18 x 1.52 x 1.88 x 1.88 x Credit
Statistics Debt / 2022A EBITDA 3.6 x 5.5 x 4.3 x 3.6 x 3.2 x 3.9 x Debt / 2023E EBITDA 3.3 x 4.4 x 4.1 x 3.3 x 3.2 x 3.7 x Debt + Pref / 2023A EBITDA 3.7 x 5.5 x 5.9 x 3.6 x 4.3 x 4.9 x Debt + Pref / 2023E EBITDA 3.3 x 4.4 x 4.9 x 3.3 x 3.7 x 4.1 x
Source: DINO Management, Company filings, FactSet, Wall Street research and investor presentations as of 7/20/2023. HEP balance sheet data per management estimates of 6/30/2023. 1. Magellan unaffected share price as of 5/12/2023 prior to Oneok
acquisition. 8

HEP | Equity Analyst Price Targets (1) (2) Research Price Targets
Premium / (Discount) % to Current Price ($ / share) Median Analyst Target Price Premium / (Discount) to: Current Price (2%) (3) Current: $55.41 $70.00 0.35 $64.00 Current: $47.55 0.3 $60.00 0.25 Current: Current: $50.00 $47.00 $14.72 $17.47 0.2 16%
$40.00 0.15 9% Median 9% 0.1 $30.00 Price 6% Target: 0.05 $19.50 $19.00 $20.00 $19.00 $17.00 $18.00 $20.00 (1%) $16.00 Current 0 HEP: 1% $10.00 $18.89 -0.05 (5%) $0.00 -0.1 Analyst 1 Analyst 2 Analyst 3 Analyst 4 7/11/2023 5/6/2023 5/4/2023 4/3/2023
Analyst Recommendation 0 2 1 4 Buy ✓ 1 3 4 2 Hold ~ 0 1 1 0 Sell O O 1 6 6 6 Source: FactSet as of 7/20/2023. 1. Includes available reports from reputable brokers that have provided a price target. 2. Peer group price targets reflect average
analyst price target. 3. Reflects unaffected price from 5/12/2023 prior to Oneok acquisition. 9

DINO | Equity Analyst Price Targets (1) (2) Research Price Targets
Premium / (Discount) % to Current Price Price Targets ($ / share) Median Analyst Target Price Premium / (Discount) to: Current Price 16% Current: Current: Current: Current: Current: Current: Current: $124.35 $104.05 $120.73 $33.35 $24.99 $42.73
$28.70 $146.00 $122.0 $142.00 0.7 $80.00 $70.00 0.6 $63.00 Median $61.00 Analyst: $57.00 $60.00 $56.00 $56.00 $55.00 $56.00 0.5 $54.00 $52.00 $50.00 $47.00 $50.00 0.4 Current $40.00 DINO: $40.00 $48.34 0.3 $31.00 $29.00 $30.00 30% $26.00 26% 16% 18%
17% 0.2 14% $20.00 18% 10% 18% Peers 16% 8% 0.1 Median: $10.00 3% 4% 10% 12% 8% 0 $0.00 Analyst 1 Analyst 2 Analyst 3 Analyst 4 Analyst 5 Analyst 6 Analyst 7 Analyst 8 Analyst 9 Analyst 10 7/19/23 7/18/23 7/18/23 7/14/23 7/10/23 7/10/23 7/9/23
7/6/23 5/25/23 4/9/23 Analyst Recommendation 9 7 9 0 1 2 3 Buy ✓✓✓✓✓✓ 2 3 2 3 5 6 1 Hold ~ ~ ~ ~ 0 0 0 0 2 0 0 Sell Source: FactSet as of 7/20/2023. 11 10 11 3 8 8 4 1. Includes available reports from
reputable brokers since Q1’23 earnings release that have provided a price target. 2. Peer group price targets reflect median analyst price target. 10

HEP | Comparable Transaction Analysis Selected MLP Buy-in Transactions
Total Initial Initial Premium Paid Premium Paid - (2) (3) Announced Transaction Enterprise Value Price Premium Final (Days Prior to Initial Ann.) (Days Prior to Final Ann.) EV / FY+1 30-Day 30-Day (1) Date Acquirer Target Value ($MM) Acquirer Target
Offered Offered Price 1-Day 1-Day EBITDA Consideration Process VWAP VWAP 8/17/2022 $3,783 $68,412 $14,229 $34.75 0.0% $41.75 20.1% 24.0% 6.2% 8.2% 8.4x 100% Cash Ann. then Negotiate (4) 7/28/2022 $579 $7,229 $1,690 $15.14 13.4% $17.66 32.3% 11.0%
(3.4%) 9.9% 7.3x Cash and Unit Exchange Ann. then Negotiate 7/6/2022 $131 NA $824 $17.90 (0.3%) $25.00 39.3% 42.8% 2.8% 8.6% 10.3x 100% Cash Ann. then Negotiate 4/22/2022 $400 NA $595 $3.32 0.9% $4.65 41.3% 42.7% 40.9% 40.7% 11.1x 100% Cash Ann.
then Negotiate (5) 2/11/2022 $2,608 $237,598 $9,749 $12.89 0.0% $15.85 23.0% 23.5% 9.6% 11.6% 12.6x 100% Cash Ann. then Negotiate 10/27/2021 $3,466 $16,829 $13,076 $32.57 0.0% $41.11 4.8% 7.6% 4.8% 7.6% 9.7x 100% Unit Exchange Negotiate then Ann.
(6) 8/5/2021 $874 $126,182 $1,694 $13.01 0.0% $15.12 16.2% 8.9% 17.1% 17.2% 9.7x 100% Unit Exchange Ann. then Negotiate (7) 2/5/2021 $1,149 $201,401 $2,872 $12.47 0.0% $14.56 16.7% 18.7% (3.3%) 5.8% 7.4x 100% Unit Exchange Ann. then Negotiate (8)
10/5/2020 $2,829 $74,892 $3,361 $27.31 5.4% $30.95 19.5% 15.1% 0.6% (0.7%) 10.1x 100% Unit Exchange Ann. then Negotiate 7/27/2020 $693 $4,419 $1,312 $8.38 4.5% $8.47 28.1% 29.1% 28.1% 29.1% 7.3x 100% Unit Exchange Negotiate then Ann. 11/26/2018 $536
NA $1,246 $38.00 4.4% $41.00 12.6% 9.5% 12.6% 9.5% 10.6x 100% Cash Negotiate then Ann. 11/8/2018 $8,965 $7,251 $12,230 $43.77 5.0% $50.33 7.6% 14.3% 7.6% 14.3% 11.2x 100% Unit Exchange Negotiate then Ann. 10/18/2018 $1,850 $50,344 $3,660 $40.00
10.7% $42.25 6.0% 10.2% 6.0% 10.2% 10.2x 100% Cash Negotiate then Ann. 9/19/2018 $2,634 $86,611 $6,683 $17.75 0.0% $18.22 2.6% 8.8% 0.5% 1.0% 29.6x 100% Unit Exchange Ann. then Negotiate (9) 8/1/2018 $60,345 $26,932 $80,353 $21.32 5.0% $23.59 11.2%
17.5% 11.2% 17.5% 7.0x 100% Unit Exchange Negotiate then Ann. (10) 5/29/2018 $300 $5,332 $3,262 $21.86 (1.1%) $21.86 (1.1%) 9.2% (1.1%) 9.2% 6.2x 100% Unit Exchange Tender Offer (11) 5/17/2018 $4,779 $123,056 $27,256 $33.10 0.0% $40.00 20.8% 18.4%
5.7% 6.8% 14.3x 100% Unit Exchange Ann. then Negotiate (12) 5/17/2018 $10,010 $121,978 $14,694 $10.08 0.0% $11.48 13.9% 16.4% 2.1% 0.3% 10.1x 100% Unit Exchange Ann. then Negotiate 5/17/2018 $15,105 $29,816 $55,383 $36.94 5.2% $40.89 6.4% 11.2% 6.4%
11.2% 11.8x 100% Unit Exchange Negotiate then Ann. 3/27/2018 $3,224 $3,418 $4,942 $41.34 (0.5%) $35.42 0.6% (8.1%) 0.6% (8.1%) 6.3x 100% Unit Exchange Negotiate then Ann. Source: Price data per FactSet. Transaction value and consideration paid based
on public filings, company press releases, and investor presentations. 1. Transaction value includes only un-affiliated and proportional net debt. 2. Premium paid to initial announcement represents the premium based on the final agreed upon price
relative to the original offer’s unaffected date. 3. Premium paid to final announcement represents the premium based on the final agreed upon price relative to the final announcement’s unaffected date. 4. Initial price offered not yet
disclosed. Transaction value and premium reflect unaffected DINO price as of 7/27/2022. Initial announcement date reflects filing of Schedule 13D/A on June 24, 2022. 5. Shell / Shell Midstream Partners LP based on revised offer announced 7/25/2022.
Premium paid based on closing price prior to original announcement on 2/11/2022. 6. BP / BP Midstream Partners LP based on revised offer announced 12/20/2021. Premium paid based on closing price prior to original announcement on 8/4/2021. 7. Chevron
/ Noble Midstream Partners based on revised offer announced 3/5/2021. Premium paid based on closing price prior to original announcement on 2/4/2021. 8. TC Energy / TC Pipeline based on revised offer announced 12/15/2020. Premium paid based on
closing price prior to original announcement on 10/5/2020. 9. Dominion Energy / Dominion Energy Midstream based on revised offer announced 11/23/2018. Premium paid based on closing price prior to original announcement on 9/8/2018. 10. Reflects the
5/29/18 exchange offer; CVI announced it would exercise the call right on 1/17/19. 11. Enbridge / Spectra premiums based on revised offer announced on 8/24/2018. Enbridge price performance based on original announcement on 5/17/2018. 12. Enbridge /
Enbridge Energy Partners based on revised offer announced 9/18/2018. Enbridge price performance based on original announcement on 5/17/2018. 11

HEP | Comparable Transaction Analysis (Cont’d) Selected MLP
Buy-in Transactions Total Initial Initial Premium Paid Premium Paid (2) (3) Announced Transaction Enterprise Value Price Premium Final (Days Prior to Initial Ann.) (Days Prior to Final Ann.) EV / FY+1 30-Day 30-Day (1) Date Acquirer Target Acquirer
Target Offered Offered Price 1-Day 1-Day EBITDA Consideration Process Value ($MM) VWAP VWAP 11/8/2017 $173 $3,189 $845 $11.80 3.0% $13.92 3.0% 11.5% 3.0% 11.5% 4.6x 100% Unit Exchange Negotiate then Ann. 8/29/2017 $736 NA $736 $14.50 0.4% $16.50
15.2% 12.4% 15.2% 12.4% 12.3x 100% Cash Negotiate then Ann. 5/18/2017 $651 NA $963 $20.00 20.1% $20.00 20.1% 20.4% 20.1% 20.4% 12.3x 100% Cash Tender Offer 4/4/2017 $157 NA $594 $16.80 5.8% $17.30 5.8% 5.6% 5.8% 5.6% 9.1x 100% Cash Tender Offer
3/2/2017 $781 NA $1,470 $18.75 1.9% $19.50 6.0% 5.6% 4.3% 3.4% 9.3x 100% Cash Ann. then Negotiate 1/27/2017 $1,656 $77,129 $1,656 $6.25 (4.6%) $8.00 (8.6%) 1.8% (8.6%) 1.8% 11.0x 100% Cash Negotiate then Ann. 11/1/2016 $5,180 $77,381 $9,684 $15.75
2.9% $17.00 11.1% 16.0% 6.3% 5.2% 18.0x 100% Cash Ann. then Negotiate Selected MLP Transactions From 2016 - 2023 YTD Mean 3.0% 13.9% 15.0% 7.5% 10.0% 10.7x Median 0.9% 12.6% 12.4% 5.8% 9.2% 10.1x High 20.1% 41.3% 42.8% 40.9% 40.7% 29.6x Low (4.6%)
(8.6%) (8.1%) (8.6%) (8.1%) 4.6x Selected 100% Stock MLP Transactions From 2016 - 2023 YTD Mean 1.9% 10.8% 12.8% 6.0% 8.8% 10.4x Median 0.0% 9.4% 12.9% 3.9% 8.4% 9.7x High 5.4% 28.1% 29.1% 28.1% 29.1% 29.6x Low (1.1%) (1.1%) (8.1%) (3.3%) (8.1%)
4.6x Selected MLP Transactions From 2021 - 2023 YTD Mean 1.8% 24.2% 22.4% 9.4% 13.7% 9.6x Median 0.0% 21.6% 21.1% 5.5% 9.3% 9.7x High 13.4% 41.3% 42.8% 40.9% 40.7% 12.6x Low (0.3%) 4.8% 7.6% (3.4%) 5.8% 7.3x Source: Price data per FactSet.
Transaction value and consideration paid based on public filings, company press releases, and investor presentations. HEP data per DINO Management forecast. 1. Transaction value includes only un-affiliated and proportional net debt. 2. Premium paid
to initial announcement represents the premium based on the final agreed upon price relative to the original offer’s unaffected date. 3. Premium paid to final announcement represents the premium based on the final agreed upon price relative to
the final offer’s unaffected date. 4. Reflects DINO management estimates of balance sheet data for 6/30/2023. 12

Proposed OKE / MMP Transaction Summary Transaction Summary 1-Day
Trading Performance — On May 14, 2023, ONEOK, Inc. (“ONEOK”) announced that it will Buyers Targets acquire all outstanding units of Magellan Midstream Partners, L.P. (“Magellan”) for ~$18.8bn, including assumed debt
15.0% 8.0% ¡ Consideration will consist of $25.00 in cash and 0.6670 shares of ONEOK common stock for each outstanding Magellan common unit 4.0% 12.0% Transaction & ¡ Implied premium of ~22% to Magellan’s closing share price
Purchase Price th on Friday, May 12 (~15% premium based on ONEOK’s 0.0% 9.0% th closing sharing price on Monday, May 15 ) (0.6%) ¡ ONEOK has secured $5.25 billion of fully-committed bridge (4.0%) 6.0% financing for the proposed cash
consideration (a Notes offering is expected prior to closing) (8.0%) ¡ Transaction expected to close in Q3 2023 3.0% (9.1%) — Expected to be accretive to earnings per share beginning in 2024 (12.0%) 0.0% with EPS accretion of 3-7% per year
in 2025-2027 — Expected to be free cash flow per share accretive, averaging more than 20% 2024-2027 Transaction — Forecasted synergies are expected to total at least $200mm Consequences annually, with potential to move as high as $400mm
MMP Enterprise Value Build & Multiples — Benefit from the tax basis step-up has an estimated total value of ($ in millions) ~$3.0bn 5/12/23 Close Offer Price 5/15/23 Close Share Price $55.41 $55.41 $62.61 — Pro forma 2024 year-end Net
Debt / EBITDA of ~4.0x Implied Premium to 5/12/2023 Close - 21.8% 14.9% Offer Price $55.41 $67.50 $63.65 — Adds a leading, and primarily fee-based, refining products and Units Outstanding 202 202 202 crude oil transportation business to ONEOK
Equity Value $11,198 $13,642 $12,864 (1) — Complementary and diversified asset positions, presenting Plus: Debt 5,112 5,112 5,112 significant potential for enhanced customer product offerings and Less: Cash (7) (7) (7) increased international
export opportunities Enterprise Value $16,303 $18,747 $17,969 Disclosed MMP — Expected immediate financial benefits, including cost, operational, Enterprise Value as a Mult. of: Statistic Rationale and tax synergies, supporting meaningful
expected accretion 2024E EBITDA $1,599 10.2x 11.7x 11.2x — A significant increase in free cash flow, which provides additional 2025E EBITDA 1,630 10.0x 11.5x 11.0x cash for debt reduction, growth capital, and value returned to (2) 2024E EBITDA
Adj. for Synergies $1,899 8.6x 9.9x 9.5x (2) shareholders through dividends and/or repurchasing shares 2025E EBITDA Adj. for Synergies 1,930 8.4x 9.7x 9.3x — Strong IG credit ratings with enhanced scale and diversification Equity Value as a
Mult. of: 2024E DCF $1,283 11.5% 9.4% 10.0% — $275mm breakup fee Other Key 2025E DCF 1,320 11.8% 9.7% 10.3% Merger — Magellan will be merged into a newly created 100% wholly-owned Agreement Items subsidiary of ONEOK Source: Company
filings, Wall Street Research, and FactSet. 1. Includes $112mm in long-term lease liabilities. 2. Assumes $300mm in synergies. Excludes tax savings. 13 PAA 5.2% ET 1.5% TRP 0.7% ENB 0.5% EPD 0.1% KMI OKE MMP 13.0% CEQP 8.6% PAA 5.2% NS 4.1% KNTK
3.6% WES 2.6% HEP 2.1% DTM 1.8% TRGP 1.3%

Disclaimer The preceding pages contain material that was provided to
the Board of Directors (the “Board”) of HF Sinclair Corporation (the “Company”) by Barclays Capital Inc. (“Barclays”). The accompanying material and any Barclays presentation related to the material was compiled
or prepared on a confidential basis solely for consideration by the Board and no part of it may be reproduced, distributed or transmitted without the prior written consent of Barclays. The information contained in this material was obtained from the
Company and/or publicly available sources, and Barclays has relied upon such information without independent verification thereof and does not assume any liability for any such information. These materials are being provided in connection with an
actual corporate engagement and may not be used or relied upon for any purpose other than as specifically contemplated by a written agreement with Barclays. Moreover, any information provided herein was not prepared for or intended for use by any
individual for personal, family or household purposes. Any estimates, historical financial information, projections and other information contained herein have been prepared by management of the Company or were obtained from publicly available
sources (approved for Barclays’ use by the Company) or are based upon such estimates and projections. With respect to such estimates and projections, Barclays has assumed that they have been reasonably prepared on a basis reflecting the best
currently available estimates, projections and judgment of the management of the Company. The projections contained herein may or may not be achieved and differences between projected results and those actually achieved may be material. No
representation or warranty, expressed or implied, is made as to the accuracy or completeness of such information and nothing contained herein is, or shall be relied upon as, a promise or representation, whether as to the past or the future. The
analysis contained herein is based on current market conditions which are subject to change and Barclays assumes no obligation to update or otherwise revise these materials. Nothing in these materials shall be deemed to constitute a recommendation
or investment, legal, tax, financial, accounting or other advice. Because these materials were prepared for use in the context of a presentation to the Board, these materials are incomplete without reference to, and should be assessed solely in
conjunction with, the oral briefing provided by Barclays to the Board (in their capacity as directors and not in any individual capacity and is not for the benefit of any individual, including any individual officer, director, shareholder or any
other person). These materials were not prepared for or intended for use by any individual for personal, family or household purposes nor were they prepared to comply with the disclosure standards under state and federal securities laws or any other
applicable laws and, to the extent the material may be considered by readers not as familiar with the business and affairs of the Company as the Board, none of the Company, Barclays, their respective affiliates or any of their respective legal or
financial advisors or accountants takes any responsibility for the accuracy or completeness of any of the material if used by persons other than the Board. These materials are not intended to provide the sole basis for evaluation of the proposed
corporate transaction and do not purport to contain all information that may be required and should not be considered a recommendation with respect to the proposed corporate transaction. Barclays has not made or obtained any evaluations or
appraisals of the assets or liabilities of the Company or any other party to any corporate transaction or any of their respective affiliates and has no obligation to evaluate the solvency of the Company or any other party to any transaction under
any state or federal laws relating to bankruptcy, insolvency or similar matters. The analyses contained herein do not purport to be appraisals nor do they necessarily reflect the prices at which businesses or securities actually may be sold or
purchased. Barclays’ role in any due diligence review is limited solely to performing such a review as it shall deem necessary to support its own advice and analysis and shall not be on behalf of the Company, the Board or any individual
officer, director, shareholder or any other person. Barclays, its subsidiaries and affiliates engage in a wide range of businesses from investment and commercial banking, lending, asset management and other financial and non-financial services. In
the ordinary course of its business, Barclays and its affiliates may actively trade and effect transactions in the equity, debt and/or other securities (and any derivatives thereof) and financial instruments (including loans and other obligations)
of the Company for its own account and for the accounts of its customers and, accordingly, may at any time hold long or short positions and investments in such securities and financial instruments or in other financial products and instruments.
Unless otherwise expressly agreed or provided for in other applicable Barclays disclosures governing such corporate transactions or required by law or regulation, Barclays conducts these activities as principal and executes its principal
transactions as an arm’s length counterparty. Barclays does not act as a fiduciary in relation to these corporate transactions. These materials do not constitute investment advice nor do they form part of an offer to sell or purchase, or the
solicitation of an offer to sell or purchase, any securities or any of the businesses or assets described herein or an offer of financing or an offer or recommendation to enter into any corporate transaction described herein. Barclays Capital Inc.
is the United States investment bank of Barclays Bank PLC. Barclays Bank PLC is authorised by the Prudential Regulation Authority and regulated by the Financial Conduct Authority and the Prudential Regulation Authority (Financial Services Register
No. 122702). Registered in England. Registered No. 1026167. Registered office: 1 Churchill Place, London E14 5HP. Copyright Barclays Bank PLC, 2023 (all rights reserved). 14

Exhibit (c)(2)(D) Board Presentation August 1, 2023
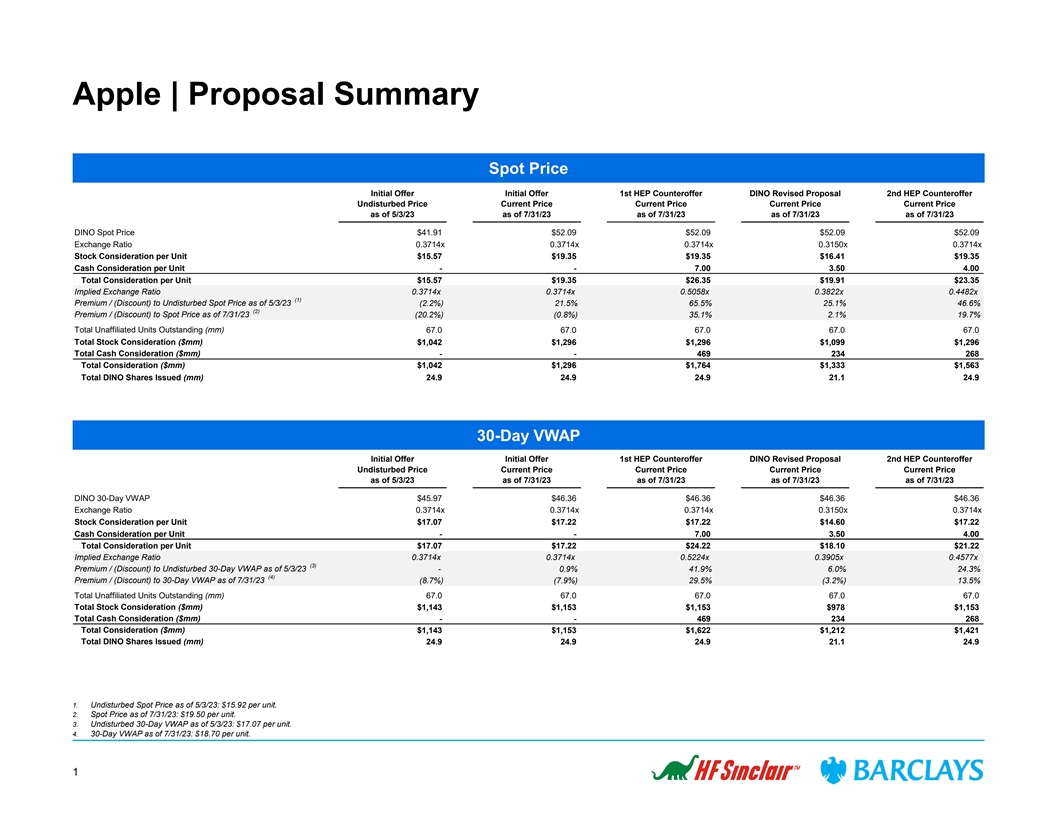
Apple | Proposal Summary Spot Price Initial Offer Initial Offer 1st HEP
Counteroffer DINO Revised Proposal 2nd HEP Counteroffer Undisturbed Price Current Price Current Price Current Price Current Price as of 5/3/23 as of 7/31/23 as of 7/31/23 as of 7/31/23 as of 7/31/23 DINO Spot Price $41.91 $52.09 $52.09 $52.09 $52.09
Exchange Ratio 0.3714x 0.3714x 0.3714x 0.3150x 0.3714x Stock Consideration per Unit $15.57 $19.35 $19.35 $16.41 $19.35 Cash Consideration per Unit - - 7.00 3.50 4.00 Total Consideration per Unit $15.57 $19.35 $26.35 $19.91 $23.35 Implied Exchange
Ratio 0.3714x 0.3714x 0.5058x 0.3822x 0.4482x (1) Premium / (Discount) to Undisturbed Spot Price as of 5/3/23 (2.2%) 21.5% 65.5% 25.1% 46.6% (2) Premium / (Discount) to Spot Price as of 7/31/23 (20.2%) (0.8%) 35.1% 2.1% 19.7% Total Unaffiliated
Units Outstanding (mm) 67.0 67.0 67.0 67.0 67.0 Total Stock Consideration ($mm) $1,042 $1,296 $1,296 $1,099 $1,296 Total Cash Consideration ($mm) - - 469 234 268 Total Consideration ($mm) $1,042 $1,296 $1,764 $1,333 $1,563 Total DINO Shares Issued
(mm) 24.9 24.9 24.9 21.1 24.9 30-Day VWAP Initial Offer Initial Offer 1st HEP Counteroffer DINO Revised Proposal 2nd HEP Counteroffer Undisturbed Price Current Price Current Price Current Price Current Price as of 5/3/23 as of 7/31/23 as of 7/31/23
as of 7/31/23 as of 7/31/23 DINO 30-Day VWAP $45.97 $46.36 $46.36 $46.36 $46.36 Exchange Ratio 0.3714x 0.3714x 0.3714x 0.3150x 0.3714x Stock Consideration per Unit $17.07 $17.22 $17.22 $14.60 $17.22 Cash Consideration per Unit - - 7.00 3.50 4.00
Total Consideration per Unit $17.07 $17.22 $24.22 $18.10 $21.22 Implied Exchange Ratio 0.3714x 0.3714x 0.5224x 0.3905x 0.4577x (3) Premium / (Discount) to Undisturbed 30-Day VWAP as of 5/3/23 - 0.9% 41.9% 6.0% 24.3% (4) Premium / (Discount) to
30-Day VWAP as of 7/31/23 (8.7%) (7.9%) 29.5% (3.2%) 13.5% Total Unaffiliated Units Outstanding (mm) 67.0 67.0 67.0 67.0 67.0 Total Stock Consideration ($mm) $1,143 $1,153 $1,153 $978 $1,153 Total Cash Consideration ($mm) - - 469 234 268 Total
Consideration ($mm) $1,143 $1,153 $1,622 $1,212 $1,421 Total DINO Shares Issued (mm) 24.9 24.9 24.9 21.1 24.9 1. Undisturbed Spot Price as of 5/3/23: $15.92 per unit. 2. Spot Price as of 7/31/23: $19.50 per unit. 3. Undisturbed 30-Day VWAP as of
5/3/23: $17.07 per unit. 4. 30-Day VWAP as of 7/31/23: $18.70 per unit. 1
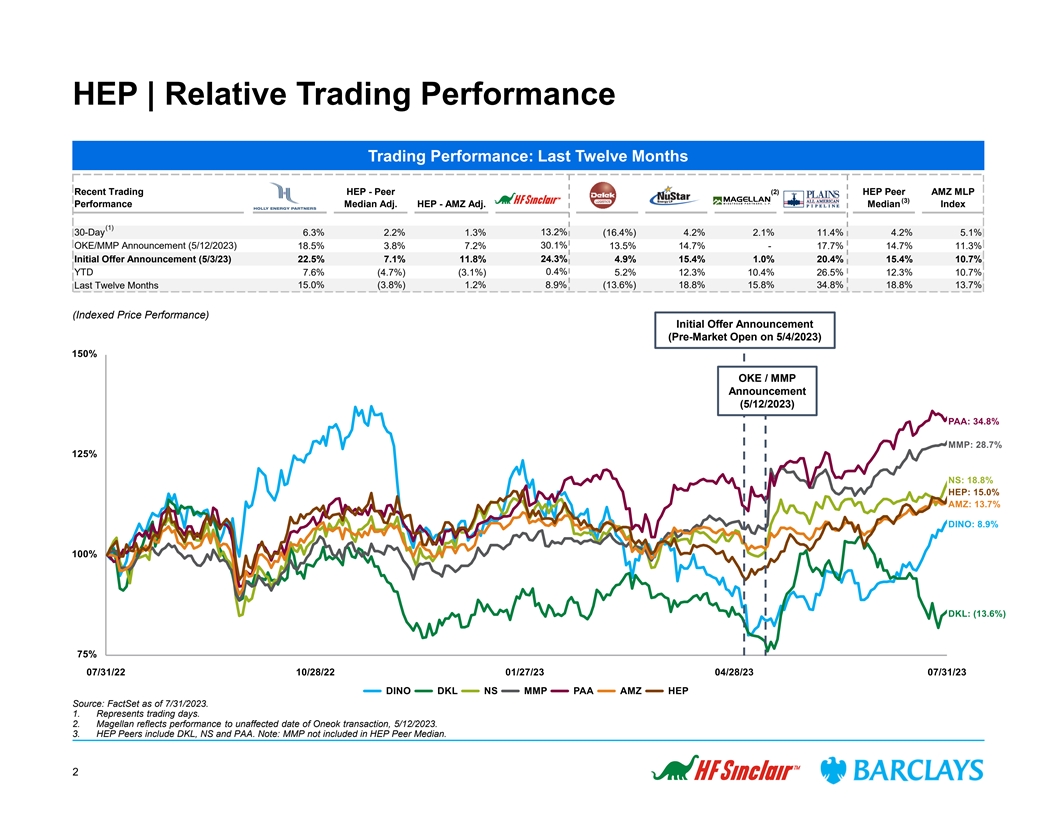
HEP | Relative Trading Performance Trading Performance: Last Twelve
Months Recent Trading HEP - Peer (2) HEP Peer AMZ MLP (3) Performance Median Adj. HEP - AMZ Adj. Median Index (1) 30-Day 6.3% 2.2% 1.3% 13.2% (16.4%) 4.2% 2.1% 11.4% 4.2% 5.1% OKE/MMP Announcement (5/12/2023) 18.5% 3.8% 7.2% 30.1% 13.5% 14.7% -
17.7% 14.7% 11.3% Initial Offer Announcement (5/3/23) 22.5% 7.1% 11.8% 24.3% 4.9% 15.4% 1.0% 20.4% 15.4% 10.7% 0.4% YTD 7.6% (4.7%) (3.1%) 5.2% 12.3% 10.4% 26.5% 12.3% 10.7% 15.0% (3.8%) 1.2% 8.9% (13.6%) 18.8% 15.8% 34.8% 18.8% 13.7% Last Twelve
Months (Indexed Price Performance) Initial Offer Announcement (Pre-Market Open on 5/4/2023) OKE / MMP Announcement (5/12/2023) Source: FactSet as of 7/31/2023. 1. Represents trading days. 2. Magellan reflects performance to unaffected date of Oneok
transaction, 5/12/2023. 3. HEP Peers include DKL, NS and PAA. Note: MMP not included in HEP Peer Median. 2

HEP / DINO | Historical Exchange Ratio Analysis Number of DINO shares
per HEP unit “Heads-Up” Exchange Ratio (HEP / DINO) Initial Offer Announcement (Pre-Market Open on 5/4/2023) 2nd Counter (VWAP) (1) 0.4577x 2nd Counter (Spot) (2) 0.4482x Revised Offer 0.3822x Current 0.3744x 1-Year VWAP 0.3559x Implied
Premium Analysis Implied Premium / Discount to Heads-Up Historical Prices / Heads-Up Exchange Ratio HEP DINO Exchange $19.50 $19.91 $21.45 $23.40 $23.35 $25.35 0.3744x 0.3822x 0.4118x 0.4492x 0.4482x 0.4867x (3) Period ($/unit) ($/share) Ratio -
2.1% 10.0% 20.0% 19.7% 30.0% - 2.1% 10.0% 20.0% 19.7% 30.0% Current (7/31/2023) $19.50 $52.09 0.3744x - 2.1% 10.0% 20.0% 19.7% 30.0% - 2.1% 10.0% 20.0% 19.7% 30.0% Undisturbed Price (5/3/2023) $15.92 $41.91 0.3799x 22.5% 25.1% 34.7% 47.0% 46.6%
59.2% (1.5%) 0.6% 8.4% 18.3% 18.0% 28.1% Offer Price (30-day VWAP as of 5/3/2023) $17.07 $45.97 0.3714x 14.2% 16.6% 25.6% 37.1% 36.7% 48.5% 0.8% 2.9% 10.9% 20.9% 20.7% 31.0% 5-Day VWAP $19.32 $51.03 0.3786x 0.9% 3.0% 11.0% 21.1% 20.8% 31.2% (1.1%)
0.9% 8.8% 18.6% 18.4% 28.5% 10-Day VWAP $19.23 $49.88 0.3856x 1.4% 3.5% 11.5% 21.7% 21.4% 31.8% (2.9%) (0.9%) 6.8% 16.5% 16.2% 26.2% 20-Day VWAP $19.08 $48.00 0.3974x 2.2% 4.4% 12.4% 22.7% 22.4% 32.9% (5.8%) (3.8%) 3.6% 13.0% 12.8% 22.5% 30-Day VWAP
$18.70 $46.36 0.4034x 4.3% 6.5% 14.7% 25.1% 24.8% 35.6% (7.2%) (5.3%) 2.1% 11.4% 11.1% 20.6% 60-Day VWAP $17.89 $43.75 0.4090x 9.0% 11.3% 19.9% 30.8% 30.5% 41.7% (8.5%) (6.6%) 0.7% 9.8% 9.6% 19.0% 1-Year VWAP $17.94 $50.40 0.3559x 8.7% 11.0% 19.6%
30.4% 30.1% 41.3% 5.2% 7.4% 15.7% 26.2% 25.9% 36.7% 2-Year VWAP $17.79 $44.11 0.4034x 9.6% 11.9% 20.5% 31.5% 31.2% 42.5% (7.2%) (5.3%) 2.1% 11.4% 11.1% 20.6% 5-Year VWAP $19.03 $41.40 0.4598x 2.4% 4.6% 12.7% 22.9% 22.7% 33.2% (18.6%) (16.9%) (10.4%)
(2.3%) (2.5%) 5.8% 52-Week High $19.72 $66.19 0.2979x (1.1%) 1.0% 8.8% 18.7% 18.4% 28.5% 25.7% 28.3% 38.2% 50.8% 50.4% 63.3% Research Analyst Target $18.50 $56.00 0.3304x 5.4% 7.6% 15.9% 26.5% 26.2% 37.0% 13.3% 15.7% 24.6% 36.0% 35.7% 47.3% Source:
FactSet as of 7/31/2023. 1. Reflecting 0.3714x exchange ratio on DINO’s 30-day VWAP of $46.36 as of 7/31/2023 plus $4.00 cash per unit. (4) nd (2) Revised Offer 2 Counteroffer 2. Reflecting 0.3714x exchange ratio on DINO’s share price of
$52.09 as of 7/31/2023 plus $4.00 cash per unit. 3. 5-day, 10-day, 20-day, 30-day and 60-day reflecting trading days. 1-year, 2-year and 3-year reflecting calendar days. 4. Revised offer of $19.91 per unit reflecting 0.3150x exchange ratio on
DINO’s share price of $52.09 as of 7/31/2023 plus $3.50 cash per unit. 3 Better for HEP Better for DINO

DINO | Relative Valuation (1) EV / EBITDA (EV / EBITDA) 2023E 2024E
2025E EV / 2023E EBITDA EV / 2024E EBITDA Median: 4.6x 5.9x 6.8x EV / 2025E EBITDA 7.8x 7.4x 7.3x 7.1x 8.0x 6.8x 6.8x 6.5x 6.5x 5.9x 5.9x 5.7x 5.5x 5.5x 6.0x 4.9x 4.9x 4.9x 4.6x 4.6x 4.5x 4.3x 3.8x 3.6x 3.5x 4.0x 2.8x 2.0x 0.0x (2) Price / Parent
CFPS (Price / Parent CFPS) 2023E 2024E 2025E Price / 2023E Parent CFPS Median: 5.1x 5.7x 7.7x Price / 2024E Parent CFPS Price / 2025E Parent CFPS 15.2x 11.9x 12.0x 8.6x 8.3x 7.7x 9.0x 7.6x 7.2x 7.1x 6.9x 6.4x 5.6x 5.7x 5.6x 5.6x 5.1x 5.1x 5.2x 5.1x
4.8x 4.7x 6.0x 4.5x 4.4x 4.4x 2.7x 3.0x 0.0x Consolidated Debt / 1. 1x 1.7x 1.8x 1.5x 3.1x 0.8x 1.1x 0.7x (3) 2023E EBITDA Consolidated Net Debt / 2023E 0.6x 1.1x 1.0x 0.9x 2.1x 0.4x (0.2)x (0.1)x (4) EBITDA Source: Management projections, company
filings, FactSet, and Wall Street research as of 7/31/2023. 1. DINO EBITDA reflecting management estimates. Peers per FactSet consensus. 2. DINO and peers reflecting FactSet consensus. Adj. CFPS is adjusted to remove third-party distributions to
unaffiliated MLP public unitholders. Adj. CFPS based on Adj. CFFO per share based on shares outstanding from Management projections. Remaining peers calculated from median consensus. 3. Calculated as current Consolidated Debt / Projected
Consolidated EBITDA. 4. Calculated as Consolidated Debt less Cash / Projected Consolidated EBITDA. 4

HEP | Relative Valuation EV / EBITDA Debt + Pref. / EBITDA 2022A 2023E
2023E-2025E Debt + Pref. / 2022A EBITDA 1.7% 2.5% 3.3% 3.3% 0.8% EBITDA CAGR Median: 4.9x 4.1x Debt + Pref. / 2023E EBITDA 7.0x 2023E 2024E 2025E EV / 2023E EBITDA 5.9x Median: 9.0x 8.5x 8.6x 6.0x 5.5x EV / 2024E EBITDA 12.0x 4.9x 10.5x 10.2x 5.0x
10.0x EV / 2025E EBITDA 9.7x 10.0x 4.4x 9.0x 4.3x 8.9x 8.6x 9.1x 8.5x 8.3x 3.7x 8.2x 8.0x 7.9x 8.1x 4.0x 3.7x 7.8x 3.6x 8.0x 3.3x 3.3x 3.0x 6.0x 2.0x 4.0x 2.0x 1.0x 0.0x 0.0x Latest Quarterly Distribution Yield Levered FCF Yield LQA DCF 2023E
Levered FCF Yield 2023E 2024E 2025E 1.9x 2.3x 1.4x 1.3x 2.7x Coverage Median: 10.6% 12.9% 13.4% 2024E Levered FCF Yield 20% 12.0% Median: 8.1% 2025E Levered FCF Yield 8.9% 14.6% 14.1% 14.1% 15% 13.6% 13.2% 8.6% 13.4% 13.3% 9.0% 12.5% 7.6% 7.2% 7.2%
11.4% 11.5% 10.9% 10.6% 9.7% 9.6% 10% 6.0% 5% 3.0% NA 0.0% 0% Source: HEP per DINO Management forecast. Peers per Public filings, FactSet, and Wall Street research as of 7/31/2023. Magellan share price as of the unaffected date of the Oneok
acquisition, 5/12/2023. 5

HEP | Indicative Purchase Price Ratio Analysis Indicative Purchase Price
Ratio Analysis DINO Revised HEP Second (1) (2) Proposal Counterproposal ($ in millions, except per share data) DINO SQ HEP SQ Illutrative Purchase Price 6/30/23E 6/30/23E Price as of 7/31/23 $52.09 $19.50 $19.91 $20.48 $21.45 $22.43 $23.35 $23.40
$24.38 $25.35 Implied Premium / (Discount) to HEP Spot Price as of 7/31/23 2% 5% 10% 15% 20% 20% 25% 30% Diluted Shares / Units Oustanding 194.1 126.6 126.6 126.6 126.6 126.6 126.6 126.6 126.6 126.6 Total Equity Value $10,112 $2,469 $2,520 $2,592
$2,716 $2,839 $2,956 $2,962 $3,086 $3,209 Total Debt (Consolidated) 3,199 1,492 1,492 1,492 1,492 1,492 1,492 1,492 1,492 1,492 Preferred Equity - 62 62 62 62 62 62 62 62 62 Non-Controlling Interest 1,303 69 69 69 69 69 69 69 69 69 Cash
(Consolidated) (1,500) (15) (15) (15) (15) (15) (15) (15) (15) (15) Enterprise Value $13,114 $4,076 $4,128 $4,200 $4,323 $4,447 $4,563 $4,570 $4,694 $4,817 Public Units Outstanding 67.0 67.0 67.0 67.0 67.0 67.0 67.0 67.0 67.0 Total Value of Public
Units $1,306 $1,333 $1,371 $1,436 $1,502 $1,563 $1,567 $1,632 $1,698 Implied Exchange Ratio 0.3744x 0.3822x 0.3931x 0.4118x 0.4305x 0.4482x 0.4492x 0.4679x 0.4867x Precedent Premium Premium / Discount to: Median Mean Current 7/31/23 - - 2.1% 5.0%
10.0% 15.0% 19.7% 20.0% 25.0% 30.0% 12.6% 13.9% Unaffected Price 24.3% 22.5% 25.1% 28.6% 34.7% 40.9% 46.6% 47.0% 53.1% 59.2% 52-Week High (21.3%) 2.4% 4.6% 7.6% 12.7% 17.8% 22.7% 22.9% 28.1% 33.2% Research Analyst Target (7.0%) 5.4% 7.6% 10.7% 15.9%
21.2% 26.2% 26.5% 31.8% 37.0% Trading Comparables DINO SQ HEP SQ Peer Peer Transaction (3) (3) Median Mean Comparables Enterprise Value as a Multiple of: Data Data EBITDA 2023E $3,030 4.3x $458 8.9x 9.0x 9.2x 9.4x 9.7x 10.0x 10.0x 10.3x 10.5x 9.0x
9.2x 10.1x 2024E 2,662 4.9x 477 8.5x 8.6x 8.8x 9.1x 9.3x 9.6x 9.6x 9.8x 10.1x 8.5x 8.8x 10.1x 2025E 2,698 4.9x 474 8.6x 8.7x 8.9x 9.1x 9.4x 9.6x 9.7x 9.9x 10.2x 8.6x 8.7x Equity Value as a Multiple of: Earnings per Share 2023E $8.77 5.9x $2.08 9.4x
9.6x 9.9x 10.3x 10.8x 11.2x 11.3x 11.7x 12.2x 12.1x 12.7x 2024E 7.27 7.2x 2.36 8.3x 8.5x 8.7x 9.1x 9.5x 9.9x 9.9x 10.4x 10.8x 10.5x 11.5x 2025E 7.43 7.0x 2.44 8.0x 8.2x 8.4x 8.8x 9.2x 9.6x 9.6x 10.0x 10.4x 10.6x 11.4x Yield Analysis: Dividends LQA
$1.80 3.5% $1.40 7.2% 7.0% 6.8% 6.5% 6.2% 6.0% 6.0% 5.7% 5.5% 8.1% 8.1% 2023E 1.80 3.5% 1.40 7.2% 7.0% 6.8% 6.5% 6.2% 6.0% 6.0% 5.7% 5.5% 2024E 1.80 3.5% 1.40 7.2% 7.0% 6.8% 6.5% 6.2% 6.0% 6.0% 5.7% 5.5% 2025E 1.80 3.5% 1.40 7.2% 7.0% 6.8% 6.5% 6.2%
6.0% 6.0% 5.7% 5.5% YE Leverage Total Debt / EBITDA 2022A $3,199 0.7x $1,492 3.6x 3.6x 3.6x 3.6x 3.6x 3.6x 3.6x 3.6x 3.6x 4.9x 4.8x 2023E 3,199 1.1x 1,492 3.3x 3.3x 3.3x 3.3x 3.3x 3.3x 3.3x 3.3x 3.3x 4.1x 4.1x Source: Projections per DINO
Management. Market data as of 7/31/2023. Balance sheet data per DINO estimates of 6/30/2023. 1. Revised proposal of $19.91 per unit reflecting 0.3150x exchange ratio on DINO’s share price of $52.09 as of 7/31/2023 plus $3.50 cash per unit. 2.
Second counterproposal of $23.35 per unit reflecting 0.3714x exchange ratio on DINO’s share price of $52.09 as of 7/31/2023 plus $4.00 cash per unit. 3. Peers include DKL, MMP, NS and PAA. 6

Appendix

Apple | Proposal Summary Key Events — On May 4, 2023, HF Sinclair
(DINO) offered to acquire all outstanding publicly held common units of Holly Energy Partners (HEP) at a fixed exchange ratio of 0.3714 newly issued shares of DINO Common Stock per each HEP unit w Offer derived using the 30-day volume weighted
average prices for each security as of market close on May 3, 2023 — Following DINO’s initial proposal, 1¡ On July 14, 2023, the Conflicts Committee of HEP responded with a counterproposal consisting of 0.3714 exchange ratio plus
$7.00 in cash per HEP unit w The counterproposal implies a total per unit consideration of $24.16 based on DINO’s share price as of 7/14/2023 ¡ On July 21, 2023, DINO responded with a revised proposal comprised of 0.3150 exchange
ratio plus $3.50 in cash 2 w The revised proposal implies a total per unit consideration of $18.92 based on DINO’s share price on 7/21/2023 nd 3¡ On July 28, 2023, the Conflicts Committee of HEP responded with a 2 counterproposal
consisting of 0.3714 exchange ratio plus $4.00 in cash per HEP unit nd w The 2 counterproposal implies a total per unit consideration of $23.16 based on DINO’s share price as of 7/28/2023 Summary of Proposals – Spot Offer Price
Implied Premium to HEP Unit Price as of: Total Consideration per Equity Consideration (2) Date Exchange Ratio Cash Consideration Unit HEP Closing Price DINO Closing Price 5/3/23 7/14/23 7/21/23 7/28/23 Proposal (1) Initial DINO Offer 5/4/23 0.3714x
$0.00 $15.57 $15.92 $41.91 (2.2%) N/A N/A N/A 1st HEP Counterproposal 7/14/23 0.3714x $7.00 $24.16 $18.87 $46.21 51.8% 28.0% N/A N/A Revised DINO Proposal 7/21/23 0.3150x $3.50 $18.92 $18.97 $48.96 18.9% 0.3% (0.3%) N/A 2nd HEP Counterproposal
7/28/23 0.3714x $4.00 $23.16 $19.18 $51.60 45.5% 22.8% 22.1% 20.8% Summary of Proposals – 30-Day VWAP Offer Price Implied Premium to HEP 30-Day VWAP as of: Total Consideration per Equity Consideration (3) Date Exchange Ratio Cash Consideration
Unit (30-Day VWAP) HEP 30-Day VWAP DINO 30-Day VWAP 5/3/23 7/14/23 7/21/23 7/28/23 Proposal (1) Initial DINO Offer 5/4/23 0.3714x $0.00 $17.07 $17.07 $45.97 (0.0%) N/A N/A N/A 1st HEP Counterproposal 7/14/23 0.3714x $7.00 $23.57 $18.24 $44.62 38.1%
29.2% N/A N/A Revised DINO Proposal 7/21/23 0.3150x $3.50 $17.75 $18.38 $45.24 4.0% (2.7%) (3.4%) N/A 2nd HEP Counterproposal 7/28/23 0.3714x $4.00 $21.14 $18.64 $46.16 23.8% 15.9% 15.0% 13.4% 1. Offer delivered pre-market open on 5/4/23. DINO and
HEP closing prices reflecting prices as of unaffected date of 5/3/2023. 2. Total consideration per unit equal to DINO closing price multiplied by exchange ratio, plus cash consideration when applicable. 3. Total consideration per unit (30-day VWAP)
equal to DINO 30-day VWAP multiplied by exchange ratio, plus cash consideration when applicable. 7

DINO | Comparable Companies DINO Trading Comparables ($ in millions,
except per share values) Peer Median Stock Price as of 7/31/2023 $52.09 $133.02 $111.55 $128.91 $47.44 $36.74 $27.59 $31.48 Diluted Shares Outstanding 194 428 464 362 132 103 68 63 Total Equity Value $10,112 $56,890 $51,784 $46,603 $6,260 $3,778
$1,886 $1,977 Total Debt 3,199 27,659 18,730 11,431 1,469 1,597 2,840 550 Cash 1,500 11,452 6,705 5,521 1,616 601 885 661 Net Debt 1,699 16,207 12,025 5,910 (147) 996 1,954 (111) (1) Minority Interest 1,303 12,557 -- -- -- 620 441 -- Enterprise
Value $13,114 $85,655 $63,809 $52,513 $6,113 $5,394 $4,281 $1,866 Enterprise Value to: 2023E EBITDA 4.3x 5.5x 5.7x 3.8x 2.8x 4.9x 4.6x 3.6x 4.6x 2024E EBITDA 4.9x 7.4x 6.5x 5.5x 3.5x 7.3x 5.9x 4.6x 5.9x 2025E EBITDA 4.9x 7.8x 6.8x 6.8x 4.5x 7.1x
6.5x 5.9x 6.8x 2023E EBIT 5.7x 6.8x 6.6x 4.8x 3.7x 6.7x 7.8x 4.7x 6.6x 2024E EBIT 6.8x 10.5x 7.9x 7.8x 5.3x 10.2x 11.8x 7.2x 7.9x 2025E EBIT 6.7x 11.2x 7.9x 10.3x 7.8x 11.4x 16.1x 10.1x 10.3x Equity Value to: 2023E CFFO 5.2x 4.5x 6.1x 4.3x 3.7x 4.6x
3.0x 4.3x 4.3x 2024E CFFO 5.5x 5.4x 6.5x 5.5x 4.5x 6.9x 3.9x 5.5x 5.5x 2025E CFFO 5.4x 5.6x 6.7x 5.8x 5.0x 10.2x 4.1x 6.6x 5.8x 2023E Net Income 5.9x 7.1x 8.0x 5.8x 5.4x 8.4x 8.6x 5.6x 7.1x 2024E Net Income 7.2x 10.3x 9.3x 9.5x 7.6x 17.1x 20.9x 9.5x
9.5x 2025E Net Income 7.0x 11.2x 9.3x 12.7x 10.6x 18.7x N/M 13.9x 12.0x Source: DINO Management, Company filings, FactSet, Wall Street research and investor presentations as of 7/31/2023. DINO balance sheet data per management estimates of
6/30/2023. 1. Reflects market value of public interest in MLP. Does not include preferred equity held by subsidiaries. 8

HEP | Comparable Companies HEP Trading Comparables ($ in millions
except per unit data) Peer Median (1) Unit Price as of 7/31/23 $19.50 $47.62 $17.97 $55.41 $14.88 % of 52-week high (Close) 99% 76% 100% 100% 99% 100% Fully Diluted Units Outstanding 127 44 111 202 698 Total Equity Value $2,469 $2,075 $1,993 $11,198
$10,392 Debt 1,492 1,717 3,094 5,112 8,041 Preferred Equity 62 - 1,199 - 2,666 Noncontrolling Interest 69 - - - - Cash (15) ( 11) ( 5) (7) (526) Enterprise Value $4,076 $3,781 $6,281 $16,303 $20,573 Enterprise Value / 2023E EBITDA 8.9 x 9.7 x 8.3 x
10.5 x 8.2 x 9.0 x 2024E EBITDA 8.5 x 9.0 x 8.0 x 10.2 x 7.9 x 8.5 x 2025E EBITDA 8.6 x 9.1 x 7.8 x 10.0 x 8.1 x 8.6 x Valuation Metrics LQA Yield 7.18% 8.61% 8.90% 7.56% 7.19% 8.09% 2023E Yield 7.18% 8.69% 8.90% 7.60% 7.19% 8.15% 2024E Yield 7.18%
9.01% 8.90% 7.67% 8.20% 8.55% 2025E Yield 7.18% 9.58% 8.90% 7.74% 9.21% 9.06% 2023E DCF Yield 13.44% 12.66% 18.82% 11.05% 15.47% 14.06% 2024E DCF Yield 14.14% 14.94% 19.22% 11.46% 17.78% 16.36% 2025E DCF Yield 14.60% NA 19.42% 11.79% 17.32% 17.32%
2023E FCF Yield 13.31% 9.57% 11.54% 9.73% 11.43% 10.58% 2024E FCF Yield 14.14% 12.53% 13.20% 10.57% 14.08% 12.86% 2025E FCF Yield 14.60% NA 13.40% 10.89% 13.61% 13.40% 2023E EPS $2.08 $3.91 $1.14 $5.03 $1.24 $3.91 2024E EPS 2.36 4.67 1.20 5.26 1.42
4.67 2025E EPS 2.44 4.89 1.22 5.42 1.34 4.89 Coverage 2023E Coverage 1.87 x 1.46 x 2.11 x 1.45 x 2.15 x 1.78 x 2024E Coverage 1.97 x 1.66 x 2.16 x 1.49 x 2.17 x 1.91 x 2025E Coverage 2.03 x NA 2.18 x 1.52 x 1.88 x 1.88 x Credit Statistics Debt /
2022A EBITDA 3.6 x 5.5 x 4.3 x 3.6 x 3.2 x 3.9 x Debt / 2023E EBITDA 3.3 x 4.4 x 4.1 x 3.3 x 3.2 x 3.7 x Debt + Pref / 2023A EBITDA 3.7 x 5.5 x 5.9 x 3.6 x 4.3 x 4.9 x Debt + Pref / 2023E EBITDA 3.3 x 4.4 x 4.9 x 3.3 x 3.7 x 4.1 x Source: DINO
Management, Company filings, FactSet, Wall Street research and investor presentations as of 7/31/2023. HEP balance sheet data per management estimates of 6/30/2023. 1. Magellan unaffected share price as of 5/12/2023 prior to Oneok acquisition.
9

HEP | Equity Analyst Price Targets (1) (2) Research Price Targets
Premium / (Discount) % to Current Price ($ / share) Median Analyst Target Price Premium / (Discount) to: Current Price (5%) (3) Current: $55.41 $70.00 30% $65.00 Current: $47.62 $60.00 17% 20% Current: Current: $50.00 $47.00 $14.88 $17.97 8% 10% 6%
$40.00 3% (1%) Current $30.00 (3%) 0% Price: $19.50 $19.00 $20.00 $19.00 $17.00 $18.00 $20.00 $16.00 Median -10% (8%) Price $10.00 Target: (13%) $18.50 $0.00 -20% Analyst 1 Analyst 2 Analyst 3 Analyst 4 7/11/2023 5/6/2023 5/4/2023 4/3/2023 Analyst
Recommendation 0 2 1 4 Buy ✓ 1 3 4 2 Hold ~ 0 1 1 0 Sell O O 1 6 6 6 Source: FactSet as of 7/31/2023. 1. Includes available reports from reputable brokers that have provided a price target. 2. Peer group price targets reflect average analyst
price target. 3. Reflects unaffected price from 5/12/2023 prior to Oneok acquisition. 10

DINO | Equity Analyst Price Targets (1) (2) Research Price Targets
Premium / (Discount) % to Current Price Price Targets ($ / share) Median Analyst Target Price Premium / (Discount) to: Current Price 8% Current: Current: Current: Current: Current: Current: Current: $133.02 $111.55 $128.91 $36.74 $27.59 $47.44
$31.48 $146.00 $123.0 $145.00 $80.00 50% $70.00 40% $63.00 Median $61.00 Analyst: $57.00 $60.00 30% $56.00 $55.00 $56.00 $56.00 $54.00 $52.00 $50.00 $47.00 $50.00 20% Current DINO: 21% 10% 17% $40.00 10% 8% $52.09 6% $40.00 10% 12% 9% $31.00 (1%) 8%
Peers $29.00 (4%) $30.00 0% Median: $26.00 4% (1%) (2%) (0%) $20.00 -10% (6%) (21%) $10.00 -20% (23%) $0.00 -30% 1 2 3 4 5 6 7 8 9 10 11 12 13 14 15 16 17 Analyst 1 Analyst 2 Analyst 3 Analyst 4 Analyst 5 Analyst 6 Analyst 7 Analyst 8 Analyst 9
Analyst 10 7/19/23 7/18/23 7/18/23 7/14/23 7/10/23 7/10/23 7/9/23 7/6/23 5/25/23 4/9/23 Analyst Recommendation 9 7 9 0 1 2 3 Buy ✓✓✓✓✓✓ 2 3 2 3 5 6 1 Hold ~ ~ ~ ~ 0 0 0 0 2 0 0 Sell Source: FactSet as of
7/31/2023. 11 10 11 3 8 8 4 1. Includes available reports from reputable brokers since Q1’23 earnings release that have provided a price target. 2. Peer group price targets reflect median analyst price target. 11
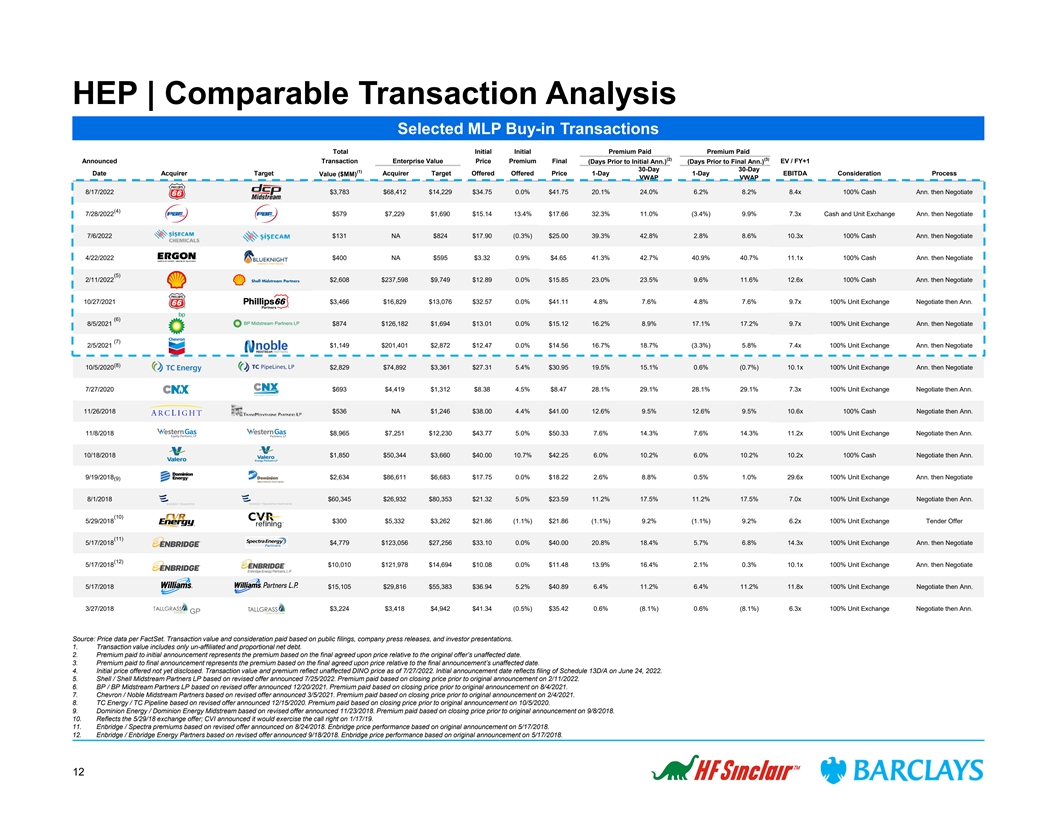
HEP | Comparable Transaction Analysis Selected MLP Buy-in Transactions
Total Initial Initial Premium Paid Premium Paid - (2) (3) Announced Transaction Enterprise Value Price Premium Final (Days Prior to Initial Ann.) (Days Prior to Final Ann.) EV / FY+1 30-Day 30-Day (1) Date Acquirer Target Value ($MM) Acquirer Target
Offered Offered Price 1-Day 1-Day EBITDA Consideration Process VWAP VWAP 8/17/2022 $3,783 $68,412 $14,229 $34.75 0.0% $41.75 20.1% 24.0% 6.2% 8.2% 8.4x 100% Cash Ann. then Negotiate (4) 7/28/2022 $579 $7,229 $1,690 $15.14 13.4% $17.66 32.3% 11.0%
(3.4%) 9.9% 7.3x Cash and Unit Exchange Ann. then Negotiate 7/6/2022 $131 NA $824 $17.90 (0.3%) $25.00 39.3% 42.8% 2.8% 8.6% 10.3x 100% Cash Ann. then Negotiate 4/22/2022 $400 NA $595 $3.32 0.9% $4.65 41.3% 42.7% 40.9% 40.7% 11.1x 100% Cash Ann.
then Negotiate (5) 2/11/2022 $2,608 $237,598 $9,749 $12.89 0.0% $15.85 23.0% 23.5% 9.6% 11.6% 12.6x 100% Cash Ann. then Negotiate 10/27/2021 $3,466 $16,829 $13,076 $32.57 0.0% $41.11 4.8% 7.6% 4.8% 7.6% 9.7x 100% Unit Exchange Negotiate then Ann.
(6) 8/5/2021 $874 $126,182 $1,694 $13.01 0.0% $15.12 16.2% 8.9% 17.1% 17.2% 9.7x 100% Unit Exchange Ann. then Negotiate (7) 2/5/2021 $1,149 $201,401 $2,872 $12.47 0.0% $14.56 16.7% 18.7% (3.3%) 5.8% 7.4x 100% Unit Exchange Ann. then Negotiate (8)
10/5/2020 $2,829 $74,892 $3,361 $27.31 5.4% $30.95 19.5% 15.1% 0.6% (0.7%) 10.1x 100% Unit Exchange Ann. then Negotiate 7/27/2020 $693 $4,419 $1,312 $8.38 4.5% $8.47 28.1% 29.1% 28.1% 29.1% 7.3x 100% Unit Exchange Negotiate then Ann. 11/26/2018 $536
NA $1,246 $38.00 4.4% $41.00 12.6% 9.5% 12.6% 9.5% 10.6x 100% Cash Negotiate then Ann. 11/8/2018 $8,965 $7,251 $12,230 $43.77 5.0% $50.33 7.6% 14.3% 7.6% 14.3% 11.2x 100% Unit Exchange Negotiate then Ann. 10/18/2018 $1,850 $50,344 $3,660 $40.00
10.7% $42.25 6.0% 10.2% 6.0% 10.2% 10.2x 100% Cash Negotiate then Ann. 9/19/2018 $2,634 $86,611 $6,683 $17.75 0.0% $18.22 2.6% 8.8% 0.5% 1.0% 29.6x 100% Unit Exchange Ann. then Negotiate (9) 8/1/2018 $60,345 $26,932 $80,353 $21.32 5.0% $23.59 11.2%
17.5% 11.2% 17.5% 7.0x 100% Unit Exchange Negotiate then Ann. (10) 5/29/2018 $300 $5,332 $3,262 $21.86 (1.1%) $21.86 (1.1%) 9.2% (1.1%) 9.2% 6.2x 100% Unit Exchange Tender Offer (11) 5/17/2018 $4,779 $123,056 $27,256 $33.10 0.0% $40.00 20.8% 18.4%
5.7% 6.8% 14.3x 100% Unit Exchange Ann. then Negotiate (12) 5/17/2018 $10,010 $121,978 $14,694 $10.08 0.0% $11.48 13.9% 16.4% 2.1% 0.3% 10.1x 100% Unit Exchange Ann. then Negotiate 5/17/2018 $15,105 $29,816 $55,383 $36.94 5.2% $40.89 6.4% 11.2% 6.4%
11.2% 11.8x 100% Unit Exchange Negotiate then Ann. 3/27/2018 $3,224 $3,418 $4,942 $41.34 (0.5%) $35.42 0.6% (8.1%) 0.6% (8.1%) 6.3x 100% Unit Exchange Negotiate then Ann. Source: Price data per FactSet. Transaction value and consideration paid based
on public filings, company press releases, and investor presentations. 1. Transaction value includes only un-affiliated and proportional net debt. 2. Premium paid to initial announcement represents the premium based on the final agreed upon price
relative to the original offer’s unaffected date. 3. Premium paid to final announcement represents the premium based on the final agreed upon price relative to the final announcement’s unaffected date. 4. Initial price offered not yet
disclosed. Transaction value and premium reflect unaffected DINO price as of 7/27/2022. Initial announcement date reflects filing of Schedule 13D/A on June 24, 2022. 5. Shell / Shell Midstream Partners LP based on revised offer announced 7/25/2022.
Premium paid based on closing price prior to original announcement on 2/11/2022. 6. BP / BP Midstream Partners LP based on revised offer announced 12/20/2021. Premium paid based on closing price prior to original announcement on 8/4/2021. 7. Chevron
/ Noble Midstream Partners based on revised offer announced 3/5/2021. Premium paid based on closing price prior to original announcement on 2/4/2021. 8. TC Energy / TC Pipeline based on revised offer announced 12/15/2020. Premium paid based on
closing price prior to original announcement on 10/5/2020. 9. Dominion Energy / Dominion Energy Midstream based on revised offer announced 11/23/2018. Premium paid based on closing price prior to original announcement on 9/8/2018. 10. Reflects the
5/29/18 exchange offer; CVI announced it would exercise the call right on 1/17/19. 11. Enbridge / Spectra premiums based on revised offer announced on 8/24/2018. Enbridge price performance based on original announcement on 5/17/2018. 12. Enbridge /
Enbridge Energy Partners based on revised offer announced 9/18/2018. Enbridge price performance based on original announcement on 5/17/2018. 12

HEP | Comparable Transaction Analysis (Cont’d) Selected MLP
Buy-in Transactions Total Initial Initial Premium Paid Premium Paid (2) (3) Announced Transaction Enterprise Value Price Premium Final (Days Prior to Initial Ann.) (Days Prior to Final Ann.) EV / FY+1 30-Day 30-Day (1) Date Acquirer Target Acquirer
Target Offered Offered Price 1-Day 1-Day EBITDA Consideration Process Value ($MM) VWAP VWAP 11/8/2017 $173 $3,189 $845 $11.80 3.0% $13.92 3.0% 11.5% 3.0% 11.5% 4.6x 100% Unit Exchange Negotiate then Ann. 8/29/2017 $736 NA $736 $14.50 0.4% $16.50
15.2% 12.4% 15.2% 12.4% 12.3x 100% Cash Negotiate then Ann. 5/18/2017 $651 NA $963 $20.00 20.1% $20.00 20.1% 20.4% 20.1% 20.4% 12.3x 100% Cash Tender Offer 4/4/2017 $157 NA $594 $16.80 5.8% $17.30 5.8% 5.6% 5.8% 5.6% 9.1x 100% Cash Tender Offer
3/2/2017 $781 NA $1,470 $18.75 1.9% $19.50 6.0% 5.6% 4.3% 3.4% 9.3x 100% Cash Ann. then Negotiate 1/27/2017 $1,656 $77,129 $1,656 $6.25 (4.6%) $8.00 (8.6%) 1.8% (8.6%) 1.8% 11.0x 100% Cash Negotiate then Ann. 11/1/2016 $5,180 $77,381 $9,684 $15.75
2.9% $17.00 11.1% 16.0% 6.3% 5.2% 18.0x 100% Cash Ann. then Negotiate Selected MLP Transactions From 2016 - 2023 YTD Mean 3.0% 13.9% 15.0% 7.5% 10.0% 10.7x Median 0.9% 12.6% 12.4% 5.8% 9.2% 10.1x High 20.1% 41.3% 42.8% 40.9% 40.7% 29.6x Low (4.6%)
(8.6%) (8.1%) (8.6%) (8.1%) 4.6x Selected 100% Stock MLP Transactions From 2016 - 2023 YTD Mean 1.9% 10.8% 12.8% 6.0% 8.8% 10.4x Median 0.0% 9.4% 12.9% 3.9% 8.4% 9.7x High 5.4% 28.1% 29.1% 28.1% 29.1% 29.6x Low (1.1%) (1.1%) (8.1%) (3.3%) (8.1%)
4.6x Selected MLP Transactions From 2021 - 2023 YTD Mean 1.8% 24.2% 22.4% 9.4% 13.7% 9.6x Median 0.0% 21.6% 21.1% 5.5% 9.3% 9.7x High 13.4% 41.3% 42.8% 40.9% 40.7% 12.6x Low (0.3%) 4.8% 7.6% (3.4%) 5.8% 7.3x Source: Price data per FactSet.
Transaction value and consideration paid based on public filings, company press releases, and investor presentations. HEP data per DINO Management forecast. 1. Transaction value includes only un-affiliated and proportional net debt. 2. Premium paid
to initial announcement represents the premium based on the final agreed upon price relative to the original offer’s unaffected date. 3. Premium paid to final announcement represents the premium based on the final agreed upon price relative to
the final offer’s unaffected date. 4. Reflects DINO management estimates of balance sheet data for 6/30/2023. 13

Proposed OKE / MMP Transaction Summary Transaction Summary 1-Day
Trading Performance — On May 14, 2023, ONEOK, Inc. (“ONEOK”) announced that it will Buyers Targets acquire all outstanding units of Magellan Midstream Partners, L.P. (“Magellan”) for ~$18.8bn, including assumed debt
15.0% 8.0% ¡ Consideration will consist of $25.00 in cash and 0.6670 shares of ONEOK common stock for each outstanding Magellan common unit 4.0% 12.0% Transaction & ¡ Implied premium of ~22% to Magellan’s closing share price
Purchase Price th on Friday, May 12 (~15% premium based on ONEOK’s 0.0% 9.0% th closing sharing price on Monday, May 15 ) (0.6%) ¡ ONEOK has secured $5.25 billion of fully-committed bridge (4.0%) 6.0% financing for the proposed cash
consideration (a Notes offering is expected prior to closing) (8.0%) ¡ Transaction expected to close in Q3 2023 3.0% (9.1%) — Expected to be accretive to earnings per share beginning in 2024 (12.0%) 0.0% with EPS accretion of 3-7% per year
in 2025-2027 — Expected to be free cash flow per share accretive, averaging more than 20% 2024-2027 Transaction — Forecasted synergies are expected to total at least $200mm Consequences annually, with potential to move as high as $400mm
MMP Enterprise Value Build & Multiples — Benefit from the tax basis step-up has an estimated total value of ($ in millions) ~$3.0bn 5/12/23 Close Offer Price 5/15/23 Close Share Price $55.41 $55.41 $62.61 — Pro forma 2024 year-end Net
Debt / EBITDA of ~4.0x Implied Premium to 5/12/2023 Close - 21.8% 14.9% Offer Price $55.41 $67.50 $63.65 — Adds a leading, and primarily fee-based, refining products and Units Outstanding 202 202 202 crude oil transportation business to ONEOK
Equity Value $11,198 $13,642 $12,864 (1) — Complementary and diversified asset positions, presenting Plus: Debt 5,112 5,112 5,112 significant potential for enhanced customer product offerings and Less: Cash (7) (7) (7) increased international
export opportunities Enterprise Value $16,303 $18,747 $17,969 Disclosed MMP — Expected immediate financial benefits, including cost, operational, Enterprise Value as a Mult. of: Statistic Rationale and tax synergies, supporting meaningful
expected accretion 2024E EBITDA $1,599 10.2x 11.7x 11.2x — A significant increase in free cash flow, which provides additional 2025E EBITDA 1,630 10.0x 11.5x 11.0x cash for debt reduction, growth capital, and value returned to (2) 2024E EBITDA
Adj. for Synergies $1,899 8.6x 9.9x 9.5x (2) shareholders through dividends and/or repurchasing shares 2025E EBITDA Adj. for Synergies 1,930 8.4x 9.7x 9.3x — Strong IG credit ratings with enhanced scale and diversification Equity Value as a
Mult. of: 2024E DCF $1,283 11.5% 9.4% 10.0% — $275mm breakup fee Other Key 2025E DCF 1,320 11.8% 9.7% 10.3% Merger — Magellan will be merged into a newly created 100% wholly-owned Agreement Items subsidiary of ONEOK Source: Company
filings, Wall Street Research, and FactSet. 1. Includes $112mm in long-term lease liabilities. 2. Assumes $300mm in synergies. Excludes tax savings. 14 PAA 5.2% ET 1.5% TRP 0.7% ENB 0.5% EPD 0.1% KMI OKE MMP 13.0% CEQP 8.6% PAA 5.2% NS 4.1% KNTK
3.6% WES 2.6% HEP 2.1% DTM 1.8% TRGP 1.3%

Disclaimer The preceding pages contain material that was provided to
the Board of Directors (the “Board”) of HF Sinclair Corporation (the “Company”) by Barclays Capital Inc. (“Barclays”). The accompanying material and any Barclays presentation related to the material was compiled
or prepared on a confidential basis solely for consideration by the Board and no part of it may be reproduced, distributed or transmitted without the prior written consent of Barclays. The information contained in this material was obtained from the
Company and/or publicly available sources, and Barclays has relied upon such information without independent verification thereof and does not assume any liability for any such information. These materials are being provided in connection with an
actual corporate engagement and may not be used or relied upon for any purpose other than as specifically contemplated by a written agreement with Barclays. Moreover, any information provided herein was not prepared for or intended for use by any
individual for personal, family or household purposes. Any estimates, historical financial information, projections and other information contained herein have been prepared by management of the Company or were obtained from publicly available
sources (approved for Barclays’ use by the Company) or are based upon such estimates and projections. With respect to such estimates and projections, Barclays has assumed that they have been reasonably prepared on a basis reflecting the best
currently available estimates, projections and judgment of the management of the Company. The projections contained herein may or may not be achieved and differences between projected results and those actually achieved may be material. No
representation or warranty, expressed or implied, is made as to the accuracy or completeness of such information and nothing contained herein is, or shall be relied upon as, a promise or representation, whether as to the past or the future. The
analysis contained herein is based on current market conditions which are subject to change and Barclays assumes no obligation to update or otherwise revise these materials. Nothing in these materials shall be deemed to constitute a recommendation
or investment, legal, tax, financial, accounting or other advice. Because these materials were prepared for use in the context of a presentation to the Board, these materials are incomplete without reference to, and should be assessed solely in
conjunction with, the oral briefing provided by Barclays to the Board (in their capacity as directors and not in any individual capacity and is not for the benefit of any individual, including any individual officer, director, shareholder or any
other person). These materials were not prepared for or intended for use by any individual for personal, family or household purposes nor were they prepared to comply with the disclosure standards under state and federal securities laws or any other
applicable laws and, to the extent the material may be considered by readers not as familiar with the business and affairs of the Company as the Board, none of the Company, Barclays, their respective affiliates or any of their respective legal or
financial advisors or accountants takes any responsibility for the accuracy or completeness of any of the material if used by persons other than the Board. These materials are not intended to provide the sole basis for evaluation of the proposed
corporate transaction and do not purport to contain all information that may be required and should not be considered a recommendation with respect to the proposed corporate transaction. Barclays has not made or obtained any evaluations or
appraisals of the assets or liabilities of the Company or any other party to any corporate transaction or any of their respective affiliates and has no obligation to evaluate the solvency of the Company or any other party to any transaction under
any state or federal laws relating to bankruptcy, insolvency or similar matters. The analyses contained herein do not purport to be appraisals nor do they necessarily reflect the prices at which businesses or securities actually may be sold or
purchased. Barclays’ role in any due diligence review is limited solely to performing such a review as it shall deem necessary to support its own advice and analysis and shall not be on behalf of the Company, the Board or any individual
officer, director, shareholder or any other person. Barclays, its subsidiaries and affiliates engage in a wide range of businesses from investment and commercial banking, lending, asset management and other financial and non-financial services. In
the ordinary course of its business, Barclays and its affiliates may actively trade and effect transactions in the equity, debt and/or other securities (and any derivatives thereof) and financial instruments (including loans and other obligations)
of the Company for its own account and for the accounts of its customers and, accordingly, may at any time hold long or short positions and investments in such securities and financial instruments or in other financial products and instruments.
Unless otherwise expressly agreed or provided for in other applicable Barclays disclosures governing such corporate transactions or required by law or regulation, Barclays conducts these activities as principal and executes its principal
transactions as an arm’s length counterparty. Barclays does not act as a fiduciary in relation to these corporate transactions. These materials do not constitute investment advice nor do they form part of an offer to sell or purchase, or the
solicitation of an offer to sell or purchase, any securities or any of the businesses or assets described herein or an offer of financing or an offer or recommendation to enter into any corporate transaction described herein. Barclays Capital Inc.
is the United States investment bank of Barclays Bank PLC. Barclays Bank PLC is authorised by the Prudential Regulation Authority and regulated by the Financial Conduct Authority and the Prudential Regulation Authority (Financial Services Register
No. 122702). Registered in England. Registered No. 1026167. Registered office: 1 Churchill Place, London E14 5HP. Copyright Barclays Bank PLC, 2023 (all rights reserved). 15

Exhibit (c)(2)(E) Conflicts Committee Presentation August 11,
2023

Apple | Proposal Summary Spot Price Initial Offer Initial Offer 1st HEP
Counteroffer DINO Revised Proposal 2nd HEP Counteroffer Proposed DINO Counteroffer Undisturbed Price Current Price Current Price Current Price Current Price Current Price as of 5/3/23 as of 8/10/23 as of 8/10/23 as of 8/10/23 as of 8/10/23 as of
8/10/23 DINO Spot Price $41.91 $58.22 $58.22 $58.22 $58.22 $58.22 Exchange Ratio 0.3714x 0.3714x 0.3714x 0.3150x 0.3714x 0.3150x Stock Consideration per Unit $15.57 $21.62 $21.62 $18.34 $21.62 $18.34 Cash Consideration per Unit - - 7.00 3.50 4.00
4.00 Total Consideration per Unit $15.57 $21.62 $28.62 $21.84 $25.62 $22.34 Implied Exchange Ratio 0.3714x 0.3714x 0.4916x 0.3751x 0.4401x 0.3837x (1) Premium / (Discount) to Undisturbed Spot Price as of 5/3/23 (2.2%) 35.8% 79.8% 37.2% 60.9% 40.3%
(2) Premium / (Discount) to Spot Price as of 8/10/23 (27.4%) 0.9% 33.5% 1.9% 19.5% 4.2% Total Unaffiliated Units Outstanding (mm) 67.0 67.0 67.0 67.0 67.0 67.0 Total Stock Consideration ($mm) $1,042 $1,448 $1,448 $1,228 $1,448 $1,228 Total Cash
Consideration ($mm) - - 469 234 268 268 Total Consideration ($mm) $1,042 $1,448 $1,917 $1,463 $1,716 $1,496 Total DINO Shares Issued (mm) 24.9 24.9 24.9 21.1 24.9 21.1 30-Day VWAP Initial Offer Initial Offer 1st HEP Counteroffer DINO Revised
Proposal 2nd HEP Counteroffer Proposed DINO Counteroffer Undisturbed Price Current Price Current Price Current Price Current Price Current Price as of 5/3/23 as of 8/10/23 as of 8/10/23 as of 8/10/23 as of 8/10/23 as of 8/10/23 DINO 30-Day VWAP
$45.97 $50.31 $50.31 $50.31 $50.31 $50.31 Exchange Ratio 0.3714x 0.3714x 0.3714x 0.3150x 0.3714x 0.3150x Stock Consideration per Unit $17.07 $18.69 $18.69 $15.85 $18.69 $15.85 Cash Consideration per Unit - - 7.00 3.50 4.00 4.00 Total Consideration
per Unit $17.07 $18.69 $25.69 $19.35 $22.69 $19.85 Implied Exchange Ratio 0.3714x 0.3714x 0.5105x 0.3846x 0.4509x 0.3945x (3) Premium / (Discount) to Undisturbed 30-Day VWAP as of 5/3/23 - 9.4% 50.5% 13.3% 32.9% 16.3% (4) Premium / (Discount) to
30-Day VWAP as of 8/10/23 (14.3%) (6.2%) 28.9% (2.9%) 13.9% (0.4%) Total Unaffiliated Units Outstanding (mm) 67.0 67.0 67.0 67.0 67.0 67.0 Total Stock Consideration ($mm) $1,143 $1,251 $1,251 $1,061 $1,251 $1,061 Total Cash Consideration ($mm) - -
469 234 268 268 Total Consideration ($mm) $1,143 $1,251 $1,720 $1,296 $1,519 $1,329 Total DINO Shares Issued (mm) 24.9 24.9 24.9 21.1 24.9 21.1 1. Undisturbed Spot Price as of 5/3/23: $15.92 per unit. 2. Spot Price as of 8/10/23: $21.44 per unit. 3.
Undisturbed 30-Day VWAP as of 5/3/23: $17.07 per unit. 4. 30-Day VWAP as of 8/10/23: $19.92 per unit. 1
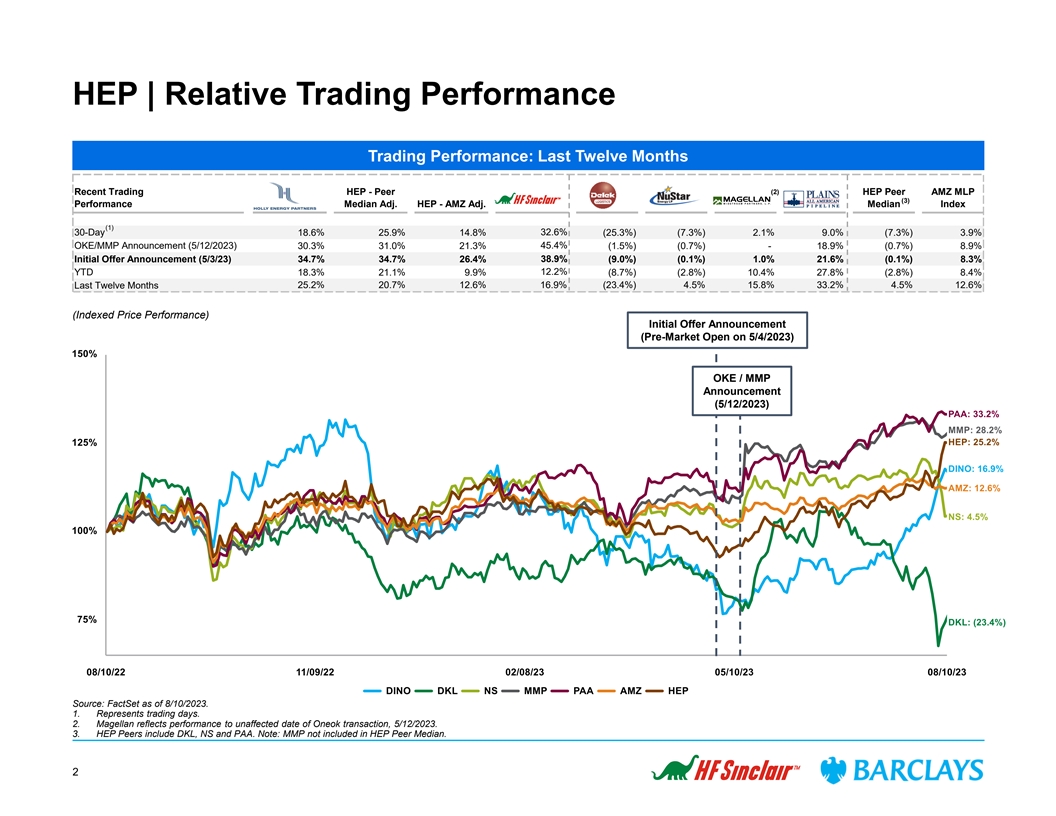
HEP | Relative Trading Performance Trading Performance: Last Twelve
Months Recent Trading HEP - Peer (2) HEP Peer AMZ MLP (3) Performance Median Adj. HEP - AMZ Adj. Median Index (1) 30-Day 18.6% 25.9% 14.8% 32.6% (25.3%) (7.3%) 2.1% 9.0% (7.3%) 3.9% OKE/MMP Announcement (5/12/2023) 30.3% 31.0% 21.3% 45.4% (1.5%)
(0.7%) - 18.9% (0.7%) 8.9% Initial Offer Announcement (5/3/23) 34.7% 34.7% 26.4% 38.9% (9.0%) (0.1%) 1.0% 21.6% (0.1%) 8.3% 12.2% YTD 18.3% 21.1% 9.9% (8.7%) (2.8%) 10.4% 27.8% (2.8%) 8.4% 25.2% 20.7% 12.6% 16.9% (23.4%) 4.5% 15.8% 33.2% 4.5% 12.6%
Last Twelve Months (Indexed Price Performance) Initial Offer Announcement (Pre-Market Open on 5/4/2023) OKE / MMP Announcement (5/12/2023) Source: FactSet as of 8/10/2023. 1. Represents trading days. 2. Magellan reflects performance to unaffected
date of Oneok transaction, 5/12/2023. 3. HEP Peers include DKL, NS and PAA. Note: MMP not included in HEP Peer Median. 2

HEP / DINO | Historical Exchange Ratio Analysis Number of DINO shares
per HEP unit “Heads-Up” Exchange Ratio (HEP / DINO) Initial Offer Announcement (Pre-Market Open on 5/4/2023) 2nd HEP Counter (VWAP) (1) 0.4509x 2nd HEP Counter (2) (Spot) 0.4401x Proposed DINO Counter 0.3837x Current 0.3683x 1-Year VWAP
0.3616x Implied Premium Analysis Implied Premium / Discount to Heads-Up Historical Prices / Heads-Up Exchange Ratio HEP DINO Exchange $21.44 $22.34 $23.58 $25.62 $25.73 $27.87 0.3683x 0.3837x 0.4051x 0.4401x 0.4419x 0.4787x (3) Period ($/unit)
($/share) Ratio - 4.2% 10.0% 19.5% 20.0% 30.0% - 4.2% 10.0% 19.5% 20.0% 30.0% Current (8/10/2023) $21.44 $58.22 0.3683x - 4.2% 10.0% 19.5% 20.0% 30.0% - 4.2% 10.0% 19.5% 20.0% 30.0% Undisturbed Price (5/3/2023) $15.92 $41.91 0.3799x 34.7% 40.3%
48.1% 60.9% 61.6% 75.1% (3.1%) 1.0% 6.6% 15.9% 16.3% 26.0% Offer Price (30-day VWAP as of 5/3/2023) $17.07 $45.97 0.3714x 25.6% 30.9% 38.1% 50.1% 50.7% 63.3% (0.8%) 3.3% 9.1% 18.5% 19.0% 28.9% 5-Day VWAP $20.50 $56.94 0.3600x 4.6% 9.0% 15.1% 25.0%
25.5% 36.0% 2.3% 6.6% 12.5% 22.2% 22.7% 33.0% 10-Day VWAP $20.25 $54.54 0.3713x 5.9% 10.3% 16.5% 26.5% 27.0% 37.6% (0.8%) 3.3% 9.1% 18.5% 19.0% 28.9% 20-Day VWAP $20.07 $52.14 0.3850x 6.8% 11.3% 17.5% 27.6% 28.2% 38.9% (4.3%) (0.3%) 5.2% 14.3% 14.8%
24.3% 30-Day VWAP $19.92 $50.31 0.3960x 7.6% 12.1% 18.4% 28.6% 29.1% 39.9% (7.0%) (3.1%) 2.3% 11.1% 11.6% 20.9% 60-Day VWAP $19.11 $46.40 0.4117x 12.2% 16.9% 23.4% 34.1% 34.7% 45.9% (10.6%) (6.8%) (1.6%) 6.9% 7.3% 16.3% 1-Year VWAP $18.30 $50.61
0.3616x 17.2% 22.1% 28.9% 40.0% 40.6% 52.3% 1.8% 6.1% 12.0% 21.7% 22.2% 32.4% 2-Year VWAP $17.95 $44.52 0.4032x 19.4% 24.5% 31.4% 42.7% 43.3% 55.3% (8.7%) (4.8%) 0.5% 9.1% 9.6% 18.7% 5-Year VWAP $19.00 $41.26 0.4606x 12.8% 17.5% 24.1% 34.8% 35.4%
46.7% (20.0%) (16.7%) (12.0%) (4.4%) (4.0%) 3.9% 52-Week High $21.48 $66.19 0.3245x (0.2%) 4.0% 9.8% 19.3% 19.8% 29.8% 13.5% 18.2% 24.8% 35.6% 36.2% 47.5% Research Analyst Target $18.50 $56.00 0.3304x 15.9% 20.8% 27.5% 38.5% 39.1% 50.7% 11.5% 16.1%
22.6% 33.2% 33.8% 44.9% Source: FactSet as of 8/10/2023. nd Proposed DINO 2 HEP 1. Reflecting 0.3714x exchange ratio on DINO’s 30-day VWAP of $50.31 as of 8/10/2023 plus $4.00 cash per unit. (4) (2) 2. Reflecting 0.3714x exchange ratio on
DINO’s share price of $58.22 as of 8/10/2023 plus $4.00 cash per unit. Counteroffer Counterproposal 3. 5-day, 10-day, 20-day, 30-day and 60-day reflecting trading days. 1-year, 2-year and 3-year reflecting calendar days. 4. Proposed DINO
counteroffer of $22.34 per unit reflecting 0.3150x exchange ratio on DINO’s share price of $58.22 as of 8/10/2023 plus $4.00 cash per unit. 3 Better for HEP Better for DINO

DINO | Relative Valuation (1) EV / EBITDA (EV / EBITDA) 2023E 2024E
2025E EV / 2023E EBITDA EV / 2024E EBITDA Median: 4.8x 6.4x 6.7x EV / 2025E EBITDA 8.4x 8.2x 7.7x 7.2x 8.0x 7.0x 6.7x 6.7x 6.6x 6.5x 6.4x 5.9x 5.7x 5.4x 5.3x 5.2x 5.1x 5.0x 6.0x 4.8x 4.7x 4.6x 4.6x 3.9x 3.7x 4.0x 2.8x 2.0x 0.0x (2) Price / Parent
CFPS (Price / Parent CFPS) 2023E 2024E 2025E Price / 2023E Parent CFPS Median: 4.5x 6.0x 7.4x Price / 2024E Parent CFPS Price / 2025E Parent CFPS 12.0x 8.7x 8.0x 7.6x 9.0x 7.4x 7.4x 7.5x 7.3x 6.4x 6.0x 6.0x 5.8x 5.7x 5.8x 5.5x 5.4x 5.2x 5.2x 4.8x
6.0x 4.6x 4.4x 4.5x 4.3x 3.7x 2.8x 3.0x 0.0x Consolidated Debt / 1. 1x 1.5x 1.6x 1.1x 1.5x 3.1x 0.8x 0.6x (3) 2023E EBITDA Consolidated Net Debt / 2023E 0.7x 1.0x 0.9x 0.8x 0.8x 2.2x 0.4x (0.0)x (4) EBITDA Source: Management projections, company
filings, FactSet, and Wall Street research as of 8/10/2023. 1. DINO EBITDA reflecting management estimates. Peers per FactSet consensus. 2. DINO and peers reflecting FactSet consensus. Adj. CFPS is adjusted to remove third-party distributions to
unaffiliated MLP public unitholders. Adj. CFPS based on Adj. CFFO per share based on shares outstanding from Management projections. Remaining peers calculated from median consensus. 3. Calculated as current Consolidated Debt / Projected
Consolidated EBITDA. 4. Calculated as Consolidated Debt less Cash / Projected Consolidated EBITDA. 4

HEP | Relative Valuation EV / EBITDA Debt + Pref. / EBITDA 2022A 2023E
2023E-2025E Debt + Pref. / 2022A EBITDA 1.7% 3.5% 3.3% 3.7% 0.4% EBITDA CAGR Median: 4.9x 4.1x Debt + Pref. / 2023E EBITDA 7.0x 2023E 2024E 2025E EV / 2023E EBITDA Median: 8.6x 8.1x 8.3x 6.0x 5.6x 5.5x EV / 2024E EBITDA 12.0x 10.3x 5.0x 4.5x 9.9x EV
/ 2025E EBITDA 9.6x 4.5x 10.0x 9.5x 9.2x 9.1x 9.1x 4.3x 8.5x 8.5x 3.7x 3.8x 8.0x 4.0x 7.8x 8.0x 8.0x 7.4x 7.2x 3.5x 3.4x 3.2x 6.9x 3.0x 6.0x 2.0x 4.0x 2.0x 1.0x 0.0x 0.0x Latest Quarterly Distribution Yield Levered FCF Yield LQA DCF 2023E Levered
FCF Yield 2023E 2024E 2025E 1.9x 2.3x 1.4x 1.3x 2.7x Coverage Median: 11.1% 14.2% 13.6% 2024E Levered FCF Yield 20% 12.0% Median: 8.7% 17.5% 2025E Levered FCF Yield 16.8%16.5% 10.3% 9.9% 14.4% 14.0% 15% 13.6% 13.3% 12.9% 9.0% 7.6% 11.3% 12.1% 7.1%
11.3% 10.8% 11.0% 6.5% 10.1% 10% 6.0% 5% 3.0% NA 0.0% 0% Source: HEP per company filing and DINO Management forecast. Peers per Public filings, FactSet, and Wall Street research as of 8/10/2023. Magellan share price as of the unaffected date of the
Oneok acquisition, 5/12/2023. 5

HEP | Indicative Purchase Price Ratio Analysis Indicative Purchase Price
Ratio Analysis Proposed DINO Second HEP (1) (2) Counteroffer Counterproposal ($ in millions, except per share data) DINO SQ HEP SQ 6/30/23 6/30/23 Illutrative Purchase Price Price as of 8/10/23 $58.22 $21.44 $22.34 $23.58 $25.62 $25.73 $27.87
Implied Premium / (Discount) to HEP Spot Price as of 8/10/23 4% 10% 20% 20% 30% Diluted Shares / Units Oustanding 186.0 126.6 126.6 126.6 126.6 126.6 126.6 Total Equity Value $10,829 $2,714 $2,828 $2,986 $3,244 $3,257 $3,529 Total Debt
(Consolidated) 3,214 1,506 1,506 1,506 1,506 1,506 1,506 Preferred Equity - 63 63 63 63 63 63 Non-Controlling Interest 1,432 69 69 69 69 69 69 Cash (Consolidated) (1,204) (8) (8) (8) (8) (8) (8) Enterprise Value $14,271 $4,344 $4,457 $4,615 $4,873
$4,886 $5,158 Public Units Outstanding 67.0 67.0 67.0 67.0 67.0 67.0 Total Value of Public Units $1,436 $1,496 $1,579 $1,716 $1,723 $1,867 Implied Exchange Ratio 0.3683x 0.3837x 0.4051x 0.4401x 0.4419x 0.4787x Precedent Premium Premium / Discount
to: Median Mean Current 8/10/23 - - 4.2% 10.0% 19.5% 20.0% 30.0% 12.6% 13.9% Unaffected Price 38.9% 34.7% 40.3% 48.1% 60.9% 61.6% 75.1% 52-Week High (12.0%) (0.2%) 4.0% 9.8% 19.3% 19.8% 29.8% Research Analyst Target 4.0% 15.9% 20.8% 27.5% 38.5%
39.1% 50.7% Trading Comparables DINO SQ HEP SQ Peer Peer Transaction (3) (3) Enterprise Value as a Multiple of: Data Data Median Mean Comparables EBITDA 2023E $3,030 4.7x $458 9.5x 9.7x 10.1x 10.7x 10.7x 11.3x 8.6x 8.7x 10.1x 2024E 2,662 5.4x 477
9.1x 9.3x 9.7x 10.2x 10.2x 10.8x 8.2x 8.4x 10.1x 2025E 2,698 5.3x 474 9.2x 9.4x 9.7x 10.3x 10.3x 10.9x 8.3x 8.3x Equity Value as a Multiple of: Earnings per Share 2023E $9.15 6.4x $2.08 10.3x 10.8x 11.4x 12.3x 12.4x 13.4x 10.7x 10.5x 2024E 7.58 7.7x
2.36 9.1x 9.5x 10.0x 10.9x 10.9x 11.8x 10.6x 10.2x 2025E 7.75 7.5x 2.44 8.8x 9.1x 9.7x 10.5x 10.5x 11.4x 10.0x 9.9x Yield Analysis: Dividends LQA $1.80 3.1% $1.40 6.5% 6.3% 5.9% 5.5% 5.4% 5.0% 8.7% 8.7% 2023E 1.80 3.1% 1.40 6.5% 6.3% 5.9% 5.5% 5.4%
5.0% 2024E 1.80 3.1% 1.40 6.5% 6.3% 5.9% 5.5% 5.4% 5.0% 2025E 1.80 3.1% 1.40 6.5% 6.3% 5.9% 5.5% 5.4% 5.0% YE Leverage Total Debt / EBITDA 2022A $3,214 0.7x $1,506 3.6x 3.6x 3.6x 3.6x 3.6x 3.6x 4.9x 4.7x 2023E 3,214 1.1x 1,506 3.3x 3.3x 3.3x 3.3x
3.3x 3.3x 4.1x 4.0x Source: Projections per DINO Management. Market data as of 8/10/2023. Balance sheet data reflect DINO / HEP Q2 2023 10-Q filings. 1. Proposed DINO counteroffer of $22.34 per unit reflecting 0.3150x exchange ratio on DINO’s
share price of $58.22 as of 8/10/2023 plus $4.00 cash per unit. 2. Second HEP counterproposal of $25.62 per unit reflecting 0.3714x exchange ratio on DINO’s share price of $58.22 as of 8/10/2023 plus $4.00 cash per unit. 3. Peers include DKL,
MMP, NS and PAA. 6

Appendix

Apple | Proposal Summary Key Events — On May 4, 2023, HF Sinclair
(DINO) offered to acquire all outstanding publicly held common units of Holly Energy Partners (HEP) at a fixed exchange ratio of 0.3714 newly issued shares of DINO Common Stock per each HEP unit w Offer derived using the 30-day volume weighted
average prices for each security as of market close on May 3, 2023 — Following DINO’s initial proposal, 1¡ On July 14, 2023, the Conflicts Committee of HEP responded with a counterproposal consisting of 0.3714 exchange ratio plus
$7.00 in cash per HEP unit w The counterproposal implies a total per unit consideration of $24.16 based on DINO’s share price as of 7/14/2023 ¡ On July 21, 2023, DINO responded with a revised proposal comprised of 0.3150 exchange
ratio plus $3.50 in cash 2 w The revised proposal implies a total per unit consideration of $18.92 based on DINO’s share price on 7/21/2023 nd 3¡ On July 28, 2023, the Conflicts Committee of HEP responded with a 2 counterproposal
consisting of 0.3714 exchange ratio plus $4.00 in cash per HEP unit nd w The 2 counterproposal implies a total per unit consideration of $23.16 based on DINO’s share price as of 7/28/2023 Summary of Proposals – Spot Offer Price
Implied Premium to HEP Unit Price as of: Total Consideration per Equity Consideration (2) Date Exchange Ratio Cash Consideration Unit HEP Closing Price DINO Closing Price 5/3/23 7/14/23 7/21/23 7/28/23 8/10/23 Proposal (1) Initial DINO Offer 5/4/23
0.3714x $0.00 $15.57 $15.92 $41.91 (2.2%) N/A N/A N/A N/A 1st HEP Counterproposal 7/14/23 0.3714x $7.00 $24.16 $18.87 $46.21 51.8% 28.0% N/A N/A N/A Revised DINO Proposal 7/21/23 0.3150x $3.50 $18.92 $18.97 $48.96 18.9% 0.3% (0.3%) N/A N/A 2nd HEP
Counterproposal 7/28/23 0.3714x $4.00 $23.16 $19.18 $51.60 45.5% 22.8% 22.1% 20.8% N/A Proposed DINO Counteroffer 8/10/23 0.3150x $4.00 $22.34 $21.44 $58.22 40.3% 18.4% 17.8% 16.5% 4.2% Summary of Proposals – 30-Day VWAP Offer Price Implied
Premium to HEP 30-Day VWAP as of: Total Consideration per Equity Consideration (3) Proposal Date Exchange Ratio Cash Consideration Unit (30-Day VWAP) HEP 30-Day VWAP DINO 30-Day VWAP 5/3/23 7/14/23 7/21/23 7/28/23 8/10/23 (1) Initial DINO Offer
5/4/23 0.3714x $0.00 $17.07 $17.07 $45.97 (0.0%) N/A N/A N/A N/A 1st HEP Counterproposal 7/14/23 0.3714x $7.00 $23.57 $18.24 $44.62 38.1% 29.2% N/A N/A N/A Revised DINO Proposal 7/21/23 0.3150x $3.50 $17.75 $18.38 $45.24 4.0% (2.7%) (3.4%) N/A N/A
2nd HEP Counterproposal 7/28/23 0.3714x $4.00 $21.14 $18.64 $46.16 23.8% 15.9% 15.0% 13.4% N/A Proposed DINO Counteroffer 8/10/23 0.3150x $4.00 $19.85 $19.92 $50.31 16.3% 8.8% 8.0% 6.5% (0.4%) 1. Offer delivered pre-market open on 5/4/23. DINO and
HEP closing prices reflecting prices as of unaffected date of 5/3/2023. 2. Total consideration per unit equal to DINO closing price multiplied by exchange ratio, plus cash consideration when applicable. 3. Total consideration per unit (30-day VWAP)
equal to DINO 30-day VWAP multiplied by exchange ratio, plus cash consideration when applicable. 7

DINO | Comparable Companies DINO Trading Comparables ($ in millions,
except per share values) Peer Median Stock Price as of 8/10/2023 $58.22 $145.28 $114.67 $134.86 $48.58 $37.46 $27.79 $36.24 Diluted Shares Outstanding 186 403 451 353 130 103 67 63 Total Equity Value $10,829 $58,594 $51,690 $47,624 $6,295 $3,852
$1,874 $2,282 Total Debt 3,214 27,650 18,730 11,323 1,469 1,597 2,874 595 Cash 1,204 11,454 6,705 5,075 1,517 751 848 191 Net Debt 2,010 16,196 12,025 6,248 (48) 846 2,026 404 (1) Minority Interest 1,432 12,320 -- -- -- 586 382 -- Enterprise Value
$14,271 $87,110 $63,715 $53,872 $6,247 $5,283 $4,283 $2,686 Enterprise Value to: 2023E EBITDA 4.7x 5.1x 5.2x 3.9x 2.8x 4.8x 4.6x 5.0x 4.8x 2024E EBITDA 5.4x 7.2x 6.4x 5.7x 3.7x 7.0x 5.9x 6.7x 6.4x 2025E EBITDA 5.3x 7.7x 6.6x 6.7x 4.6x 8.2x 6.5x 8.4x
6.7x 2023E EBIT 6.2x 6.3x 6.3x 4.8x 3.3x 6.6x 7.9x 6.8x 6.3x 2024E EBIT 7.4x 9.8x 7.7x 8.0x 5.6x 10.3x 11.8x 11.5x 9.8x 2025E EBIT 7.3x 10.9x 8.0x 10.0x 8.1x 11.1x 16.7x 14.5x 10.9x Equity Value to: 2023E CFFO 5.2x 4.4x 5.8x 4.4x 3.6x 4.1x 2.6x 4.1x
4.1x 2024E CFFO 6.0x 5.5x 6.6x 5.6x 4.6x 6.3x 3.9x 6.8x 5.6x 2025E CFFO 6.7x 5.4x 6.8x 6.1x 5.2x 7.7x 4.1x 7.1x 6.1x 2023E Net Income 6.4x 6.8x 7.5x 5.8x 5.2x 8.0x 8.5x 6.3x 6.8x 2024E Net Income 7.7x 10.6x 9.1x 9.9x 7.6x 15.3x 22.2x 11.8x 10.6x
2025E Net Income 7.5x 9.7x 9.4x 12.8x 10.7x 19.7x N/M 16.9x 11.7x Source: DINO Management, Company filings, FactSet, Wall Street research and investor presentations as of 8/10/2023. DINO balance sheet data reflects Q2 2023 10-Q filing. 1. Reflects
market value of public interest in MLP. Does not include preferred equity held by subsidiaries. 8

HEP | Comparable Companies HEP Trading Comparables ($ in millions
except per unit data) Peer Median (1) Unit Price as of 8/10/23 $21.44 $41.30 $15.56 $55.41 $15.03 % of 52-week high (Close) 100% 66% 87% 97% 99% 92% Fully Diluted Units Outstanding 127 44 111 202 698 Total Equity Value $2,714 $1,800 $1,726 $11,198
$10,497 Debt 1,506 1,754 2,897 5,000 8,087 Preferred Equity 63 - 1,059 - 2,666 Noncontrolling Interest 69 - - - - Cash (8) ( 8) (4) ( 128) (933) Enterprise Value $4,344 $3,546 $5,678 $16,070 $20,317 Enterprise Value / 2023E EBITDA 9.5 x 9.1 x 7.4 x
10.3 x 8.0 x 8.6 x 2024E EBITDA 9.1 x 8.5 x 7.2 x 9.9 x 7.8 x 8.1 x 2025E EBITDA 9.2 x 8.5 x 6.9 x 9.6 x 8.0 x 8.3 x Valuation Metrics LQA Yield 6.53% 9.93% 10.28% 7.56% 7.12% 8.74% 2023E Yield 6.53% 10.02% 10.28% 7.60% 7.12% 8.81% 2024E Yield 6.53%
10.39% 10.28% 7.67% 8.12% 9.20% 2025E Yield 6.53% 11.04% 10.28% 7.74% 9.12% 9.70% 2023E DCF Yield 12.23% 14.59% 23.74% 11.07% 14.94% 14.76% 2024E DCF Yield 12.86% 17.22% 23.39% 11.60% 17.67% 17.45% 2025E DCF Yield 13.28% NA 24.43% 12.07% 17.24%
17.24% 2023E FCF Yield 12.11% 11.03% 16.80% 10.10% 11.26% 11.14% 2024E FCF Yield 12.86% 14.44% 16.46% 10.82% 14.00% 14.22% 2025E FCF Yield 13.28% NA 17.50% 11.29% 13.57% 13.57% 2023E EPS $2.08 $3.91 $1.81 $5.08 $1.22 $3.91 2024E EPS 2.36 4.67 1.43
5.22 1.39 4.67 2025E EPS 2.44 4.89 1.59 5.46 1.32 4.89 Coverage 2023E Coverage 1.87 x 1.46 x 2.31 x 1.46 x 2.10 x 1.78 x 2024E Coverage 1.97 x 1.66 x 2.27 x 1.51 x 2.18 x 1.92 x 2025E Coverage 2.03 x NA 2.38 x 1.56 x 1.89 x 1.89 x Credit Statistics
Debt / 2022A EBITDA 3.6 x 5.6 x 4.0 x 3.5 x 3.2 x 3.7 x Debt / 2023E EBITDA 3.3 x 4.5 x 3.8 x 3.2 x 3.2 x 3.5 x Debt + Pref / 2023A EBITDA 3.8 x 5.6 x 5.5 x 3.5 x 4.3 x 4.9 x Debt + Pref / 2023E EBITDA 3.4 x 4.5 x 4.5 x 3.2 x 3.7 x 4.1 x Source:
DINO Management, Company filings, FactSet, Wall Street research and investor presentations as of 8/10/2023. HEP balance sheet data reflects Q2 2023 10-Q filing. 1. Magellan unaffected share price as of 5/12/2023 prior to Oneok acquisition.
9

HEP | Equity Analyst Price Targets (1) (2) Research Price Targets
Premium / (Discount) % to Current Price ($ / share) Median Analyst Target Price Premium / (Discount) to: Current Price (14%) (3) Current: $55.41 $70.00 30.0% $65.00 Current: 22% $41.30 $60.00 17% 20.0% $47.00 13% Current: $50.00 $15.56 10.0% 14%
$40.00 Current: 0.0% $15.03 Current (7%) $30.00 Price: $19.00 $21.44 (10.0%) $19.00 $20.00 $17.00 $18.00 $20.00 $17.00 (11%) Median (20.0%) Price (16%) $10.00 Target: (21%) $18.50 $0.00 (30.0%) Analyst 1 Analyst 2 Analyst 3 Analyst 4 7/11/2023
5/6/2023 5/4/2023 4/3/2023 Analyst Recommendation 0 2 1 4 Buy ✓ 1 3 4 2 Hold ~ 0 1 1 0 Sell O O 1 6 6 6 Source: FactSet as of 8/10/2023. 1. Includes available reports from reputable brokers that have provided a price target. 2. Peer group
price targets reflect average analyst price target. 3. Reflects unaffected price from 5/12/2023 prior to Oneok acquisition. 10

DINO | Equity Analyst Price Targets (1) (2) Research Price Targets
Premium / (Discount) % to Current Price Price Targets ($ / share) Median Analyst Target Price Premium / (Discount) to: Current Price (4%) Current: Current: Current: Current: Current: Current: Current: $145.28 $114.67 $134.86 $37.46 $27.79 $48.58
$36.24 $146.00 $123.0 $145.00 $80.00 50% $70.00 40% Current $63.00 DINO: $61.00 $57.00 $58.22 $60.00 30% $55.00 $56.00 $56.00 $54.00 $52.00 Median $50.00 $47.00 $50.00 20% Analyst: 21% $56.00 10% 17% $40.00 10% 8% 6% $40.00 10% 12% 9% $31.00 (1%) 8%
Peers $29.00 (4%) $30.00 0% Median: $26.00 4% (1%) (2%) (0%) $20.00 -10% (6%) (21%) $10.00 -20% (23%) $0.00 -30% 1 2 3 4 5 6 7 8 9 10 11 12 13 14 15 16 17 Analyst 1 Analyst 2 Analyst 3 Analyst 4 Analyst 5 Analyst 6 Analyst 7 Analyst 8 Analyst 9
Analyst 10 7/19/23 7/18/23 7/18/23 7/14/23 7/10/23 7/10/23 7/9/23 7/6/23 5/25/23 4/9/23 Analyst Recommendation 9 7 9 0 1 2 3 Buy ✓✓✓✓✓✓ 2 3 2 3 5 6 1 Hold ~ ~ ~ ~ 0 0 0 0 2 0 0 Sell Source: FactSet as of
8/10/2023. 11 10 11 3 8 8 4 1. Includes available reports from reputable brokers since Q1’23 earnings release that have provided a price target. 2. Peer group price targets reflect median analyst price target. 11

HEP | Comparable Transaction Analysis Selected MLP Buy-in Transactions
Total Initial Initial Premium Paid Premium Paid - (2) (3) Announced Transaction Enterprise Value Price Premium Final (Days Prior to Initial Ann.) (Days Prior to Final Ann.) EV / FY+1 30-Day 30-Day (1) Date Acquirer Target Value ($MM) Acquirer Target
Offered Offered Price 1-Day 1-Day EBITDA Consideration Process VWAP VWAP 8/17/2022 $3,783 $68,412 $14,229 $34.75 0.0% $41.75 20.1% 24.0% 6.2% 8.2% 8.4x 100% Cash Ann. then Negotiate (4) 7/28/2022 $579 $7,229 $1,690 $15.14 13.4% $17.66 32.3% 11.0%
(3.4%) 9.9% 7.3x Cash and Unit Exchange Ann. then Negotiate 7/6/2022 $131 NA $824 $17.90 (0.3%) $25.00 39.3% 42.8% 2.8% 8.6% 10.3x 100% Cash Ann. then Negotiate 4/22/2022 $400 NA $595 $3.32 0.9% $4.65 41.3% 42.7% 40.9% 40.7% 11.1x 100% Cash Ann.
then Negotiate (5) 2/11/2022 $2,608 $237,598 $9,749 $12.89 0.0% $15.85 23.0% 23.5% 9.6% 11.6% 12.6x 100% Cash Ann. then Negotiate 10/27/2021 $3,466 $16,829 $13,076 $32.57 0.0% $41.11 4.8% 7.6% 4.8% 7.6% 9.7x 100% Unit Exchange Negotiate then Ann.
(6) 8/5/2021 $874 $126,182 $1,694 $13.01 0.0% $15.12 16.2% 8.9% 17.1% 17.2% 9.7x 100% Unit Exchange Ann. then Negotiate (7) 2/5/2021 $1,149 $201,401 $2,872 $12.47 0.0% $14.56 16.7% 18.7% (3.3%) 5.8% 7.4x 100% Unit Exchange Ann. then Negotiate (8)
10/5/2020 $2,829 $74,892 $3,361 $27.31 5.4% $30.95 19.5% 15.1% 0.6% (0.7%) 10.1x 100% Unit Exchange Ann. then Negotiate 7/27/2020 $693 $4,419 $1,312 $8.38 4.5% $8.47 28.1% 29.1% 28.1% 29.1% 7.3x 100% Unit Exchange Negotiate then Ann. 11/26/2018 $536
NA $1,246 $38.00 4.4% $41.00 12.6% 9.5% 12.6% 9.5% 10.6x 100% Cash Negotiate then Ann. 11/8/2018 $8,965 $7,251 $12,230 $43.77 5.0% $50.33 7.6% 14.3% 7.6% 14.3% 11.2x 100% Unit Exchange Negotiate then Ann. 10/18/2018 $1,850 $50,344 $3,660 $40.00
10.7% $42.25 6.0% 10.2% 6.0% 10.2% 10.2x 100% Cash Negotiate then Ann. 9/19/2018 $2,634 $86,611 $6,683 $17.75 0.0% $18.22 2.6% 8.8% 0.5% 1.0% 29.6x 100% Unit Exchange Ann. then Negotiate (9) 8/1/2018 $60,345 $26,932 $80,353 $21.32 5.0% $23.59 11.2%
17.5% 11.2% 17.5% 7.0x 100% Unit Exchange Negotiate then Ann. (10) 5/29/2018 $300 $5,332 $3,262 $21.86 (1.1%) $21.86 (1.1%) 9.2% (1.1%) 9.2% 6.2x 100% Unit Exchange Tender Offer (11) 5/17/2018 $4,779 $123,056 $27,256 $33.10 0.0% $40.00 20.8% 18.4%
5.7% 6.8% 14.3x 100% Unit Exchange Ann. then Negotiate (12) 5/17/2018 $10,010 $121,978 $14,694 $10.08 0.0% $11.48 13.9% 16.4% 2.1% 0.3% 10.1x 100% Unit Exchange Ann. then Negotiate 5/17/2018 $15,105 $29,816 $55,383 $36.94 5.2% $40.89 6.4% 11.2% 6.4%
11.2% 11.8x 100% Unit Exchange Negotiate then Ann. 3/27/2018 $3,224 $3,418 $4,942 $41.34 (0.5%) $35.42 0.6% (8.1%) 0.6% (8.1%) 6.3x 100% Unit Exchange Negotiate then Ann. Source: Price data per FactSet. Transaction value and consideration paid based
on public filings, company press releases, and investor presentations. 1. Transaction value includes only un-affiliated and proportional net debt. 2. Premium paid to initial announcement represents the premium based on the final agreed upon price
relative to the original offer’s unaffected date. 3. Premium paid to final announcement represents the premium based on the final agreed upon price relative to the final announcement’s unaffected date. 4. Initial price offered not yet
disclosed. Transaction value and premium reflect unaffected DINO price as of 7/27/2022. Initial announcement date reflects filing of Schedule 13D/A on June 24, 2022. 5. Shell / Shell Midstream Partners LP based on revised offer announced 7/25/2022.
Premium paid based on closing price prior to original announcement on 2/11/2022. 6. BP / BP Midstream Partners LP based on revised offer announced 12/20/2021. Premium paid based on closing price prior to original announcement on 8/4/2021. 7. Chevron
/ Noble Midstream Partners based on revised offer announced 3/5/2021. Premium paid based on closing price prior to original announcement on 2/4/2021. 8. TC Energy / TC Pipeline based on revised offer announced 12/15/2020. Premium paid based on
closing price prior to original announcement on 10/5/2020. 9. Dominion Energy / Dominion Energy Midstream based on revised offer announced 11/23/2018. Premium paid based on closing price prior to original announcement on 9/8/2018. 10. Reflects the
5/29/18 exchange offer; CVI announced it would exercise the call right on 1/17/19. 11. Enbridge / Spectra premiums based on revised offer announced on 8/24/2018. Enbridge price performance based on original announcement on 5/17/2018. 12. Enbridge /
Enbridge Energy Partners based on revised offer announced 9/18/2018. Enbridge price performance based on original announcement on 5/17/2018. 12

HEP | Comparable Transaction Analysis (Cont’d) Selected MLP
Buy-in Transactions Total Initial Initial Premium Paid Premium Paid (2) (3) Announced Transaction Enterprise Value Price Premium Final (Days Prior to Initial Ann.) (Days Prior to Final Ann.) EV / FY+1 30-Day 30-Day (1) Date Acquirer Target Acquirer
Target Offered Offered Price 1-Day 1-Day EBITDA Consideration Process Value ($MM) VWAP VWAP 11/8/2017 $173 $3,189 $845 $11.80 3.0% $13.92 3.0% 11.5% 3.0% 11.5% 4.6x 100% Unit Exchange Negotiate then Ann. 8/29/2017 $736 NA $736 $14.50 0.4% $16.50
15.2% 12.4% 15.2% 12.4% 12.3x 100% Cash Negotiate then Ann. 5/18/2017 $651 NA $963 $20.00 20.1% $20.00 20.1% 20.4% 20.1% 20.4% 12.3x 100% Cash Tender Offer 4/4/2017 $157 NA $594 $16.80 5.8% $17.30 5.8% 5.6% 5.8% 5.6% 9.1x 100% Cash Tender Offer
3/2/2017 $781 NA $1,470 $18.75 1.9% $19.50 6.0% 5.6% 4.3% 3.4% 9.3x 100% Cash Ann. then Negotiate 1/27/2017 $1,656 $77,129 $1,656 $6.25 (4.6%) $8.00 (8.6%) 1.8% (8.6%) 1.8% 11.0x 100% Cash Negotiate then Ann. 11/1/2016 $5,180 $77,381 $9,684 $15.75
2.9% $17.00 11.1% 16.0% 6.3% 5.2% 18.0x 100% Cash Ann. then Negotiate Selected MLP Transactions From 2016 - 2023 YTD Mean 3.0% 13.9% 15.0% 7.5% 10.0% 10.7x Median 0.9% 12.6% 12.4% 5.8% 9.2% 10.1x High 20.1% 41.3% 42.8% 40.9% 40.7% 29.6x Low (4.6%)
(8.6%) (8.1%) (8.6%) (8.1%) 4.6x Selected 100% Stock MLP Transactions From 2016 - 2023 YTD Mean 1.9% 10.8% 12.8% 6.0% 8.8% 10.4x Median 0.0% 9.4% 12.9% 3.9% 8.4% 9.7x High 5.4% 28.1% 29.1% 28.1% 29.1% 29.6x Low (1.1%) (1.1%) (8.1%) (3.3%) (8.1%)
4.6x Selected MLP Transactions From 2021 - 2023 YTD Mean 1.8% 24.2% 22.4% 9.4% 13.7% 9.6x Median 0.0% 21.6% 21.1% 5.5% 9.3% 9.7x High 13.4% 41.3% 42.8% 40.9% 40.7% 12.6x Low (0.3%) 4.8% 7.6% (3.4%) 5.8% 7.3x Source: Price data per FactSet.
Transaction value and consideration paid based on public filings, company press releases, and investor presentations. HEP data per DINO Management forecast. 1. Transaction value includes only un-affiliated and proportional net debt. 2. Premium paid
to initial announcement represents the premium based on the final agreed upon price relative to the original offer’s unaffected date. 3. Premium paid to final announcement represents the premium based on the final agreed upon price relative to
the final offer’s unaffected date. 4. Reflects DINO management estimates of balance sheet data for 6/30/2023. 13

Disclaimer The preceding pages contain material that was provided to
the Board of Directors (the “Board”) of HF Sinclair Corporation (the “Company”) by Barclays Capital Inc. (“Barclays”). The accompanying material and any Barclays presentation related to the material was compiled
or prepared on a confidential basis solely for consideration by the Board and no part of it may be reproduced, distributed or transmitted without the prior written consent of Barclays. The information contained in this material was obtained from the
Company and/or publicly available sources, and Barclays has relied upon such information without independent verification thereof and does not assume any liability for any such information. These materials are being provided in connection with an
actual corporate engagement and may not be used or relied upon for any purpose other than as specifically contemplated by a written agreement with Barclays. Moreover, any information provided herein was not prepared for or intended for use by any
individual for personal, family or household purposes. Any estimates, historical financial information, projections and other information contained herein have been prepared by management of the Company or were obtained from publicly available
sources (approved for Barclays’ use by the Company) or are based upon such estimates and projections. With respect to such estimates and projections, Barclays has assumed that they have been reasonably prepared on a basis reflecting the best
currently available estimates, projections and judgment of the management of the Company. The projections contained herein may or may not be achieved and differences between projected results and those actually achieved may be material. No
representation or warranty, expressed or implied, is made as to the accuracy or completeness of such information and nothing contained herein is, or shall be relied upon as, a promise or representation, whether as to the past or the future. The
analysis contained herein is based on current market conditions which are subject to change and Barclays assumes no obligation to update or otherwise revise these materials. Nothing in these materials shall be deemed to constitute a recommendation
or investment, legal, tax, financial, accounting or other advice. Because these materials were prepared for use in the context of a presentation to the Board, these materials are incomplete without reference to, and should be assessed solely in
conjunction with, the oral briefing provided by Barclays to the Board (in their capacity as directors and not in any individual capacity and is not for the benefit of any individual, including any individual officer, director, shareholder or any
other person). These materials were not prepared for or intended for use by any individual for personal, family or household purposes nor were they prepared to comply with the disclosure standards under state and federal securities laws or any other
applicable laws and, to the extent the material may be considered by readers not as familiar with the business and affairs of the Company as the Board, none of the Company, Barclays, their respective affiliates or any of their respective legal or
financial advisors or accountants takes any responsibility for the accuracy or completeness of any of the material if used by persons other than the Board. These materials are not intended to provide the sole basis for evaluation of the proposed
corporate transaction and do not purport to contain all information that may be required and should not be considered a recommendation with respect to the proposed corporate transaction. Barclays has not made or obtained any evaluations or
appraisals of the assets or liabilities of the Company or any other party to any corporate transaction or any of their respective affiliates and has no obligation to evaluate the solvency of the Company or any other party to any transaction under
any state or federal laws relating to bankruptcy, insolvency or similar matters. The analyses contained herein do not purport to be appraisals nor do they necessarily reflect the prices at which businesses or securities actually may be sold or
purchased. Barclays’ role in any due diligence review is limited solely to performing such a review as it shall deem necessary to support its own advice and analysis and shall not be on behalf of the Company, the Board or any individual
officer, director, shareholder or any other person. Barclays, its subsidiaries and affiliates engage in a wide range of businesses from investment and commercial banking, lending, asset management and other financial and non-financial services. In
the ordinary course of its business, Barclays and its affiliates may actively trade and effect transactions in the equity, debt and/or other securities (and any derivatives thereof) and financial instruments (including loans and other obligations)
of the Company for its own account and for the accounts of its customers and, accordingly, may at any time hold long or short positions and investments in such securities and financial instruments or in other financial products and instruments.
Unless otherwise expressly agreed or provided for in other applicable Barclays disclosures governing such corporate transactions or required by law or regulation, Barclays conducts these activities as principal and executes its principal
transactions as an arm’s length counterparty. Barclays does not act as a fiduciary in relation to these corporate transactions. These materials do not constitute investment advice nor do they form part of an offer to sell or purchase, or the
solicitation of an offer to sell or purchase, any securities or any of the businesses or assets described herein or an offer of financing or an offer or recommendation to enter into any corporate transaction described herein. Barclays Capital Inc.
is the United States investment bank of Barclays Bank PLC. Barclays Bank PLC is authorised by the Prudential Regulation Authority and regulated by the Financial Conduct Authority and the Prudential Regulation Authority (Financial Services Register
No. 122702). Registered in England. Registered No. 1026167. Registered office: 1 Churchill Place, London E14 5HP. Copyright Barclays Bank PLC, 2023 (all rights reserved). 14
Holly Energy Partners (NYSE:HEP)
Historical Stock Chart
Von Apr 2024 bis Mai 2024

Holly Energy Partners (NYSE:HEP)
Historical Stock Chart
Von Mai 2023 bis Mai 2024
