AS AT 30 JUNE 2013
 Notes      As at      As at
          30 June    30 June
             2013       2012
        ---------  ---------
              USD        USD


 ASSETS

 Financial assets at fair value
  through profit or loss                   5(a)    51,038,216   38,216,419
 Trade and other receivables                6       1,160,571    1,157,142
 Cash and cash equivalents                          3,031,033    4,960,190
                                                  -----------  -----------

 Total assets                                      55,229,820   44,333,751
                                                  ===========  ===========

 EQUITY AND LIABILITIES

 Liabilities

 Financial liabilities at fair value
  through profit or loss                    5(b)    5,479,421    5,358,713
 Trade and other payables                   8       1,520,732      209,931

 Total liabilities                                  7,000,153    5,568,644
                                                  -----------  -----------

 Equity

 Share capital                              7         426,303      426,303
 Share premium                                     38,092,003   38,484,202
 Retained earnings/(losses)                         9,352,924    (415,563)
                                                  -----------  -----------

 Equity attributable to equity holders
  of the parent                                    47,871,230   38,494,942
 Non-controlling interest                             358,437      270,165


 Total equity                                      48,229,667   38,765,107
                                                  -----------  -----------

 Total equity and liabilities                      55,229,820   44,333,751
                                                  ===========  ===========
AFRICA OPPORTUNITY FUND LIMITED
CONSOLIDATED STATEMENT OF CHANGES IN EQUITY
FOR THE PERIOD 1 JANUARY 2013 THROUGH 30 JUNE 2013
ATTRIBUTABLE TO EQUITY HOLDERS OF THE PARENT
                                     Issued        Share      Retained                 Non controlling         Total
                                    capital      premium        profit         Total          interest        equity
                                   --------  -----------  ------------  ------------  ----------------  ------------
                           Notes        USD          USD           USD           USD               USD           USD

 At 01 January 2012                 426,303   38,705,880       675,220    39,807,403           273,007    40,080,410

 Total Comprehensive
  income for the period                   -            -     1,692,704     1,692,704            20,652     1,713,356

 Other comprehensive
  income                                  -            -             -             -                 -             -

 Dividend                                 -    (443,355)             -     (443,355)                 -     (443,355)


 At 31 December 2012                426,303   38,262,525     2,367,924    41,056,752           293,659    41,350,411

 Total comprehensive
  income for the period                                      6,985,000     6,985,000            64,778     7,049,778

 Dividend                                      (170,522)                   (170,522)                       (170,522)


 At 30 June 2013                    426,303   38,092,003     9,352,924    47,871,230           358,437    48,229,667
                                   ========  ===========  ============  ============  ================  ============
AFRICA OPPORTUNITY FUND LIMITED
CONSOLIDATED STATEMENT OF CASH FLOWS
FOR THE PERIOD 1 JANUARY 2013 THROUGH 30 JUNE 2013
 Notes   For the Period   For the Period
               Ended 30         Ended 30
              June 2013        June 2012
        ---------------  ---------------
                    USD              USD


 Cash flows from operating activities
 Comprehensive income/ (loss) for the
  period                                                   7,049,777    (1,093,625)

 Adjustment for:
 Interest income                                           (337,420)      (235,302)
 Dividend income                                           (932,097)    (1,885,893)
 (Gain)/ loss on financial assets at
  fair value through profit or loss                      (7,391,461)      1,805,228
 (Gain)/ loss on financial liabilities
  at fair value through profit or loss                     (246,236)        442,561


 Operating losses before working capital
  changes                                                (1,857,437)      (967,032)

 Increase in other receivables and
  prepayments                                               (54,077)      (138,256)
 Decrease in other payables and accrued
  expenses                                                 1,023,984       (54,673)
                                                      --------------  -------------

 Net cash used in operating activities                     (887,530)    (1,159,960)
                                                      --------------  -------------

 Purchase of financial assets at fair
  value through profit or loss                  5(a)    (16,106,663)    (5,093,528)
 Disposal of financial assets at fair
  value through profit or loss                  5(a)      14,619,208      7,521,595
 Purchase of financial liabilities
  at fair value through profit or loss          5(b)     (2,304,319)              -
 Disposal of financial liabilities
  at fair value through profit or loss          5(b)       3,484,092      1,503,412
 Interest received                                           239,099        169,690
 Dividend received                                           524,081      1,456,706
                                                                      -------------

 Net cash generated from investing
  activities                                                 455,498      5,557,875
                                                      --------------  -------------

 Cash flows used in financing activities
 Dividend paid                                             (170,522)      (221,678)
                                                                      -------------

 Net cash flow used in financing activities                (170,522)      (221,678)
                                                      --------------  -------------

 Net (decrease)/ increase in cash and
  cash equivalents                                         (602,554)      4,176,237

 Cash and cash equivalents at 1 January                    3,633,587        783,953
                                                                      -------------

 Cash and cash equivalents at 30 June                      3,031,033      4,960,190
                                                      ==============  =============
AFRICA OPPORTUNITY FUND LIMITED
CORPORATE INFORMATION
FOR THE PERIOD 1 JANUARY 2013 TO 30 JUNE 2013
                                                                   Date of
                                                                 appointment
 DIRECTOR:
 CHAIRMAN:                  :   Robert Knapp                     25 June 2007

 NON EXECUTIVE DIRECTORS:   :   Francis Daniels                  21 June 2007
                                Christopher Gradel               25 June 2007
                                Christopher Agar                 25 June 2007
                                Shingayi Mutasa                  25 June 2007
                                Myma Belo-Osagie                 25 June 2007


 REGISTERED OFFICE          :   PO Box 309 GT
                                Ugland House
                                South Church Street
                                George Town
                                Grand Cayman
                                Cayman Islands


 REGISTRAR                  :   Anson Registrars Limited
                                Anson Place, Mill Court
                                La Charroterie, St. Peter's
                                 Port
                                Guernsey GY1 3WX
                                Channel Islands


 NOMINATED ADVISER          :   Grant Thornton UK LLP
                                30 Finsbury Square
                                London EC2P 2YU
                                United Kingdom


 CORPORATE BROKER           :   LCF Edmond de Rothschild Securities Limited
                                5 Upper St. Martin's
                                 Lane
                                London WC2H 9EA
                                United Kingdom
AFRICA OPPORTUNITY FUND LIMITED
CORPORATE INFORMATION
FOR THE PERIOD 1 JANUARY 2013 TO 30 JUNE 2013
 ADMINISTRATOR           :   International Proximity
                             Fifth Floor, Ebene Esplanade
                             24 Cybercity
                             Ebene
                             Mauritius


                             Africa Opportunity Partners
 INVESTMENT MANAGER      :    Limited
                             PO Box 309 GT
                             Ugland House
                             South Church Street
                             George Town
                             Grand Cayman
                             Cayman Islands


 AUDITORS                :   Ernst & Young
                             9(th) Floor, NeXTeracom Tower
                              I
                             Cybercity
                             Ebene
                             Mauritius


                             Credit Suisse Securities (USA)
 PRIME BROKER:           :    LLC
                             Eleven Madison Avenue
                             3rd Floor
                             New York, NY 10010
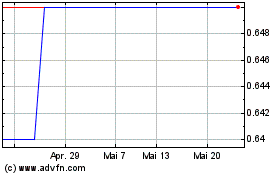
Africa Opportunity (LSE:AOF)
Historical Stock Chart
Von Jun 2024 bis Jul 2024

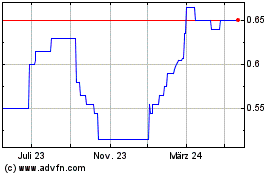
Africa Opportunity (LSE:AOF)
Historical Stock Chart
Von Jul 2023 bis Jul 2024
