UNITED STATES
SECURITIES AND EXCHANGE COMMISSION
Washington, D.C. 20549
FORM N-CSR
CERTIFIED SHAREHOLDER REPORT
OF
REGISTERED MANAGEMENT INVESTMENT COMPANIES
Investment Company Act File Number: 811-22532
Name of Registrant: Royce Global Value Trust,
Inc.
Address of Registrant: 745 Fifth Avenue
New York, NY 10151
Name and address of agent for service: John
E. Denneen, Esq.
745 Fifth Avenue
New York, NY 10151
Registrant's telephone number, including
area code: (212) 508-4500
Date of fiscal year end: December 31, 2023
Date of reporting period: January 1, 2023
– June 30, 2023
Item 1. Reports to Shareholders.

royceinvest.com
Royce Closed-End Funds 2023 Semiannual
Review and Report to Stockholders
June 30, 2023
Royce Global Value Trust
Royce Micro-Cap Trust
Royce Value Trust
| |
|
|
|
| |
|
|
|
| |
|
|
|
| |
|
|
|
| |
|
|
|
| |
A
Few Words on Closed-End Funds |
|
| |
|
|
|
| |
Royce
Investment Partners manages three closed-end funds: Royce Global Value Trust, which primarily invests in both U.S. and non-U.S.
companies with market capitalization below $10 billion; Royce Micro-Cap Trust, which primarily invests in micro-cap securities;
and Royce Value Trust, which primarily invests in small-cap securities. A closed-end fund is an investment company whose
shares are listed and traded on a stock exchange. Like all investment companies, including open-end mutual funds, the assets
of a closed-end fund are professionally managed in accordance with the investment objectives and policies approved by the
fund’s Board of Directors. A closed-end fund raises cash for investment by issuing a fixed number of shares through
initial and other public offerings that may include shelf offerings and periodic rights offerings. Proceeds from the offerings
are invested in an actively managed portfolio of securities. Investors wanting to buy or sell shares of a publicly traded
closed-end fund after the initial and any subsequent offerings must do so on a stock exchange, as with any publicly traded
stock. Shares of closed-end funds frequently trade at a discount to their net asset value. This is in contrast to open-end
mutual funds, which sell and redeem their shares at net asset value on a continuous basis. |
|
| |
|
|
|
| |
A Closed-End Fund Can Offer Several
Distinct Advantages |
|
| |
|
|
|
| |
● |
A closed-end fund does not issue redeemable securities or offer its securities on a continuous basis, so it does not need
to liquidate securities or hold uninvested assets to meet investor demands for cash redemptions. |
|
| |
|
|
|
| |
● |
In a closed-end fund, not having to meet investor redemption requests or invest at inopportune times can be effective for
value managers who attempt to buy stocks when prices are depressed and sell securities when prices are high. |
|
| |
|
|
|
| |
● |
A closed-end fund may invest in less liquid portfolio securities because it is not subject to potential stockholder redemption
demands. This is potentially beneficial for Royce-managed closed-end funds, with significant investments in small- and micro-cap
securities. |
|
| |
|
|
|
| |
● |
The fixed capital structure allows permanent leverage to be employed as a means to enhance capital appreciation potential. |
|
| |
|
|
|
| |
● |
Royce Micro-Cap Trust and Royce Value Trust distribute capital gains, if any, on a quarterly basis. Each of these Funds has
adopted a quarterly distribution policy for its common stock. |
|
| |
|
|
|
| |
We believe that the closed-end fund structure can be an appropriate investment for a long-term investor who understands the
benefits of a more stable pool of capital. |
|
| |
|
|
| |
Why Dividend Reinvestment Is Important |
|
| |
|
|
| |
A very important component of an investor’s total return comes from the reinvestment of distributions. By reinvesting
distributions, our investors can maintain an undiluted investment in a Fund. To get a fair idea of the impact of reinvested
distributions, please see the charts on pages 55 and 56. For additional information on the Funds’ Distribution Reinvestment
and Cash Purchase Options and the benefits for stockholders, please see page 57 or visit our website at www.royceinvest.com. |
|
| |
|
|
| |
Managed Distribution Policy |
|
| |
|
|
| |
The Board of Directors of each of Royce Micro-Cap Trust and Royce Value Trust has authorized a managed distribution policy
(MDP). Under the MDP, Royce Micro-Cap Trust and Royce Value Trust pay quarterly distributions at an annual rate of 7% of the
average of the prior four quarter-end net asset values, with the fourth quarter being the greater of these annualized rates
or the distribution required by IRS regulations. With each distribution, the Fund will issue a notice to its stockholders
and an accompanying press release that provides detailed information regarding the amount and composition of the distribution
(including whether any portion of the distribution represents a return of capital) and other information required by a Fund’s
MDP. You should not draw any conclusions about a Fund’s investment performance from the amount of distributions or from
the terms of a Fund’s MDP. A Fund’s Board of Directors may amend or terminate the MDP at any time without prior
notice to stockholders; however, at this time there are no reasonably foreseeable circumstances that might cause the termination
of any of the MDPs. |
|
| |
|
|
| |
|
|
| |
|
|
| |
This
page is not part of the 2023 Semiannual Report to Stockholders |
|
| |
|
|
| |
|
|
Table
of Contents

This page is not part of the 2023 Semiannual Report to Stockholders | 1
Letter
to Our Stockholders

THE
BIGGER THE BETTER?
U.S. stocks finished the first six months of 2023 in strong shape, with all the major domestic indexes squarely in the black
at the end of June. Several factors seemed to play a role in fostering a more optimistic mindset: returns in April and May
were low for the large-cap Russell 1000 Index and negative for the small-cap Russell 2000 Index, which likely encouraged some
investors to give equities a fresh look. Investors may also have begun looking past concerns about inflation and recession
toward a more stable, perhaps even vibrant period of economic growth. Employment stayed strong while recession talk moderated
in terms of both coverage and volume. Both were encouraging developments, though the Fed’s decision to skip an interest
rate hike in June, even as the central bank all but promised increases in July and September, was almost certainly an even
bigger factor.
How well stocks performed during 2023’s first half varied considerably depending on where one looked along the market
capitalization spectrum. In general, the farther upward one traveled, the higher the returns ran. Interestingly (and somewhat
frustratingly), 2023 began with an advantage for
small-cap stocks. It was short-lived, however, lasting only until this year’s high for the Russell 2000 on Groundhog
Day (2/2/23) before giving way to a rather dramatic reversal. As of 1/31/23, the small-cap index was 300 basis points ahead
of the Russell 1000 for the year-to-date period (+9.7% versus +6.7%). At the end of June, however, the Russell 2000 was running
859 basis points behind the Russell 1000 for the year-to-date period ended 6/30/23.
Returns for the Russell Microcap, Russell 2000, Russell 1000, and Russell Top 50
Year-to-Date through 6/30/23

Past
performance is no guarantee of future results.
2
| This page is not part of the 2023 Semiannual Report to Stockholders
LETTER
TO OUR STOCKHOLDERS
And although returns were lower, large-cap outperformance was also the pattern among non-U.S. stocks, with the difference
being that the year-to-date spread was much narrower: the MSCI ACWI ex USA Small Cap Index rose 6.8% in 2023’s first
half while the MSCI ACWI ex USA Large Cap Index increased 9.8%.
ARTIFICIAL
INTELLIGENCE: A MARKET-SHAPING FORCE?
We think a couple of related observations are relevant from the standpoint of small-cap specialists like us: first, two factors
affected the shift in leadership between U.S. small-and large-cap stocks, one that disproportionately hurt small caps and another
that disproportionately helped a few mega-cap names. Small caps bore the brunt of the damage from the banking crisis, which
had its most adverse effects on the share prices of smaller regional players. (It came as no surprise to us that banks were
the top-detracting industry in the Russell 2000 for 2023’s first half.) The factor that helped large cap, and in our
view the primary driver of that asset class’s higher returns in the first half of the year, was the promise of artificial
intelligence (“AI”), a major secular trend whose impacts have just begun to register.
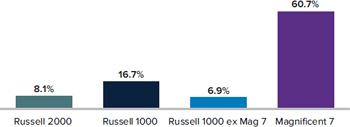
Widespread positive performance masked how top heavy and tightly concentrated returns have become since stocks began rallying
near the end of 2022. Looking closer at first-half results reveals the degree to which the prospects for AI drove large-cap
performance, which was dominated by impressive results for “The Magnificent Seven,” a handful of mostly familiar
behemoths: Alphabet, Amazon, Apple, Meta Platforms, Microsoft, NVIDIA, and Tesla. The combined market capitalizations of these
seven companies accounted for 25.1% of the Russell 1000’s total market capitalization at the end of June. To get an
additional sense of how enormous they are: Apple, the largest of them as of June 30, had a market cap of $3.05 trillion—which
was more than the market cap of the entire Russell 2000 as of that
same date. Considering there are more than 4,000 publicly traded companies in the U.S., this is an almost absurd level of
concentration, one that appears unsustainable to us. It is a level of concentration the market has not seen since the ‘Nifty
Fifty’ market of the early to mid 1970s. Each of “The Magnificent Seven” is considered one of the primary
beneficiaries of AI’s vast untapped potential. Without them, the Russell 2000 would have beaten the Russell 1000 in
the first half of 2023. (We feel it’s also worth mentioning that the fall of the Nifty Fifty, all of them established
large-cap stocks at the time, precipitated a long run of small-cap outperformance.)
The
Russell 2000 Beat the Russell 1000, Excluding the “Magnificent Seven”
Year-to
Date Performance for the Russell 2000, Russell 1000, Russell 1000 ex. the Magnificent 7, and the Magnificent 7
Past
performance is no guarantee of future results.
ARE
SMALL CAPS MOVING FROM BEAR TO BULL?
Unlike their bigger siblings, small caps remained in a bear market at the end of June. The Russell 2000 was down -20.8% from
its last peak on 11/8/21, though a positive 7/31/23 brought it out of bear territory—a decline of at least -20.0% from
its prior peak. By way of contrast, the Russell 1000 was down only -6.2% from its last peak on 1/3/22, and the tech-heavy Nasdaq
fell just -12.9% from its most recent high on 11/19/21, through 6/30/23. Yet we are optimistic both in spite of the relative
disadvantage of small-caps and, in some ways, because of it.
The average stock in the Russell 2000 was -28% off its 52-week high at the end of June, which gives
some sense of the opportunity set that exists within small cap—and with it, the potential for improved
performance going forward. Our expectation is that this potential will be realized over the next few years.
This page is not part of the 2023 Semiannual Report to Stockholders | 3
LETTER
TO OUR STOCKHOLDERS
First,
significant multiple compression has occurred over the last several months among small caps, particularly small-cap value stocks.
The result is that valuations looked highly favorable for the Russell 2000, on both an absolute basis and relative to the Russell
1000, where they remain close to a 20-year low, based on our preferred valuation metric, enterprise value over earnings before
interest & taxes (“EV/ EBIT”). Unsurprisingly in light of how it has recently lagged growth, the Russell 2000
Value Index finished June much more attractively valued than the Russell 2000 Growth Index, based on that same EV/EBIT metric.
It is also worth noting that concerns about elevated valuations in the overall market have played out in an inflationary climate
with rising interest rates and widespread anxiety that the economy is about to slip into a recession. We suspect that these concerns
will continue to recede as economic news continues to skew more positively. Of course, we are more focused on the absolute valuations
of individual companies, which in many instances look appealingly inexpensive to us. The average stock in the Russell 2000 was
-28% off its 52-week high at the end of June, which gives some sense of the opportunity set that exists within small cap—and
with it, the potential for improved performance going forward. Our expectation is that this potential will be realized over the
next few years.
LISTENING
TO CLIO, OR A SMALL-CAP HISTORY IN 3 CHARTS
We
also see history (and Clio is the Muse of that discipline) showing several reasons why small-cap investors may currently have
reasons to be cheerful. We are of course mindful of the fact that history seldom repeats itself. But it often rhymes—and
always offers valuable lessons for those of us who take the time to examine previous performance patterns. We began with an analysis
of what has happened at the end of past rate hike cycles. While our current era has seen the fastest pace of interest rate hikes
on record, there have been other interest rate increase cycles. We looked at the subsequent one-year returns for small cap over
four previous rate hike cycles, going back to 1993. The Russell 2000 had positive performance in three of the four periods, and
in each of those three, returns were in the double digits. Over all four periods, the small-cap index averaged an impressive 18.4%
gain.
Historical
Performance Post Final Fed Rate Hikes
Subsequent
Average Annual 1-Year Returns for the Russell 2000 Following Final Rate Hikes from 3/31/93 through 6/30/23

Past
performance is no guarantee of future results.
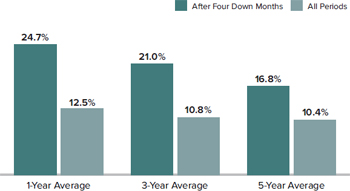
Looking more closely at the present, we find that January and June were the only months so far in 2023 when the Russell 2000
had positive returns. There were four straight down months in between, a rare occurrence that has happened only nine times
since the inception of the index on 12/31/78. We wanted to see what shape performance took over the subsequent one-, three-,
and five-year spans. What we found was very encouraging, with each period coming in comfortably above the one-, three-, and
five-year monthly rolling averages for the Russell 2000 since inception. For the eight periods for which we have data, subsequent
one-year returns averaged 24.7%; subsequent three-year returns averaged 21.0%; and subsequent five-year returns averaged 16.8%.
Russell
2000 Average Returns Following Four Consecutive Months with Negative Returns
From
Russell 2000 Inception (12/31/78) through 6/30/23
Past
performance is no guarantee of future results.
The
Russell 2000 has had four consecutive down months in 9 out 534 periods.
4
| This page is not part of the 2023 Semiannual Report to Stockholders
LETTER
TO OUR STOCKHOLDERS
We
are all hoping for a robust rebound for the U.S. economy for many reasons, not the
least of which is that small caps, in particular
the cyclical industries that mostly populate our
portfolios, tend to do especially well in a thriving economy.
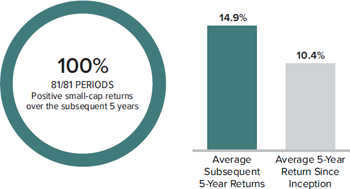
We also looked at data that demonstrates how strong and lasting a rebound small caps have enjoyed after low annualized five-year
periods such as we had at the end of June, when the small-cap index’s average annualized 5-year return was a paltry
4.2%. The Russell 2000 had positive annualized five-year returns 100% of the time—in all 81 five-year periods—averaging an impressive 14.9%, which was well above its monthly rolling five-year return since inception of 10.4%.
Why
Better Small-Cap Performance May Be Ahead
Subsequent
Average Annualized 5-Year Performance for the Russell 2000 Following 5-Year Annualized Return Ranges of Less Than 5% from 12/31/83
through 6/30/23
Past
performance is no guarantee of future results.
It
appears to us that history is on the side of strong small-cap performance going forward.
THE
FUTURE’S SO BRIGHT?
We are all hoping for a robust rebound for the U.S. economy for many reasons, not the least of which is that small caps, in
particular the cyclical industries that mostly populate our portfolios, tend to do especially well in a thriving economy.
And while some data points remain concerning—most notably higher rates, wobbly industrial production, and a stubbornly
inverted yield curve—there are also many signs that the economy is inching closer to recovery. To be sure, a soft landing
looks more and more likely to us, while the kind of deep and potentially lengthy recession many have been anticipating since
late 2021 looks less and less likely. As Neil
Dutta at Renaissance Macro recently put it, “The statute of limitations has now kicked in” regarding a recession
in the U.S.
The U.S. Commerce Department reported a 0.9% seasonally adjusted increase in construction spending for May, which included
a significant jump in spending on new manufacturing facilities. There was a 76.3% increase from a year earlier, as well as
a 1% advance in May over April. The Commerce Department also showed that spending on manufacturing construction accounted
for almost 0.5% of first-quarter GDP, its largest share since 1991. And its second-quarter share of GDP is expected to be
even higher. Homebuilding rose by 21.7% in May, a record monthly surge that defied expectations of a slowdown. CapEx has been
steady and has shown signs of improving, with the ISM services index re-accelerating in June. Durable goods orders rose for
the fourth consecutive month in that same month, hitting a record high for nondefense capital goods (excluding aircraft or
core capital goods, a proxy for business equipment investment). Moreover, retail and vehicle sales rose in June while the
University of Michigan’s consumer sentiment measure rose in July. Most important, however, was that second-quarter GDP
came in higher than expected, thanks to resilient consumers and robust business investment, as inflation continued to moderate,
rising at the slowest rate in more than two years. We think investors should also keep in mind that rate hikes and inflation
will likely be sunsetting over the next year or so, when the positive impacts of reshoring, the infrastructure bill, and the
CHIPs Act will begin to take effect.
All this encouraging news may be of special relevance to small-cap investors. We looked at data going back to the 1940s, using
the Center for Research in Securities Prices data where the CRSP 6-10 is the small-cap proxy, to see what happened to small
caps in recessionary periods. The historical pattern is that small caps tend to trough before recessions end, advancing 33.3%
on average from the small-cap trough to the end of the recession. As we have said previously, investors typically pay a steep
price for waiting, whether for the market to bottom or a recession to end. And a recession remains a possibility, despite
recent developments.
This page is not part of the 2023 Semiannual Report to Stockholders | 5
LETTER
TO OUR STOCKHOLDERS
The
Price of Waiting for Recessions to End
Average
Small-Cap Return from Market Trough to Recession’s End Was 33.3% from 6/30/49 through 4/30/20

Past
performance is no guarantee of future results.
Ultimately, of course, we are bottom-up stock pickers. Our knowledge and experience lie in analyzing companies and managing
portfolios. So, as important as we think all this data is, we put more trust into what we are hearing from company management
teams. In our conversations, there continues to be a sense of cautious optimism—which was reflected in generally solid
earnings for many holdings for
the second quarter and few, if any, profit warnings so far for the third. All of this is consistent with our contention that
small caps are due—arguably overdue—for a breakout in the coming months. Our confidence in the prospects for disciplined
and patient active management within small cap remains high.
Sincerely,
 |
 |
 |
| |
|
|
| Charles M. Royce |
Christopher
D. Clark |
Francis
D. Gannon |
| Chairman, |
Chief Executive
Officer, and |
Co-Chief Investment
Officer, |
| Royce Investment Partners |
Co-Chief Investment
Officer, |
Royce Investment
Partners |
| |
Royce Investment
Partners |
|
| July 31, 2023 |
|
|
6
| This page is not part of the 2023 Semiannual Report to Stockholders
Performance
NAV Average Annual Total Returns
As of June 30, 2023 (%)
| |
|
|
|
|
|
|
|
|
|
SINCE |
INCEPTION |
| |
YTD¹ |
1-YR |
3-YR |
5-YR |
10-YR |
15-YR |
20-YR |
25-YR |
30-YR |
INCEPTION |
DATE |
| Royce
Global Value Trust |
6.63 |
9.31 |
5.18 |
3.76 |
N/A |
N/A |
N/A |
N/A |
N/A |
5.07 |
10/17/13 |
| Royce
Micro-Cap Trust |
6.48 |
16.45 |
14.53 |
7.17 |
9.81 |
9.00 |
9.85 |
9.28 |
N/A |
10.50 |
12/14/93 |
| Royce
Value Trust |
11.73 |
16.38 |
12.20 |
6.91 |
9.16 |
8.18 |
9.25 |
8.70 |
9.92 |
10.21 |
11/26/86 |
| INDEX |
|
|
|
|
|
|
|
|
|
|
|
| MSCI
ACWI Small Cap Index |
8.02 |
13.02 |
10.83 |
4.53 |
7.62 |
7.20 |
9.35 |
7.71 |
N/A |
N/A |
N/A |
| Russell
Microcap Index |
2.32 |
6.63 |
9.09 |
2.07 |
7.29 |
7.70 |
7.55 |
N/A |
N/A |
N/A |
N/A |
| Russell
2000 Index |
8.09 |
12.31 |
10.82 |
4.21 |
8.26 |
8.43 |
8.89 |
7.26 |
8.67 |
N/A |
N/A |
| 1 Not annualized. |
|
|
|
|
|
|
|
|
|
|
|
Important
Performance, and Risk Information
All
performance information in this Review and Report reflects past performance, is presented on a total return basis, net
of the Fund’s investment advisory fee, reflects the reinvestment of distributions and does not reflect the deduction of
taxes that a shareholder would pay on Fund distributions or the sale of Fund shares. Past performance is no guarantee of future
results. Investment return and principal value of an investment will fluctuate, so that shares may be worth more or less than
their original cost when sold. Current performance may be higher or lower than performance quoted. Current month-end performance
may be obtained at www.royceinvest.com. The Funds are closed-end registered investment companies whose respective shares of common
stock may trade at a discount to the net asset value. Shares of each Fund’s common stock are also subject to the market
risk of investing in the underlying portfolio securities held by each Fund. Each Fund is subject to market risk-the possibility
that common stock prices will decline, sometimes sharply and unpredictably, over short or extended periods of time. Such declines
may be caused by various factors, including market, financial, and economic conditions, governmental or central bank actions,
and other factors, such as the recent Covid pandemic, that may not be directly related to the issuer of a security held by a Fund.
This pandemic could adversely affect global market, financial, and economic conditions in ways that cannot necessarily be foreseen.
Investments in securities of micro-cap or small-cap companies may involve considerably more risk than investments in securities
of larger-cap companies. Investments in securities of foreign issuers may be subject to different risks than investments in securities
of U.S. companies, including adverse political, social, economic, or other developments that are unique to a particular country
or region. Therefore, the prices of securities of foreign companies in particular countries or regions may, at times, move in
a different direction than those of securities of U.S. companies. Because such investments are usually denominated in foreign
currencies and such Funds do not intend to hedge their foreign currency exposures, the U.S. dollar value of such investments may
be harmed by declines in the value of foreign currencies in relation to the U.S. dollar. Royce Global Value Trust invests a significant
portion of its assets in foreign companies. A broadly diversified portfolio does not ensure a profit or guarantee against loss.
All indexes referenced are unmanaged and capitalization-weighted. Each index’s returns include net reinvested dividends
and/or interest income. Source: MSCI. MSCI makes no express or implied warranties or representations and shall have no liability
whatsoever with respect to any MSCI data contained herein. The MSCI data may not be further redistributed or used as a basis for
other indexes or any securities or financial products. This report is not approved, endorsed, reviewed or produced by MSCI. None
of the MSCI data is intended to constitute investment advice or a recommendation to make (or refrain from making) any kind of
investment decision and may not be relied on as such. Russell Investment Group is the source and owner of the trademarks, service
marks and copyrights related to the Russell Indexes. Russell® is a trademark of Russell Investment Group. The Russell 2000
Index is an index of domestic small-cap stocks that measures the performance of the 2,000 smallest publicly traded U.S. companies
in the Russell 3000 Index. The Russell Microcap Index includes 1,000 of the smallest securities in the small-cap Russell 2000
Index, along with the next smallest eligible securities as determined by Russell. The MSCI ACWI Small Cap Index is an unmanaged,
capitalization-weighted index of global small-cap stocks. The performance of an index does not represent exactly any particular
investment, as you cannot invest directly in an index. Index returns include net reinvested dividends and/or interest income.
Royce Global Value, Micro-Cap, and Value Trust shares of common stock trade on the NYSE. Royce Fund Services, LLC (“RFS”)
is a member of FINRA and files certain material with FINRA on behalf of each Fund. RFS is not an underwriter or distributor of
any of the Funds.
This page is not part of the 2023 Semiannual Report to Stockholders | 7
MANAGER’S
DISCUSSION (UNAUDITED)
Royce Global Value Trust (RGT)

Chuck Royce
FUND
PERFORMANCE
Royce Global Value Trust (“RGT”) increased 6.6% on an NAV (net asset value) basis and 6.8% on a market price basis
for the year-to-date period ended 6/30/23 versus a gain of 8.0% for its unleveraged benchmark, the MSCI ACWI Small Cap Index,
for the same period.
WHAT
WORKED… AND WHAT DIDN’T
Six of the Fund’s 10 equity sectors made positive contributions to performance in the first half of 2023, led by Industrials,
Information Technology—which each made an outsized contribution—and Consumer Discretionary. The leading detractor
by a wide margin was Communication Services, followed by Energy and Health Care. At the industry level, machinery (Industrials),
electronic equipment, instruments & components (Information Technology), and construction & engineering (Industrials)
made the biggest contributions while the leading detractor by a substantial margin was entertainment (Communication Services),
followed by consumer finance (Financials), and life sciences tools & services (Health Care).
RGT’s top contributor at the position level was Vontier Corporation, which has a mixture of businesses. Gas stations
and convenience stores are the predominant end markets around most of those businesses. The company provides technical equipment
focused on the gas pump and supporting infrastructure, in addition to software offerings that are used at the pump, in the
store, and as the backbone of attached car wash systems. The company also has businesses focused on areas such as automotive
tools and electric vehicle charging. Vontier’s shares suffered throughout 2022 as investors appeared myopically focused
on specific revenue declines that resulted from a major spending boom in gas pump payment terminals, which were driven by
a shift in the relationship between gas stations and credit card companies. We felt this isolated event was masking management’s
considerable capital allocation and execution success in its other businesses. As this issue receded from investor attention,
its stock responded well as the strength of its fundamentals seemed to become clear. APi Group provides safety, specialty,
and industrial services globally, though its focus is on North America. In May, the company announced record 2023 first-quarter
results that included double-digit organic growth and expanded margins, a backlog near record highs, and vibrant activity
across both its safety and specialty segments.
| |
Top
Contributors to Performance |
|
Top
Detractors from Performance |
|
| |
Year-to-Date
Through 6/30/23 (%)1 |
|
Year-to-Date
Through 6/30/23 (%)2 |
|
| |
Vontier
Corporation |
0.78 |
|
Chicken
Soup for the Soul Entertainment Cl. A |
-1.81 |
|
| |
APi
Group |
0.75 |
|
Transaction
Capital |
-0.81 |
|
| |
CIRCOR
International |
0.73 |
|
Biotage |
-0.28 |
|
| |
nLIGHT |
0.56 |
|
Mesa
Laboratories |
-0.28 |
|
| |
Artisan
Partners Asset Management Cl. A |
0.53 |
|
Pason
Systems |
-0.28 |
|
| |
1
Includes dividends |
|
|
2
Net of dividends |
|
|
American streaming media and video-on-demand company, Chicken Soup for the Soul Entertainment, was the Fund’s top detractor
in 2023’s first half. After reporting higher-than-expected losses that pushed its shares down in August of 2022, its
stock price then fell more than 40% in March of 2023 after management announced a capital raise when also reporting net losses
for the fourth quarter of 2022. Shares of South African financial services company, Transaction Capital, went into freefall
in March of 2023 after the firm issued a profit warning and record losses. We held shares in each company at the end of June.
The Fund’s disadvantage versus its benchmark in the first half of 2023 was attributable to stock selection, most impactfully
in the Communication Services sector, as well as in Health Care. Both our lower weighting and stock picks hurt relative performance
in Consumer Discretionary. Conversely, our higher weighting in Industrials, lower exposure to Real Estate, and both stock
selection and our lower weighting in Consumer Staples were all additive versus the MSCI ACWI Small Cap.
CURRENT
POSITIONING AND OUTLOOK
Fears of a global recession receded somewhat in June, led by positive economic data in the U.S. and a pause of interest rate
increases by the Federal Reserve. Economic data out of Europe, as well as geopolitical tensions and a sluggish Chinese economy,
all continued to weigh on the global economic outlook at the end of June. In this context, the near-term forecast for equities
remains as unclear as any we can recall, though over the long term we also still see better weather on the horizon, especially
for global small-cap stocks. Indeed, throughout 2022 and into 2023, we have been struck by the contrast between the more confident—albeit
cautious—outlooks from the many management teams we met with, and the fatalistic headlines seen almost every day. We
believe the Fund’s companies boast generally strong long-term growth prospects, low debt, positive free cash flows,
high returns on invested capital, and/or proven management expertise. Overall, we believe they appear well positioned for
a market that is more focused on fundamentals and/or from a reaccelerating global economy. And while recession remains a reality
or possibility (depending on geography), none of us knows how long it will last or how deep it will go. What we do know is
history shows us that any recession—like any bear market—is ultimately finite and will be followed by a recovery.
It’s worth keeping in mind that history also shows that small caps will likely begin an upward move before many of us
know for sure that the economy is rebounding in earnest. For this and other reasons, we would welcome any degree of increased
scrutiny of company fundamentals.
8
| 2023 Semiannual Report to Stockholders
| PERFORMANCE
AND PORTFOLIO REVIEW (UNAUDITED) |
SYMBOLS
MARKET PRICE RGT
NAV XRGTX |
Performance
Average
Annual Total Return (%) Through 6/30/23
| |
JAN-JUN
20231 |
1-YR |
3-YR |
5-YR |
SINCE INCEPTION (10/17/13) |
| RGT (NAV) |
6.63 |
9.31 |
5.18 |
3.76 |
5.07 |
| 1 Not annualized |
|
|
|
|
|
Market
Price Performance History Since Inception (10/17/13)
Cumulative
Performance of Investment through 6/30/23 1
| |
1-YR |
5-YR |
10-YR |
15-YR |
20-YR |
SINCE
INCEPTION (10/17/13) |
| RGT |
5.1% |
19.7% |
N/A |
N/A |
N/A |
48.8% |

| 1 | Reflects
the cumulative performance experience of a continuous common stockholder who purchased
one share at inception ($8.975 IPO) and reinvested all distributions. |
| 2 | Reflects
the actual month-end market price movement of one share as it has traded on NYSE. |
Morningstar
Style Map™ As of 6/30/23

The
Morningstar Style Map is the Morningstar Style Box™ with the center 75% of fund holdings plotted as the Morningstar
Ownership Zone™. The Morningstar Style Box is designed to reveal a fund’s investment strategy. The Morningstar
Ownership Zone provides detail about a portfolio’s investment style by showing the range of stock sizes and styles. The
Ownership Zone is derived by plotting each stock in the portfolio within the proprietary Morningstar Style Box. Over time, the
shape and location of a fund's ownership zone may vary. See page 62 for additional information.
Value
of $10,000
Invested on 10/17/13 as of 6/30/23 ($)

Top
10 Positions
%
of Net Assets
| Vistry
Group |
2.9 |
| EVI
Industries |
2.5 |
| APi
Group |
2.5 |
| SEI
Investments |
2.1 |
| Transcat |
2.0 |
| IPH |
1.9 |
| Artisan
Partners Asset Management Cl. A |
1.9 |
| ESAB
Corporation |
1.8 |
| AIA
Engineering |
1.8 |
| KBR |
1.7 |
Portfolio
Sector Breakdown
%
of Net Assets
| Industrials |
38.3 |
| Financials |
20.8 |
| Information
Technology |
13.9 |
| Health
Care |
7.7 |
| Consumer
Discretionary |
7.7 |
| Materials |
7.6 |
| Communication
Services |
4.4 |
| Real
Estate |
1.9 |
| Energy |
1.6 |
| Consumer
Staples |
1.4 |
| Outstanding Line of
Credit, Net of Cash and
Cash Equivalents |
-5.3 |
| Calendar
Year Total Returns (%) |
|
| YEAR |
RGT |
| 2022 |
-27.0 |
| 2021 |
16.3 |
| 2020 |
19.7 |
| 2019 |
31.2 |
| 2018 |
-16.1 |
| 2017 |
31.1 |
| 2016 |
11.1 |
| 2015 |
-3.4 |
| 2014 |
-6.2 |
| Portfolio
Country Breakdown 1,2 |
|
| % of Net Assets |
|
| |
|
| United
States |
44.2 |
| Canada |
13.1 |
| United
Kingdom |
11.5 |
| India |
4.8 |
| Sweden |
4.2 |
| Israel |
4.1 |
| Australia |
3.7 |
1
Represents countries that are 3% or more of net assets.
2
Securities are categorized by the country of their headquarters.
| Fund
Net Assets |
$69
million |
| Number
of Holdings |
126 |
| Turnover
Rate |
11% |
| Net
Asset Value |
$10.93 |
| Market
Price |
$9.24 |
| Net
Leverage1 |
5.3% |
| Average
Market Capitalization2 |
$1,796
million |
| Weighted
Average P/E Ratio3,4 |
21.5x |
| Weighted
Average P/B Ratio3 |
2.4x |
| Active
Share5 |
98% |
| 1 | Net
leverage is the percentage, in excess of 100%, of the total value of equity type
investments, divided by net assets. |
| 2 | Geometric
Average. This weighted calculation uses each portfolio holding’s market cap
in a way designed to not skew the effect of very large or small holdings; instead, it
aims to better identify the portfolio’s center, which Royce believes offers a more
accurate measure of average market cap than a simple mean or median. |
| 3 | Harmonic
Average. This weighted calculation evaluates a portfolio as if it were a single stock
and measures it overall. It compares the total market value of the portfolio to the portfolio’s
share in the earnings or book value, as the case may be, of its underlying stocks. |
| 4 | The
Fund’s P/E Ratio calculation excludes companies with zero or negative earnings
(13% of portfolio holdings as of 6/30/23). |
| 5 | Active
Share is the sum of the absolute values of the different weightings of each holding in the Fund versus each holding in the benchmark,
divided by two. |
Important Performance and Risk Information
All performance information reflects past performance, is presented on a total return basis, net of the Fund’s investment
advisory fee, reflects the reinvestment of distributions and does not reflect the deduction of taxes that a shareholder would
pay on Fund distributions or the sale of Fund shares. Past performance is no guarantee of future results. Current performance
may be higher or lower than performance quoted. Returns as of the most recent month-end may be obtained at www.royceinvest.com.
The market price of the Fund’s shares will fluctuate, so that shares may be worth more or less than their original cost
when sold. The Fund invests primarily in securities of small- and mid-cap companies, which may involve considerably more risk
than investments in securities of larger-cap companies. The Fund’s broadly diversified portfolio does not ensure a profit
or guarantee against loss. The Fund generally invests a significant portion of its net assets in foreign securities, which
may involve political, economic, currency and other risks not encountered in U.S. investments. Regarding the “Top Contributors”
and “Top Detractors” tables shown above, the sum of all contributors to, and all detractors from, performance
for all securities in the portfolio would approximate the Fund’s year-to-date performance for 2023.
2023 Semiannual Report to Stockholders | 9
Royce
Global Value Trust
| Schedule of Investments | |
| | |
|
| Common Stocks – 104.7% | |
| | |
|
| | |
| | |
|
| | |
SHARES | | |
VALUE |
| | |
| | |
|
| AUSTRALIA – 3.7% | |
| | | |
| |
| Cochlear 1 | |
| 4,000 | | |
$ | 612,071 |
| IPH 1 | |
| 253,881 | | |
| 1,328,074 |
| Steadfast Group 1 | |
| 53,300 | | |
| 213,619 |
| Technology One 1 | |
| 40,400 | | |
| 423,801 |
| Total (Cost $1,471,791) | |
| | | |
| 2,577,565 |
| | |
| | | |
| |
| BERMUDA – 1.1% | |
| | | |
| |
| Bank of N.T. Butterfield & Son | |
| 21,000 | | |
| 574,560 |
| James River Group Holdings | |
| 11,300 | | |
| 206,338 |
| Total (Cost $1,057,384) | |
| | | |
| 780,898 |
| | |
| | | |
| |
| BRAZIL – 1.5% | |
| | | |
| |
| Odontoprev | |
| 171,600 | | |
| 449,768 |
| TOTVS | |
| 97,885 | | |
| 612,880 |
| Total (Cost $750,794) | |
| | | |
| 1,062,648 |
| | |
| | | |
| |
| CANADA – 13.1% | |
| | | |
| |
| Alamos Gold Cl. A | |
| 94,100 | | |
| 1,120,889 |
| Altus Group | |
| 14,760 | | |
| 489,456 |
| AutoCanada 2 | |
| 38,200 | | |
| 554,221 |
| Canaccord Genuity Group | |
| 52,500 | | |
| 330,911 |
| Centerra Gold | |
| 39,000 | | |
| 233,750 |
| Computer Modelling Group | |
| 91,500 | | |
| 460,004 |
| Descartes Systems Group (The) 2,3 | |
| 8,424 | | |
| 674,847 |
| FirstService Corporation | |
| 1,400 | | |
| 215,726 |
| IMAX Corporation 2 | |
| 21,100 | | |
| 358,489 |
| Major Drilling Group International 2 | |
| 129,300 | | |
| 892,094 |
| Onex Corporation | |
| 8,300 | | |
| 458,434 |
| Pan American Silver 3,4 | |
| 12,700 | | |
| 185,166 |
| Pason Systems | |
| 71,300 | | |
| 618,409 |
| Sprott | |
| 32,642 | | |
| 1,056,815 |
| TELUS Corporation | |
| 16,311 | | |
| 317,417 |
| TMX Group | |
| 47,600 | | |
| 1,071,112 |
| Total (Cost $6,993,946) | |
| | | |
| 9,037,740 |
| | |
| | | |
| |
| DENMARK – 0.2% | |
| | | |
| |
| Chr. Hansen Holding 1 | |
| 1,800 | | |
| 125,197 |
| Total (Cost $155,783) | |
| | | |
| 125,197 |
| | |
| | | |
| |
| FRANCE – 0.8% | |
| | | |
| |
| Esker 1 | |
| 1,800 | | |
| 272,420 |
| Interparfums 1 | |
| 3,753 | | |
| 267,578 |
| Total (Cost $210,145) | |
| | | |
| 539,998 |
| | |
| | | |
| |
| GERMANY – 2.1% | |
| | | |
| |
| Carl Zeiss Meditec 1 | |
| 3,400 | | |
| 367,643 |
| CompuGroup Medical 1 | |
| 3,300 | | |
| 162,332 |
| STRATEC 1 | |
| 3,300 | | |
| 228,428 |
| †Vitesco
Technologies Group 1,2 | |
| 8,100 | | |
| 666,992 |
| Total (Cost $1,144,320) | |
| | | |
| 1,425,395 |
| | |
| | | |
| |
| GREECE – 0.8% | |
| | | |
| |
| Sarantis 1 | |
| 64,500 | | |
| 526,743 |
| Total (Cost $554,222) | |
| | | |
| 526,743 |
| | |
| | | |
| |
| ICELAND – 0.4% | |
| | | |
| |
| Ossur 1,2 | |
| 51,000 | | |
| 240,330 |
| Total (Cost $321,244) | |
| | | |
| 240,330 |
| | |
| | | |
| |
| INDIA – 4.8% | |
| | | |
| |
| AIA
Engineering 1 | |
| 31,600 | | |
| 1,234,763 |
| Dish TV India 1,2 | |
| 2,577,000 | | |
| 460,184 |
| †Krsnaa
Diagnostics 1 | |
| 70,000 | | |
| 502,462 |
| Tarsons Products 1,2 | |
| 49,000 | | |
| 359,679 |
| WNS Holdings ADR 2,3,4 | |
| 10,500 | | |
| 774,060 |
| Total (Cost $2,751,151) | |
| | | |
| 3,331,148 |
| | |
| | | |
| |
| INDONESIA – 0.3% | |
| | | |
| |
| Ace Hardware Indonesia 1 | |
| 4,000,000 | | |
| 180,777 |
| Total (Cost $169,716) | |
| | | |
| 180,777 |
| | |
| | | |
| |
| ISRAEL – 4.1% | |
| | | |
| |
| †Cellebrite
DI 2 | |
| 46,600 | | |
| 335,520 |
| Global-e Online 2 | |
| 5,200 | | |
| 212,888 |
| Nova 2,3,4 | |
| 5,700 | | |
| 668,610 |
| Phoenix Holdings 1 | |
| 48,500 | | |
| 488,458 |
| Tel
Aviv Stock Exchange 1,2 | |
| 222,300 | | |
| 1,147,678 |
| Total (Cost $1,973,383) | |
| | | |
| 2,853,154 |
| | |
| | | |
| |
| ITALY – 1.6% | |
| | | |
| |
| Carel
Industries 1 | |
| 35,800 | | |
| 1,079,693 |
| Total (Cost $434,504) | |
| | | |
| 1,079,693 |
| | |
| | | |
| |
| JAPAN – 2.9% | |
| | | |
| |
| As One 1 | |
| 5,600 | | |
| 222,041 |
| Benefit One 1 | |
| 13,700 | | |
| 140,410 |
| Fukui Computer Holdings 1 | |
| 10,800 | | |
| 209,882 |
| NSD 1 | |
| 12,200 | | |
| 245,553 |
| Square Enix Holdings 1 | |
| 6,800 | | |
| 316,625 |
| TechnoPro Holdings 1 | |
| 7,200 | | |
| 156,154 |
| TKC Corporation 1 | |
| 25,500 | | |
| 690,178 |
| Total (Cost $1,611,241) | |
| | | |
| 1,980,843 |
| | |
| | | |
| |
| MEXICO – 0.2% | |
| | | |
| |
| Becle | |
| 63,000 | | |
| 154,362 |
| Total (Cost $100,233) | |
| | | |
| 154,362 |
| | |
| | | |
| |
| NETHERLANDS – 1.2% | |
| | | |
| |
| IMCD 1 | |
| 5,500 | | |
| 791,117 |
| Total (Cost $387,492) | |
| | | |
| 791,117 |
| | |
| | | |
| |
| NEW ZEALAND – 0.4% | |
| | | |
| |
| Fisher & Paykel Healthcare 1 | |
| 17,000 | | |
| 255,493 |
| Total (Cost $101,973) | |
| | | |
| 255,493 |
| | |
| | | |
| |
| NORWAY – 1.8% | |
| | | |
| |
| Protector
Forsikring 1 | |
| 70,000 | | |
| 1,077,334 |
| Tomra Systems 1 | |
| 12,000 | | |
| 192,846 |
| Total (Cost $778,544) | |
| | | |
| 1,270,180 |
| | |
| | | |
| |
| SINGAPORE – 0.3% | |
| | | |
| |
| Midas Holdings 2,5 | |
| 400,000 | | |
| 0 |
| XP Power 1 | |
| 8,660 | | |
| 216,936 |
| Total (Cost $241,148) | |
| | | |
| 216,936 |
| | |
| | | |
| |
| SOUTH AFRICA – 2.4% | |
| | | |
| |
| CA Sales Holdings 1 | |
| 147,597 | | |
| 56,085 |
| Curro Holdings 1 | |
| 258,594 | | |
| 118,982 |
| KAL Group 1 | |
| 17,606 | | |
| 35,322 |
| PSG Konsult 1 | |
| 550,976 | | |
| 386,989 |
| Stadio Holdings 1 | |
| 3,686,928 | | |
| 959,153 |
| Transaction Capital 1,2 | |
| 344,100 | | |
| 106,795 |
| Total (Cost $1,680,804) | |
| | | |
| 1,663,326 |
| 10 | 2023 Semiannual Report
to Stockholders |
THE ACCOMPANYING NOTES ARE
AN INTEGRAL PART OF THESE FINANCIAL STATEMENTS |
June
30, 2023 (unaudited)
Schedule
of Investments (continued)
| | |
SHARES | | |
VALUE | |
| SWEDEN – 4.2% | |
| | | |
| | |
| Biotage 1 | |
| 37,900 | | |
$ | 472,295 | |
| Bravida Holding 1 | |
| 68,900 | | |
| 662,152 | |
| Karnov Group 1,2 | |
| 145,381 | | |
| 663,107 | |
| OEM
International Cl. B 1 | |
| 118,850 | | |
| 1,080,562 | |
| Total (Cost $2,309,190) | |
| | | |
| 2,878,116 | |
| | |
| | | |
| | |
| SWITZERLAND – 1.7% | |
| | | |
| | |
| Kardex Holding 1 | |
| 2,400 | | |
| 539,734 | |
| LEM Holding 1 | |
| 150 | | |
| 375,405 | |
| VZ Holding 1 | |
| 2,900 | | |
| 267,226 | |
| Total (Cost $482,877) | |
| | | |
| 1,182,365 | |
| | |
| | | |
| | |
| UNITED KINGDOM – 11.5% | |
| | | |
| | |
| CentralNic Group 1 | |
| 137,427 | | |
| 202,126 | |
| Diploma 1 | |
| 8,200 | | |
| 311,357 | |
| DiscoverIE Group 1 | |
| 60,800 | | |
| 648,615 | |
| FDM Group Holdings 1 | |
| 46,800 | | |
| 333,847 | |
| Genuit Group 1 | |
| 54,600 | | |
| 203,711 | |
| Halma 1 | |
| 18,700 | | |
| 541,299 | |
| †Judges
Scientific 1 | |
| 2,600 | | |
| 301,696 | |
| Keystone Law Group 1 | |
| 95,940 | | |
| 492,134 | |
| Learning Technologies Group 1 | |
| 342,800 | | |
| 361,344 | |
| Marlowe 1,2 | |
| 112,600 | | |
| 800,929 | |
| Mortgage Advice Bureau Holdings 1 | |
| 36,100 | | |
| 271,339 | |
| Restore 1 | |
| 166,254 | | |
| 494,262 | |
| RWS Holdings 1 | |
| 45,100 | | |
| 135,140 | |
| SThree 1 | |
| 146,600 | | |
| 637,403 | |
| Vistry
Group 1 | |
| 236,480 | | |
| 1,990,101 | |
| YouGov 1 | |
| 18,600 | | |
| 236,451 | |
| Total (Cost $7,477,641) | |
| | | |
| 7,961,754 | |
| | |
| | | |
| | |
| UNITED STATES – 43.6% | |
| | | |
| | |
| ACV Auctions Cl. A 2 | |
| 39,200 | | |
| 676,984 | |
| Air Lease Cl. A 3 | |
| 21,161 | | |
| 885,588 | |
| APi
Group 2,3 | |
| 63,900 | | |
| 1,741,914 | |
| Arcosa | |
| 14,060 | | |
| 1,065,326 | |
| Artisan Partners Asset Management Cl. A | |
| 33,200 | | |
| 1,305,092 | |
| Blue Owl Capital Cl. A | |
| 55,280 | | |
| 644,012 | |
| Chicken Soup for the Soul Entertainment Cl. A 2 | |
| 250,000 | | |
| 296,250 | |
| Diodes 2,3 | |
| 7,000 | | |
| 647,430 | |
| Element Solutions 3 | |
| 36,400 | | |
| 698,880 | |
| Enovis Corporation 2 | |
| 11,966 | | |
| 767,260 | |
| ESAB Corporation | |
| 18,666 | | |
| 1,242,036 | |
| EVI
Industries 2,3 | |
| 79,273 | | |
| 1,744,006 | |
| FormFactor 2,3 | |
| 20,000 | | |
| 684,400 | |
| Forrester Research 2,3 | |
| 7,500 | | |
| 218,175 | |
| †FTAI Aviation | |
| 17,800 | | |
| 563,548 | |
| GCM Grosvenor Cl. A | |
| 119,626 | | |
| 901,980 | |
| Griffon Corporation 3,4 | |
| 22,500 | | |
| 906,750 | |
| Hagerty Cl. A 2 | |
| 39,300 | | |
| 367,848 | |
| Hayward Holdings 2 | |
| 58,500 | | |
| 751,725 | |
| Innospec 3 | |
| 6,228 | | |
| 625,540 | |
| John Bean Technologies | |
| 750 | | |
| 90,975 | |
| Kadant 3 | |
| 2,664 | | |
| 591,674 | |
| KBR 3 | |
| 18,240 | | |
| 1,186,694 | |
| Kennedy-Wilson Holdings | |
| 35,700 | | |
| 582,981 | |
| †Laureate Education | |
| 50,000 | | |
| 604,500 | |
| Lindsay Corporation 3 | |
| 3,519 | | |
| 419,958 | |
| MarketWise Cl. A | |
| 123,100 | | |
| 246,200 | |
| Mesa Laboratories | |
| 5,512 | | |
| 708,292 | |
| Morningstar 3 | |
| 5,358 | | |
| 1,050,543 | |
| NewtekOne | |
| 45,300 | | |
| 720,270 | |
| nLIGHT 2 | |
| 73,100 | | |
| 1,127,202 | |
| PAR Technology 2,3 | |
| 24,241 | | |
| 798,256 | |
| Royal Gold | |
| 7,900 | | |
| 906,762 | |
| SEI
Investments 3 | |
| 24,050 | | |
| 1,433,861 | |
| Transcat 2,3 | |
| 16,377 | | |
| 1,397,122 | |
| Vontier
Corporation 3 | |
| 33,210 | | |
| 1,069,694 | |
| Ziff Davis 2 | |
| 5,950 | | |
| 416,857 | |
| Total (Cost $26,043,892) | |
| | | |
| 30,086,585 | |
| | |
| | | |
| | |
| TOTAL COMMON STOCKS | |
| | | |
| | |
| (Cost $59,203,418) | |
| | | |
| 72,202,363 | |
| | |
| | | |
| | |
| DIVERSIFIED INVESTMENT COMPANIES – 0.6% | |
| | | |
| | |
| | |
| | | |
| | |
| UNITED STATES – 0.6% | |
| | | |
| | |
| †VanEck
Junior Gold Miners ETF | |
| 12,500 | | |
| 445,750 | |
| (Cost $547,814) | |
| | | |
| 445,750 | |
| THE ACCOMPANYING NOTES ARE AN INTEGRAL PART
OF THESE FINANCIAL STATEMENTS |
2023 Semiannual Report to Stockholders | 11 |
| Royce Global Value Trust |
June 30, 2023 (unaudited) |
Schedule
of Investments (continued)
| | |
VALUE |
| | |
|
| REPURCHASE
AGREEMENT– 0.6% | |
|
Fixed Income Clearing Corporation, 3.00% dated 6/30/23, due 7/3/23, maturity value
$378,462 (collateralized by obligations of U.S. Government Agencies,
4.25% due 11/15/40, valued at $385,994) | |
|
| (Cost
$378,367) | |
$ | 378,367 |
| | |
| |
| TOTAL
INVESTMENTS – 105.9% | |
| |
| (Cost
$60,129,599) | |
| 73,026,480 |
| | |
| |
| LIABILITIES
LESS CASH AND OTHER ASSETS – (5.9)% | |
| (4,046,635) |
| | |
| |
| NET
ASSETS – 100.0% | |
$ | 68,979,845 |
ADR
– American Depository Receipt
| 1 | These
securities are defined as Level 2 securities due to fair value being based on quoted prices for similar securities and/or due
to the application of fair value factors. See Notes to Financial Statements. |
| 3 | All
or a portion of these securities were pledged as collateral in connection with the Fund's revolving credit agreement as of June
30, 2023. Total market value of pledged securities as of June 30, 2023, was $8,404,625. |
| 4 | As
of June 30, 2023, a portion of these securities, in the aggregate amount of $2,230,462, were rehypothecated by BNP Paribas Prime
Brokerage International, Limited in connection with the Fund's revolving credit agreement. See Notes to Financial Statements. |
| 5 | A
security for which market quotations are not readily available represents 0.0% of net assets. This security has been valued at
its fair value under procedures approved by the Fund's Board of Directors. This security is defined as a Level 3 security due
to the use of significant unobservable inputs in the determination of fair value. See Notes to Financial Statements. |
Securities
are categorized by the country of their headquarters.
Bold
indicates the Fund’s 20 largest equity holdings in terms of June 30, 2023, market value.
TAX
INFORMATION: The cost of total investments for Federal income tax purposes was $60,190,793. As of June 30, 2023, net unrealized
appreciation for all securities was $12,835,687 consisting of aggregate gross unrealized appreciation of $19,046,997 and aggregate
gross unrealized depreciation of $6,211,310. The primary cause of the difference between book and tax basis cost is the timing
of the recognition of losses on securities sold.
| 12 | 2023 Semiannual Report
to Stockholders |
THE ACCOMPANYING NOTES ARE
AN INTEGRAL PART OF THESE FINANCIAL STATEMENTS |
| Royce Global Value Trust |
June 30, 2023 (unaudited) |
Statement
of Assets and Liabilities
| ASSETS: | |
|
| Investments at value | |
$ | 72,648,113 | |
| Repurchase agreements (at cost
and value) | |
| 378,367 | |
| Foreign currency (cost $16,706) | |
| 16,754 | |
| Receivable for dividends and
interest | |
| 158,625 | |
| Prepaid expenses and other
assets | |
| 14,820 | |
| Total Assets | |
| 73,216,679 | |
LIABILITIES: Revolving
credit agreement | |
| 4,000,000 | |
| Payable for investment advisory
fee | |
| 56,386 | |
| Payable for directors’ fees | |
| 7,299 | |
| Payable for interest expense | |
| 20,876 | |
| Accrued expenses | |
| 109,220 | |
| Deferred capital gains tax | |
| 43,053 | |
| Total Liabilities | |
| 4,236,834 | |
| Net Assets | |
$ | 68,979,845 | |
ANALYSIS
OF NET ASSETS: Paid-in
capital - $0.001 par value per share; 6,310,318 shares outstanding (150,000,000 shares authorized) | |
$ | 55,671,269 | |
| Total distributable earnings
(loss) | |
| 13,308,576 | |
| Net Assets (net asset value
per share - $10.93) | |
$ | 68,979,845 | |
| Investments
at identified cost | |
$ | 59,751,232 | |
| THE ACCOMPANYING NOTES ARE AN INTEGRAL PART
OF THESE FINANCIAL STATEMENTS |
2023
Semiannual Report to Stockholders | 13 |
| Royce Global Value Trust |
Six
Months Ended June 30, 2023 (unaudited) |
| Statement of Operations | |
|
| | |
|
| INVESTMENT INCOME: | |
| | |
INCOME: Dividends | |
$ | 791,395 | |
| Foreign withholding tax | |
| (50,729 | ) |
| Interest | |
| 7,123 | |
| Rehypothecation income | |
| 23 | |
| Total income | |
| 747,812 | |
| EXPENSES: | |
| | |
| Investment advisory fees | |
| 337,108 | |
| Interest expense | |
| 119,419 | |
| Stockholder reports | |
| 32,662 | |
| Custody and transfer agent
fees | |
| 30,299 | |
| Administrative and office facilities | |
| 22,420 | |
| Professional fees | |
| 19,447 | |
| Directors’ fees | |
| 13,621 | |
| Other expenses | |
| 13,486 | |
| Total expenses | |
| 588,462 | |
| Net investment
income (loss) | |
| 159,350 | |
| REALIZED AND UNREALIZED GAIN
(LOSS) ON INVESTMENTS AND FOREIGN CURRENCY: | |
| | |
| NET REALIZED GAIN (LOSS): | |
| | |
| Investments | |
| 944,248 | |
| Foreign currency transactions | |
| 744 | |
| NET CHANGE IN UNREALIZED APPRECIATION
(DEPRECIATION): | |
| | |
| Investments | |
| 3,209,529 | |
| Other assets and liabilities
denominated in foreign currency | |
| (26,292 | ) |
| Net realized
and unrealized gain (loss) on investments and foreign currency | |
| 4,128,229 | |
| NET INCREASE
(DECREASE) IN NET ASSETS FROM INVESTMENT OPERATIONS | |
$ | 4,287,579 | |
| 14
| 2023 Semiannual Report to Stockholders |
THE ACCOMPANYING NOTES ARE
AN INTEGRAL PART OF THESE FINANCIAL STATEMENTS |
| Royce
Global Value Trust |
| Statement
of Changes in Net Assets |
|
|
| | |
SIX
MONTHS ENDED 6/30/23 (UNAUDITED) | | |
YEAR
ENDED 12/31/22 | |
INVESTMENT
OPERATIONS: Net
investment income (loss) | |
$ | 159,350 | | |
$ | 550,924 | |
| Net
realized gain (loss) on investments and foreign currency | |
| 944,992 | | |
| 47,904 | |
| Net
change in unrealized appreciation (depreciation) on investments and foreign currency | |
| 3,183,237 | | |
| (24,860,232 | ) |
| Net
increase (decrease) in net assets from investment operations | |
| 4,287,579 | | |
| (24,261,404 | ) |
DISTRIBUTIONS: Total
distributable earnings | |
| – | | |
| (793,689 | ) |
| Return
of capital | |
| – | | |
| (21,014 | ) |
| Total
distributions | |
| – | | |
| (814,703 | ) |
CAPITAL
STOCK TRANSACTIONS: Reinvestment
of distributions | |
| – | | |
| 374,330 | |
| Total
capital stock transactions | |
| – | | |
| 374,330 | |
| Net
Increase (Decrease) In Net Assets | |
| 4,287,579 | | |
| (24,701,777 | ) |
| NET
ASSETS: | |
| | | |
| | |
| Beginning
of period | |
| 64,692,266 | | |
| 89,394,043 | |
| End
of period | |
$ | 68,979,845 | | |
$ | 64,692,266 | |
| THE ACCOMPANYING NOTES ARE AN INTEGRAL PART
OF THESE FINANCIAL STATEMENTS |
2023
Semiannual Report to Stockholders | 15 |
| Royce Global Value Trust |
Six
Months Ended June 30, 2023 (unaudited) |
Statement
of Cash Flows
| |
|
CASH
FLOWS FROM OPERATING ACTIVITIES: Net
increase (decrease) in net assets from investment operations | |
$ | 4,287,579 | |
| Adjustments
to reconcile net increase (decrease) in net assets from investment operations to net cash provided by operating activities: | |
| | |
| Purchases
of long-term investments | |
| (7,982,239 | ) |
| Proceeds
from sales and maturities of long-term investments | |
| 7,489,774 | |
| Net
purchases, sales and maturities of short-term investments | |
| 347,130 | |
| Net
(increase) decrease in dividends and interest receivable and other assets | |
| 6,769 | |
| Net
increase (decrease) in interest expense payable, accrued expenses and other liabilities | |
| 16,144 | |
| Net
change in unrealized appreciation (depreciation) on investments | |
| (3,209,529 | ) |
| Net
realized gain (loss) on investments | |
| (944,248 | ) |
| Net
cash provided by operating activities | |
| 11,380 | |
| CASH
FLOWS FROM FINANCING ACTIVITIES: | |
| | |
| Distributions | |
| – | |
| Net
cash used for financing activities | |
| – | |
| INCREASE
(DECREASE) IN CASH: | |
| 11,380 | |
| Cash
and foreign currency at beginning of period | |
| 5,374 | |
| Cash
and foreign currency at end of period | |
$ | 16,754 | |
Supplemental
disclosure of cash flow information:
For
the six months ended June 30, 2023, the Fund paid $116,723 in interest expense.
| 16
| 2023 Semiannual Report to Stockholders |
THE ACCOMPANYING NOTES ARE
AN INTEGRAL PART OF THESE FINANCIAL STATEMENTS |
Royce Global
Value Trust
Financial
Highlights
This
table is presented to show selected data for a share of Common Stock outstanding throughout each period, and to assist stockholders
in evaluating the Fund’s performance for the periods presented.
| | |
SIX MONTHS | YEARS ENDED |
| | |
ENDED 6/30/23 | |
|
| | |
(UNAUDITED) | |
12/31/22 | |
12/31/21 | |
12/31/20 | |
12/31/19 | |
12/31/18 |
| Net
Asset Value, Beginning of Period | |
$ |
10.25 | | |
$ |
14.26 | | |
$ |
14.95 | | |
$ |
13.60 | | |
$ |
10.42 | | |
$ |
12.48 | |
| INVESTMENT
OPERATIONS: | |
| | |
| | |
| | |
| | |
| | |
| |
| Net
investment income (loss) | |
| 0.03 | | |
| 0.09 | | |
| (0.01 | ) | |
| (0.05 | ) | |
| 0.06 | | |
| 0.04 | |
| Net realized
and unrealized gain (loss) on investments and foreign currency | |
| 0.65 | | |
| (3.96 | ) | |
| 2.19 | | |
| 2.63 | | |
| 3.18 | | |
| (2.06 | ) |
| Net
increase (decrease) in net assets from investment operations | |
| 0.68 | | |
| (3.87 | ) | |
| 2.18 | | |
| 2.58 | | |
| 3.24 | | |
| (2.02 | ) |
| DISTRIBUTIONS: | |
| | | |
| | | |
| | | |
| | | |
| | | |
| | |
| Net
investment income | |
| – | | |
| (0.10 | ) | |
| (0.09 | ) | |
| – | | |
| (0.06 | ) | |
| (0.04 | ) |
| Net
realized gain on investments and foreign currency | |
| – | | |
| (0.03 | ) | |
| (2.66 | ) | |
| (1.19 | ) | |
| – | | |
| – | |
| Return of capital | |
| – | | |
| (0.00 | ) | |
| – | | |
| – | | |
| – | | |
| – | |
| Total
distributions | |
| – | | |
| (0.13 | ) | |
| (2.75 | ) | |
| (1.19 | ) | |
| (0.06 | ) | |
| (0.04 | ) |
| CAPITAL
STOCK TRANSACTIONS: | |
| | | |
| | | |
| | | |
| | | |
| | | |
| | |
| Effect
of reinvestment of distributions by Common Stockholders | |
| – | | |
| (0.01 | ) | |
| (0.12 | ) | |
| (0.04 | ) | |
| (0.00 | ) | |
| (0.00 | ) |
| Total
capital stock transactions | |
| – | | |
| (0.01 | ) | |
| (0.12 | ) | |
| (0.04 | ) | |
| (0.00 | ) | |
| (0.00 | ) |
| Net
Asset Value, End of Period | |
$ | 10.93 | | |
$ | 10.25 | | |
$ | 14.26 | | |
$ | 14.95 | | |
$ | 13.60 | | |
$ | 10.42 | |
| Market
Value, End of Period | |
$ | 9.24 | | |
$ | 8.65 | | |
$ | 13.12 | | |
$ | 13.36 | | |
$ | 11.69 | | |
$ | 8.88 | |
| TOTAL
RETURN:1 | |
| | | |
| | | |
| | | |
| | | |
| | | |
| | |
| Net
Asset Value | |
| 6.63 | %2 | |
| (27.04 | )% | |
| 16.34 | % | |
| 19.67 | % | |
| 31.20 | % | |
| (16.11 | )% |
| Market
Value | |
| 6.82 | %2 | |
| (33.08 | )% | |
| 19.77 | % | |
| 24.42 | % | |
| 32.33 | % | |
| (17.50 | )% |
| RATIOS
BASED ON AVERAGE NET ASSETS: | |
| | | |
| | | |
| | | |
| | | |
| | | |
| | |
| Investment
advisory fee expense | |
| 1.00 | %3 | |
| 1.00 | % | |
| 1.00 | % | |
| 1.00 | % | |
| 1.00 | % | |
| 1.25 | % |
| Other
operating expenses | |
| 0.75 | %3 | |
| 0.54 | % | |
| 0.39 | % | |
| 0.34 | % | |
| 0.50 | % | |
| 0.49 | % |
| Total
expenses (net) | |
| 1.75 | %3 | |
| 1.54 | % | |
| 1.39 | % | |
| 1.34 | % | |
| 1.50 | % | |
| 1.74 | % |
| Expenses
excluding interest expense | |
| 1.39 | %3 | |
| 1.38 | % | |
| 1.33 | % | |
| 1.24 | % | |
| 1.29 | % | |
| 1.53 | % |
| Expenses
prior to balance credits | |
| 1.75 | %3 | |
| 1.54 | % | |
| 1.39 | % | |
| 1.34 | % | |
| 1.50 | % | |
| 1.74 | % |
| Net
investment income (loss) | |
| 0.47 | %3 | |
| 0.79 | % | |
| (0.13 | )% | |
| (0.15 | )% | |
| 0.46 | % | |
| 0.30 | % |
| SUPPLEMENTAL
DATA: | |
| | | |
| | | |
| | | |
| | | |
| | | |
| | |
| Net
Assets, End of Period (in thousands) | |
$ | 68,980 | | |
$ | 64,692 | | |
$ | 89,394 | | |
$ | 83,752 | | |
$ | 142,810 | | |
$ | 109,254 | |
| Portfolio
Turnover Rate | |
| 11 | % | |
| 24 | % | |
| 52 | % | |
| 54 | % | |
| 48 | % | |
| 57 | % |
| REVOLVING
CREDIT AGREEMENT: | |
| | | |
| | | |
| | | |
| | | |
| | | |
| | |
| Asset
coverage | |
| 1824 | % | |
| 1717 | % | |
| 2335 | % | |
| 1147 | % | |
| 1885 | % | |
| 1466 | % |
| Asset
coverage per $1,000 | |
$ | 18,245 | | |
$ | 17,173 | | |
$ | 23,349 | | |
$ | 11,469 | | |
$ | 18,851 | | |
$ | 14,657 | |
| 1 | The
Market Value Total Return is calculated assuming a purchase of Common Stock on the opening of the first business day and a sale
on the closing of the last business day of each period. Dividends and distributions are assumed for the purposes of this calculation
to be reinvested at prices obtained under the Fund’s Distribution Reinvestment and Cash Purchase Plan. Net Asset Value Total
Return is calculated on the same basis, except that the Fund’s net asset value is used on the purchase, sale and dividend
reinvestment dates instead of market value. |
| THE ACCOMPANYING NOTES ARE AN INTEGRAL PART
OF THESE FINANCIAL STATEMENTS |
2023
Semiannual Report to Stockholders | 17 |
Royce
Global Value Trust
Notes
to Financial Statements (unaudited)
Summary
of Significant Accounting Policies
Royce
Global Value Trust, Inc. (the “Fund”), is a diversified closed-end investment company that was incorporated under
the laws of the State of Maryland on February 14, 2011. The Fund commenced operations on October 18, 2013.
The
preparation of financial statements in conformity with accounting principles generally accepted in the United States of America
requires management to make estimates and assumptions that affect the reported amounts of assets and liabilities and the disclosure
of contingent assets and liabilities at the date of the financial statements and the reported amounts of income and expenses during
the reporting period. Actual results could differ from those estimates.
The
Fund is an investment company and accordingly follows the investment company accounting and reporting guidance of the Financial
Accounting Standards Board (FASB) Accounting Standard Codification Topic 946 “Financial Services-Investment Companies.”
Royce
& Associates, LP, the Fund’s investment adviser, is a majority-owned subsidiary of Franklin Resources, Inc. and primarily
conducts business using the name Royce Investment Partners (“Royce”). As of June 30, 2023, officers and employees
of Royce, Fund directors, the Royce retirement plans and other affiliates owned more than 19% of the Fund.
VALUATION
OF INVESTMENTS:
Portfolio
securities held by the Fund are valued as of the close of trading on the New York Stock Exchange (“NYSE”)
(generally 4:00 p.m. Eastern time) on the valuation date. Investments in money market funds are valued at net asset value per
share. Values for non-U.S. dollar denominated equity securities are converted to U.S. dollars daily based upon prevailing
foreign currency exchange rates as quoted by a major bank.
Equity
securities that are listed on an exchange or Nasdaq, or traded on OTC Market Group Inc.’s OTC Link ATS or other alternative
trading system, are valued: (i) on the basis of their last reported sales prices or official closing prices, as applicable, on
a valuation date; or (ii) at their highest reported bid prices in the event such equity
securities did not trade on a valuation date. Such inputs are generally referred to as “Level 1” inputs because they
represent reliable quoted prices in active markets for identical securities.
If
the value of a portfolio security held by the Fund cannot be determined solely by reference to Level 1 inputs, such portfolio
security will be “fair valued.” The Fund’s Board of Directors has designated Royce as valuation designee to
perform fair value determinations for such portfolio securities in accordance with Rule 2a-5 under the Investment Company Act
of 1940 (“Rule 2a-5”). Pursuant to Rule 2a-5, fair values are determined in accordance with policies and procedures
approved by the Fund's Board of Directors and policies and procedures adopted by Royce in its capacity as valuation designee for
the Fund. Fair valued securities are reported as either “Level 2” or “Level 3” securities.
As
a general principle, the fair value of a security is the amount which the Fund might reasonably expect to receive for the security
upon its current sale. However, in light of the judgment involved in fair valuations, no assurance can be given that a fair value
assigned to a particular portfolio security will be the amount which the Fund might be able to receive upon its current sale.
When a fair value pricing methodology is used, the fair value prices used by the Fund for such securities will likely differ from
the quoted or published prices for the same securities.
Level
2 inputs are other significant observable inputs (e.g., dealer bid side quotes and quoted prices for securities with comparable
characteristics). Examples of situations in which Level 2 inputs are used to fair value portfolio securities held by the Fund
on a particular valuation date include:
| ● | Over-the-counter
equity securities other than those traded on OTC Market Group Inc.’s OTC Link ATS
or other alternative trading system (collectively referred to herein as “Other
OTC Equity Securities”) are fair valued at their highest bid price when Royce receives
at least two bid side quotes from dealers who make markets in such securities; |
| ● | Certain
bonds and other fixed income securities may be fair valued by reference to other securities
with comparable ratings, interest rates, and maturities in accordance with valuation
methodologies maintained by certain independent pricing services; and |
| ● | The
Fund uses an independent pricing service to fair value certain non-U.S. equity securities
when U.S. market volatility exceeds a certain threshold. This pricing service uses proprietary
correlations it has developed between the movement of prices of non-U.S. equity securities
and indices of U.S.-traded securities, futures contracts, and other indications to estimate
the fair value of such non-U.S. securities. |
Level
3 inputs are significant unobservable inputs. Examples of Level 3 inputs include (without limitation) the last trade price for
a security before trading was suspended or terminated; discounts to last trade price for lack of marketability or otherwise; market
price information regarding other securities; information received from the issuer and/or published documents, including SEC filings
and financial statements; and other publicly available information. Pursuant to the above-referenced policies and procedures,
Royce may use various techniques in making fair value determinations based upon Level 3 inputs, which techniques may include (without
limitation): (i) workout valuation methods (e.g., earnings multiples, discounted cash flows, liquidation values, derivations of
book value, firm or probable
| 18
| 2023 Semiannual Report to Stockholders |
|
Royce
Global Value Trust
Notes
to Financial Statements (unaudited) (continued)
VALUATION
OF INVESTMENTS (continued):
offers
from qualified buyers for the issuer’s ongoing business, etc.); (ii) discount or premium from market, or compilation of
other observable market information, for other similar freely traded securities; (iii) conversion from the readily available market
price of a security into which an affected security is convertible or exchangeable; and (iv) pricing models or other formulas.
In the case of restricted securities, fair value determinations generally start with the inherent or intrinsic worth of the relevant
security, without regard to the restrictive feature, and are reduced for any diminution in value resulting from the restrictive
feature. Due to the inherent uncertainty of such valuations, these fair values may differ significantly from the values that would
have been used had an active market existed.
A security that is valued by reference to Level 1 or Level 2 inputs may drop to Level 3 on a particular valuation date for several reasons, including if:
| ● | an
equity security that is listed on an exchange or Nasdaq, or traded on OTC Market Group
Inc.’s OTC Link ATS or other alternative trading system, has not traded and there
are no bids; |
| ● | Royce
does not receive at least two bid side quotes for an Other OTC Equity Security; |
| ● | the
independent pricing services are unable to supply fair value prices; or |
| ● | the
Level 1 or Level 2 inputs become otherwise unreliable for any reason (e.g., a significant
event occurs after the close of trading for a security but prior to the time the Fund
prices its shares). |
The
table below shows the aggregate value of the various Level 1, Level 2, and Level 3 securities held by the Fund as of June 30,
2023. Any Level 2 or Level 3 securities held by the Fund are noted in its Schedule of Investments. The inputs or methodology used
for valuing securities are not necessarily an indication of the risk associated with owning those securities.
| |
LEVEL
1 |
LEVEL
2 |
LEVEL
3 |
TOTAL |
| Common
Stocks |
$43,113,312 |
$29,089,051 |
$0 |
$72,202,363 |
| Diversified
Investment Companies |
445,750 |
- |
- |
445,750 |
| Repurchase
Agreement |
- |
378,367 |
- |
378,367 |
Level
3 Reconciliation:
| |
UNREALIZED
GAIN (LOSS) 1 |
BALANCE
AS OF 6/30/23 |
| |
BALANCE
AS OF
12/31/22 |
PURCHASES |
SALES |
REALIZED
GAIN (LOSS) 1 |
CURRENTLY
HELD
SECURITIES |
SECURITIES
NO
LONGER
HELD |
| Common
Stocks |
$
0 |
$
– |
$
– |
$
– |
$
0 |
$
– |
$
0 |
1
The net change in unrealized appreciation (depreciation) is included in the accompanying Statement of Operations. Change in unrealized
appreciation (depreciation) includes net unrealized appreciation (depreciation) resulting from changes in investment values during the
reporting period and the reversal of previously recorded unrealized appreciation (depreciation) when gains or losses are realized. Net
realized gain (loss) from investments and foreign currency transactions is included in the accompanying Statement of Operations.
REPURCHASE
AGREEMENTS:
The
Fund may enter into repurchase agreements with institutions that the Fund’s investment adviser has determined are creditworthy.
The Fund restricts repurchase agreements to maturities of no more than seven days. Securities pledged as collateral for repurchase
agreements, which are held until maturity of the repurchase agreements, are marked-to-market daily and maintained at a value at
least equal to the principal amount of the repurchase agreement (including accrued interest). Repurchase agreements could involve
certain risks in the event of default or insolvency of the counter-party, including possible delays or restrictions upon the ability
of the Fund to dispose of its underlying securities. The remaining contractual maturity of the repurchase agreement held by the
Fund as of June 30, 2023, is next business day and continuous.
FOREIGN
CURRENCY:
Net
realized foreign exchange gains or losses arise from sales and maturities of short-term securities, sales of foreign currencies,
expiration of currency forward contracts, currency gains or losses realized between the trade and settlement dates on securities
transactions, and the difference between the amounts of dividends, interest, and foreign withholding taxes recorded on the Fund's
books and the U.S. dollar equivalent of the amounts actually received or paid. Net unrealized foreign exchange gains and losses
arise from changes in the value of assets and liabilities, other than investments in securities at the end of the reporting period,
as a result of changes in foreign currency exchange rates.
The
Fund does not isolate that portion of the results of operations resulting from fluctuations in foreign exchange rates on investments
from the fluctuations arising from changes in market prices of securities held. Such fluctuations are included with the net realized
and unrealized gain or loss on investments.
The
Fund invests a significant portion of its assets in foreign companies that may be subject to different risks than investments
in securities of U.S. companies, including adverse political, social, economic, or other developments that are unique to a particular
country or region. Therefore, the prices of securities of foreign companies in particular countries or regions may, at times,
move in a different direction than those of securities of U.S. companies. Because such investments in securities of foreign companies
are usually denominated in foreign currencies and the Fund does not intend to hedge its foreign currency exposure, the U.S. dollar
value of such investments may be harmed by declines in the value of foreign currencies in relation to the U.S. dollar.
2023
Semiannual Report to Stockholders |
19
Royce
Global Value Trust
Notes to Financial Statements
(unaudited) (continued)
DISTRIBUTIONS
AND TAXES:
As
a qualified regulated investment company under Subchapter M of the Internal Revenue Code, the Fund is not subject to income taxes
to the extent that it distributes substantially all of its taxable income for its fiscal year. The Schedule of Investments includes
information regarding income taxes under the caption “Tax Information.”
The
Fund pays any dividends and capital gain distributions annually in December. Because federal income tax regulations differ from
generally accepted accounting principles, income and capital gain distributions determined in accordance with tax regulations
may differ from net investment income and realized gains recognized for financial reporting purposes. Accordingly, the character
of distributions and composition of net assets for tax purposes differ from those reflected in the accompanying financial statements.
CAPITAL
GAINS TAXES:
The
Fund may be subject to a tax imposed on capital gains on securities of issuers domiciled in certain countries. The Fund records
an estimated deferred tax liability for gains in these securities that have been held for less than one year. This amount, if
any, is reported as deferred capital gains tax in the accompanying Statement of Assets and Liabilities, assuming those positions
were disposed of at the end of the period, and accounted for as a reduction in the market value of the security.
INVESTMENT
TRANSACTIONS AND RELATED INVESTMENT INCOME:
Investment
transactions are accounted for on the trade date. Dividend income is recorded on the ex-dividend date. Non-cash dividend income
is recorded at the fair market value of the securities received. Interest income is recorded on an accrual basis. Premiums and
discounts on debt securities are amortized using the effective yield-to-maturity method. Realized gains and losses from investment
transactions are determined on the basis of identified cost for book and tax purposes.
EXPENSES:
The
Fund incurs direct and indirect expenses. Expenses directly attributable to the Fund are charged to the Fund, while expenses applicable
to more than one of the Royce Funds are allocated equitably. Certain personnel, occupancy costs and other administrative expenses
related to all of the Royce Funds are allocated by Royce under an administration agreement and are included in administrative
and office facilities and professional fees.
Capital
Stock:
The
Fund issued 43,376 shares of Common Stock as reinvestment of distributions for the year ended December 31, 2022.
Borrowings:
The
Fund is party to a revolving credit agreement (the “credit agreement”) with BNP Paribas Prime Brokerage International,
Limited (BNPPI). The Fund pays a commitment fee of 0.50% per annum on the unused portion of the then-current maximum amount that
may be borrowed by the Fund under the credit agreement. The credit agreement has a 179-day rolling term that resets daily. The
Fund pledges eligible portfolio securities as collateral and has granted a security interest in such pledged securities to, and
in favor of, BNPPI as security for the loan balance outstanding. The amount of eligible portfolio securities required to be pledged
as collateral is determined by BNPPI in accordance with the credit agreement. In determining collateral requirements, the value
of eligible securities pledged as collateral is subject to discount by BNPPI based upon a variety of factors set forth in the
credit agreement. As of June 30, 2023, the market value of eligible securities pledged as collateral exceeded two times the loan
balance outstanding.
If
the Fund fails to meet certain requirements, or comply with other financial covenants set forth in the credit agreement, the Fund
may be required to repay immediately, in part or in full, the loan balance outstanding under the credit agreement, which may necessitate
the sale of portfolio securities at potentially inopportune times. BNPPI may terminate the credit agreement upon certain ratings
downgrades of its corporate parent, which would result in the Fund’s entire loan balance becoming immediately due and payable.
The occurrence of such ratings downgrades may necessitate the sale of portfolio securities at potentially inopportune times. BNPPI
may also terminate the credit agreement upon sixty (60) calendar days’ prior written notice to the Fund in the event the
Fund’s net asset value per share as of the close of business on the last business day of any calendar month declines by
thirty-five percent (35%) or more from the Fund’s net asset value per share as of the close of business on the last business
day of the immediately preceding calendar month.
The
credit agreement also permits, subject to certain conditions, BNPPI to rehypothecate portfolio securities pledged by the Fund
up to the amount of the loan balance outstanding. The Fund continues to receive payments in lieu of dividends and interest on
rehypothecated securities. The Fund also has the right under the credit agreement to recall the rehypothecated securities from
BNPPI on demand. If BNPPI fails to deliver the recalled security in a timely manner, the Fund is compensated by BNPPI for any
fees or losses related to the failed delivery or, in the event a recalled security is not returned by BNPPI, the Fund, upon notice
to BNPPI, may reduce the loan balance outstanding by the value of the recalled security failed to be returned. The Fund receives
a portion of the fees earned by BNPPI in connection with the rehypothecation of portfolio securities.
20
| 2023 Semiannual Report to Stockholders
Royce
Global Value Trust
Notes
to Financial Statements (unaudited) (continued)
Borrowings
(continued):
The
maximum amount the Fund may borrow under the credit agreement is $4,000,000. The Fund has the right to reduce the maximum
amount it can borrow under the credit agreement upon one (1) business day’s prior written notice to BNPPI. In addition,
the Fund and BNPPI may agree to increase the maximum amount the Fund can borrow under the credit agreement, which amount may
not exceed $15,000,000.
As
of June 30, 2023, the Fund had outstanding borrowings of $4,000,000. During the six months ended June 30, 2023, the Fund had an
average daily loan balance of $4,000,000 at a weighted average borrowing cost of 5.94%. The maximum loan balance outstanding during
the six-month period ended June 30, 2023, was $4,000,000. As of June 30, 2023, the aggregate value of rehypothecated securities
was $2,230,462. During the six-month period ended June 30, 2023, the Fund earned $23 in fees from rehypothecated securities.
Investment
Advisory Agreement:
The
investment advisory agreement between Royce and the Fund provides for fees to be paid at an annual rate of 1.00% of the Fund’s
average daily net assets, computed daily and payable monthly. For the six months ended June 30, 2023, the Fund expensed Royce
investment advisory fees totaling $337,108.
Purchases
and Sales of Investment Securities:
For
the six months ended June 30, 2023, the costs of purchases and proceeds from sales of investment securities, other than short-term securities, amounted to $7,982,315 and $7,490,518, respectively.
Subsequent
Events:
Subsequent
events have been evaluated through the date the financial statements were issued and it has been determined that no events have
occurred that require disclosure.
2023
Semiannual Report to Stockholders |
21
MANAGERS’
DISCUSSION (UNAUDITED)
Royce Micro-Cap Trust (RMT)

Chuck
Royce, Jim Stoeffel,
Brendan
Hartmann
FUND
PERFORMANCE
Royce
Micro-Cap Trust (“RMT”) advanced 6.5% on an NAV (net asset value) and 5.0% on a market price basis for the year-to-date
period ended 6/30/23, versus respective gains of 8.1% and 2.3% for its primary unleveraged benchmark, the small-cap Russell 2000
Index and its secondary benchmark, the unleveraged Russell Microcap Index, for the same period. The Fund beat the Russell
2000 on both an NAV and market price basis for the 1-, 3-, 5-, 10-, 15-, 20-, 25-year, and since inception (12/14/93) periods
ended 6/30/23.
WHAT
WORKED… AND WHAT DIDN’T
Six of the Fund’s 11 equity sectors made positive contributions to performance in 2023’s first half, led by Industrials,
Information Technology, and Health Care while Consumer Staples, Communication Services, and Real Estate were the biggest detractors.
At the industry level, semiconductors & semiconductor equipment (Information Technology), machinery (Industrials), and
electronic equipment, instruments & components (Information Technology) contributed most, while the biggest detractors
were communications equipment (Information Technology), food products (Consumer Staples), and professional services (Industrials).
The top contributor at the position level was CIRCOR International, which makes pumps, valves, and other flow-control products
for the aerospace & defense, chemicals, and refineries industries. The company agreed to be acquired by KKR in June at
a roughly 50% premium only to have a second suitor make an even better offer later that month. KKR then upped its price. The
bidding war sent CIRCOR’s shares soaring. nLIGHT designs and manufactures semiconductor laser products, fiber lasers,
direct diode systems, single-emitter, and diode laser stacks. Its stock took off in May when nLIGHT reported revenue and profitability
above the midpoint and high end of the company’s previous guidance, even as revenue fell year-over-year across all of
the company’s end markets, hurt by lower demand and the timing of development projects.
The top detractor at the position
level was telecommunications equipment company, Clearfield, which designs passive connectivity products such as assemblies,
panels, and other related products. Although revenue and earnings have been positive, the company has struggled with demand destruction as inventory is digested, most impactfully from order pushouts by several large customers
who had built up excess inventory through the pandemic. Mesa Laboratories develops and manufactures electronic measurement
instruments for industrial and hemodialysis customers, including pipeline flow meters and calibration instruments. Its shares
fell on currency headwinds across the company’s divisions, slower biopharmaceutical spending that affected its Biopharmaceutical
Development Division, a significant decrease in Covid-driven revenues, and the loss taken in its high-margin Sema4 business,
which is part of Mesa’s Clinical Genomics division.
| |
Top
Contributors to Performance
Year-to-Date
Through 6/30/23 (%)1 |
|
|
Top
Detractors from Performance
Year-to-Date
Through 6/30/23 (%)2 |
|
|
| |
CIRCOR International |
1.72 |
|
Clearfield |
-0.57 |
|
| |
nLIGHT |
0.73 |
|
Mesa Laboratories |
-0.46 |
|
| |
PDF Solutions |
0.52 |
|
Chicken Soup for the Soul Entertainment Cl. A |
-0.39 |
|
| |
Photronics |
0.52 |
|
Cutera |
-0.36 |
|
| |
Onto Innovation |
0.49 |
|
Lindsay Corporation |
-0.36 |
|
| |
1 Includes dividends |
|
|
2 Net of dividends |
|
|
| |
|
|
|
|
|
|
Relative to the Russell 2000 in 2023’s first half, the Fund was hurt most by stock selection, most impactfully in Materials,
Information Technology (where the advantage of our overweight was not enough to overcome the negative effect of stock picking),
and Consumer Staples. Offsetting these hindrances to some degree were the positive effects of stock selection in Financials—where
our lower weighting in underperforming banks was also critical—our very low weighting in Utilities, and stock selection
in Energy.
CURRENT
POSITIONING AND OUTLOOK
We see an array of potential triggers that could jumpstart micro-cap performance in the coming months. First, a soft landing
looks more and more likely to us, and a recession—specifically the kind of deep and potentially lengthy contraction
many have been anticipating since late 2021—looks less and less likely in our view. We have already seen promising developments
that suggest a nascently robust economy: durable goods orders rose for the fourth consecutive month in June— and hit
a record high for nondefense capital goods (excluding aircraft or core capital goods, a proxy for business equipment investment)—while
homebuilding rose by 21.7% in May, a record monthly surge that also defied expectations for a slowdown. While Artificial Intelligence
(“AI”) has seen ample hype, we see it as one more secular trend that is driving demand for semiconductors and
processing bandwidth. We believe this plays into our portfolio positioning, as select smaller technology names are providing
critical components in this value chain. We view our technology companies as “picks and shovel” providers into
a myriad of long-term technology trends while many of our industrial companies are viewed by us as possessing similar characteristics.
We also expect many industrial companies to benefit from the increasing use of AI to drive efficiencies in their operations.
More significantly, however, we believe many of these large macro trends require substantial infrastructure investments and
have underlying government support, one example being the shift to green energy, which requires significant investments in
electrical transmission capabilities. While we are excited about our positioning in the intermediate term, we are also cognizant
of short-term market pressures, most notably the unprecedented pace of Fed rate hikes. Although inflationary pressures have
meaningfully moderated, the Fed remains in a hawkish mode. We believe these pressures are likely to be exacerbated by commercial
banks tightening lending standards. We continue to see the currently unsettled period as an opportune time to invest in select
micro caps for the long run.
22
| 2023 Semiannual Report to Stockholders
| PERFORMANCE AND PORTFOLIO REVIEW (UNAUDITED) |
SYMBOLS MARKET PRICE RMT NAV XOTCX |
Performance
Average
Annual Total Return (%) Through 6/30/23
| |
JAN-JUN
20231 |
1-YR |
3-YR |
5-YR |
10-YR |
15-YR |
20-YR |
25-YR |
SINCE INCEPTION
(12/24/93) |
| RMT (NAV) |
6.48 |
16.45 |
14.53 |
7.17 |
9.81 |
9.00 |
9.85 |
9.28 |
10.50 |
1
Not Annualized
Market
Price Performance History Since Inception (12/14/93)
Cumulative
Performance of Investment through 6/30/231
| |
1-YR |
5-YR |
10-YR |
15-YR |
20-YR |
SINCE INCEPTION
(12/14/93) |
| RMT |
15.3% |
35.1% |
149.9% |
245.4% |
522.5% |
1525.9% |

| ¹ | Reflects
the cumulative performance experience of a continuous common stockholder who purchased one share at inception ($7.50 IPO), reinvested
all distributions and fully participated in the primary subscription of the Fund’s 1994 rights offering. |
| ² | Reflects
the actual month-end market price movement of one share as it has traded on NYSE and, prior to 12/1/03, on the Nasdaq. |
Morningstar
Style Map™ As of 6/30/23

The
Morningstar Style Map is the Morningstar Style Box™ with the center 75% of fund holdings plotted as the Morningstar
Ownership Zone™. The Morningstar Style Box is designed to reveal a fund’s investment strategy. The Morningstar
Ownership Zone provides detail about a portfolio’s investment style by showing the range of stock sizes and styles. The
Ownership Zone is derived by plotting each stock in the portfolio within the proprietary Morningstar Style Box. Over time, the
shape and location of a fund’s ownership zone may vary. See page 62 for additional information.
Value
of $10,000
Invested
on 6/30/2000 (Russell Microcap Inception) as of 6/30/23 ($)

Top
10 Positions
%
of Net Assets
| Transcat |
2.3 |
| nLIGHT |
2.0 |
| PAR Technology |
1.9 |
| Major Drilling Group International |
1.7 |
| Mesa Laboratories |
1.6 |
| EVI Industries |
1.6 |
| PDF Solutions |
1.4 |
| Sprott |
1.4 |
| NewtekOne |
1.2 |
| Silvercrest Asset Management Group Cl. A |
1.2 |
Portfolio
Sector Breakdown
%
of Net Assets
| Information
Technology |
24.2 |
| Industrials |
18.4 |
| Financials |
14.1 |
| Health
Care |
12.5 |
| Consumer
Discretionary |
8.4 |
| Energy |
7.9 |
| Materials |
7.3 |
| Real
Estate |
2.3 |
| Communication
Services |
2.2 |
| Consumer
Staples |
1.5 |
| Utilities |
0.3 |
| Preferred
Stock |
0.0 |
| Cash
and Cash Equivalents, Net of Outstanding Line of Credit |
0.9 |
Calendar
Year Total Returns (%)
| YEAR |
RMT |
| 2022 |
-16.9 |
| 2021 |
19.2 |
| 2020 |
33.6 |
| 2019 |
22.4 |
| 2018 |
-11.6 |
| 2017 |
17.7 |
| 2016 |
22.0 |
| 2015 |
-11.7 |
| 2014 |
3.5 |
| 2013 |
44.5 |
| 2012 |
17.3 |
| 2011 |
-7.7 |
| 2010 |
28.5 |
| 2009 |
46.5 |
| 2008 |
-45.5 |
Portfolio
Diagnostics
| |
|
| Fund
Net Assets |
$486
million |
| Number
of Holdings |
263 |
| Turnover
Rate |
11% |
| Net
Asset Value |
$9.99 |
| Market
Price |
$8.75 |
| Average
Market Capitalization 1 |
$701
million |
| Weighted
Average P/E Ratio2,3 |
14.0x |
| Weighted
Average P/B Ratio2 |
2.0x |
| Active
Share4 |
94% |
| U.S. Investments (% of Net Assets) |
77.6% |
| Non-U.S. Investments (% of Net Assets) |
21.5% |
| 1 | Geometric
Average. This weighted calculation uses each portfolio holding’s market cap in a way designed to not skew the effect of very
large or small holdings; instead, it aims to better identify the portfolio’s center, which Royce believes offers a more
accurate measure of average market cap than a simple mean or median. |
| 2 | Harmonic
Average. This weighted calculation evaluates a portfolio as if it were a single stock and measures it overall. It compares the total
market value of the portfolio to the portfolio’s share in the earnings or book value, as the case may be, of its underlying
stocks. |
| 3 | The
Fund’s P/E Ratio calculation excludes companies with zero or negative earnings
(26% of portfolio holdings as of 6/30/23). |
| 4 | Active Share
is the sum of the absolute values of the different weightings of each holding in
the Fund versus each holding in the benchmark, divided by two. |
Important
Performance and Risk Information
All
performance information reflects past performance, is presented on a total return basis, net of the Fund’s investment advisory
fee, reflects the reinvestment of distributions and does not reflect the deduction of taxes that a shareholder would pay on Fund
distributions or the sale of Fund shares. Past performance is no guarantee of future results. Current performance may be higher
or lower than performance quoted. Returns as of the most recent month-end may be obtained at www.royceinvest.com. The market price
of the Fund’s shares will fluctuate, so that shares may be worth more or less than their original cost when sold. The Fund
normally invests in micro-cap companies, which may involve considerably more risk than investments in securities of larger-cap
companies. The Fund’s broadly diversified portfolio does not ensure a profit or guarantee against loss. From time to time,
the Fund may invest a significant portion of its net assets in foreign securities, which may involve political, economic, currency
and other risks not encountered in U.S. investments. Regarding the “Top Contributors” and “Top Detractors”
tables shown above, the sum of all contributors to, and all detractors from, performance for all securities in the portfolio would
approximate the Fund’s year-to-date performance for 2023.
2023 Semiannual Report to Stockholders | 23
Royce Micro-Cap
Trust
| Schedule of Investments | |
| | |
|
| Common Stocks – 98.6% | |
| | | |
| |
| | |
| SHARES | | |
| VALUE |
| COMMUNICATION SERVICES – 2.2% | |
| | | |
| |
| DIVERSIFIED TELECOMMUNICATION SERVICES - 0.0% | |
| | | |
| |
| LICT
Corporation 1,2 | |
| 7 | | |
$ | 129,325 |
| ENTERTAINMENT - 1.1% | |
| | | |
| |
| Chicken
Soup for the Soul Entertainment Cl. A 2 | |
| 477,611 | | |
| 565,969 |
| IMAX
Corporation 2 | |
| 271,900 | | |
| 4,619,581 |
| | |
| | | |
| 5,185,550 |
| INTERACTIVE MEDIA & SERVICES - 0.5% | |
| | | |
| |
| Eventbrite
Cl. A 2 | |
| 77,100 | | |
| 736,305 |
| QuinStreet 2 | |
| 179,300 | | |
| 1,583,219 |
| | |
| | | |
| 2,319,524 |
| MEDIA - 0.6% | |
| | | |
| |
| Magnite 2 | |
| 172,200 | | |
| 2,350,530 |
| †TechTarget 2 | |
| 1,580 | | |
| 49,185 |
| WideOpenWest 2 | |
| 69,215 | | |
| 584,175 |
| | |
| | | |
| 2,983,890 |
| Total
(Cost $10,615,432) | |
| | | |
| 10,618,289 |
| | |
| | | |
| |
| CONSUMER
DISCRETIONARY – 8.4% | |
| | | |
| |
| AUTOMOBILE COMPONENTS - 1.4% | |
| | | |
| |
| Motorcar Parts of America 2 | |
| 54,800 | | |
| 424,152 |
| Patrick Industries 3,4 | |
| 17,250 | | |
| 1,380,000 |
| Sebang
Global Battery 1 | |
| 50,500 | | |
| 1,859,868 |
| Standard
Motor Products 3 | |
| 47,460 | | |
| 1,780,699 |
| Stoneridge 2,3 | |
| 56,200 | | |
| 1,059,370 |
| XPEL 2 | |
| 5,100 | | |
| 429,522 |
| | |
| | | |
| 6,933,611 |
| BROADLINE RETAIL - 0.1% | |
| | | |
| |
| 1stdibs.com 2 | |
| 181,820 | | |
| 680,007 |
| DIVERSIFIED CONSUMER SERVICES - 0.8% | |
| | | |
| |
| Park Lawn | |
| 50,000 | | |
| 918,287 |
| Universal
Technical Institute 2 | |
| 445,000 | | |
| 3,074,950 |
| | |
| | | |
| 3,993,237 |
| HOTELS, RESTAURANTS & LEISURE -
1.9% | |
| | | |
| |
| Century Casinos 2 | |
| 222,500 | | |
| 1,579,750 |
| First
Watch Restaurant Group 2 | |
| 6,485 | | |
| 109,596 |
| Inspired Entertainment 2 | |
| 150,000 | | |
| 2,206,500 |
| Lindblad
Expeditions Holdings 2,3 | |
| 482,868 | | |
| 5,253,604 |
| | |
| | | |
| 9,149,450 |
| HOUSEHOLD DURABLES - 1.3% | |
| | | |
| |
| Cavco Industries 2,3 | |
| 6,900 | | |
| 2,035,500 |
| Legacy Housing 2 | |
| 162,038 | | |
| 3,757,661 |
| Lifetime
Brands 3 | |
| 119,294 | | |
| 674,011 |
| | |
| | | |
| 6,467,172 |
| LEISURE PRODUCTS - 0.5% | |
| | | |
| |
| Clarus Corporation | |
| 254,903 | | |
| 2,329,814 |
| SPECIALTY RETAIL - 2.4% | |
| | | |
| |
| AutoCanada 2 | |
| 321,700 | | |
| 4,667,352 |
| Destination
XL Group 2 | |
| 75,000 | | |
| 367,500 |
| Franchise
Group Cl. A 3 | |
| 194,300 | | |
| 5,564,752 |
| Shoe
Carnival 3 | |
| 34,632 | | |
| 813,159 |
| | |
| | | |
| 11,412,763 |
| Total
(Cost $34,931,989) | |
| | | |
| 40,966,054 |
| | |
| | | |
| |
| CONSUMER STAPLES –
1.5% | |
| | | |
| |
| BEVERAGES - 0.1% | |
| | | |
| |
| Primo Water | |
| 26,791 | | |
| 335,959 |
| CONSUMER STAPLES DISTRIBUTION & RETAIL
- 0.1% | |
| | | |
| |
| Rite Aid 2 | |
| 200,000 | | |
| 302,000 |
| FOOD PRODUCTS - 1.1% | |
| | | |
| |
| CubicFarm
Systems 2 | |
| 400,000 | | |
| 12,078 |
| J
G Boswell Company 1 | |
| 2,490 | | |
| 1,623,480 |
| John
B. Sanfilippo & Son 3 | |
| 7,900 | | |
| 926,433 |
| Lifecore Biomedical 2,3,4 | |
| 75,610 | | |
| 731,149 |
| Seneca
Foods Cl. A 2 | |
| 44,587 | | |
| 1,457,103 |
| Seneca
Foods Cl. B 2 | |
| 25,800 | | |
| 821,988 |
| | |
| | | |
| 5,572,231 |
| PERSONAL CARE PRODUCTS - 0.2% | |
| | | |
| |
| †Thorne
HealthTech 2 | |
| 189,755 | | |
| 891,848 |
| Total (Cost $5,600,674) | |
| | | |
| 7,102,038 |
| | |
| | | |
| |
| ENERGY – 7.9% | |
| | | |
| |
| ENERGY EQUIPMENT & SERVICES - 3.9% | |
| | | |
| |
| Bristow Group 2,3 | |
| 177,900 | | |
| 5,111,067 |
| Computer Modelling Group | |
| 594,875 | | |
| 2,990,653 |
| †Logan Energy 2,5 | |
| 64,750 | | |
| 16,129 |
| North American Construction Group | |
| 35,000 | | |
| 669,550 |
| Pason Systems | |
| 396,280 | | |
| 3,437,069 |
| SEACOR
Marine Holdings 2,3 | |
| 216,957 | | |
| 2,479,818 |
| TerraVest Industries | |
| 192,600 | | |
| 4,216,192 |
| | |
| | | |
| 18,920,478 |
| OIL, GAS & CONSUMABLE FUELS - 4.0% | |
| | | |
| |
| Dorchester Minerals L.P. | |
| 153,963 | | |
| 4,612,732 |
| Dorian LPG | |
| 162,798 | | |
| 4,175,769 |
| GeoPark | |
| 69,218 | | |
| 685,950 |
| Kimbell Royalty Partners L.P. | |
| 68,500 | | |
| 1,007,635 |
| Navigator Holdings 2 | |
| 175,000 | | |
| 2,276,750 |
| Northern
Oil and Gas 3 | |
| 34,200 | | |
| 1,173,744 |
| Sabine
Royalty Trust 3 | |
| 42,848 | | |
| 2,825,397 |
| Sitio
Royalties Cl. A 3,4 | |
| 50,974 | | |
| 1,339,087 |
| Spartan Delta | |
| 64,750 | | |
| 232,166 |
| StealthGas 2 | |
| 229,664 | | |
| 978,369 |
| | |
| | | |
| 19,307,599 |
| Total (Cost $30,682,028) | |
| | | |
| 38,228,077 |
| | |
| | | |
| |
| FINANCIALS – 13.6% | |
| | | |
| |
| BANKS - 2.1% | |
| | | |
| |
| Bank of N.T. Butterfield & Son | |
| 34,000 | | |
| 930,240 |
| BankFirst Capital 1 | |
| 3,155 | | |
| 112,318 |
| Bay
Community Bancorp Cl. A 1 | |
| 13,500 | | |
| 108,000 |
| Chemung Financial 3 | |
| 31,000 | | |
| 1,190,710 |
| Citizens Bancshares 1 | |
| 2,700 | | |
| 96,957 |
| First Commonwealth Financial | |
| 27,800 | | |
| 351,670 |
| †First
National Bank Alaska 1 | |
| 595 | | |
| 116,620 |
| †Greene County Bancorp | |
| 5,135 | | |
| 153,023 |
| Harbor Bankshares 1 | |
| 5,919 | | |
| 115,953 |
| HBT Financial | |
| 63,390 | | |
| 1,168,912 |
| Live
Oak Bancshares 3,4 | |
| 54,125 | | |
| 1,424,029 |
| M&F Bancorp 1 | |
| 4,300 | | |
| 89,225 |
| Midway Investments 2,5 | |
| 735,647 | | |
| 0 |
| OceanFirst Financial | |
| 9,045 | | |
| 141,283 |
| OP Bancorp | |
| 14,500 | | |
| 122,235 |
| PCB Bancorp | |
| 7,700 | | |
| 113,267 |
| Triumph Financial 2 | |
| 4,780 | | |
| 290,242 |
| United Bancorporation
of Alabama 1 | |
| 3,100 | | |
| 121,799 |
| Virginia
National Bankshares 3 | |
| 89,910 | | |
| 2,890,606 |
| WSFS Financial | |
| 22,500 | | |
| 848,700 |
| | |
| | | |
| 10,385,789 |
| 24
| 2023 Semiannual Report to Stockholders |
THE ACCOMPANYING NOTES ARE AN INTEGRAL PART OF THESE FINANCIAL STATEMENTS |
June 30, 2023
(unaudited)
Schedule
of Investments (continued)
| | |
SHARES | | |
VALUE |
| |
FINANCIALS (continued)
CAPITAL
MARKETS - 8.4% |
| †Avantax 2 | |
| 12,470 | | |
$ | 279,079 |
| B. Riley Financial | |
| 116,600 | | |
| 5,361,268 |
| Barings BDC | |
| 215,300 | | |
| 1,687,952 |
| Bolsa Mexicana de Valores | |
| 1,068,000 | | |
| 2,219,982 |
| †Bridge Investment Group Holdings Cl. A | |
| 33,130 | | |
| 376,025 |
| Canaccord Genuity Group | |
| 45,400 | | |
| 286,160 |
| Donnelley
Financial Solutions 2,3,4 | |
| 94,000 | | |
| 4,279,820 |
| Fiera Capital Cl. A | |
| 78,000 | | |
| 380,359 |
| GCM Grosvenor Cl. A | |
| 263,725 | | |
| 1,988,487 |
| †MarketWise Cl. A | |
| 500,000 | | |
| 1,000,000 |
| †Perella Weinberg Partners Cl. A | |
| 30,900 | | |
| 257,397 |
| Silvercrest
Asset Management Group Cl. A 3 | |
| 281,400 | | |
| 5,698,350 |
| Sprott | |
| 212,453 | | |
| 6,878,361 |
| StoneX Group 2,3 | |
| 43,627 | | |
| 3,624,531 |
| Tel
Aviv Stock Exchange 1,2 | |
| 343,000 | | |
| 1,770,821 |
| U.S. Global Investors Cl. A | |
| 439,454 | | |
| 1,344,729 |
| Urbana Corporation | |
| 237,600 | | |
| 706,657 |
| Value Line | |
| 23,570 | | |
| 1,081,863 |
| Westaim
Corporation (The) 2 | |
| 500,000 | | |
| 1,358,747 |
| | |
| | | |
| 40,580,588 |
| CONSUMER FINANCE - 0.3% |
| EZCORP
Cl. A 2,3,4 | |
| 201,000 | | |
| 1,684,380 |
| FINANCIAL SERVICES - 2.7% |
| Acacia Research 2,3,4 | |
| 452,800 | | |
| 1,883,648 |
| Cantaloupe 2 | |
| 50,000 | | |
| 398,000 |
| ECN Capital | |
| 1,031,200 | | |
| 2,078,357 |
| International
Money Express 2 | |
| 83,300 | | |
| 2,043,349 |
| NewtekOne | |
| 378,975 | | |
| 6,025,703 |
| Repay
Holdings Cl. A 2 | |
| 61,695 | | |
| 483,072 |
| Waterloo
Investment Holdings 2,5 | |
| 806,000 | | |
| 225,680 |
| | |
| | | |
| 13,137,809 |
| INSURANCE - 0.1% |
| †Investors Title Company | |
| 2,450 | | |
| 357,700 |
| Total (Cost $58,889,943) | |
| | | |
| 66,146,266 |
| |
| HEALTH CARE – 12.5% |
| BIOTECHNOLOGY - 2.4% |
| †Actinium Pharmaceuticals 2 | |
| 50,000 | | |
| 371,000 |
| Agios Pharmaceuticals 2 | |
| 3,500 | | |
| 99,120 |
| Arcturus
Therapeutics Holdings 2 | |
| 129,836 | | |
| 3,723,697 |
| CareDx 2 | |
| 100,000 | | |
| 850,000 |
| Caribou Biosciences 2 | |
| 14,700 | | |
| 62,475 |
| Catalyst Pharmaceuticals 2 | |
| 49,550 | | |
| 665,952 |
| 4D Molecular Therapeutics 2 | |
| 5,900 | | |
| 106,613 |
| MeiraGTx Holdings 2 | |
| 114,400 | | |
| 768,768 |
| Travere Therapeutics 2 | |
| 6,495 | | |
| 99,763 |
| †X4
Pharmaceuticals 2 | |
| 53,490 | | |
| 103,771 |
| Zealand Pharma 1,2 | |
| 137,715 | | |
| 4,941,289 |
| | |
| | | |
| 11,792,448 |
| HEALTH CARE EQUIPMENT & SUPPLIES - 4.0% |
| Artivion 2 | |
| 62,700 | | |
| 1,077,813 |
| AtriCure 2,3 | |
| 15,000 | | |
| 740,400 |
| Atrion Corporation | |
| 5,489 | | |
| 3,105,128 |
| Cutera 2,3 | |
| 49,700 | | |
| 751,961 |
| Opsens 2 | |
| 202,940 | | |
| 249,702 |
| OrthoPediatrics Corp. 2 | |
| 6,500 | | |
| 285,025 |
| Profound Medical 2 | |
| 189,100 | | |
| 2,422,364 |
| Semler Scientific 2,3 | |
| 22,400 | | |
| 587,776 |
| Surmodics 2,3 | |
| 85,300 | | |
| 2,670,743 |
| UFP Technologies 2,3,4 | |
| 24,745 | | |
| 4,796,818 |
| Utah Medical Products | |
| 31,981 | | |
| 2,980,629 |
| | |
| | | |
| 19,668,359 |
| HEALTH CARE PROVIDERS & SERVICES -1.8% |
| Cross
Country Healthcare 2,3,4 | |
| 58,900 | | |
| 1,653,912 |
| Great
Elm Group 2 | |
| 682,245 | | |
| 1,398,602 |
| Hims
& Hers Health Cl. A 2 | |
| 200,000 | | |
| 1,880,000 |
| Joint
Corp. (The) 2 | |
| 127,484 | | |
| 1,721,034 |
| National Research 3 | |
| 46,668 | | |
| 2,030,525 |
| | |
| | | |
| 8,684,073 |
| HEALTH CARE TECHNOLOGY - 0.7% |
| Simulations
Plus 3,4 | |
| 72,770 | | |
| 3,153,124 |
| LIFE SCIENCES TOOLS & SERVICES - 3.3% |
| Azenta 2,3,4 | |
| 15,700 | | |
| 732,876 |
| †Cytek
Biosciences 2 | |
| 64,295 | | |
| 549,079 |
| Harvard Bioscience 2 | |
| 317,400 | | |
| 1,742,526 |
| MaxCyte 2 | |
| 148,780 | | |
| 682,900 |
| Mesa Laboratories
3 | |
| 60,824 | | |
| 7,815,884 |
| Quanterix Corporation 2 | |
| 199,800 | | |
| 4,505,490 |
| SomaLogic
Cl. A 2 | |
| 59,470 | | |
| 137,376 |
| | |
| | | |
| 16,166,131 |
| PHARMACEUTICALS - 0.3% |
| Knight Therapeutics 2 | |
| 187,000 | | |
| 697,324 |
| Theravance Biopharma 2,3,4 | |
| 59,009 | | |
| 610,743 |
| | |
| | | |
| 1,308,067 |
| Total
(Cost $46,261,056) | |
| | | |
| 60,772,202 |
| |
INDUSTRIALS – 18.4%
AEROSPACE
& DEFENSE - 0.9% |
| Astronics Corporation 2 | |
| 56,929 | | |
| 1,130,610 |
| CPI Aerostructures 2 | |
| 189,700 | | |
| 737,933 |
| Innovative
Solutions and Support 2 | |
| 78,828 | | |
| 565,197 |
| Park Aerospace | |
| 101,300 | | |
| 1,397,940 |
| V2X 2 | |
| 8,660 | | |
| 429,189 |
| | |
| | | |
| 4,260,869 |
| BUILDING PRODUCTS - 1.2% |
| Burnham
Holdings Cl. A 1 | |
| 117,000 | | |
| 1,439,100 |
| CSW Industrials 3 | |
| 6,700 | | |
| 1,113,473 |
| Gibraltar Industries 2 | |
| 10,659 | | |
| 670,664 |
| Insteel Industries 3,4 | |
| 49,700 | | |
| 1,546,664 |
| †Janus
International Group 2 | |
| 97,610 | | |
| 1,040,523 |
| Quanex Building Products | |
| 9,900 | | |
| 265,815 |
| | |
| | | |
| 6,076,239 |
| COMMERCIAL SERVICES & SUPPLIES - 1.2% |
| Acme United | |
| 25,000 | | |
| 623,500 |
| ACV
Auctions Cl. A 2 | |
| 44,605 | | |
| 770,328 |
| Civeo Corporation 2 | |
| 37,499 | | |
| 730,481 |
| Heritage-Crystal Clean 2,3 | |
| 95,901 | | |
| 3,624,099 |
| | |
| | | |
| 5,748,408 |
| CONSTRUCTION & ENGINEERING - 2.2% |
| Construction
Partners Cl. A 2 | |
| 84,900 | | |
| 2,665,011 |
| Granite Construction | |
| 13,500 | | |
| 537,030 |
| IES Holdings 2,3 | |
| 62,874 | | |
| 3,576,273 |
| MasTec 2 | |
| 13,287 | | |
| 1,567,468 |
| Matrix Service 2,3,4 | |
| 40,425 | | |
| 238,103 |
| Northwest
Pipe 2,3 | |
| 65,100 | | |
| 1,968,624 |
| | |
| | | |
| 10,552,509 |
| THE ACCOMPANYING NOTES ARE AN INTEGRAL PART OF THESE FINANCIAL STATEMENTS |
2023 Semiannual Report to Stockholders | 25 |
Royce Micro-Cap Trust
| Schedule of Investments (continued) | |
| | |
|
| | |
| | |
|
| | |
SHARES | | |
VALUE |
INDUSTRIALS (continued)
ELECTRICAL
EQUIPMENT -1.2% |
| American
Superconductor 2 | |
| 104,225 | | |
$ | 652,449 |
| LSI Industries | |
| 299,940 | | |
| 3,767,246 |
| Powell Industries 3 | |
| 21,400 | | |
| 1,296,626 |
| Power
Solutions International 1,2 | |
| 21,100 | | |
| 57,392 |
| | |
| | | |
| 5,773,713 |
| GROUND TRANSPORTATION - 0.8% |
| Covenant Logistics Group Cl. A | |
| 11,880 | | |
| 520,701 |
| Universal
Logistics Holdings 3 | |
| 125,240 | | |
| 3,608,164 |
| | |
| | | |
| 4,128,865 |
| MACHINERY - 2.6% |
| Graham Corporation 2 | |
| 149,850 | | |
| 1,990,008 |
| H2O Innovation 2 | |
| 537,300 | | |
| 1,297,875 |
| Hurco Companies 3 | |
| 16,566 | | |
| 358,654 |
| L.
B. Foster Company 2,3 | |
| 95,300 | | |
| 1,360,884 |
| Lindsay Corporation 3 | |
| 37,500 | | |
| 4,475,250 |
| Luxfer Holdings 3 | |
| 31,700 | | |
| 451,091 |
| Shyft Group (The) | |
| 29,700 | | |
| 655,182 |
| Standex International | |
| 5,700 | | |
| 806,379 |
| Tennant Company | |
| 19,200 | | |
| 1,557,312 |
| | |
| | | |
| 12,952,635 |
| MARINE TRANSPORTATION - 1.4% |
| Algoma Central | |
| 40,000 | | |
| 457,445 |
| Clarkson 1 | |
| 52,700 | | |
| 1,981,125 |
| Eagle
Bulk Shipping 3 | |
| 90,453 | | |
| 4,345,362 |
| | |
| | | |
| 6,783,932 |
| PASSENGER AIRLINES - 0.1% |
| Harbor
Diversified 1,2 | |
| 182,930 | | |
| 402,446 |
| PROFESSIONAL SERVICES - 1.7% |
| Forrester Research 2,3,4 | |
| 126,000 | | |
| 3,665,340 |
| Franklin Covey 2,3 | |
| 40,100 | | |
| 1,751,568 |
| NV5 Global 2 | |
| 11,400 | | |
| 1,262,778 |
| Resources Connection | |
| 59,300 | | |
| 931,603 |
| Spire
Global Cl. A 2 | |
| 50,000 | | |
| 25,750 |
| †Sterling Check 2 | |
| 46,710 | | |
| 572,664 |
| | |
| | | |
| 8,209,703 |
| TRADING COMPANIES & DISTRIBUTORS - 5.1% |
| BlueLinx Holdings 2 | |
| 13,455 | | |
| 1,261,810 |
| Distribution
Solutions Group 2 | |
| 92,293 | | |
| 4,804,773 |
| EVI Industries 2,3 | |
| 352,409 | | |
| 7,752,998 |
| Transcat 2,3 | |
| 128,851 | | |
| 10,992,279 |
| | |
| | | |
| 24,811,860 |
| Total (Cost $66,770,384) | |
| | | |
| 89,701,179 |
| |
INFORMATION TECHNOLOGY – 24.2%
COMMUNICATIONS
EQUIPMENT - 2.0% |
| Aviat Networks 2 | |
| 26,190 | | |
| 873,961 |
| Clearfield 2,3,4 | |
| 58,600 | | |
| 2,774,710 |
| Digi International 2 | |
| 70,000 | | |
| 2,757,300 |
| Genasys 2 | |
| 86,392 | | |
| 224,619 |
| Harmonic 2 | |
| 135,300 | | |
| 2,187,801 |
| Ituran Location and Control | |
| 50,000 | | |
| 1,167,000 |
| | |
| | | |
| 9,985,391 |
| ELECTRONIC EQUIPMENT, INSTRUMENTS & COMPONENTS
- 7.3% | |
| | | |
| |
| Bel Fuse Cl. A | |
| 18,805 | | |
| 1,095,956 |
| †Evolv
Technologies Holdings 2 | |
| 168,000 | | |
| 1,008,000 |
| Fabrinet 2 | |
| 2,200 | | |
| 285,736 |
| FARO Technologies 2,3 | |
| 104,800 | | |
| 1,697,760 |
| HollySys
Automation Technologies 2 | |
| 51,900 | | |
| 912,921 |
| Luna Innovations 2 | |
| 428,678 | | |
| 3,909,543 |
| nLIGHT 2,3 | |
| 632,014 | | |
| 9,745,656 |
| PAR Technology 2 | |
| 287,024 | | |
| 9,451,700 |
| PC Connection 3 | |
| 9,200 | | |
| 414,920 |
| PowerFleet 2 | |
| 306,700 | | |
| 920,100 |
| Richardson Electronics | |
| 252,800 | | |
| 4,171,200 |
| Vishay
Precision Group 2,3 | |
| 45,600 | | |
| 1,694,040 |
| | |
| | | |
| 35,307,532 |
| IT SERVICES - 0.3% |
| Computer
Task Group 2 | |
| 84,800 | | |
| 645,328 |
| Hackett
Group (The) 3 | |
| 27,700 | | |
| 619,095 |
| Liberated Syndication 2,5 | |
| 56,000 | | |
| 0 |
| | |
| | | |
| 1,264,423 |
| SEMICONDUCTORS & SEMICONDUCTOR EQUIPMENT
- 8.8% | |
| | | |
| |
| Aehr
Test Systems 2 | |
| 10,700 | | |
| 441,375 |
| Alpha
and Omega Semiconductor 2,3,4 | |
| 17,900 | | |
| 587,120 |
| Alphawave
IP Group 1,2 | |
| 715,700 | | |
| 1,306,902 |
| Amtech Systems 2,3,4 | |
| 92,184 | | |
| 881,279 |
| Axcelis Technologies 2 | |
| 3,800 | | |
| 696,654 |
| AXT 2 | |
| 300,909 | | |
| 1,035,127 |
| Camtek 2,3,4 | |
| 136,052 | | |
| 4,847,533 |
| Cohu 2,3 | |
| 38,990 | | |
| 1,620,424 |
| FormFactor 2 | |
| 22,869 | | |
| 782,577 |
| Ichor Holdings 2 | |
| 32,000 | | |
| 1,200,000 |
| Kulicke
& Soffa Industries 3 | |
| 51,200 | | |
| 3,043,840 |
| Nova 2,3 | |
| 35,000 | | |
| 4,105,500 |
| NVE Corporation 3 | |
| 29,400 | | |
| 2,864,736 |
| Onto Innovation 2,3,4 | |
| 40,150 | | |
| 4,676,271 |
| PDF Solutions 2,3 | |
| 155,500 | | |
| 7,013,050 |
| Photronics 2,3,4 | |
| 216,770 | | |
| 5,590,498 |
| Ultra
Clean Holdings 2,3 | |
| 52,000 | | |
| 1,999,920 |
| | |
| | | |
| 42,692,806 |
| SOFTWARE - 4.1% |
| Agilysys 2,3 | |
| 70,665 | | |
| 4,850,446 |
| Alkami Technology 2 | |
| 122,415 | | |
| 2,006,382 |
| American
Software Cl. A 3 | |
| 111,152 | | |
| 1,168,207 |
| Cellebrite DI 2 | |
| 714,100 | | |
| 5,141,520 |
| Digital Turbine 2 | |
| 241,500 | | |
| 2,241,120 |
| †Expensify
Cl. A 2 | |
| 116,560 | | |
| 930,149 |
| Model N 2 | |
| 25,000 | | |
| 884,000 |
| Optiva 2 | |
| 28,000 | | |
| 126,816 |
| PROS Holdings 2 | |
| 69,390 | | |
| 2,137,212 |
| Upland Software 2 | |
| 144,100 | | |
| 518,760 |
| | |
| | | |
| 20,004,612 |
| TECHNOLOGY HARDWARE, STORAGE & PERIPHERALS
- 1.7% | |
| | | |
| |
| AstroNova 2 | |
| 115,860 | | |
| 1,679,970 |
| Avid Technology 2,3,4 | |
| 179,050 | | |
| 4,565,775 |
| Intevac 2 | |
| 539,400 | | |
| 2,022,750 |
| | |
| | | |
| 8,268,495 |
| Total (Cost $81,381,756) | |
| | | |
| 117,523,259 |
| |
MATERIALS – 7.3%
CHEMICALS
- 1.0% |
| Aspen Aerogels 2 | |
| 325,085 | | |
| 2,564,921 |
| LSB Industries 2 | |
| 176,540 | | |
| 1,738,919 |
| †Orion | |
| 18,875 | | |
| 400,527 |
| Rayonier
Advanced Materials 2 | |
| 50,000 | | |
| 214,000 |
| | |
| | | |
| 4,918,367 |
| 26
| 2023 Semiannual Report to Stockholders |
THE ACCOMPANYING NOTES ARE AN INTEGRAL PART OF THESE FINANCIAL STATEMENTS |
June 30, 2023 (unaudited)
Schedule of Investments (continued)
| | |
SHARES | | |
VALUE |
MATERIALS (continued)
CONSTRUCTION MATERIALS - 0.2% |
| Monarch
Cement 1 | |
| 8,150 | | |
$ | 941,325 |
| METALS & MINING - 6.1% |
| Alamos Gold Cl. A | |
| 261,044 | | |
| 3,109,473 |
| Altius Minerals | |
| 171,100 | | |
| 2,828,526 |
| Haynes International 3 | |
| 96,832 | | |
| 4,921,002 |
| Imdex 1 | |
| 569,466 | | |
| 717,384 |
| MAG Silver 2 | |
| 154,050 | | |
| 1,716,117 |
| Major
Drilling Group International 2 | |
| 1,171,114 | | |
| 8,080,002 |
| Newcrest Mining | |
| 26,859 | | |
| 478,282 |
| Olympic Steel | |
| 62,100 | | |
| 3,042,900 |
| Sandstorm Gold 3,4 | |
| 810,000 | | |
| 4,147,200 |
| Universal
Stainless & Alloy Products 2,3 | |
| 33,620 | | |
| 471,016 |
| | |
| | | |
| 29,511,902 |
| Total
(Cost $27,680,323) | |
| | | |
| 35,371,594 |
| |
REAL ESTATE – 2.3%
OFFICE REITS - 0.3% |
| Postal Realty Trust Cl. A | |
| 114,000 | | |
| 1,676,940 |
| REAL ESTATE MANAGEMENT & DEVELOPMENT - 2.0% | |
| | | |
| |
| Altus Group | |
| 101,400 | | |
| 3,362,522 |
| Real Matters 2 | |
| 229,500 | | |
| 1,049,836 |
| RMR
Group (The) Cl. A 3 | |
| 108,200 | | |
| 2,506,994 |
| Tejon Ranch 2,3 | |
| 154,994 | | |
| 2,667,447 |
| | |
| | | |
| 9,586,799 |
| Total
(Cost $13,006,348) | |
| | | |
| 11,263,739 |
| |
UTILITIES – 0.3%
WATER UTILITIES - 0.3% |
| Global Water Resources | |
| 106,000 | | |
| 1,344,080 |
| Total
(Cost $678,400) | |
| | | |
| 1,344,080 |
| | |
| | | |
| |
| TOTAL
COMMON STOCKS | |
| | | |
| |
| (Cost
$376,498,333) | |
| | | |
| 479,036,777 |
| DIVERSIFIED INVESTMENT COMPANIES – 0.5% | |
| | |
|
| | |
| | |
|
FINANCIALS
- 0.5%
CAPITAL MARKETS -0.5%
ASA
Gold and Precious Metals | |
| 171,150 | | |
| 2,545,000 |
| Total (Cost $2,914,814) | |
| | | |
| 2,545,000 |
| | |
| | | |
| |
PREFERRED STOCK – 0.0%
ENERGY
– 0.0%
OIL, GAS & CONSUMABLE FUELS - 0.0%
Imperial Petroleum 8.75% Series A | |
| 4,784 | | |
| 95,680 |
| (Cost
$71,808) | |
| | | |
| 95,680 |
| | |
| | | |
| |
WARRANTS
– 0.0% ENERGY
– 0.0% ENERGY
EQUIPMENT & SERVICES - 0.0%
†Logan
Energy (Warrants) 2,5 | |
| 64,750 | | |
| 978 |
| (Cost $984) | |
| | | |
| 978 |
| | |
| | | |
| |
REPURCHASE AGREEMENT– 5.5%
Fixed Income Clearing Corporation, 3.00% dated 6/30/23, due 7/3/23, maturity value
$26,788,869 (collateralized by obligations of U.S. Government Agencies,
4.375% due 5/15/41, valued at $27,317,861) | |
| | | |
| |
| (Cost $26,782,174) | |
| | | |
| 26,782,174 |
| | |
| | | |
| |
| TOTAL INVESTMENTS –
104.6% | |
| | | |
| |
| (Cost $406,268,113) | |
| | | |
| 508,460,609 |
| | |
| | | |
| |
| LIABILITIES LESS CASH AND OTHER ASSETS –
(4.6)% | |
| | | |
| (22,302,351) |
| | |
| | | |
| |
| NET
ASSETS – 100.0% | |
| | | |
$ | 486,158,258 |
| 1 | These securities are defined
as Level 2 securities due to fair value being based on quoted prices for similar securities and/or due to the application of fair
value factors. See Notes to Financial Statements. |
| 3 | All or a portion of these securities were pledged as collateral
in connection with the Fund’s revolving credit agreement as of June 30, 2023. Total market value of pledged securities
as of June 30, 2023, was $44,357,064. |
| 4 | As of June 30, 2023, a portion
of these securities, in the aggregate amount of $20,652,852, were rehypothecated by BNP Paribas Prime Brokerage International,
Limited in connection with the Fund’s revolving credit agreement. See Notes to Financial Statements. |
| 5 | Securities for which market
quotations are not readily available represent 0.0% of net assets. These securities have been valued at their fair value under
procedures approved by the Fund’s Board of Directors. These securities are defined as Level 3 securities due to the use of significant
unobservable inputs in the determination of fair value. See Notes to Financial Statements. |
Bold
indicates the Fund’s 20 largest equity holdings in terms of June 30, 2023, market value.
TAX
INFORMATION: The cost of total investments for Federal income tax purposes was $406,535,221. As of June 30, 2023, net
unrealized appreciation for all securities was $101,925,388 consisting of aggregate gross unrealized appreciation of $145,832,555
and aggregate gross unrealized depreciation of $43,907,167. The primary cause of the difference between book and tax basis cost
is the timing of the recognition of losses on securities sold.
| THE ACCOMPANYING NOTES ARE AN INTEGRAL PART OF THESE FINANCIAL STATEMENTS |
2023 Semiannual Report to Stockholders | 27 |
| Royce Micro-Cap Trust |
June 30,
2023 (unaudited) |
Statement
of Assets and Liabilities
ASSETS:
Investments at value | |
$ | 481,678,435 | |
| Repurchase agreements
(at cost and value) | |
| 26,782,174 | |
| Foreign currency
(cost $45,748) | |
| 45,751 | |
| Receivable for investments
sold | |
| 158,130 | |
| Receivable for dividends
and interest | |
| 616,125 | |
| Prepaid expenses
and other assets | |
| 47,915 | |
| Total
Assets | |
| 509,328,530 | |
LIABILITIES:
Revolving credit agreement | |
| 22,000,000 | |
| Payable for investments
purchased | |
| 235,513 | |
| Payable for investment
advisory fee | |
| 615,740 | |
| Payable for directors’
fees | |
| 22,586 | |
| Payable for interest
expense | |
| 114,816 | |
| Accrued expenses | |
| 181,617 | |
| Total
Liabilities | |
| 23,170,272 | |
| Net
Assets | |
$ | 486,158,258 | |
ANALYSIS OF NET ASSETS:
Paid-in
capital - $0.001 par value per share; 48,641,445 shares outstanding (150,000,000 shares authorized) | |
$ | 408,538,447 | |
| Total distributable
earnings (loss) | |
| 94,394,347 | |
| Quarterly distributions | |
| (16,774,536 | ) |
| Net Assets (net
asset value per share - $9.99) | |
$ | 486,158,258 | |
| Investments at identified
cost | |
$ | 379,485,939 | |
| 28 | 2023 Semiannual Report to Stockholders |
THE ACCOMPANYING NOTES ARE AN INTEGRAL PART OF THESE FINANCIAL STATEMENTS |
| Royce Micro-Cap Trust |
Six Months Ended June 30, 2023 (unaudited) |
Statement
of Operations
INVESTMENT
INCOME: | |
| |
INCOME:
Dividends | |
$ | 3,945,025 | |
| Foreign withholding
tax | |
| (93,134 | ) |
| Interest | |
| 176,947 | |
| Rehypothecation
income | |
| 3,428 | |
| Total
income | |
| 4,032,266 | |
| EXPENSES: | |
| | |
| Investment advisory
fees | |
| 3,736,272 | |
| Interest expense | |
| 629,817 | |
| Administrative and
office facilities | |
| 118,161 | |
| Stockholder reports | |
| 61,190 | |
| Directors’ fees | |
| 45,021 | |
| Custody and transfer
agent fees | |
| 44,304 | |
| Professional fees | |
| 33,882 | |
| Other expenses | |
| 33,608 | |
| Total expenses |
|
|
4,702,255 |
|
| Net investment income (loss) |
|
|
(669,989 |
) |
REALIZED
AND UNREALIZED GAIN (LOSS) ON INVESTMENTS AND FOREIGN CURRENCY: NET
REALIZED GAIN (LOSS): | |
| |
| Investments | |
| 20,377,914 | |
| Foreign currency
transactions | |
| (5,185 | ) |
| NET CHANGE IN UNREALIZED
APPRECIATION (DEPRECIATION): | |
| | |
| Investments | |
| 9,194,266 | |
| Other assets and
liabilities denominated in foreign currency | |
| (3,224 | ) |
| Net
realized and unrealized gain (loss) on investments and foreign currency | |
| 29,563,771 | |
| NET
INCREASE (DECREASE) IN NET ASSETS FROM INVESTMENT OPERATIONS | |
$ | 28,893,782 | |
| THE ACCOMPANYING NOTES ARE AN INTEGRAL PART OF THESE FINANCIAL STATEMENTS |
2023 Semiannual Report to Stockholders | 29 |
Statement
of Changes in Net Assets
| | |
SIX
MONTHS ENDED
6/30/23 (UNAUDITED) | | |
YEAR
ENDED 12/31/22 | |
INVESTMENT
OPERATIONS:
Net investment income (loss) | |
$ | (669,989 | ) | |
$ | (1,024,108 | ) |
| Net realized gain
(loss) on investments and foreign currency | |
| 20,372,729 | | |
| 13,560,141 | |
| Net change in unrealized
appreciation (depreciation) on investments and foreign currency | |
| 9,191,042 | | |
| (115,297,978 | ) |
| Net
increase (decrease) in net assets from investment operations | |
| 28,893,782 | | |
| (102,761,945 | ) |
| DISTRIBUTIONS: | |
| | | |
| | |
| Total distributable
earnings | |
| (16,774,536 | ) | |
| (43,327,856 | ) |
| Return of capital | |
| – | | |
| (396,334 | ) |
| Total
distributions | |
| (16,774,536 | ) | |
| (43,724,190 | ) |
| CAPITAL STOCK TRANSACTIONS: | |
| | | |
| | |
| Reinvestment of distributions | |
| 8,149,429 | | |
| 22,062,341 | |
| Total
capital stock transactions | |
| 8,149,429 | | |
| 22,062,341 | |
| Net
Increase (Decrease) In Net Assets | |
| 20,268,675 | | |
| (124,423,794 | ) |
| NET ASSETS: | |
| | | |
| | |
| Beginning of period | |
| 465,889,583 | | |
| 590,313,377 | |
| End of period | |
$ | 486,158,258 | | |
$ | 465,889,583 | |
| 30 | 2023 Semiannual Report to Stockholders |
THE ACCOMPANYING NOTES ARE AN INTEGRAL PART OF THESE FINANCIAL STATEMENTS |
| Royce Micro-Cap Trust |
Six Months Ended June 30, 2023 (unaudited) |
Statement
of Cash Flows
CASH
FLOWS FROM OPERATING ACTIVITIES: | |
| |
| Net
increase (decrease) in net assets from investment operations | |
$ | 28,893,782 | |
| Adjustments to reconcile
net increase (decrease) in net assets from investment operations to net cash used for operating activities: | |
| | |
| Purchases
of long-term investments | |
| (73,122,021 | ) |
| Proceeds
from sales and maturities of long-term investments | |
| 77,873,697 | |
| Net
purchases, sales and maturities of short-term investments | |
| (6,189,593 | ) |
| Net
(increase) decrease in dividends and interest receivable and other assets | |
| (256,257 | ) |
| Net
increase (decrease) in interest expense payable, accrued expenses and other liabilities | |
| 15,366 | |
| Net
change in unrealized appreciation (depreciation) on investments | |
| (9,194,266 | ) |
| Net
realized gain (loss) on investments | |
| (20,377,914 | ) |
| Net
cash used for operating activities | |
| (2,357,206 | ) |
| CASH FLOWS FROM FINANCING ACTIVITIES: | |
| | |
| Increase in revolving
credit agreement | |
| 11,000,000 | |
| Distributions net
of reinvestment (reinvestment $8,149,429) | |
| (8,625,107 | ) |
| Net
cash provided by financing activities | |
| 2,374,893 | |
| INCREASE
(DECREASE) IN CASH: | |
| 17,687 | |
| Cash
and foreign currency at beginning of period | |
| 28,064 | |
| Cash
and foreign currency at end of period | |
$ | 45,751 | |
Supplemental
disclosure of cash flow information:
For
the six months ended June 30, 2023, the Fund paid $588,004 in interest expense.
| THE ACCOMPANYING NOTES ARE AN INTEGRAL PART OF THESE FINANCIAL STATEMENTS |
2023 Semiannual Report to Stockholders | 31 |
Financial
Highlights
This
table is presented to show selected data for a share of Common Stock outstanding throughout each period, and to assist stockholders
in evaluating the Fund’s performance for the periods presented.
| | |
SIX
MONTHS | | |
YEARS
ENDED | |
| | |
ENDED 6/30/23 | | |
| | |
| | |
| | |
| | |
| |
| | |
(UNAUDITED) | | |
12/31/22 | | |
12/31/21 | | |
12/31/20 | | |
12/31/19 | | |
12/31/18 | |
| Net Asset Value, Beginning of Period | |
$ |
9.77 | | |
$ |
13.06 | | |
$ |
11.79 | | |
$ |
9.63 | | |
$ |
8.53 | | |
$ |
10.48 | |
INVESTMENT
OPERATIONS:
Net investment income (loss) | |
| (0.01 | ) | |
| (0.02 | ) | |
| 0.04 | 1 | |
| (0.03 | ) | |
| 0.01 | | |
| 0.01 | |
| Net realized and unrealized gain (loss) on investments
and foreign currency | |
| 0.60 | | |
| (2.26 | ) | |
| 2.12 | | |
| 2.86 | | |
| 1.81 | | |
| (1.18 | ) |
| Net increase (decrease) in net assets from investment operations | |
| 0.59 | | |
| (2.28 | ) | |
| 2.16 | | |
| 2.83 | | |
| 1.82 | | |
| (1.17 | ) |
DISTRIBUTIONS:
Net investment income | |
| – | 2 | |
| (0.05 | ) | |
| – | | |
| (0.08 | ) | |
| (0.03 | ) | |
| (0.00 | ) |
| Net realized gain
on investments and foreign currency | |
| – | 2 | |
| (0.89 | ) | |
| (0.84 | ) | |
| (0.53 | ) | |
| (0.65 | ) | |
| (0.75 | ) |
| Return of capital | |
| (0.35 | )2 | |
| (0.01 | ) | |
| – | | |
| – | | |
| – | | |
| – | |
| Total distributions | |
| (0.35 | ) | |
| (0.95 | ) | |
| (0.84 | ) | |
| (0.61 | ) | |
| (0.68 | ) | |
| (0.75 | ) |
| CAPITAL STOCK TRANSACTIONS: | |
| | | |
| | | |
| | | |
| | | |
| | | |
| | |
| Effect of reinvestment
of distributions by Common Stockholders | |
| (0.02 | ) | |
| (0.06 | ) | |
| (0.05 | ) | |
| (0.06 | ) | |
| (0.04 | ) | |
| (0.03 | ) |
| Total
capital stock transactions | |
| (0.02 | ) | |
| (0.06 | ) | |
| (0.05 | ) | |
| (0.06 | ) | |
| (0.04 | ) | |
| (0.03 | ) |
| Net Asset Value,
End of Period | |
$ | 9.99 | | |
$ | 9.77 | | |
$ | 13.06 | | |
$ | 11.79 | | |
$ | 9.63 | | |
$ | 8.53 | |
| Market Value, End
of Period | |
$ | 8.75 | | |
$ | 8.68 | | |
$ | 11.55 | | |
$ | 10.12 | | |
$ | 8.54 | | |
$ | 7.42 | |
TOTAL
RETURN:3 Net
Asset Value | |
| 6.48 | %4 | |
| (16.89 | )% | |
| 19.17 | % | |
| 33.60 | % | |
| 22.44 | % | |
| (11.62 | )% |
| Market Value | |
| 4.98 | %4 | |
| (16.51 | )% | |
| 22.78 | % | |
| 29.32 | % | |
| 24.82 | % | |
| (14.65 | )% |
RATIOS
BASED ON AVERAGE NET ASSETS: Investment
advisory fee expense5 | |
| 1.58 | %6 | |
| 1.47 | % | |
| 1.04 | % | |
| 1.19 | % | |
| 0.85 | % | |
| 0.92 | %7 |
| Other operating
expenses | |
| 0.41 | %6 | |
| 0.29 | % | |
| 0.16 | % | |
| 0.24 | % | |
| 0.35 | % | |
| 0.43 | % |
| Total expenses (net) | |
| 1.99 | %6 | |
| 1.76 | % | |
| 1.20 | % | |
| 1.43 | % | |
| 1.20 | % | |
| 1.35 | % |
| Expenses excluding
interest expense | |
| 1.72 | %6 | |
| 1.63 | % | |
| 1.16 | % | |
| 1.34 | % | |
| 1.01 | % | |
| 1.05 | % |
| Expenses prior to
balance credits | |
| 1.99 | %6 | |
| 1.76 | % | |
| 1.20 | % | |
| 1.43 | % | |
| 1.20 | % | |
| 1.35 | % |
| Net investment income
(loss) | |
| (0.28 | )%6 | |
| (0.21 | )% | |
| 0.30 | %1 | |
| (0.34 | )% | |
| 0.10 | % | |
| 0.10 | % |
| SUPPLEMENTAL DATA: | |
| | | |
| | | |
| | | |
| | | |
| | | |
| | |
| Net Assets, End
of Period (in thousands) | |
$ | 486,158 | | |
$ | 465,890 | | |
$ | 590,313 | | |
$ | 515,916 | | |
$ | 404,807 | | |
$ | 345,499 | |
| Portfolio Turnover
Rate | |
| 11 | % | |
| 26 | % | |
| 15 | % | |
| 17 | % | |
| 15 | % | |
| 21 | % |
| REVOLVING CREDIT AGREEMENT: | |
| | | |
| | | |
| | | |
| | | |
| | | |
| | |
| Asset coverage | |
| 2310 | % | |
| 4335 | % | |
| 2783 | % | |
| 2445 | % | |
| 1940 | % | |
| 1670 | % |
| Asset coverage per $1,000 | |
$ | 23,098 | | |
$ | 43,354 | | |
$ | 27,832 | | |
$ | 24,451 | | |
$ | 19,400 | | |
$ | 16,705 | |
| 1 | A
special distribution from ECN Capital resulted in an increase in net investment income
(loss) per share of $0.07 and an increase in the ratio of net investment income (loss)
to average net assets of 0.51%. |
| 2 | Amounts
are subject to change and recharacterization at year end. |
| 3 | The
Market Value Total Return is calculated assuming a purchase of Common Stock on the opening
of the first business day and a sale on the closing of the last business day of each
period. Dividends and distributions are assumed for the purposes of this calculation
to be reinvested at prices obtained under the Fund’s Distribution Reinvestment and Cash
Purchase Plan. Net Asset Value Total Return is calculated on the same basis, except that
the Fund’s net asset value is used on the purchase, sale and dividend reinvestment dates
instead of market value. |
| 5 | The
investment advisory fee is calculated based on average net assets over a rolling 36-month
basis, while the above ratios of investment advisory fee expenses are based on the average
net assets over a 6-month basis for the six months ended 6/30/23, and a 12-month basis
for the years shown. |
| 7 | Includes
the impact of the adjustment of prior period’s performance fees of 0.06%. |
| 32 | 2023 Semiannual Report to Stockholders |
THE ACCOMPANYING NOTES ARE AN INTEGRAL PART OF THESE FINANCIAL STATEMENTS |
Royce
Micro-Cap Trust
Notes
to Financial Statements (unaudited)
Summary
of Significant Accounting Policies
Royce
Micro-Cap Trust, Inc. (the "Fund"), is a diversified closed-end investment company that was incorporated under the laws
of the State of Maryland on September 9, 1993. The Fund commenced operations on December 14, 1993.
The
preparation of financial statements in conformity with accounting principles generally accepted in the United States of America
requires management to make estimates and assumptions that affect the reported amounts of assets and liabilities and the disclosure
of contingent assets and liabilities at the date of the financial statements and the reported amounts of income and expenses during
the reporting period. Actual results could differ from those estimates.
The
Fund is an investment company and accordingly follows the investment company accounting and reporting guidance of the Financial
Accounting Standards Board (FASB) Accounting Standard Codification Topic 946 “Financial Services-Investment Companies.”
Royce
& Associates, LP, the Fund’s investment adviser, is a majority-owned subsidiary of Franklin Resources, Inc. and primarily
conducts business using the name Royce Investment Partners (“Royce”).
VALUATION
OF INVESTMENTS:
Portfolio
securities held by the Fund are valued as of the close of trading on the New York Stock Exchange (“NYSE”)
(generally 4:00 p.m. Eastern time) on the valuation date. Investments in money market funds are valued at net asset value per
share. Values for non-U.S. dollar denominated equity securities are converted to U.S. dollars daily based upon prevailing
foreign currency exchange rates as quoted by a major bank.
Equity
securities that are listed on an exchange or Nasdaq, or traded on OTC Market Group Inc.’s OTC Link ATS or other
alternative trading system, are valued: (i) on the basis of their last reported sales prices or official closing prices, as
applicable, on a valuation date; or (ii) at their highest reported bid prices in the event such equity
securities did not trade on a valuation date. Such inputs are generally referred to as “Level 1” inputs because
they represent reliable quoted prices in active markets for identical securities.
If
the value of a portfolio security held by the Fund cannot be determined solely by reference to Level 1 inputs, such portfolio
security will be “fair valued.” The Fund’s Board of Directors has designated Royce as valuation designee to
perform fair value determinations for such portfolio securities in accordance with Rule 2a-5 under the Investment Company Act
of 1940 (“Rule 2a-5”). Pursuant to Rule 2a-5, fair values are determined in accordance with policies and procedures
approved by the Fund’s Board of Directors and policies and procedures adopted by Royce in its capacity as valuation designee for
the Fund. Fair valued securities are reported as either “Level 2” or “Level 3” securities.
As
a general principle, the fair value of a security is the amount which the Fund might reasonably expect to receive for the security
upon its current sale. However, in light of the judgment involved in fair valuations, no assurance can be given that a fair value
assigned to a particular portfolio security will be the amount which the Fund might be able to receive upon its current sale.
When a fair value pricing methodology is used, the fair value prices used by the Fund for such securities will likely differ from
the quoted or published prices for the same securities.
Level
2 inputs are other significant observable inputs (e.g., dealer bid side quotes and quoted prices for securities with comparable
characteristics). Examples of situations in which Level 2 inputs are used to fair value portfolio securities held by the Fund
on a particular valuation date include:
| ● | Over-the-counter
equity securities other than those traded on OTC Market Group Inc.’s OTC Link ATS
or other alternative trading
system (collectively referred to herein as “Other OTC Equity Securities”) are fair valued at their highest bid price
when Royce receives at least two bid side quotes from dealers who make markets in such securities; |
| ● | Certain
bonds and other fixed income securities may be fair valued by reference to other securities
with comparable ratings,
interest rates, and maturities in accordance with valuation methodologies maintained by certain independent pricing services;
and |
| ● | The
Fund uses an independent pricing service to fair value certain non-U.S. equity securities
when U.S. market volatility exceeds
a certain threshold. This pricing service uses proprietary correlations it has developed between the movement of prices of non-U.S.
equity securities and indices of U.S.-traded securities, futures contracts, and other indications to estimate the fair value of
such non-U.S. securities. |
Level
3 inputs are significant unobservable inputs. Examples of Level 3 inputs include (without limitation) the last trade price for
a security before trading was suspended or terminated; discounts to last trade price for lack of marketability or otherwise; market
price information regarding other securities; information received from the issuer and/or published documents, including SEC filings
and financial statements; and other publicly available information. Pursuant to the above-referenced policies and procedures,
Royce may use
2023
Semiannual Report to Stockholders | 33
Royce
Micro-Cap Trust
Notes
to Financial Statements (unaudited) (continued)
VALUATION
OF INVESTMENTS (continued):
various
techniques in making fair value determinations based upon Level 3 inputs, which techniques may include (without limitation): (i)
workout valuation methods (e.g., earnings multiples, discounted cash flows, liquidation values, derivations of book value, firm
or probable offers from qualified buyers for the issuer’s ongoing business, etc.); (ii) discount or premium from market,
or compilation of other observable market information, for other similar freely traded securities; (iii) conversion from the readily
available market price of a security into which an affected security is convertible or exchangeable; and (iv) pricing models or
other formulas. In the case of restricted securities, fair value determinations generally start with the inherent or intrinsic
worth of the relevant security, without regard to the restrictive feature, and are reduced for any diminution in value resulting
from the restrictive feature. Due to the inherent uncertainty of such valuations, these fair values may differ significantly from
the values that would have been used had an active market existed.
A
security that is valued by reference to Level 1 or Level 2 inputs may drop to Level 3 on a particular valuation date for several reasons, including if:
| ● | an
equity security that is listed on an exchange or Nasdaq, or traded on OTC Market Group
Inc.’s OTC Link ATS or other alternative
trading system, has not traded and there are no bids; |
| ● | Royce
does not receive at least two bid side quotes for an Other OTC Equity Security; |
| ● | the
independent pricing services are unable to supply fair value prices; or |
| ● | the
Level 1 or Level 2 inputs become otherwise unreliable for any reason (e.g., a significant
event occurs after the close of trading for a security but prior to the time the Fund
prices its shares). |
The
table below shows the aggregate value of the various Level 1, Level 2, and Level 3 securities held by the Fund as of June 30,
2023. Any Level 2 or Level 3 securities held by the Fund are noted in its Schedule of Investments. The inputs or methodology used
for valuing securities are not necessarily an indication of the risk associated with owning those securities.
| |
LEVEL
1 |
LEVEL
2 |
LEVEL
3 |
TOTAL |
| Common
Stocks |
$460,863,638 |
$17,931,330 |
$241,809 |
$479,036,777 |
| Diversified
Investment Companies |
2,545,000 |
- |
- |
2,545,000 |
| Preferred
Stock |
95,680 |
- |
- |
95,680 |
| Warrants |
- |
- |
978 |
978 |
| Repurchase
Agreement |
- |
26,782,174 |
- |
26,782,174 |
Level
3 Reconciliation:
| |
UNREALIZED
GAIN (LOSS) 1 |
BALANCE
AS OF 6/30/23
|
| |
BALANCE
AS OF
12/31/22 |
PURCHASES
|
CORPORATE
ACTIONS |
SALES
|
REALIZED
GAIN
(LOSS) 1 |
CURRENTLY
HELD
SECURITIES |
SECURITIES
NO
LONGER
HELD |
| Common
Stocks |
$225,680 |
$
– |
$16,230 |
$
– |
$
– |
$
(101) |
$
– |
$241,809 |
| Warrants |
– |
– |
984 |
– |
– |
(6) |
– |
978 |
1
The net change in unrealized appreciation (depreciation) is included in the accompanying Statement of Operations. Change
in unrealized appreciation (depreciation) includes net unrealized appreciation (depreciation) resulting from changes in investment
values during the reporting period and the reversal of previously recorded unrealized appreciation (depreciation) when gains or
losses are realized. Net realized gain (loss) from investments and foreign currency transactions is included in the accompanying
Statement of Operations.
REPURCHASE
AGREEMENTS:
The
Fund may enter into repurchase agreements with institutions that the Fund’s investment adviser has determined are creditworthy.
The Fund restricts repurchase agreements to maturities of no more than seven days. Securities pledged as collateral for repurchase
agreements, which are held until maturity of the repurchase agreements, are marked-to-market daily and maintained at a value at
least equal to the principal amount of the repurchase agreement (including accrued interest). Repurchase agreements could involve
certain risks in the event of default or insolvency of the counter-party, including possible delays or restrictions upon the ability
of the Fund to dispose of its underlying securities. The remaining contractual maturity of the repurchase agreement held by the
Fund as of June 30, 2023, is next business day and continuous.
FOREIGN
CURRENCY:
Net
realized foreign exchange gains or losses arise from sales and maturities of short-term securities, sales of foreign currencies,
expiration of currency forward contracts, currency gains or losses realized between the trade and settlement dates on securities
transactions, and the difference between the amounts of dividends, interest, and foreign withholding taxes recorded on the Fund’s
books and the U.S. dollar equivalent of the amounts actually received or paid. Net unrealized foreign exchange gains and losses
arise from changes in the value of assets and liabilities, other than investments in securities at the end of the reporting period,
as a result of changes in foreign currency exchange rates.
The
Fund does not isolate that portion of the results of operations resulting from fluctuations in foreign exchange rates on investments
from the fluctuations arising from changes in market prices of securities held. Such fluctuations are included with the net realized
and unrealized gain or loss on investments.
| 34 | 2023 Semiannual Report
to Stockholders |
|
Royce
Micro-Cap Trust
Notes
to Financial Statements (unaudited) (continued)
TAXES:
As
a qualified regulated investment company under Subchapter M of the Internal Revenue Code, the Fund is not subject to income taxes
to the extent that it distributes substantially all of its taxable income for its fiscal year. The Schedule of Investments includes
information regarding income taxes under the caption “Tax Information.”
DISTRIBUTIONS:
The
Fund pays quarterly distributions on the Fund’s Common Stock at the annual rate of 7% of the rolling average of the prior
four calendar quarter-end NAVs of the Fund’s Common Stock, with the fourth quarter distribution being the greater of 1.75%
of the rolling average or the distribution required by IRS regulations. Distributions to Common Stockholders are recorded on ex-dividend
date. To the extent that distributions in any year are not paid from long-term capital gains, net investment income or net short-term
capital gains, they will represent a return of capital. Distributions are determined in accordance with income tax regulations
that may differ from accounting principles generally accepted in the United States of America. Permanent book and tax differences
relating to stockholder distributions will result in reclassifications within the capital accounts. Undistributed net investment
income may include temporary book and tax basis differences, which will reverse in a subsequent period. Any taxable income or
gain remaining undistributed at fiscal year end is distributed in the following year.
INVESTMENT
TRANSACTIONS AND RELATED INVESTMENT INCOME:
Investment
transactions are accounted for on the trade date. Dividend income is recorded on the ex-dividend date. Non-cash dividend income
is recorded at the fair market value of the securities received. Interest income is recorded on an accrual basis. Premiums and
discounts on debt securities are amortized using the effective yield-to-maturity method. Realized gains and losses from investment
transactions are determined on the basis of identified cost for book and tax purposes.
EXPENSES:
The
Fund incurs direct and indirect expenses. Expenses directly attributable to the Fund are charged to the Fund, while expenses applicable
to more than one of the Royce Funds are allocated equitably. Certain personnel, occupancy costs and other administrative expenses
related to all of the Royce Funds are allocated by Royce under an administration agreement and are included in administrative
and office facilities and professional fees.
Capital
Stock:
The
Fund issued 953,074 and 2,488,423 shares of Common Stock as reinvestment of distributions for the six months ended June 30, 2023,
and the year ended December 31, 2022, respectively.
Borrowings:
The
Fund is party to a revolving credit agreement (the “credit agreement”) with BNP Paribas Prime Brokerage International,
Limited (BNPPI). The Fund pays a commitment fee of 0.50% per annum on the unused portion of the then-current maximum amount that
may be borrowed by the Fund under the credit agreement. The credit agreement has a 179-day rolling term that resets daily. The
Fund pledges eligible portfolio securities as collateral and has granted a security interest in such pledged securities to, and
in favor of, BNPPI as security for the loan balance outstanding. The amount of eligible portfolio securities required to be pledged
as collateral is determined by BNPPI in accordance with the credit agreement. In determining collateral requirements, the value
of eligible securities pledged as collateral is subject to discount by BNPPI based upon a variety of factors set forth in the
credit agreement. As of June 30, 2023, the market value of eligible securities pledged as collateral exceeded two times the loan
balance outstanding.
If
the Fund fails to meet certain requirements, or comply with other financial covenants set forth in the credit agreement, the Fund
may be required to repay immediately, in part or in full, the loan balance outstanding under the credit agreement, which may necessitate
the sale of portfolio securities at potentially inopportune times. BNPPI may terminate the credit agreement upon certain ratings
downgrades of its corporate parent, which would result in the Fund’s entire loan balance becoming immediately due and payable.
The occurrence of such ratings downgrades may necessitate the sale of portfolio securities at potentially inopportune times. BNPPI
may also terminate the credit agreement upon sixty (60) calendar days’ prior written notice to the Fund in the event the
Fund’s net asset value per share as of the close of business on the last business day of any calendar month declines by
thirty-five percent (35%) or more from the Fund’s net asset value per share as of the close of business on the last business
day of the immediately preceding calendar month.
The
credit agreement also permits, subject to certain conditions, BNPPI to rehypothecate portfolio securities pledged by the Fund
up to the amount of the loan balance outstanding. The Fund continues to receive payments in lieu of dividends and interest on
rehypothecated securities. The Fund also has the right under the credit agreement to recall the rehypothecated securities from
BNPPI on demand. If BNPPI fails to deliver the recalled security in a timely manner, the Fund is compensated by BNPPI for any
fees or losses related to the failed
2023
Semiannual Report to Stockholders | 35
Royce
Micro-Cap Trust
Notes
to Financial Statements (unaudited) (continued)
Borrowings
(continued):
delivery
or, in the event a recalled security is not returned by BNPPI, the Fund, upon notice to BNPPI, may reduce the loan balance outstanding
by the value of the recalled security failed to be returned. The Fund receives a portion of the fees earned by BNPPI in connection
with the rehypothecation of portfolio securities.
The
maximum amount the Fund may borrow under the credit agreement is $22,000,000. The Fund has the right to further reduce the maximum
amount it can borrow under the credit agreement upon one (1) business day’s prior written notice to BNPPI. In addition,
the Fund and BNPPI may agree to increase the maximum amount the Fund can borrow under the credit agreement, which amount may not
exceed $60,000,000.
As
of June 30, 2023, the Fund had outstanding borrowings of $22,000,000. During the six-month period ended June 30, 2023, the Fund
had an average daily loan balance of $21,027,624 at a weighted average borrowing cost of 5.94%. The maximum loan balance outstanding
during the six-month period ended June 30, 2023, was $22,000,000. As of June 30, 2023, the aggregate value of rehypothecated securities
was $20,652,852. During the six-month period ended June 30, 2023, the Fund earned $3,428 in fees from rehypothecated securities.
Investment
Advisory Agreement:
As
compensation for its services under the investment advisory agreement, Royce receives a fee comprised of a Basic Fee (“Basic
Fee”) and an adjustment to the Basic Fee based on the investment performance of the Fund in relation to the investment record
of the Russell 2000. The fee is payable monthly.
The
Basic Fee is a monthly fee equal to 1/12 of 1% (1% on an annualized basis) of the average of the Fund’s month-end net assets
for the rolling 36-month period ending with such month (the "performance period"). The Basic Fee for each month is increased
or decreased at the rate of 1/12 of .05% for each percentage point that the investment performance of the Fund exceeds, or is
exceeded by, the percentage change in the investment record of the Russell 2000 for the performance period by more than two percentage
points. The performance period for each such month is a rolling 36-month period ending with such month. The maximum increase or
decrease in the Basic Fee for any month may not exceed 1/12 of .5%. Accordingly, for each month, the maximum monthly fee rate
as adjusted for performance is 1/12 of 1.5% and is payable if the investment performance of the Fund exceeds the percentage change
in the investment record of the Russell 2000 by 12 or more percentage points for the performance period, and the minimum monthly
fee rate as adjusted for performance is 1/12 of .5% and is payable if the percentage change in the investment record of the Russell
2000 exceeds the investment performance of the Fund by 12 or more percentage points for the performance period.
For
the six rolling 36-month periods ended June 2023, the Fund’s investment performance ranged from 11% above to 26% above the
investment performance of the Russell 2000. Accordingly, the net investment advisory fee consisted of a Basic Fee of $2,505,003
and a net upward adjustment of $1,231,269 for the performance of the Fund relative to that of the Russell 2000. For the six months
ended June 30, 2023, the Fund expensed Royce investment advisory fees totaling $3,736,272.
Purchases
and Sales of Investment Securities:
For
the six months ended June 30, 2023, the costs of purchases and proceeds from sales of investment securities, other than short-term securities, amounted to $50,559,628 and $69,110,044, respectively.
Cross
trades may be executed by the Fund pursuant to Rule 17a-7 under the 1940 Act. Cross trading is the buying or selling of portfolio
securities between funds to which Royce or an affiliate of Franklin Resources, Inc. serves as investment adviser. The Fund’s
Chief Compliance Officer reviews such transactions each quarter for compliance with the requirements and restrictions set forth
by Rule 17a-7, and reports the results of that review to the Board of Directors. Cross trades for the six months ended June 30,
2023, were as follows:
| COSTS
OF PURCHASES |
PROCEEDS
FROM SALES |
REALIZED
GAIN (LOSS) |
| $1,095,000 |
$
403,665 |
$
338,215 |
Subsequent
Events:
Subsequent
events have been evaluated through the date the financial statements were issued and it has been determined that no events have
occurred that require disclosure.
| 36 | 2023 Semiannual Report
to Stockholders |
|
This
page is intentionally left blank.
2023
Semiannual Report to Stockholders | 37
MANAGERS’ DISCUSSION (UNAUDITED)
Royce Value Trust (RVT)

Chuck
Royce, Lauren Romeo, CFA®,
Steven
McBoyle, Andrew Palen,
George Necakov, CFA®
FUND
PERFORMANCE
Royce Value Trust (RVT) advanced 11.7% on an NAV (net asset
value) basis and 8.2% on a market price basis for the year-to-date period ended 6/30/23 versus respective gains of 8.1% and 6.0%
for its primary small-cap benchmark, the unleveraged Russell 2000 Index, and the unleveraged S&P SmallCap 600 Index, for the
same period. The Fund also maintained its longer-term relative advantages over the Russell 2000. On an NAV basis, RVT beat
the Russell 2000 for the 1-, 3-, 5-, 10-, 20-, 25-, 30-, 35-year, and since inception (11/26/86) periods ended 6/30/23—and
on a market price basis for each of these spans except the 1- and 20-year periods.
WHAT WORKED… AND WHAT DIDN’T
Nine of RVT’s 11 equity sectors made positive contributions to 2023’s first-half performance, led by Industrials,
Information Technology, and Consumer Discretionary. Consumer Staples and Utilities detracted while Communication Services
made the smallest contribution. At the industry level, machinery (Industrials), semiconductors & semiconductor equipment
(Information Technology), and construction & engineering (Industrials) contributed most while the biggest detractors were
banks (Financials), food products (Consumer Staples), and pharmaceuticals (Health Care).
The top-contributing position in 2023’s first half was First Citizens BancShares. Its valuation looked attractive to
us in late 2022, when we began adding shares that were trading at roughly 5x earnings per share. More recently, First Citizens
was chosen by the FDIC to acquire Silicon Valley Bank, most likely owing to its long history of buying failed banks. Silicon
Valley’s travails notwithstanding, the purchase was accretive to First Citizens’ tangible book value and earnings,
helping to spur a sharp rise in its stock. CIRCOR International makes pumps, valves, and other flow-control products for the
aerospace & defense, chemicals, and refineries industries. The company agreed to be acquired by KKR in June at a roughly
50% premium only to have a second suitor make an even better offer later that month. KKR then upped its price. The bidding
war sent CIRCOR’s shares soaring. IES Holdings provides electrical contracting and maintenance services, and data communication
services. Its stock rose with improved earnings as IES fixed certain operating issues.
| |
Top
Contributors to Performance |
|
Top
Detractors from Performance |
|
| |
Year-to-Date
Through 6/30/23 (%)1 |
|
Year-to-Date
Through 6/30/23 (%)2 |
|
| |
First Citizens BancShares Cl. A |
0.72 |
|
Seneca
Foods Cl. A |
-0.30 |
|
| |
CIRCOR International |
0.49 |
|
First Republic Bank |
-0.24 |
|
| |
IES Holdings |
0.39 |
|
FARO Technologies |
-0.21 |
|
| |
Stevanato Group |
0.33 |
|
Lindsay Corporation |
-0.20 |
|
| |
MKS Instruments |
0.32 |
|
BankUnited |
-0.16 |
|
| |
1 Includes
dividends |
|
|
2 Net of
dividends |
|
|
The top detractor was Seneca Foods,
which processes and sells packaged fruits and vegetables as well as snack chips. While the company continued to execute
effectively, earnings and margins were crimped due to lower sales volumes that were not entirely offset by higher selling
prices. San Francisco-based regional bank First Republic Bank was the third bank to declare insolvency in 2023 (following
Silicon Valley and Signature Banks) and the second-largest failure since the fall of Washington Mutual in the 2008 Financial
Crisis. It was hurt by having too many uninsured deposits and too many reserves in long-term debt instruments, which began
losing value when interest rates began to rise. The result was a bailout by JPMorgan Chase in May. FARO Technologies is a
global leader in 3D measuring equipment and software for industrial and construction applications. Early in 2023, FARO
announced a costly convertible debt offering and additional restructuring actions to bolster liquidity and help with the cost
of two acquisitions. In 2Q23 the stock plunged again when the CEO announced his plan to retire on July 1st. Unsure
of its subsequent direction, we reduced our stake in June.
The Fund’s advantage over the Russell 2000 in 2023’s first half came from both stock selection and sector allocation.
Stock picks boosted relative results most in Financials, Industrials (where our higher weighting also helped), and Real Estate.
Conversely, stock selection detracted in Information Technology, Consumer Staples, and Health Care.
CURRENT
POSITIONING AND OUTLOOK
We see an array of potential triggers that could jumpstart small-cap performance in the coming months. First, a soft landing
looks more and more likely to us, and a recession—specifically the kind of deep and potentially lengthy contraction
many have been anticipating since late 2021—looks less and less likely in our view. We have already seen promising developments
that seem to suggest a nascently robust economy: durable goods orders rose for the fourth consecutive month in June—and
hit a record high for nondefense capital goods (excluding aircraft or core capital goods, a proxy for business equipment investment)—while
homebuilding rose by 21.7% in May, a record monthly surge that also defied expectations for a slowdown. Even more important,
in our view, is the ongoing sense of cautious optimism we have been hearing from many management teams—which was reflected
by generally solid earnings for many Fund holdings for the second quarter. Amid the difficulties of bear markets and periods
of economic uncertainty, we think it’s crucial to remind investors of the opportunity to build their small-cap allocation
at attractively low prices. History shows that investors who had the necessary patience and discipline to stay invested during
periods of sluggish or negative performance have been rewarded. We continue to see the currently unsettled period as an opportune
time to invest in select small caps for the long run.
38
| 2023 Semiannual Report to Shareholders
| PERFORMANCE
AND PORTFOLIO REVIEW (UNAUDITED) |
SYMBOLS
MARKET PRICE RVT
NAV XRVTX |
Performance
Average Annual Total Return (%) Through 6/30/23
| |
JAN-JUN
20231 |
1-YR |
3-YR |
5-YR |
10-YR |
15-YR |
20-YR |
25-YR |
30-YR |
35-YR |
SINCE
INCEPTION (11/26/86) |
| RVT
(NAV) |
11.73 |
16.38 |
12.20 |
6.91 |
9.16 |
8.18 |
9.25
|
8.70 |
9.92 |
10.38 |
10.21 |
Market
Price Performance History Since Inception (11/26/86)
Cumulative
Performance of Investment through 6/30/231
| |
1-YR |
5-YR |
10-YR |
15-YR |
20-YR |
SINCE
INCEPTION (11/26/86) |
| RVT |
7.3% |
34.9% |
135.4% |
200.7% |
395.3% |
2813.0% |
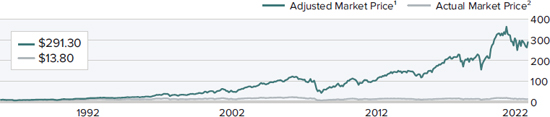
| 1 | Reflects
the cumulative performance of an investment made by a stockholder who purchased one share at inception ($10.00 IPO), reinvested
all distributions and fully participated in primary subscriptions of the Fund’s rights offerings. |
| 2 | Reflects
the actual month-end market price movement of one share as it has traded on the NYSE. |
Morningstar
Style Map™ As of 6/30/23

The
Morningstar Style Map is the Morningstar Style Box™ with the center 75% of fund holdings plotted as the Morningstar
Ownership Zone™. The Morningstar Style Box is designed to reveal a fund’s investment strategy. The Morningstar
Ownership Zone provides detail about a portfolio’s investment style by showing the range of stock sizes and styles. The
Ownership Zone is derived by plotting each stock in the portfolio within the proprietary Morningstar Style Box. Over time, the
shape and location of a fund’s ownership zone may vary. See page 62 for additional information.
Value of $10,000
Invested on 11/26/86 as
of 6/30/23 ($)

Top
10 Positions
%
of Net Assets
| Alamos Gold Cl A |
1.3 |
| MKS Instruments |
1.2 |
| Fabrinet |
1.2 |
| SEI Investments |
1.0 |
| Quaker Houghton |
1.0 |
| Enovis Corporation |
0.9 |
| FirstService Corporation |
0.9 |
| LCI Industries |
0.9 |
| IES Holdings |
0.9 |
| E-L Financial |
0.9 |
Portfolio
Sector Breakdown
%
of Net Assets
| Industrials |
28.3 |
| Information
Technology |
15.9 |
| Financials |
14.8 |
| Consumer
Discretionary |
10.1 |
| Health
Care |
9.9 |
| Materials |
9.7 |
| Real
Estate |
3.7 |
| Energy |
2.7 |
| Consumer
Staples |
2.2 |
| Communication Services |
2.2 |
| Utilities |
0.1 |
| Diversified Investment Companies |
0.0 |
| Cash
and Cash Equivalents, Net of Outstanding Line of Credit |
0.4 |
Calendar Year Total Returns (%)
|
|
| YEAR |
RVT |
| 2022 |
-21.2 |
| 2021 |
20.0 |
| 2020 |
21.9 |
| 2019 |
30.5 |
| 2018 |
-14.4 |
| 2017 |
19.4 |
| 2016 |
26.8 |
| 2015 |
-8.1 |
| 2014 |
0.8 |
| 2013 |
34.1 |
| 2012 |
15.4 |
| 2011 |
-10.1 |
| 2010 |
30.3 |
| 2009 |
44.6 |
| 2008 |
-45.6 |
| Portfolio
Diagnostics |
|
| Fund Net Assets |
$1,753 million |
| Number
of Holdings |
475 |
| Turnover
Rate |
28% |
| Net
Asset Value |
$15.70 |
| Market
Price |
$13.80 |
| Average
Market Capitalization1 |
$2,852 million |
| Weighted Average P/E Ratio 2,3 |
15.4x |
| Weighted Average P/B Ratio 2 |
2.1x |
| Active
Share 4 |
81% |
| U.S.
Investments (% of Net Assets) |
86.3% |
| Non-U.S.
Investments (% of Net Assets) |
13.3% |
| 1 | Geometric
Average. This weighted calculation uses each portfolio holding’s market cap
in a way designed to not skew the effect of very large or small holdings; instead, it
aims to better identify the portfolio’s center, which Royce believes offers a more
accurate measure of average market cap than a simple mean or median. |
| 2 | Harmonic
Average. This weighted calculation evaluates a portfolio as if it were a single stock
and measures it overall. It compares the total market value of the portfolio to the portfolio’s
share in the earnings or book value, as the case may be, of its underlying stocks. |
| 3 | The
Fund’s P/E Ratio calculation excludes companies with zero or negative earnings (15% of portfolio holdings as of 6/30/23). |
| 4 | Active
Share is the sum of the absolute values of the different weightings of each holding
in the Fund versus each holding in the benchmark, divided by two. |
Important Performance and Risk Information
All performance information reflects past performance, is presented on a total return basis, net of the Fund’s investment
advisory fee, reflects the reinvestment of distributions and does not reflect the deduction of taxes that a shareholder would
pay on Fund distributions or the sale of Fund shares. Past performance is no guarantee of future results. Current performance
may be higher or lower than performance quoted. Returns as of the most recent month-end may be obtained at www.royceinvest.com.
Certain immaterial adjustments were made to the net assets of Royce Value Trust at 12/31/22 for financial reporting purposes,
and as a result the net asset value originally calculated on that date and the total return based on that net asset value
differs from the adjusted net asset value and total return reported in the Financial Highlights. The market price of the Fund’s
shares will fluctuate, so that shares may be worth more or less than their original cost when sold. The Fund invests primarily
in securities of small- and micro-cap companies, which may involve considerably more risk than investing in larger-cap companies.
The Fund’s broadly diversified portfolio does not ensure a profit or guarantee against loss. From time to time, the
Fund may invest a significant portion of its net assets in foreign securities, which may involve political, economic, currency
and other risks not encountered in U.S. investments. Regarding the “Top Contributors” and “Top Detractors”
tables shown above, the sum of all contributors to, and all detractors from, performance for all securities in the portfolio
would approximate the Fund’s year-to date performance for 2023.
2023
Semiannual Report to Shareholders | 39
Royce
Value Trust
Schedule
of Investments
Common
Stocks – 98.6%
| | |
SHARES | | |
VALUE | |
| | |
| | |
| |
| COMMUNICATION SERVICES – 2.2% | |
| | | |
| | |
| DIVERSIFIED TELECOMMUNICATION SERVICES - 0.2% | |
| | | |
| | |
| Cogent Communications Holdings 1,2 | |
| 27,134 | | |
$ | 1,825,847 | |
| Liberty Latin America Cl. C 1,2,3 | |
| 83,228 | | |
| 717,425 | |
| | |
| | | |
| 2,543,272 | |
| ENTERTAINMENT - 0.0% | |
| | | |
| | |
| IMAX Corporation 3 | |
| 37,950 | | |
| 644,771 | |
| INTERACTIVE MEDIA & SERVICES - 1.7% | |
| | | |
| | |
| Cars.com 3 | |
| 182,200 | | |
| 3,611,204 | |
| QuinStreet 1,3 | |
| 203,754 | | |
| 1,799,148 | |
| Shutterstock | |
| 17,374 | | |
| 845,593 | |
| Yelp 3 | |
| 46,098 | | |
| 1,678,428 | |
| Ziff
Davis 1,2,3 | |
| 203,735 | | |
| 14,273,674 | |
| ZipRecruiter Cl. A 3 | |
| 25,140 | | |
| 446,486 | |
| †ZoomInfo
Technologies 3 | |
| 278,585 | | |
| 7,073,273 | |
| | |
| | | |
| 29,727,806 | |
| MEDIA - 0.3% | |
| | | |
| | |
| AMC Networks Cl. A 3 | |
| 37,495 | | |
| 448,065 | |
| Magnite 3 | |
| 31,550 | | |
| 430,658 | |
| Scholastic Corporation | |
| 12,091 | | |
| 470,219 | |
| TechTarget 1,3 | |
| 44,518 | | |
| 1,385,845 | |
| Thryv Holdings 3 | |
| 93,008 | | |
| 2,287,997 | |
| | |
| | | |
| 5,022,784 | |
| WIRELESS TELECOMMUNICATION SERVICES - 0.0% | |
| | | |
| | |
| †Gogo 3 | |
| 31,920 | | |
| 542,959 | |
| Total (Cost $44,559,656) | |
| | | |
| 38,481,592 | |
| | |
| | | |
| | |
| CONSUMER DISCRETIONARY – 10.1% | |
| | | |
| | |
| AUTOMOBILE COMPONENTS - 2.3% | |
| | | |
| | |
| †Atmus Filtration Technologies 3 | |
| 26,000 | | |
| 570,960 | |
| Dorman Products 1,2,3 | |
| 110,800 | | |
| 8,734,364 | |
| Fox Factory Holding Corporation 3 | |
| 41,800 | | |
| 4,535,718 | |
| Gentex Corporation 1 | |
| 205,670 | | |
| 6,017,904 | |
| LCI
Industries 1 | |
| 128,650 | | |
| 16,256,214 | |
| Patrick Industries 1,2 | |
| 47,231 | | |
| 3,778,480 | |
| †Vitesco Technologies Group 3,4 | |
| 4,414 | | |
| 363,470 | |
| | |
| | | |
| 40,257,110 | |
| AUTOMOBILES - 0.1% | |
| | | |
| | |
| Winnebago Industries | |
| 31,537 | | |
| 2,103,202 | |
| DISTRIBUTORS - 0.2% | |
| | | |
| | |
| LKQ Corporation 1,2 | |
| 67,000 | | |
| 3,904,090 | |
| Pool Corporation | |
| 300 | | |
| 112,392 | |
| | |
| | | |
| 4,016,482 | |
| DIVERSIFIED CONSUMER SERVICES - 0.4% | |
| | | |
| | |
| frontdoor 3 | |
| 16,079 | | |
| 512,920 | |
| Perdoceo Education 3 | |
| 102,225 | | |
| 1,254,301 | |
| Stride 3 | |
| 38,526 | | |
| 1,434,323 | |
| Universal Technical Institute 3 | |
| 639,032 | | |
| 4,415,711 | |
| | |
| | | |
| 7,617,255 | |
| HOTELS, RESTAURANTS & LEISURE - 0.6% | |
| | | |
| | |
| Bloomin’ Brands 1,2 | |
| 51,269 | | |
| 1,378,624 | |
| Century Casinos 3 | |
| 104,781 | | |
| 743,945 | |
| Denny’s Corporation 3 | |
| 80,377 | | |
| 990,245 | |
| Golden Entertainment 3 | |
| 20,659 | | |
| 863,546 | |
| Hilton Grand Vacations 3 | |
| 15,000 | | |
| 681,600 | |
| Lindblad Expeditions Holdings 3 | |
| 373,700 | | |
| 4,065,856 | |
| Monarch Casino & Resort | |
| 15,743 | | |
| 1,109,094 | |
| | |
| | | |
| 9,832,910 | |
| HOUSEHOLD DURABLES - 0.9% | |
| | | |
| | |
| Cavco Industries 1,3 | |
| 16,760 | | |
| 4,944,200 | |
| Ethan Allen Interiors 1,2 | |
| 59,931 | | |
| 1,694,849 | |
| Helen of Troy 3 | |
| 4,551 | | |
| 491,599 | |
| Installed Building Products | |
| 17,188 | | |
| 2,409,070 | |
| La-Z-Boy | |
| 20,347 | | |
| 582,738 | |
| M.D.C. Holdings | |
| 19,496 | | |
| 911,828 | |
| Skyline Champion 3 | |
| 15,470 | | |
| 1,012,511 | |
| TopBuild Corp. 3 | |
| 11,200 | | |
| 2,979,424 | |
| | |
| | | |
| 15,026,219 | |
| LEISURE PRODUCTS - 0.6% | |
| | | |
| | |
| Brunswick Corporation 1 | |
| 97,540 | | |
| 8,450,866 | |
| Sturm, Ruger & Company | |
| 12,302 | | |
| 651,514 | |
| Topgolf Callaway Brands 3 | |
| 18,000 | | |
| 357,300 | |
| Vista Outdoor 3 | |
| 18,338 | | |
| 507,412 | |
| YETI Holdings 3 | |
| 9,826 | | |
| 381,642 | |
| | |
| | | |
| 10,348,734 | |
| SPECIALTY RETAIL - 4.0% | |
| | | |
| | |
| Academy Sports and Outdoors 1 | |
| 83,547 | | |
| 4,515,715 | |
| America’s Car-Mart 1,3 | |
| 87,700 | | |
| 8,750,706 | |
| Asbury Automotive Group 3 | |
| 34,118 | | |
| 8,202,650 | |
| AutoCanada 3 | |
| 625,600 | | |
| 9,076,454 | |
| Barnes & Noble Education 3 | |
| 50,000 | | |
| 63,000 | |
| Camping World Holdings Cl. A 1 | |
| 279,113 | | |
| 8,401,301 | |
| CarMax 3 | |
| 8,500 | | |
| 711,450 | |
| Chico’s FAS 3 | |
| 95,740 | | |
| 512,209 | |
| Five Below 3 | |
| 9,375 | | |
| 1,842,563 | |
| Floor & Decor Holdings Cl. A 3 | |
| 13,635 | | |
| 1,417,495 | |
| Franchise Group Cl. A | |
| 50,091 | | |
| 1,434,606 | |
| Group 1 Automotive | |
| 3,933 | | |
| 1,015,107 | |
| Haverty Furniture | |
| 36,482 | | |
| 1,102,486 | |
| MarineMax 3 | |
| 13,734 | | |
| 469,154 | |
| Murphy USA | |
| 33,016 | | |
| 10,271,608 | |
| 1-800-FLOWERS.COM Cl. A 3 | |
| 76,000 | | |
| 592,800 | |
| OneWater Marine Cl. A 3 | |
| 14,172 | | |
| 513,593 | |
| PetMed Express | |
| 72,495 | | |
| 999,706 | |
| Signet Jewelers | |
| 94,196 | | |
| 6,147,231 | |
| †Valvoline 3 | |
| 84,985 | | |
| 3,187,787 | |
| Williams-Sonoma | |
| 2,500 | | |
| 312,850 | |
| Zumiez 3 | |
| 39,020 | | |
| 650,073 | |
| | |
| | | |
| 70,190,544 | |
| TEXTILES, APPAREL & LUXURY GOODS - 1.0% | |
| | | |
| | |
| Carter’s | |
| 5,950 | | |
| 431,970 | |
| Kontoor Brands | |
| 14,674 | | |
| 617,775 | |
| Movado Group | |
| 28,907 | | |
| 775,575 | |
| Ralph Lauren Cl. A | |
| 97,900 | | |
| 12,071,070 | |
| Steven Madden | |
| 119,156 | | |
| 3,895,210 | |
| Wolverine World Wide 1 | |
| 18,815 | | |
| 276,392 | |
| | |
| | | |
| 18,067,992 | |
| Total (Cost $147,745,184) | |
| | | |
| 177,460,448 | |
| CONSUMER STAPLES – 2.2% | |
| | | |
| | |
| BEVERAGES - 0.5% | |
| | | |
| | |
| Celsius Holdings 3 | |
| 4,500 | | |
| 671,355 | |
| Coca-Cola Consolidated 1,2 | |
| 8,000 | | |
| 5,088,160 | |
| National Beverage 3 | |
| 47,530 | | |
| 2,298,075 | |
| | |
| | | |
| 8,057,590 | |
| CONSUMER STAPLES DISTRIBUTION & RETAIL - 0.1% | |
| | | |
| | |
| PriceSmart | |
| 17,476 | | |
| 1,294,273 | |
| |
| | | |
| | |
| 40 | 2023 Semiannual Report
to Stockholders |
THE ACCOMPANYING NOTES ARE
AN INTEGRAL PART OF THESE FINANCIAL STATEMENTS |
June 30, 2023
(unaudited)
Schedule
of Investments (continued)
| | |
SHARES | | |
VALUE | |
| CONSUMER STAPLES (continued) | |
| | |
| |
| FOOD PRODUCTS - 1.0% | |
| | |
| |
| Cal-Maine Foods | |
| 24,743 | | |
$ | 1,113,435 | |
| CubicFarm Systems 3 | |
| 950,000 | | |
| 28,685 | |
| Freshpet 1,2,3 | |
| 33,000 | | |
| 2,171,730 | |
| J G Boswell Company 4 | |
| 3,940 | | |
| 2,568,880 | |
| John B. Sanfilippo & Son | |
| 8,672 | | |
| 1,016,965 | |
| Nomad Foods 1,3 | |
| 293,600 | | |
| 5,143,872 | |
| Seneca Foods Cl. A 3 | |
| 183,460 | | |
| 5,995,473 | |
| | |
| | | |
| 18,039,040 | |
| HOUSEHOLD PRODUCTS - 0.0% | |
| | | |
| | |
| Spectrum Brands Holdings | |
| 1,333 | | |
| 104,041 | |
| PERSONAL CARE PRODUCTS - 0.5% | |
| | | |
| | |
| Inter Parfums 1 | |
| 50,128 | | |
| 6,778,810 | |
| Nu Skin Enterprises Cl. A | |
| 18,396 | | |
| 610,747 | |
| USANA Health Sciences 3 | |
| 21,534 | | |
| 1,357,503 | |
| | |
| | | |
| 8,747,060 | |
| TOBACCO - 0.1% | |
| | | |
| | |
| Vector Group | |
| 179,919 | | |
| 2,304,762 | |
| Total (Cost $31,466,970) | |
| | | |
| 38,546,766 | |
| ENERGY – 2.7% | |
| | | |
| | |
| ENERGY EQUIPMENT & SERVICES - 0.6% | |
| | | |
| | |
| Bristow Group 1,3 | |
| 219,464 | | |
| 6,305,201 | |
| Core Laboratories | |
| 15,840 | | |
| 368,280 | |
| Pason Systems | |
| 355,845 | | |
| 3,086,363 | |
| RPC | |
| 3,600 | | |
| 25,740 | |
| | |
| | | |
| 9,785,584 | |
| OIL, GAS & CONSUMABLE FUELS - 2.1% | |
| | | |
| | |
| Civitas Resources | |
| 28,507 | | |
| 1,977,531 | |
| CONSOL Energy | |
| 16,417 | | |
| 1,113,237 | |
| Dorchester Minerals L.P. 1 | |
| 279,148 | | |
| 8,363,274 | |
| Dorian LPG | |
| 335,736 | | |
| 8,611,628 | |
| Magnolia Oil & Gas Cl. A 1 | |
| 134,935 | | |
| 2,820,141 | |
| Northern Oil and Gas | |
| 85,380 | | |
| 2,930,242 | |
| †Range Resources | |
| 95,140 | | |
| 2,797,116 | |
| REX American Resources 3 | |
| 24,824 | | |
| 864,123 | |
| †Sitio Royalties Cl. A | |
| 118,895 | | |
| 3,123,372 | |
| SM Energy | |
| 38,898 | | |
| 1,230,344 | |
| World Kinect 1 | |
| 193,580 | | |
| 4,003,234 | |
| | |
| | | |
| 37,834,242 | |
| Total (Cost $37,778,259) | |
| | | |
| 47,619,826 | |
| FINANCIALS – 14.5% | |
| | | |
| | |
| BANKS - 3.8% | |
| | | |
| | |
| Ameris Bancorp 1 | |
| 38,364 | | |
| 1,312,432 | |
| †Atlantic Union Bankshares | |
| 10,000 | | |
| 259,500 | |
| Axos Financial 3 | |
| 11,933 | | |
| 470,637 | |
| †Banc of California | |
| 41,013 | | |
| 474,930 | |
| †Bancorp (The) 3 | |
| 25,000 | | |
| 816,250 | |
| Bank of N.T. Butterfield & Son 1 | |
| 344,552 | | |
| 9,426,943 | |
| BankUnited 1 | |
| 261,327 | | |
| 5,631,597 | |
| Brookline Bancorp | |
| 34,898 | | |
| 305,008 | |
| Central Pacific Financial | |
| 46,400 | | |
| 728,944 | |
| Customers Bancorp 3 | |
| 61,632 | | |
| 1,864,984 | |
| Dime Community Bancshares | |
| 63,932 | | |
| 1,127,121 | |
| Farmers & Merchants Bank of Long Beach 4 | |
| 416 | | |
| 2,258,880 | |
| †First Bancorp | |
| 19,000 | | |
| 565,250 | |
| First BanCorp (Puerto Rico) | |
| 57,898 | | |
| 707,513 | |
| First Bancshares (The) | |
| 13,592 | | |
| 351,217 | |
| First Citizens BancShares Cl. A | |
| 10,169 | | |
| 13,051,403 | |
| First Hawaiian 1 | |
| 259,700 | | |
| 4,677,197 | |
| Hanmi Financial | |
| 162,745 | | |
| 2,429,783 | |
| HBT Financial | |
| 40,400 | | |
| 744,976 | |
| †Hingham Institution for Savings | |
| 1,392 | | |
| 296,747 | |
| Home BancShares | |
| 31,213 | | |
| 711,656 | |
| HomeStreet | |
| 89,966 | | |
| 532,599 | |
| †Hope Bancorp | |
| 75,469 | | |
| 635,449 | |
| Independent Bank Group | |
| 29,269 | | |
| 1,010,659 | |
| New York Community Bancorp | |
| 64,936 | | |
| 729,881 | |
| OFG Bancorp | |
| 21,084 | | |
| 549,871 | |
| Origin Bancorp | |
| 10,246 | | |
| 300,208 | |
| Preferred Bank | |
| 15,272 | | |
| 839,807 | |
| Territorial Bancorp | |
| 17 | | |
| 209 | |
| TowneBank | |
| 21,058 | | |
| 489,388 | |
| Triumph Financial 3 | |
| 35,708 | | |
| 2,168,190 | |
| †Valley National Bancorp | |
| 31,024 | | |
| 240,436 | |
| †Veritex Holdings | |
| 46,634 | | |
| 836,148 | |
| Virginia National Bankshares | |
| 96,671 | | |
| 3,107,973 | |
| †Washington Federal | |
| 23,341 | | |
| 619,003 | |
| Webster Financial 1,2 | |
| 134,200 | | |
| 5,066,050 | |
| Western Alliance Bancorp | |
| 41,878 | | |
| 1,527,291 | |
| | |
| | | |
| 66,866,130 | |
| CAPITAL MARKETS - 5.3% | |
| | | |
| | |
| Ares Management Cl. A 1 | |
| 43,500 | | |
| 4,191,225 | |
| Artisan Partners Asset Management Cl. A 1 | |
| 179,660 | | |
| 7,062,435 | |
| Avantax 3 | |
| 16,448 | | |
| 368,106 | |
| B. Riley Financial | |
| 39,200 | | |
| 1,802,416 | |
| Barings BDC | |
| 191,594 | | |
| 1,502,097 | |
| Blue Owl Capital Cl. A | |
| 55,900 | | |
| 651,235 | |
| Bolsa Mexicana de Valores | |
| 1,723,106 | | |
| 3,581,709 | |
| BrightSphere Investment Group | |
| 49,801 | | |
| 1,043,331 | |
| Donnelley Financial Solutions 1,2,3 | |
| 62,491 | | |
| 2,845,215 | |
| GCM Grosvenor Cl. A | |
| 767,911 | | |
| 5,790,049 | |
| Houlihan Lokey Cl. A 1 | |
| 40,900 | | |
| 4,020,879 | |
| Lazard Cl. A 1,2 | |
| 153,215 | | |
| 4,902,880 | |
| MarketWise Cl. A | |
| 500,000 | | |
| 1,000,000 | |
| Moelis & Company Cl. A | |
| 21,000 | | |
| 952,140 | |
| Morningstar 1 | |
| 4,142 | | |
| 812,122 | |
| Onex Corporation | |
| 85,000 | | |
| 4,694,810 | |
| P10 Cl. A | |
| 20,000 | | |
| 226,000 | |
| SEI
Investments 1 | |
| 304,000 | | |
| 18,124,480 | |
| Sprott | |
| 230,880 | | |
| 7,474,953 | |
| Tel Aviv Stock Exchange 3,4 | |
| 221,179 | | |
| 1,141,891 | |
| TMX Group | |
| 471,185 | | |
| 10,602,774 | |
| Tradeweb Markets Cl. A | |
| 143,555 | | |
| 9,830,646 | |
| | |
| | | |
| 92,621,393 | |
| CONSUMER FINANCE - 0.5% | |
| | | |
| | |
| Bread Financial Holdings | |
| 66,943 | | |
| 2,101,341 | |
| Encore Capital Group 1,2,3 | |
| 45,628 | | |
| 2,218,434 | |
| Enova International 3 | |
| 71,003 | | |
| 3,771,679 | |
| PRA Group 3 | |
| 10,152 | | |
| 231,973 | |
| | |
| | | |
| 8,323,427 | |
| FINANCIAL SERVICES - 1.3% | |
| | | |
| | |
| Banco Latinoamericano de Comercio | |
| | | |
| | |
| Exterior Cl. E | |
| 73,446 | | |
| 1,620,219 | |
| Compass Diversified Holdings | |
| 19,222 | | |
| 416,925 | |
| ECN Capital | |
| 888,800 | | |
| 1,791,354 | |
| THE ACCOMPANYING NOTES ARE AN INTEGRAL PART
OF THESE FINANCIAL STATEMENTS |
2023 Semiannual Report to Stockholders | 41 |
Royce
Value Trust
Schedule
of Investments (continued)
| | |
SHARES | | |
VALUE | |
| FINANCIALS (continued) | |
| | | |
| | |
| FINANCIAL SERVICES (continued) | |
| | | |
| | |
| EVERTEC | |
| 42,141 | | |
$ | 1,552,053 | |
| Mr. Cooper Group 1,2,3 | |
| 39,383 | | |
| 1,994,355 | |
| NewtekOne | |
| 336,358 | | |
| 5,348,092 | |
| NMI Holdings Cl. A 3 | |
| 149,262 | | |
| 3,853,945 | |
| Radian Group | |
| 32,534 | | |
| 822,459 | |
| Repay Holdings Cl. A 3 | |
| 193,959 | | |
| 1,518,699 | |
| Shift4 Payments Cl. A 3 | |
| 50,000 | | |
| 3,395,500 | |
| Waterloo Investment Holdings 3,5 | |
| 2,972,000 | | |
| 832,160 | |
| | |
| | | |
| 23,145,761 | |
| INSURANCE - 3.6% | |
| | | |
| | |
| Ambac Financial Group 3 | |
| 30,954 | | |
| 440,785 | |
| American Equity Investment Life Holding | |
| | | |
| | |
| Company 1,2 | |
| 68,094 | | |
| 3,548,378 | |
| Assured Guaranty | |
| 155,897 | | |
| 8,699,053 | |
| Axis Capital Holdings | |
| 8,613 | | |
| 463,638 | |
| E-L Financial | |
| 21,650 | | |
| 15,140,700 | |
| Erie Indemnity Cl. A | |
| 22,600 | | |
| 4,746,226 | |
| First American Financial | |
| 23,033 | | |
| 1,313,342 | |
| Genworth Financial Cl. A 3 | |
| 350,789 | | |
| 1,753,945 | |
| Hagerty Cl. A 3 | |
| 435,700 | | |
| 4,078,152 | |
| International General Insurance Holdings | |
| 205,316 | | |
| 1,833,472 | |
| James River Group Holdings | |
| 111,889 | | |
| 2,043,093 | |
| ProAssurance Corporation 1,2 | |
| 210,275 | | |
| 3,173,050 | |
| RenaissanceRe Holdings | |
| 22,454 | | |
| 4,188,120 | |
| RLI Corp. 1 | |
| 42,660 | | |
| 5,821,810 | |
| Safety Insurance Group | |
| 35,945 | | |
| 2,577,975 | |
| Stewart Information Services 1 | |
| 51,851 | | |
| 2,133,150 | |
| White Mountains Insurance Group | |
| 870 | | |
| 1,208,352 | |
| | |
| | | |
| 63,163,241 | |
| Total (Cost $243,209,341) | |
| | | |
| 254,119,952 | |
| HEALTH CARE – 9.9% | |
| | | |
| | |
| BIOTECHNOLOGY - 1.0% | |
| | | |
| | |
| Avid Bioservices 3 | |
| 178,000 | | |
| 2,486,660 | |
| Catalyst Pharmaceuticals 3 | |
| 56,438 | | |
| 758,527 | |
| Coherus BioSciences 3 | |
| 106,700 | | |
| 455,609 | |
| Dynavax Technologies 3 | |
| 154,362 | | |
| 1,994,357 | |
| Eagle Pharmaceuticals 1,3 | |
| 55,516 | | |
| 1,079,231 | |
| Ironwood Pharmaceuticals Cl. A 3 | |
| 273,169 | | |
| 2,906,518 | |
| PureTech Health 3,4 | |
| 175,100 | | |
| 480,943 | |
| REGENXBIO 3 | |
| 165,914 | | |
| 3,316,621 | |
| United Therapeutics 3 | |
| 10,000 | | |
| 2,207,500 | |
| Vanda Pharmaceuticals 3 | |
| 5,100 | | |
| 33,609 | |
| Vir Biotechnology 3 | |
| 102,900 | | |
| 2,524,137 | |
| | |
| | | |
| 18,243,712 | |
| HEALTH CARE EQUIPMENT & SUPPLIES - 3.3% | |
| | | |
| | |
| Atrion Corporation | |
| 1,882 | | |
| 1,064,647 | |
| Bioventus Cl. A 3 | |
| 50,000 | | |
| 144,500 | |
| Cutera 3 | |
| 15,650 | | |
| 236,784 | |
| Embecta Corp. | |
| 93,791 | | |
| 2,025,886 | |
| Enovis
Corporation 3 | |
| 258,600 | | |
| 16,581,432 | |
| Haemonetics
Corporation 3 | |
| 156,962 | | |
| 13,363,745 | |
| Integer Holdings Corporation 1,2,3 | |
| 75,700 | | |
| 6,707,777 | |
| Lantheus Holdings 3 | |
| 78,800 | | |
| 6,612,896 | |
| QuidelOrtho Corporation 3 | |
| 10,000 | | |
| 828,600 | |
| STAAR Surgical 3 | |
| 2,250 | | |
| 118,282 | |
| Surmodics 1,2,3 | |
| 161,000 | | |
| 5,040,910 | |
| TransMedics Group 3 | |
| 59,500 | | |
| 4,996,810 | |
| UFP Technologies 3 | |
| 1,790 | | |
| 346,992 | |
| Zynex 3 | |
| 59,329 | | |
| 568,965 | |
| | |
| | | |
| 58,638,226 | |
| HEALTH CARE PROVIDERS & SERVICES - 2.1% | |
| | | |
| | |
| Addus HomeCare 3 | |
| 15,373 | | |
| 1,425,077 | |
| AMN Healthcare Services 3 | |
| 77,984 | | |
| 8,509,614 | |
| Community Health Systems 3 | |
| 197,636 | | |
| 869,598 | |
| CorVel Corporation 3 | |
| 2,869 | | |
| 555,151 | |
| Cross Country Healthcare 3 | |
| 127,100 | | |
| 3,568,968 | |
| Fulgent Genetics 3 | |
| 39,117 | | |
| 1,448,503 | |
| NeoGenomics 3 | |
| 41,750 | | |
| 670,923 | |
| Pediatrix Medical Group 3 | |
| 34,687 | | |
| 492,902 | |
| †Privia Health Group 3 | |
| 304,400 | | |
| 7,947,884 | |
| Select Medical Holdings | |
| 95,900 | | |
| 3,055,374 | |
| U.S. Physical Therapy | |
| 62,300 | | |
| 7,562,597 | |
| | |
| | | |
| 36,106,591 | |
| HEALTH CARE TECHNOLOGY - 0.6% | |
| | | |
| | |
| Certara 3 | |
| 236,365 | | |
| 4,304,207 | |
| Doximity Cl. A 3 | |
| 35,750 | | |
| 1,216,215 | |
| Simulations Plus 1,2 | |
| 80,658 | | |
| 3,494,911 | |
| Veradigm 3 | |
| 114,881 | | |
| 1,447,500 | |
| | |
| | | |
| 10,462,833 | |
| LIFE SCIENCES TOOLS & SERVICES - 1.8% | |
| | | |
| | |
| Azenta 1,2,3 | |
| 219,100 | | |
| 10,227,588 | |
| Bio-Techne 1,2 | |
| 74,392 | | |
| 6,072,619 | |
| Harvard Bioscience 3 | |
| 102,050 | | |
| 560,255 | |
| Mesa Laboratories 1 | |
| 39,600 | | |
| 5,088,600 | |
| Stevanato Group | |
| 268,856 | | |
| 8,705,557 | |
| | |
| | | |
| 30,654,619 | |
| PHARMACEUTICALS - 1.1% | |
| | | |
| | |
| Cara Therapeutics 3 | |
| 202,300 | | |
| 572,509 | |
| Corcept Therapeutics 3 | |
| 289,751 | | |
| 6,446,960 | |
| Harmony Biosciences Holdings 3 | |
| 108,897 | | |
| 3,832,085 | |
| Innoviva | |
| 110,635 | | |
| 1,408,384 | |
| Ligand Pharmaceuticals 3 | |
| 5,238 | | |
| 377,660 | |
| †Pacira BioSciences 3 | |
| 81,770 | | |
| 3,276,524 | |
| Prestige Consumer Healthcare 3 | |
| 56,300 | | |
| 3,345,909 | |
| | |
| | | |
| 19,260,031 | |
| Total (Cost $156,207,016) | |
| | | |
| 173,366,012 | |
| | |
| | | |
| | |
| INDUSTRIALS – 28.3% | |
| | | |
| | |
| AEROSPACE & DEFENSE - 1.7% | |
| | | |
| | |
| Aerojet Rocketdyne Holdings 3 | |
| 27,666 | | |
| 1,518,034 | |
| AeroVironment 3 | |
| 2,650 | | |
| 271,042 | |
| Ducommun 1,3 | |
| 32,334 | | |
| 1,408,792 | |
| HEICO Corporation 1 | |
| 31,030 | | |
| 5,490,448 | |
| HEICO Corporation Cl. A 1 | |
| 36,533 | | |
| 5,136,540 | |
| Leonardo DRS 3 | |
| 366,885 | | |
| 6,361,786 | |
| Magellan Aerospace | |
| 893,092 | | |
| 5,622,485 | |
| Woodward 1 | |
| 28,500 | | |
| 3,388,935 | |
| | |
| | | |
| 29,198,062 | |
| AIR FREIGHT & LOGISTICS - 0.9% | |
| | | |
| | |
| Forward
Air 1 | |
| 136,450 | | |
| 14,478,710 | |
| †GXO Logistics 3 | |
| 9,000 | | |
| 565,380 | |
| Hub Group Cl. A 3 | |
| 15,516 | | |
| 1,246,245 | |
| | |
| | | |
| 16,290,335 | |
| BUILDING PRODUCTS - 2.5% | |
| | | |
| | |
| AAON | |
| 4,200 | | |
| 398,202 | |
| | |
| | | |
| | |
| 42 | 2023 Semiannual Report
to Stockholders |
THE ACCOMPANYING NOTES ARE
AN INTEGRAL PART OF THESE FINANCIAL STATEMENTS |
June 30, 2023
(unaudited)
Schedule
of Investments (continued)
| | |
SHARES | | |
VALUE | |
| INDUSTRIALS (continued) | |
| | |
| |
| BUILDING PRODUCTS (continued) | |
| | |
| |
| Advanced Drainage Systems | |
| 101,598 | | |
$ | 11,559,820 | |
| American Woodmark 3 | |
| 8,542 | | |
| 652,353 | |
| AZZ 1 | |
| 20,000 | | |
| 869,200 | |
| Builders FirstSource 1,2,3 | |
| 24,275 | | |
| 3,301,400 | |
| Carlisle Companies | |
| 3,600 | | |
| 923,508 | |
| CSW Industrials | |
| 43,000 | | |
| 7,146,170 | |
| PGT Innovations 3 | |
| 42,233 | | |
| 1,231,092 | |
| Quanex Building Products | |
| 59,784 | | |
| 1,605,200 | |
| Simpson Manufacturing 1 | |
| 40,500 | | |
| 5,609,250 | |
| UFP Industries | |
| 105,171 | | |
| 10,206,846 | |
| | |
| | | |
| 43,503,041 | |
| COMMERCIAL SERVICES & SUPPLIES - 2.9% | |
| | | |
| | |
| ACV Auctions Cl. A 3 | |
| 115,800 | | |
| 1,999,866 | |
| Brady Corporation Cl. A 1 | |
| 221,176 | | |
| 10,521,342 | |
| CompX International Cl. A 1 | |
| 183,197 | | |
| 3,993,694 | |
| Driven Brands Holdings 3 | |
| 457,862 | | |
| 12,389,746 | |
| GFL Environmental 1,2 | |
| 264,380 | | |
| 10,257,944 | |
| Healthcare Services Group 3 | |
| 28,117 | | |
| 419,787 | |
| Heritage-Crystal Clean 1,3 | |
| 112,516 | | |
| 4,251,980 | |
| HNI Corporation | |
| 9,705 | | |
| 273,487 | |
| RB Global 1 | |
| 120,249 | | |
| 7,214,940 | |
| | |
| | | |
| 51,322,786 | |
| CONSTRUCTION & ENGINEERING - 5.5% | |
| | | |
| | |
| Ameresco Cl. A 3 | |
| 25,000 | | |
| 1,215,750 | |
| APi
Group 1,3 | |
| 546,800 | | |
| 14,905,768 | |
| Arcosa 1 | |
| 164,599 | | |
| 12,471,666 | |
| Comfort Systems USA 1,2 | |
| 13,675 | | |
| 2,245,435 | |
| EMCOR Group | |
| 77,075 | | |
| 14,241,919 | |
| IES
Holdings 1,2,3 | |
| 268,939 | | |
| 15,297,250 | |
| MasTec 3 | |
| 78,980 | | |
| 9,317,271 | |
| MYR Group 3 | |
| 13,566 | | |
| 1,876,720 | |
| Northwest Pipe 3 | |
| 8,049 | | |
| 243,402 | |
| Valmont
Industries 1 | |
| 49,547 | | |
| 14,420,654 | |
| WillScot Mobile Mini Holdings Corp. 3 | |
| 226,840 | | |
| 10,840,684 | |
| | |
| | | |
| 97,076,519 | |
| ELECTRICAL EQUIPMENT - 1.7% | |
| | | |
| | |
| Atkore 3 | |
| 11,210 | | |
| 1,748,088 | |
| Encore Wire | |
| 19,310 | | |
| 3,590,308 | |
| GrafTech International | |
| 6,826 | | |
| 34,403 | |
| LSI Industries | |
| 496,657 | | |
| 6,238,012 | |
| Powell Industries | |
| 58,881 | | |
| 3,567,600 | |
| Preformed Line Products | |
| 58,600 | | |
| 9,147,460 | |
| †Vertiv Holdings Cl. A | |
| 204,704 | | |
| 5,070,518 | |
| | |
| | | |
| 29,396,389 | |
| GROUND TRANSPORTATION - 0.9% | |
| | | |
| | |
| ArcBest Corporation | |
| 21,268 | | |
| 2,101,278 | |
| Hertz Global Holdings 3 | |
| 5,000 | | |
| 91,950 | |
| Landstar
System 1 | |
| 67,982 | | |
| 13,089,254 | |
| †RXO 3 | |
| 26,837 | | |
| 608,395 | |
| | |
| | | |
| 15,890,877 | |
| MACHINERY - 7.4% | |
| | | |
| | |
| Allison Transmission Holdings | |
| 1,342 | | |
| 75,769 | |
| ATS Corporation 3 | |
| 15,150 | | |
| 697,032 | |
| Chart Industries 3 | |
| 62,260 | | |
| 9,948,526 | |
| Crane NXT | |
| 134,307 | | |
| 7,580,287 | |
| Douglas Dynamics | |
| 12,047 | | |
| 359,964 | |
| EnPro Industries | |
| 26,110 | | |
| 3,486,468 | |
| ESAB Corporation 1 | |
| 158,610 | | |
| 10,553,909 | |
| ESCO Technologies 1 | |
| 78,995 | | |
| 8,186,252 | |
| Helios Technologies 1 | |
| 44,900 | | |
| 2,967,441 | |
| Hillman Solutions 3 | |
| 190,000 | | |
| 1,711,900 | |
| John
Bean Technologies 1 | |
| 115,911 | | |
| 14,060,004 | |
| Kadant 1 | |
| 56,850 | | |
| 12,626,385 | |
| Lincoln Electric Holdings 1 | |
| 48,100 | | |
| 9,554,103 | |
| Lindsay Corporation 1 | |
| 70,900 | | |
| 8,461,206 | |
| Miller Industries | |
| 22,560 | | |
| 800,203 | |
| Mueller Industries 1,2 | |
| 28,299 | | |
| 2,469,937 | |
| RBC Bearings 3 | |
| 53,710 | | |
| 11,680,314 | |
| Standex International | |
| 48,715 | | |
| 6,891,711 | |
| Tennant Company 1 | |
| 80,500 | | |
| 6,529,355 | |
| Titan International 3 | |
| 39,790 | | |
| 456,789 | |
| Watts Water Technologies Cl. A 1 | |
| 55,000 | | |
| 10,105,150 | |
| | |
| | | |
| 129,202,705 | |
| MARINE TRANSPORTATION - 0.6% | |
| | | |
| | |
| Kirby Corporation 3 | |
| 129,225 | | |
| 9,943,864 | |
| PASSENGER AIRLINES - 0.1% | |
| | | |
| | |
| Sun Country Airlines Holdings 3 | |
| 88,126 | | |
| 1,981,072 | |
| PROFESSIONAL SERVICES - 2.5% | |
| | | |
| | |
| CBIZ 3 | |
| 9,000 | | |
| 479,520 | |
| Dun & Bradstreet Holdings | |
| 215,620 | | |
| 2,494,724 | |
| ExlService Holdings 3 | |
| 2,220 | | |
| 335,353 | |
| Exponent 1 | |
| 41,400 | | |
| 3,863,448 | |
| †First Advantage 3 | |
| 28,895 | | |
| 445,272 | |
| Forrester Research 1,2,3 | |
| 314,004 | | |
| 9,134,376 | |
| FTI Consulting 3 | |
| 41,490 | | |
| 7,891,398 | |
| Jacobs Solutions 1 | |
| 33,500 | | |
| 3,982,815 | |
| KBR 1,2 | |
| 145,632 | | |
| 9,474,818 | |
| Korn Ferry 1 | |
| 106,932 | | |
| 5,297,411 | |
| Paycor HCM 3 | |
| 17,745 | | |
| 420,024 | |
| Resources Connection | |
| 29,103 | | |
| 457,208 | |
| TrueBlue 3 | |
| 26,363 | | |
| 466,889 | |
| | |
| | | |
| 44,743,256 | |
| TRADING COMPANIES & DISTRIBUTORS - 1.6% | |
| | | |
| | |
| Air Lease Cl. A 1,2 | |
| 150,177 | | |
| 6,284,907 | |
| Applied Industrial Technologies | |
| 20,800 | | |
| 3,012,464 | |
| Boise Cascade 1 | |
| 14,365 | | |
| 1,297,878 | |
| †Core & Main Cl. A 3 | |
| 96,395 | | |
| 3,021,019 | |
| Distribution Solutions Group 3 | |
| 25,228 | | |
| 1,313,370 | |
| FTAI Aviation | |
| 113,587 | | |
| 3,596,164 | |
| GMS 3 | |
| 20,062 | | |
| 1,388,290 | |
| Hudson Technologies 3 | |
| 37,787 | | |
| 363,511 | |
| MSC Industrial Direct Cl. A | |
| 2,014 | | |
| 191,894 | |
| Richelieu Hardware | |
| 7,800 | | |
| 246,703 | |
| SiteOne Landscape Supply 1,2,3 | |
| 25,000 | | |
| 4,184,000 | |
| Transcat 3 | |
| 33,350 | | |
| 2,845,089 | |
| Veritiv | |
| 4,318 | | |
| 542,384 | |
| | |
| | | |
| 28,287,673 | |
| Total (Cost $321,649,004) | |
| | | |
| 496,836,579 | |
| INFORMATION TECHNOLOGY – 15.9% | |
| | | |
| | |
| COMMUNICATIONS EQUIPMENT - 1.6% | |
| | | |
| | |
| Calix 1,3 | |
| 196,325 | | |
| 9,798,581 | |
| Digi International 3 | |
| 38,250 | | |
| 1,506,667 | |
| Extreme Networks 3 | |
| 40,152 | | |
| 1,045,960 | |
| Harmonic 3 | |
| 755,925 | | |
| 12,223,307 | |
| THE ACCOMPANYING NOTES ARE AN INTEGRAL PART
OF THESE FINANCIAL STATEMENTS |
2023 Semiannual Report to Stockholders | 43 |
Royce
Value Trust
Schedule
of Investments (continued)
| | |
SHARES | | |
VALUE | |
| INFORMATION TECHNOLOGY (continued) | |
| | |
| |
| COMMUNICATIONS EQUIPMENT (continued) | |
| | |
| |
| NetScout Systems 3 | |
| 102,804 | | |
$ | 3,181,784 | |
| | |
| | | |
| 27,756,299 | |
| ELECTRONIC EQUIPMENT, INSTRUMENTS & COMPONENTS - 5.3% | |
| | | |
| | |
| Badger Meter | |
| 3,625 | | |
| 534,905 | |
| Cognex Corporation 1,2 | |
| 171,900 | | |
| 9,629,838 | |
| Coherent 1,2,3 | |
| 5,692 | | |
| 290,178 | |
| CTS Corporation | |
| 20,064 | | |
| 855,328 | |
| Fabrinet
1,2,3 | |
| 155,801 | | |
| 20,235,434 | |
| FARO Technologies 1,2,3 | |
| 237,997 | | |
| 3,855,551 | |
| IPG Photonics 3 | |
| 51,100 | | |
| 6,940,402 | |
| Kimball Electronics 3 | |
| 33,833 | | |
| 934,806 | |
| Littelfuse 1,2 | |
| 23,700 | | |
| 6,904,047 | |
| Luna Innovations 3 | |
| 86,450 | | |
| 788,424 | |
| Mirion Technologies Cl. A 3 | |
| 225,000 | | |
| 1,901,250 | |
| †NAPCO Security Technologies | |
| 22,000 | | |
| 762,300 | |
| PAR Technology 1,3 | |
| 369,239 | | |
| 12,159,040 | |
| PC Connection | |
| 13,276 | | |
| 598,748 | |
| Richardson Electronics | |
| 394,763 | | |
| 6,513,589 | |
| Rogers Corporation 3 | |
| 45,800 | | |
| 7,416,394 | |
| Sanmina Corporation 3 | |
| 34,660 | | |
| 2,088,958 | |
| Teledyne Technologies 3 | |
| 2,500 | | |
| 1,027,775 | |
| TTM Technologies 1,2,3 | |
| 333,925 | | |
| 4,641,558 | |
| Vishay Precision Group 3 | |
| 19,850 | | |
| 737,428 | |
| Vontier Corporation | |
| 98,595 | | |
| 3,175,745 | |
| | |
| | | |
| 91,991,698 | |
| IT SERVICES - 0.6% | |
| | | |
| | |
| Computer Task Group 3 | |
| 60,810 | | |
| 462,764 | |
| Hackett Group (The) 1 | |
| 306,320 | | |
| 6,846,252 | |
| Kyndryl Holdings 3 | |
| 144,889 | | |
| 1,924,126 | |
| Unisys Corporation 1,2,3 | |
| 256,698 | | |
| 1,021,658 | |
| | |
| | | |
| 10,254,800 | |
| SEMICONDUCTORS & SEMICONDUCTOR EQUIPMENT - 5.6% | |
| | | |
| | |
| Axcelis Technologies 3 | |
| 28,884 | | |
| 5,295,304 | |
| AXT 3 | |
| 106,100 | | |
| 364,984 | |
| Camtek 3 | |
| 26,300 | | |
| 937,069 | |
| Cirrus Logic 1,3 | |
| 59,500 | | |
| 4,820,095 | |
| Cohu 3 | |
| 10,260 | | |
| 426,406 | |
| Diodes 1,2,3 | |
| 69,650 | | |
| 6,441,928 | |
| FormFactor 3 | |
| 353,147 | | |
| 12,084,690 | |
| Impinj 1,2,3 | |
| 65,945 | | |
| 5,911,969 | |
| indie Semiconductor Cl. A 3 | |
| 31,000 | | |
| 291,400 | |
| Kulicke & Soffa Industries 1 | |
| 39,331 | | |
| 2,338,228 | |
| MaxLinear 3 | |
| 123,562 | | |
| 3,899,617 | |
| MKS Instruments | |
| 198,568 | | |
| 21,465,201 | |
| Onto Innovation 1,3 | |
| 62,600 | | |
| 7,291,022 | |
| Photronics 3 | |
| 259,677 | | |
| 6,697,070 | |
| Power Integrations | |
| 13,460 | | |
| 1,274,258 | |
| Rambus 3 | |
| 131,427 | | |
| 8,433,671 | |
| †Semtech Corporation 3 | |
| 16,345 | | |
| 416,144 | |
| SiTime Corporation 3 | |
| 57,184 | | |
| 6,745,996 | |
| SMART Global Holdings 3 | |
| 24,080 | | |
| 698,561 | |
| Ultra Clean Holdings 3 | |
| 68,070 | | |
| 2,617,972 | |
| | |
| | | |
| 98,451,585 | |
| SOFTWARE - 2.4% | |
| | | |
| | |
| Adeia 1 | |
| 115,561 | | |
| 1,272,327 | |
| Agilysys 3 | |
| 37,500 | | |
| 2,574,000 | |
| Alkami Technology 3 | |
| 614,441 | | |
| 10,070,688 | |
| †AppLovin Corporation Cl. A 3 | |
| 32,585 | | |
| 838,412 | |
| Consensus Cloud Solutions 1,2,3 | |
| 32,813 | | |
| 1,017,203 | |
| Descartes Systems Group (The) 3 | |
| 5,000 | | |
| 400,550 | |
| E2open Parent Holdings Cl. A 3 | |
| 100,000 | | |
| 560,000 | |
| InterDigital | |
| 16,651 | | |
| 1,607,654 | |
| JFrog 3 | |
| 200,000 | | |
| 5,540,000 | |
| Matterport Cl. A 3 | |
| 150,000 | | |
| 472,500 | |
| nCino 3 | |
| 17,987 | | |
| 541,768 | |
| Progress Software | |
| 78,542 | | |
| 4,563,290 | |
| †PROS Holdings 3 | |
| 124,395 | | |
| 3,831,366 | |
| Sapiens International | |
| 68,451 | | |
| 1,820,797 | |
| Sprout Social Cl. A 3 | |
| 8,000 | | |
| 369,280 | |
| Teradata Corporation 3 | |
| 19,088 | | |
| 1,019,490 | |
| Upland Software 3 | |
| 100,000 | | |
| 360,000 | |
| Workiva Cl. A 3 | |
| 59,275 | | |
| 6,025,896 | |
| | |
| | | |
| 42,885,221 | |
| TECHNOLOGY HARDWARE, STORAGE & PERIPHERALS - 0.4% | |
| | | |
| | |
| Avid Technology 1,2,3 | |
| 263,056 | | |
| 6,707,928 | |
| Total (Cost $225,107,589) | |
| | | |
| 278,047,531 | |
| | |
| | | |
| | |
| MATERIALS – 9.0% | |
| | | |
| | |
| CHEMICALS - 4.2% | |
| | | |
| | |
| AdvanSix 1 | |
| 38,299 | | |
| 1,339,699 | |
| American Vanguard 1 | |
| 151,030 | | |
| 2,698,906 | |
| Aspen Aerogels 3 | |
| 47,200 | | |
| 372,408 | |
| Chase Corporation 1,2 | |
| 49,829 | | |
| 6,040,271 | |
| Element Solutions 1 | |
| 451,426 | | |
| 8,667,379 | |
| Hawkins 1 | |
| 89,940 | | |
| 4,289,239 | |
| Innospec 1 | |
| 126,233 | | |
| 12,678,842 | |
| Minerals
Technologies 1 | |
| 224,016 | | |
| 12,923,483 | |
| NewMarket Corporation | |
| 8,000 | | |
| 3,216,960 | |
| Quaker Houghton | |
| 92,631 | | |
| 18,053,782 | |
| Scotts Miracle-Gro Cl. A | |
| 45,304 | | |
| 2,840,108 | |
| | |
| | | |
| 73,121,077 | |
| CONTAINERS & PACKAGING - 0.0% | |
| | | |
| | |
| Graphic Packaging Holding Company | |
| 6,325 | | |
| 151,990 | |
| Silgan Holdings | |
| 3,423 | | |
| 160,504 | |
| | |
| | | |
| 312,494 | |
| METALS & MINING - 3.8% | |
| | | |
| | |
| Alamos Gold Cl. A | |
| 1,976,000 | | |
| 23,537,483 | |
| †AMG Critical Materials 4 | |
| 14,000 | | |
| 725,124 | |
| Gold Fields ADR | |
| 536,500 | | |
| 7,419,795 | |
| Haynes International 1 | |
| 102,500 | | |
| 5,209,050 | |
| Hecla Mining | |
| 321,300 | | |
| 1,654,695 | |
| IAMGOLD Corporation 3 | |
| 500,000 | | |
| 1,315,000 | |
| Major Drilling Group International 3 | |
| 1,496,691 | | |
| 10,326,292 | |
| Materion Corporation | |
| 25,000 | | |
| 2,855,000 | |
| Newcrest Mining | |
| 33,909 | | |
| 603,822 | |
| †Olympic Steel | |
| 20,962 | | |
| 1,027,138 | |
| Reliance Steel & Aluminum 1 | |
| 18,300 | | |
| 4,970,097 | |
| †Ryerson Holding Corporation | |
| 6,700 | | |
| 290,646 | |
| TimkenSteel Corporation 3 | |
| 76,496 | | |
| 1,650,019 | |
| Worthington Industries 1 | |
| 64,300 | | |
| 4,466,921 | |
| | |
| | | |
| 66,051,082 | |
| PAPER & FOREST PRODUCTS - 1.0% | |
| | | |
| | |
| Clearwater Paper 3 | |
| 29,569 | | |
| 926,101 | |
| Glatfelter Corporation 3 | |
| 210,400 | | |
| 635,408 | |
| Louisiana-Pacific | |
| 78,910 | | |
| 5,916,672 | |
| Mercer International | |
| 143,486 | | |
| 1,157,932 | |
| 44 | 2023 Semiannual Report
to Stockholders |
THE ACCOMPANYING NOTES ARE
AN INTEGRAL PART OF THESE FINANCIAL STATEMENTS |
June 30, 2023
(unaudited)
Schedule
of Investments (continued)
| | |
SHARES | | |
VALUE | |
| MATERIALS (continued) | |
| | | |
| | |
| PAPER & FOREST PRODUCTS (continued) | |
| | | |
| | |
| Stella-Jones | |
| 142,050 | | |
$ | 7,315,079 | |
| Sylvamo Corporation 1 | |
| 38,124 | | |
| 1,542,116 | |
| | |
| | | |
| 17,493,308 | |
| Total (Cost $105,215,675) | |
| | | |
| 156,977,961 | |
| REAL ESTATE – 3.7% | |
| | | |
| | |
| DIVERSIFIED REITS - 0.0% | |
| | | |
| | |
| New York REIT 3,5 | |
| 15,000 | | |
| 166,950 | |
| REAL ESTATE MANAGEMENT & DEVELOPMENT - 3.7% | |
| | | |
| | |
| Anywhere Real Estate 3 | |
| 86,842 | | |
| 580,104 | |
| Colliers International Group | |
| 79,100 | | |
| 7,766,829 | |
| DigitalBridge Group Cl. A | |
| 379,627 | | |
| 5,584,313 | |
| Douglas Elliman | |
| 96,286 | | |
| 213,755 | |
| FirstService Corporation | |
| 105,755 | | |
| 16,295,788 | |
| FRP Holdings 1,3 | |
| 76,558 | | |
| 4,407,444 | |
| Kennedy-Wilson Holdings 1 | |
| 690,018 | | |
| 11,267,994 | |
| Marcus & Millichap 1 | |
| 305,907 | | |
| 9,639,130 | |
| St. Joe Company (The) 1,2 | |
| 78,800 | | |
| 3,809,192 | |
| Tejon Ranch 1,3 | |
| 313,818 | | |
| 5,400,808 | |
| | |
| | | |
| 64,965,357 | |
| Total (Cost $50,330,574) | |
| | | |
| 65,132,307 | |
| UTILITIES – 0.1% | |
| | | |
| | |
| ELECTRIC UTILITIES - 0.1% | |
| | | |
| | |
| †Otter Tail | |
| 8,037 | | |
| 634,601 | |
| GAS UTILITIES - 0.0% | |
| | | |
| | |
| Chesapeake Utilities | |
| 4,670 | | |
| 555,730 | |
| WATER UTILITIES - 0.0% | |
| | | |
| | |
| American States Water | |
| 5,162 | | |
| 449,094 | |
| Total (Cost $1,583,274) | |
| | | |
| 1,639,425 | |
| TOTAL COMMON STOCKS | |
| | | |
| | |
| (Cost $1,364,852,542) | |
| | | |
| 1,728,228,399 | |
| | |
| | | |
| | |
| DIVERSIFIED INVESTMENT COMPANIES – 1.0% | |
| | |
|
| | |
| | |
| |
| DIVERSIFIED INVESTMENT COMPANIES – 0.0% | |
| | |
|
| CLOSED-END FUNDS - 0.0% | |
| | | |
| | |
| Eagle Point Credit | |
| 42,054 | | |
| 427,269 | |
| Total (Cost $370,947) | |
| | | |
| 427,269 | |
| FINANCIALS – 0.3% | |
| | | |
| | |
| INVESTMENT COMPANIES - 0.3% | |
| | | |
| | |
| iShares S&P Small-Cap 600 Growth ETF | |
| 17,700 | | |
| 2,034,261 | |
| †ProShares Ultra SmallCap600 | |
| 25,000 | | |
| 552,230 | |
| SPDR S&P 600 Small Cap Value ETF | |
| 38,900 | | |
| 3,002,691 | |
| Total (Cost $5,578,944) | |
| | | |
| 5,589,182 | |
| MATERIALS – 0.7% | |
| | | |
| | |
| METALS & MINING - 0.7% | |
| | | |
| | |
| VanEck Junior Gold Miners ETF | |
| 319,426 | | |
| 11,390,731 | |
| Total (Cost $11,325,297) | |
| | | |
| 11,390,731 | |
| TOTAL DIVERSIFIED INVESTMENT COMPANIES | |
| | | |
| | |
| (Cost $17,275,188) | |
| | | |
| 17,407,182 | |
| WARRANTS
– 0.0% | |
| | | |
| | |
| HEALTH CARE – 0.0% | |
| | | |
| | |
| HEALTH CARE PROVIDERS & SERVICES - 0.0% | |
| | | |
| | |
| Cano Health (Warrants) 3 | |
| 49,999 | | |
| 10,505 | |
| (Cost $237,495) | |
| | | |
| 10,505 | |
| REPURCHASE AGREEMENT– 2.3% | |
| | | |
| | |
| Fixed Income Clearing Corporation, 3.00% dated 6/30/23, due 7/3/23, maturity value | |
| | | |
| | |
| $40,583,164 (collateralized by obligations of various U.S. Government Agencies, | |
| | | |
| | |
| 3.75%-4.25% due 5/31/30-11/15/40, valued at $41,384,515) | |
| | | |
| | |
| (Cost $40,573,021) | |
| | | |
| 40,573,021 | |
| TOTAL INVESTMENTS – 101.9% | |
| | | |
| | |
| (Cost $1,422,938,246) | |
| | | |
| 1,786,219,107 | |
| LIABILITIES LESS CASH AND OTHER ASSETS – (1.9)% | |
| | | |
| (32,966,069 | ) |
| | |
| | | |
| | |
| NET ASSETS – 100.0% | |
| | | |
$ | 1,753,253,038 | |
ADR – American Depository Receipt
| 1 | All or a portion of these securities were pledged as collateral in connection with the Fund’s revolving
credit agreement as of June 30, 2023. Total market value of pledged securities as of June 30, 2023, was $72,261,762. |
| 2 | As of June 30, 2023, a portion of these securities, in the aggregate amount of $33,187,703, were
rehypothecated by BNP Paribas Prime Brokerage International, Limited in connection with the Fund’s revolving credit agreement.
See Notes to Financial Statements. |
| 4 | These securities are defined as Level 2 securities due to fair value being based on quoted prices
for similar securities and/or due to the application of fair value factors. See Notes to Financial Statements. |
| 5 | Securities for which market quotations are not readily available represent
0.1% of net assets. These securities have been valued at their fair value under procedures approved by the Fund’s Board of Directors.
These securities are defined as Level 3 securities due to the use of significant unobservable inputs in the determination of fair
value. See Notes to Financial Statements. |
Bold indicates the Fund’s 20
largest equity holdings in terms of June 30, 2023, market value.
TAX INFORMATION:
The cost of total investments for Federal income tax purposes was $1,425,824,093. As of June 30, 2023, net unrealized appreciation
for all securities was $360,395,014 consisting of aggregate gross unrealized appreciation of $475,663,950 and aggregate gross unrealized
depreciation of $115,268,936. The primary cause of the difference between book and tax basis cost is the timing of the recognition
of losses on securities sold.
| THE ACCOMPANYING NOTES ARE AN INTEGRAL PART
OF THESE FINANCIAL STATEMENTS |
2023 Semiannual Report to Stockholders | 45 |
| Royce Value
Trust | June
30, 2023 (unaudited) |
Statement
of Assets and Liabilities
| ASSETS: | |
| |
Investments
at value | |
$ | 1,745,646,086 | |
| Repurchase
agreements (at cost and value) | |
| 40,573,021 | |
| Foreign
currency (cost $46,777) | |
| 46,780 | |
| Receivable
for investments sold | |
| 6,509,892 | |
| Receivable
for dividends and interest | |
| 674,484 | |
| Prepaid
expenses and other assets | |
| 475,346 | |
| Total
Assets | |
| 1,793,925,609 | |
| LIABILITIES: | |
| | |
Revolving
credit agreement | |
| 35,000,000 | |
| Payable
for investments purchased | |
| 3,118,938 | |
| Payable
for investment advisory fee | |
| 1,840,921 | |
| Payable
for directors’ fees | |
| 46,218 | |
| Payable
for interest expense | |
| 182,661 | |
| Accrued
expenses | |
| 483,833 | |
| Total
Liabilities | |
| 40,672,571 | |
| Net
Assets | |
$ | 1,753,253,038 | |
| ANALYSIS OF NET ASSETS: | |
| | |
Paid-in
capital - $0.001 par value per share; 111,670,784 shares outstanding (150,000,000 shares
authorized) | |
$ | 1,383,536,363 | |
| Total
distributable earnings (loss) | |
| 427,106,726 | |
| Quarterly
distributions | |
| (57,390,051 | ) |
| Net
Assets (net asset value per share - $15.70) | |
$ | 1,753,253,038 | |
| Investments
at identified cost | |
$ | 1,382,365,225 | |
| 46 | 2023 Semiannual Report to Stockholders | THE
ACCOMPANYING NOTES ARE AN INTEGRAL PART OF THESE FINANCIAL STATEMENTS |
| Royce Value
Trust | Six
Months Ended June 30, 2023 (unaudited) |
Statement
of Operations INVESTMENT
INCOME: | |
| |
| INCOME: | |
| |
Dividends | |
$ | 10,867,297 | |
| Foreign
withholding tax | |
| (169,177 | ) |
| Interest | |
| 522,483 | |
| Rehypothecation
income | |
| 3,640 | |
| Total
income | |
| 11,224,243 | |
| EXPENSES: | |
| | |
| Investment
advisory fees | |
| 8,317,854 | |
| Interest
expense | |
| 1,044,915 | |
| Administrative
and office facilities | |
| 402,500 | |
| Stockholder
reports | |
| 199,223 | |
| Custody
and transfer agent fees | |
| 112,051 | |
| Directors’
fees | |
| 91,670 | |
| Professional
fees | |
| 60,959 | |
| Other
expenses | |
| 89,958 | |
| Total
expenses | |
| 10,319,130 | |
| Net
investment income (loss) | |
| 905,113 | |
REALIZED
AND UNREALIZED GAIN (LOSS) ON INVESTMENTS AND FOREIGN CURRENCY: NET
REALIZED GAIN (LOSS): | |
| |
| Investments | |
| 65,485,619 | |
| Foreign
currency transactions | |
| (41,342 | ) |
| NET
CHANGE IN UNREALIZED APPRECIATION (DEPRECIATION): | |
| | |
| Investments | |
| 115,894,444 | |
| Other
assets and liabilities denominated in foreign currency | |
| (6,922 | ) |
| Net
realized and unrealized gain (loss) on investments and foreign currency | |
| 181,331,799 | |
| NET
INCREASE (DECREASE) IN NET ASSETS FROM INVESTMENT OPERATIONS | |
$ | 182,236,912 | |
| THE ACCOMPANYING
NOTES ARE AN INTEGRAL PART OF THESE FINANCIAL STATEMENTS | 2023
Semiannual Report to Stockholders | 47 |
Statement
of Changes in Net Assets
| | |
SIX
MONTHS ENDED | | |
| |
| | |
6/30/23 (UNAUDITED) | | |
YEAR
ENDED 12/31/22 | |
INVESTMENT
OPERATIONS: Net
investment income (loss) | |
$ | 905,113 | | |
$ | 6,839,471 | |
| Net
realized gain (loss) on investments and foreign currency | |
| 65,444,277 | | |
| 79,828,689 | |
| Net
change in unrealized appreciation (depreciation) on investments and foreign currency | |
| 115,887,522 | | |
| (547,272,242 | ) |
| Net
increase (decrease) in net assets from investment operations | |
| 182,236,912 | | |
| (460,604,082 | ) |
DISTRIBUTIONS: Total
distributable earnings | |
| (57,390,051 | ) | |
| (121,045,358 | ) |
| Return
of capital | |
| – | | |
| (20,627,640 | ) |
| Total
distributions | |
| (57,390,051 | ) | |
| (141,672,998 | ) |
CAPITAL
STOCK TRANSACTIONS: Reinvestment
of distributions | |
| 23,226,805 | | |
| 57,586,181 | |
| Total
capital stock transactions | |
| 23,226,805 | | |
| 57,586,181 | |
| Net
Increase (Decrease) In Net Assets | |
| 148,073,666 | | |
| (544,690,899 | ) |
| NET ASSETS: | |
| | | |
| | |
| Beginning
of period | |
| 1,605,179,372 | | |
| 2,149,870,271 | |
| End
of period | |
$ | 1,753,253,038 | | |
$ | 1,605,179,372 | |
| 48 |
2023 Semiannual Report to Stockholders | THE
ACCOMPANYING NOTES ARE AN INTEGRAL PART OF THESE FINANCIAL STATEMENTS |
| Royce Value
Trust | Six
Months Ended June 30, 2023 (unaudited) |
Statement
of Cash Flows
CASH
FLOWS FROM OPERATING ACTIVITIES: | |
| |
| Net
increase (decrease) in net assets from investment operations | |
$ | 182,236,912 | |
| Adjustments
to reconcile net increase (decrease) in net assets from investment operations to net cash provided by operating activities: | |
| | |
| Purchases
of long-term investments | |
| (531,174,293 | ) |
| Proceeds
from sales and maturities of long-term investments | |
| 487,730,065 | |
| Net
purchases, sales and maturities of short-term investments | |
| 75,376,407 | |
| Net
(increase) decrease in dividends and interest receivable and other assets | |
| 660,782 | |
| Net
increase (decrease) in interest expense payable, accrued expenses and other liabilities | |
| 717,556 | |
| Net
change in unrealized appreciation (depreciation) on investments | |
| (115,894,444 | ) |
| Net
realized gain (loss) on investments | |
| (65,485,619 | ) |
| Net
cash provided by operating activities | |
| 34,167,366 | |
| CASH
FLOWS FROM FINANCING ACTIVITIES: | |
| | |
| Distributions
net of reinvestment (reinvestment $23,226,805) | |
| (34,163,246 | ) |
| Net
cash used for financing activities | |
| (34,163,246 | ) |
| INCREASE
(DECREASE) IN CASH: | |
| 4,120 | |
| Cash
and foreign currency at beginning of period | |
| 42,660 | |
| Cash
and foreign currency at end of period | |
$ | 46,780 | |
| | |
| | |
Supplemental
disclosure of cash flow information:
For
the six months ended June 30, 2023, the Fund paid $1,021,329 in interest expense.
| THE ACCOMPANYING
NOTES ARE AN INTEGRAL PART OF THESE FINANCIAL STATEMENTS | 2023
Semiannual Report to Stockholders | 49 |
Financial
Highlights
This
table is presented to show selected data for a share of Common Stock outstanding throughout each period, and to assist stockholders
in evaluating the Fund’s performance for the periods presented.
| | |
SIX MONTHS | |
YEARS ENDED |
| | |
ENDED 6/30/23 | |
| |
| |
| |
| |
|
| | |
(UNAUDITED) | |
12/31/22 | |
12/31/21 | |
12/31/20 | |
12/31/19 | |
12/31/18 |
| Net Asset Value, Beginning of Period | |
$ | 14.60 | | |
$ | 20.29 | | |
$ | 18.52 | | |
$ | 16.58 | | |
$ | 13.73 | | |
$ | 17.50 | |
| INVESTMENT OPERATIONS: | |
| | | |
| | | |
| | | |
| | | |
| | | |
| | |
| Net investment income (loss) | |
| 0.01 | | |
| 0.06 | | |
| 0.04 | 1 | |
| 0.03 | | |
| 0.11 | | |
| 0.18 | |
| Net realized and unrealized gain (loss) on investments and foreign currency | |
| 1.64 | | |
| (4.40 | ) | |
| 3.46 | | |
| 3.02 | | |
| 3.90 | | |
| (2.46 | ) |
| Net increase (decrease) in net assets from investment operations | |
| 1.65 | | |
| (4.34 | ) | |
| 3.50 | | |
| 3.05 | | |
| 4.01 | | |
| (2.28 | ) |
| DISTRIBUTIONS: | |
| | | |
| | | |
| | | |
| | | |
| | | |
| | |
| Net investment income | |
| (0.01 | )2 | |
| (0.12 | ) | |
| (0.02 | ) | |
| (0.09 | ) | |
| (0.11 | ) | |
| (0.19 | ) |
| Net realized gain on investments and foreign currency | |
| (0.40 | )2 | |
| (1.01 | ) | |
| (1.65 | ) | |
| (0.95 | ) | |
| (0.99 | ) | |
| (1.07 | ) |
| Return of capital | |
| (0.11 | )2 | |
| (0.19 | ) | |
| – | | |
| – | | |
| – | | |
| – | |
| Total distributions | |
| (0.52 | ) | |
| (1.32 | ) | |
| (1.67 | ) | |
| (1.04) | | |
| (1.10) | | |
| (1.26 | ) |
| CAPITAL STOCK TRANSACTIONS: | |
| | | |
| | | |
| | | |
| | | |
| | | |
| | |
| Effect of reinvestment of distributions by Common Stockholders | |
| (0.03 | ) | |
| (0.03 | ) | |
| (0.06 | ) | |
| (0.07 | ) | |
| (0.06 | ) | |
| (0.06 | ) |
| Effect of rights offering | |
| | | |
| | | |
| | | |
| | | |
| | | |
| (0.17 | ) |
| Total capital stock transactions | |
| (0.03 | ) | |
| (0.03 | ) | |
| (0.06 | ) | |
| (0.07 | ) | |
| (0.06 | ) | |
| (0.23 | ) |
| Net Asset Value, End of Period | |
$ | 15.70 | | |
$ | 14.60 | | |
$ | 20.29 | | |
$ | 18.52 | | |
$ | 16.58 | | |
$ | 13.73 | |
| Market Value, End of Period | |
$ | 13.80 | | |
$ | 13.26 | | |
$ | 19.59 | | |
$ | 16.14 | | |
$ | 14.77 | | |
$ | 11.80 | |
| TOTAL
RETURN:3 | |
| | | |
| | | |
| | | |
| | | |
| | | |
| | |
| Net Asset Value | |
| 11.80 | %4 | |
| (21.29 | )% | |
| 19.97 | % | |
| 21.85 | % | |
| 30.46 | % | |
| (14.45 | )% |
| Market Value | |
| 8.20 | %4 | |
| (25.96 | )% | |
| 32.91 | % | |
| 19.20 | % | |
| 35.23 | % | |
| (20.43 | )% |
| RATIOS BASED ON AVERAGE NET ASSETS: | |
| | | |
| | | |
| | | |
| | | |
| | | |
| | |
| Investment advisory fee expense5 | |
| 0.99 | %6 | |
| 0.74 | % | |
| 1.02 | % | |
| 1.15 | % | |
| 0.49 | % | |
| 0.42 | % |
| Other operating expenses | |
| 0.24 | %6 | |
| 0.23 | % | |
| 0.13 | % | |
| 0.19 | % | |
| 0.27 | % | |
| 0.21 | % |
| Total expenses (net) | |
| 1.23 | %6 | |
| 0.97 | % | |
| 1.15 | % | |
| 1.34 | % | |
| 0.76 | % | |
| 0.63 | % |
| Expenses excluding interest expense | |
| 1.11 | %6 | |
| 0.86 | % | |
| 1.11 | % | |
| 1.26 | % | |
| 0.61 | % | |
| 0.52 | % |
| Expenses prior to balance credits | |
| 1.23 | %6 | |
| 0.97 | % | |
| 1.15 | % | |
| 1.34 | % | |
| 0.76 | % | |
| 0.63 | % |
| Net investment income (loss) | |
| 0.11 | %6 | |
| 0.39 | % | |
| 0.21 | %1 | |
| 0.16 | % | |
| 0.69 | % | |
| 1.06 | % |
| SUPPLEMENTAL DATA: | |
| | | |
| | | |
| | | |
| | | |
| | | |
| | |
| Net Assets, End of Period (in thousands) | |
$ | 1,753,253 | | |
$ | 1,605,179 | | |
$ | 2,149,870 | | |
$ | 1,888,606 | | |
$ | 1,628,039 | | |
$ | 1,304,107 | |
| Portfolio Turnover Rate | |
| 28 | % | |
| 60 | % | |
| 44 | % | |
| 36 | % | |
| 30 | % | |
| 28 | % |
| REVOLVING CREDIT AGREEMENT: | |
| | | |
| | | |
| | | |
| | | |
| | | |
| | |
| Asset coverage | |
| 5109 | % | |
| 4686 | % | |
| 3171 | % | |
| 2798 | % | |
| 2426 | % | |
| 2998 | % |
| Asset coverage per $1,000 | |
$ | 51,093 | | |
$ | 46,862 | | |
$ | 31,712 | | |
$ | 27,980 | | |
$ | 24,258 | | |
$ | 29,980 | |
| 1 | A
special distribution from ECN Capital resulted in an increase in net investment income (loss) per share of $0.05 and an increase
in the ratio of net investment income (loss) to average net assets of 0.26%. |
| 2 | Amounts
are subject to change and recharacterization at year end. |
| 3 | The
Market Value Total Return is calculated assuming a purchase of Common Stock on the opening of the first business day and a sale
on the closing of the last business day of each period. Dividends and distributions are assumed for the purposes of this calculation
to be reinvested at prices obtained under the Fund’s Distribution Reinvestment and Cash Purchase Plan. Net Asset Value Total
Return is calculated on the same basis, except that the Fund’s net asset value is used on the purchase, sale and dividend
reinvestment dates instead of market value. |
| 5 | The
investment advisory fee is calculated based on average net assets over a rolling 60-month basis, while the above ratios of investment
advisory fee expenses are based on the average net assets over a 6-month basis for the six months ended 6/30/23, and a 12-month
basis for the years shown. |
| 50 | 2023 Semiannual Report to Stockholders | THE
ACCOMPANYING NOTES ARE AN INTEGRAL PART OF THESE FINANCIAL STATEMENTS |
Royce
Value Trust
Notes
to Financial Statements (unaudited)
Summary
of Significant Accounting Policies:
Royce
Value Trust, Inc. (the "Fund"), is a diversified closed-end investment company that was incorporated under the laws
of the State of Maryland on July 1, 1986. The Fund commenced operations on November 26, 1986.
The
preparation of financial statements in conformity with accounting principles generally accepted in the United States of America
requires management to make estimates and assumptions that affect the reported amounts of assets and liabilities and the disclosure
of contingent assets and liabilities at the date of the financial statements and the reported amounts of income and expenses during
the reporting period. Actual results could differ from those estimates.
The
Fund is an investment company and accordingly follows the investment company accounting and reporting guidance of the Financial
Accounting Standards Board (FASB) Accounting Standard Codification Topic 946 “Financial Services-Investment Companies.”
Royce
& Associates, LP, the Fund’s investment adviser, is a majority-owned subsidiary of Franklin Resources, Inc. and primarily
conducts business using the name Royce Investment Partners (“Royce”).
VALUATION
OF INVESTMENTS:
Portfolio
securities held by the Fund are valued as of the close of trading on the New York Stock Exchange (“NYSE”) (generally
4:00 p.m. Eastern time) on the valuation date. Investments in money market funds are valued at net asset value per share. Values
for non-U.S. dollar denominated equity securities are converted to U.S. dollars daily based upon prevailing foreign currency exchange
rates as quoted by a major bank.
Equity
securities that are listed on an exchange or Nasdaq, or traded on OTC Market Group Inc.’s OTC Link ATS or other alternative
trading system, are valued: (i) on the basis of their last reported sales prices or official closing prices, as applicable, on
a valuation date; or (ii) at their highest reported bid prices in the event such equity securities did not trade on a valuation
date. Such inputs are generally referred to as “Level 1” inputs because they represent reliable quoted prices in active
markets for identical securities.
If
the value of a portfolio security held by the Fund cannot be determined solely by reference to Level 1 inputs, such portfolio
security will be “fair valued.” The Fund’s Board of Directors has designated Royce as valuation designee to
perform fair value determinations for such portfolio securities in accordance with Rule 2a-5 under the Investment Company Act
of 1940 (“Rule 2a-5”). Pursuant to Rule 2a-5, fair values are determined in accordance with policies and procedures
approved by the Fund’s Board of Directors and policies and procedures adopted by Royce in its capacity as valuation designee for
the Fund. Fair valued securities are reported as either “Level 2” or “Level 3” securities.
As
a general principle, the fair value of a security is the amount which the Fund might reasonably expect to receive for the security
upon its current sale. However, in light of the judgment involved in fair valuations, no assurance can be given that a fair value
assigned to a particular portfolio security will be the amount which the Fund might be able to receive upon its current sale.
When a fair value pricing methodology is used, the fair value prices used by the Fund for such securities will likely differ from
the quoted or published prices for the same securities.
Level
2 inputs are other significant observable inputs (e.g., dealer bid side quotes and quoted prices for securities with comparable
characteristics). Examples of situations in which Level 2 inputs are used to fair value portfolio securities held by the Fund
on a particular valuation date include:
| ● | Over-the-counter
equity securities other than those traded on OTC Market Group Inc.’s OTC Link ATS
or other alternative trading system (collectively referred to herein as “Other
OTC Equity Securities”) are fair valued at their highest bid price when Royce receives
at least two bid side quotes from dealers who make markets in such securities; |
| ● | Certain
bonds and other fixed income securities may be fair valued by reference to other securities
with comparable ratings, interest rates, and maturities in accordance with valuation
methodologies maintained by certain independent pricing services; and |
| ● | The
Fund uses an independent pricing service to fair value certain non-U.S. equity securities
when U.S. market volatility exceeds a certain threshold. This pricing service uses proprietary
correlations it has developed between the movement of prices of non-U.S. equity securities
and indices of U.S.-traded securities, futures contracts, and other indications to estimate
the fair value of such non-U.S. securities. |
Level
3 inputs are significant unobservable inputs. Examples of Level 3 inputs include (without limitation) the last trade price for
a security before trading was suspended or terminated; discounts to last trade price for lack of marketability or otherwise; market
price information regarding other securities; information received from the issuer and/or published documents, including SEC filings
and financial statements; and other publicly available information. Pursuant to the above-referenced policies and procedures,
Royce may use
2023
Semiannual Report to Stockholders |
51
Royce
Value Trust
Notes
to Financial Statements (unaudited) (continued)
VALUATION
OF INVESTMENTS (continued):
various
techniques in making fair value determinations based upon Level 3 inputs, which techniques may include (without limitation): (i)
workout valuation methods (e.g., earnings multiples, discounted cash flows, liquidation values, derivations of book value, firm
or probable offers from qualified buyers for the issuer’s ongoing business, etc.); (ii) discount or premium from market,
or compilation of other observable market information, for other similar freely traded securities; (iii) conversion from the readily
available market price of a security into which an affected security is convertible or exchangeable; and (iv) pricing models or
other formulas. In the case of restricted securities, fair value determinations generally start with the inherent or intrinsic
worth of the relevant security, without regard to the restrictive feature, and are reduced for any diminution in value resulting
from the restrictive feature. Due to the inherent uncertainty of such valuations, these fair values may differ significantly from
the values that would have been used had an active market existed.
A
security that is valued by reference to Level 1 or Level 2 inputs may drop to Level 3 on a particular valuation date for several
reasons, including if:
| ● | an
equity security that is listed on an exchange or Nasdaq, or traded on OTC Market Group
Inc.’s OTC Link ATS or other alternative trading system, has not traded and there
are no bids; |
| ● | Royce
does not receive at least two bid side quotes for an Other OTC Equity Security; |
| ● | the
independent pricing services are unable to supply fair value prices; or |
| ● | the
Level 1 or Level 2 inputs become otherwise unreliable for any reason (e.g., a significant
event occurs after the close of trading for a security but prior to the time the Fund
prices its shares). |
The
table below shows the aggregate value of the various Level 1, Level 2, and Level 3 securities held by the Fund as of June 30,
2023. Any Level 2 or Level 3 securities held by the Fund are noted in its Schedule of Investments. The inputs or methodology used
for valuing securities are not necessarily an indication of the risk associated with owning those securities.
| |
LEVEL 1 |
LEVEL 2 |
LEVEL 3 |
TOTAL |
| Common Stocks |
$ 1,719,690,102 |
$ 7,539,187 |
$999,110 |
$1,728,228,399 |
| Diversified Investment Companies |
17,407,182 |
– |
– |
17,407,182 |
| Warrants |
10,505 |
– |
– |
10,505 |
| Repurchase Agreement |
– |
40,573,021 |
– |
40,573,021 |
Level
3 Reconciliation:
| |
|
|
|
|
UNREALIZED
GAIN (LOSS) 1 |
|
| |
|
|
|
|
|
|
|
| |
BALANCE
AS OF
12/31/22 |
PURCHASES |
SALES |
REALIZED
GAIN (LOSS) 1 |
CURRENLTY
HELD
SECURITIES |
SECURITIES
NO
LONGER HELD |
BALANCE
AS OF
6/30/23 |
| Common
Stocks |
$999,110 |
$
– |
$
– |
$
– |
$
0 |
$
– |
$999,110 |
| 1 | The
net change in unrealized appreciation (depreciation) is included in the accompanying
Statement of Operations. Change in unrealized appreciation (depreciation) includes net
unrealized appreciation (depreciation) resulting from changes in investment values during
the reporting period and the reversal of previously recorded unrealized appreciation
(depreciation) when gains or losses are realized. Net realized gain (loss) from investments
and foreign currency transactions is included in the accompanying Statement of Operations. |
REPURCHASE
AGREEMENTS:
The
Fund may enter into repurchase agreements with institutions that the Fund’s investment adviser has determined are creditworthy.
The Fund restricts repurchase agreements to maturities of no more than seven days. Securities pledged as collateral for repurchase
agreements, which are held until maturity of the repurchase agreements, are marked-to-market daily and maintained at a value at
least equal to the principal amount of the repurchase agreement (including accrued interest). Repurchase agreements could involve
certain risks in the event of default or insolvency of the counter-party, including possible delays or restrictions upon the ability
of the Fund to dispose of its underlying securities. The remaining contractual maturity of the repurchase agreement held by the
Fund as of June 30, 2023, is next business day and continuous.
FOREIGN
CURRENCY:
Net
realized foreign exchange gains or losses arise from sales and maturities of short-term securities, sales of foreign currencies,
expiration of currency forward contracts, currency gains or losses realized between the trade and settlement dates on securities
transactions, and the difference between the amounts of dividends, interest, and foreign withholding taxes recorded on the Fund’s
books and the U.S. dollar equivalent of the amounts actually received or paid. Net unrealized foreign exchange gains and losses
arise from changes in the value of assets and liabilities, other than investments in securities at the end of the reporting period,
as a result of changes in foreign currency exchange rates.
The
Fund does not isolate that portion of the results of operations resulting from fluctuations in foreign exchange rates on investments
from the fluctuations arising from changes in market prices of securities held. Such fluctuations are included with the net realized
and unrealized gain or loss on investments.
52
| 2023
Semiannual Report to Stockholders
Royce
Value Trust
Notes
to Financial Statements (unaudited) (continued)
TAXES:
As
a qualified regulated investment company under Subchapter M of the Internal Revenue Code, the Fund is not subject to income taxes
to the extent that it distributes substantially all of its taxable income for its fiscal year. The Schedule of Investments includes
information regarding income taxes under the caption “Tax Information.”
DISTRIBUTIONS:
The
Fund pays quarterly distributions on the Fund’s Common Stock at the annual rate of 7% of the rolling average of the prior
four calendar quarter-end NAVs of the Fund’s Common Stock, with the fourth quarter distribution being the greater of 1.75%
of the rolling average or the distribution required by IRS regulations. Distributions to Common Stockholders are recorded on ex-dividend
date. To the extent that distributions in any year are not paid from long-term capital gains, net investment income or net short-term
capital gains, they will represent a return of capital. Distributions are determined in accordance with income tax regulations
that may differ from accounting principles generally accepted in the United States of America. Permanent book and tax differences
relating to stockholder distributions will result in reclassifications within the capital accounts. Undistributed net investment
income may include temporary book and tax basis differences, which will reverse in a subsequent period. Any taxable income or
gain remaining undistributed at fiscal year end is distributed in the following year.
INVESTMENT
TRANSACTIONS AND RELATED INVESTMENT INCOME:
Investment
transactions are accounted for on the trade date. Dividend income is recorded on the ex-dividend date. Non-cash dividend income
is recorded at the fair market value of the securities received. Interest income is recorded on an accrual basis. Premiums and
discounts on debt securities are amortized using the effective yield-to-maturity method. Realized gains and losses from investment
transactions are determined on the basis of identified cost for book and tax purposes.
EXPENSES:
The
Fund incurs direct and indirect expenses. Expenses directly attributable to the Fund are charged to the Fund, while expenses applicable
to more than one of the Royce Funds are allocated equitably. Certain personnel, occupancy costs and other administrative expenses
related to all of the Royce Funds are allocated by Royce under an administration agreement and are included in administrative
and office facilities and professional fees.
Capital
Stock:
The
Fund issued 1,755,442 and 3,966,554 shares of Common Stock as reinvestment of distributions for the six months ended June 30,
2023, and the year ended December 31, 2022, respectively.
Borrowings:
The
Fund is party to a revolving credit agreement (the “credit agreement”) with BNP Paribas Prime Brokerage International,
Limited (BNPPI). The Fund pays a commitment fee of 0.50% per annum on the unused portion of the then-current maximum amount that
may be borrowed by the Fund under the credit agreement. The credit agreement has a 179-day rolling term that resets daily. The
Fund pledges eligible portfolio securities as collateral and has granted a security interest in such pledged securities to, and
in favor of, BNPPI as security for the loan balance outstanding. The amount of eligible portfolio securities required to be pledged
as collateral is determined by BNPPI in accordance with the credit agreement. In determining collateral requirements, the value
of eligible securities pledged as collateral is subject to discount by BNPPI based upon a variety of factors set forth in the
credit agreement. As of June 30, 2023, the market value of eligible securities pledged as collateral exceeded two times the loan
balance outstanding.
If
the Fund fails to meet certain requirements, or comply with other financial covenants set forth in the credit agreement, the Fund
may be required to repay immediately, in part or in full, the loan balance outstanding under the credit agreement, which may necessitate
the sale of portfolio securities at potentially inopportune times. BNPPI may terminate the credit agreement upon certain ratings
downgrades of its corporate parent, which would result in the Fund’s entire loan balance becoming immediately due and payable.
The occurrence of such ratings downgrades may necessitate the sale of portfolio securities at potentially inopportune times. BNPPI
may also terminate the credit agreement upon sixty (60) calendar days’ prior written notice to the Fund in the event the
Fund’s net asset value per share as of the close of business on the last business day of any calendar month declines by
thirty-five percent (35%) or more from the Fund’s net asset value per share as of the close of business on the last business
day of the immediately preceding calendar month.
The
credit agreement also permits, subject to certain conditions, BNPPI to rehypothecate portfolio securities pledged by the Fund
up to the amount of the loan balance outstanding. The Fund continues to receive payments in lieu of dividends and interest on
rehypothecated securities. The Fund also has the right under the credit agreement to recall the rehypothecated securities from
BNPPI on demand. If BNPPI fails to deliver the recalled security in a timely manner, the Fund is compensated by BNPPI for any
fees or losses related to the failed
2023
Semiannual Report to Stockholders |
53
Royce
Value Trust
Notes
to Financial Statements (unaudited) (continued)
Borrowings
(continued):
delivery
or, in the event a recalled security is not returned by BNPPI, the Fund, upon notice to BNPPI, may reduce the loan balance outstanding
by the value of the recalled security failed to be returned. The Fund receives a portion of the fees earned by BNPPI in connection
with the rehypothecation of portfolio securities.
The
Fund and BNPPI have agreed that the current maximum amount the Fund may borrow under the credit agreement is $70,000,000. The
Fund has the right to further reduce the maximum amount it can borrow under the credit agreement upon one (1) business day’s
prior written notice to BNPPI. In addition, the Fund and BNPPI may agree to increase the maximum amount the Fund can borrow under
the credit agreement, which amount may not exceed $150,000,000.
As
of June 30, 2023, the Fund had outstanding borrowings of $35,000,000. During the six-month period ended June 30, 2023, the Fund
had an average daily loan balance of $35,000,000 at a weighted average borrowing cost of 5.94%. The maximum loan balance outstanding
during the six-month period ended June 30, 2023, was $35,000,000. As of June 30, 2023, the aggregate value of rehypothecated securities
was $33,187,703. During the six-month period ended June 30, 2023, the Fund earned $3,640 in fees from rehypothecated securities.
Investment
Advisory Agreement:
As
compensation for its services under the investment advisory agreement, Royce receives a fee comprised of a Basic Fee (“Basic
Fee”) and an adjustment to the Basic Fee based on the investment performance of the Fund in relation to the investment record
of the S&P SmallCap 600 Index (“S&P 600"). The fee is payable monthly.
The
Basic Fee is a monthly fee equal to 1/12 of 1% (1% on an annualized basis) of the average of the Fund’s month-end net assets
for the rolling 60-month period ending with such month (the "performance period"). The Basic Fee for each month is increased
or decreased at the rate of 1/12 of .05% for each percentage point that the investment performance of the Fund exceeds, or is
exceeded by, the percentage change in the investment record of the S&P 600 for the performance period by more than two percentage
points. The performance period for each such month is a rolling 60-month period ending with such month. The maximum increase or
decrease in the Basic Fee for any month may not exceed 1/12 of .5%. Accordingly, for each month, the maximum monthly fee rate
as adjusted for performance is 1/12 of 1.5% and is payable if the investment performance of the Fund exceeds the percentage change
in the investment record of the S&P 600 by 12 or more percentage points for the performance period, and the minimum monthly
fee rate as adjusted for performance is 1/12 of .5% and is payable if the percentage change in the investment record of the S&P
600 exceeds the investment performance of the Fund by 12 or more percentage points for the performance period.
Notwithstanding
the foregoing, Royce is not entitled to receive any fee for any month when the investment performance of the Fund for the rolling
36-month period ending with such month is negative. In the event that the Fund’s investment performance for such a performance
period is less than zero, Royce will not be required to refund to the Fund any fee earned in respect of any prior performance
period.
For
the six rolling 60-month periods ended June 2023, the Fund’s investment performance ranged from 8% below to 8% above the
investment performance of the S&P 600. Accordingly, the net investment advisory fee consisted of a Basic Fee of $8,452,812
and a net downward adjustment of $134,958 for the performance of the Fund relative to that of the S&P 600. For the six months
ended June 30, 2023, the Fund expensed Royce investment advisory fees totaling $8,317,854.
Purchases
and Sales of Investment Securities:
For
the six months ended June 30, 2023, the costs of purchases and proceeds from sales of investment securities, other than short-term
securities, amounted to $525,653,182 and $473,620,214, respectively.
Cross
trades were executed by the Fund pursuant to Rule 17a-7 under the 1940 Act. Cross trading is the buying or selling of portfolio
securities between funds to which Royce or an affiliate of Franklin Resources, Inc. serves as investment adviser. The Fund’s
Chief Compliance Officer reviews such transactions each quarter for compliance with the requirements and restrictions set forth
by Rule 17a-7, and reports the results of that review to the Board of Directors. Cross trades for the six months ended June 30,
2023, were as follows:
| COSTS OF PURCHASES |
PROCEEDS FROM SALES |
REALIZED GAIN (LOSS) |
| $647,965 |
$ – |
$ – |
Subsequent
Events:
Subsequent
events have been evaluated through the date the financial statements were issued and it has been determined that no events have
occurred that require disclosure.
54
| 2023
Semiannual Report to Stockholders
History
Since Inception (unaudited)
The
following table details the share accumulations by an initial investor in the Funds who reinvested all distributions and participated
fully in primary subscriptions for each of the rights offerings. Full participation in distribution reinvestments and rights offerings
can maximize the returns available to a long-term investor. This table should be read in conjunction with the Performance and
Portfolio Reviews of the Funds.
| HISTORY |
|
AMOUNT
INVESTED |
PURCHASE
PRICE1 |
SHARES |
NAV
VALUE 2 |
MARKET
VALUE 2 |
| Royce
Global Value Trust |
|
|
|
|
|
|
|
|
|
| 10/17/13 |
Initial
Purchase |
$ |
8,975 |
$ |
8.975 |
1,000 |
$ |
9,780 |
$ |
8,975 |
| 12/11/14 |
Distribution
$0.15 |
|
|
|
7.970 |
19 |
|
9,426 |
|
8,193 |
| 12/10/15 |
Distribution
$0.10 |
|
|
|
7.230 |
14 |
|
9,101 |
|
7,696 |
| 12/9/16 |
Distribution
$0.14 |
|
|
|
7.940 |
18 |
|
10,111 |
|
8,446 |
| 12/12/17 |
Distribution
$0.11 |
|
|
|
10.610 |
11 |
|
13,254 |
|
11,484 |
| 12/12/18 |
Distribution
$0.04 |
|
|
|
8.500 |
5 |
|
11,118 |
|
9,475 |
| 12/11/19 |
Distribution
$0.06 |
|
|
|
10.670 |
6 |
|
14,593 |
|
12,543 |
| 12/17/20 |
Distribution
$1.19 |
|
|
|
13.441 |
95 |
|
17,462 |
|
15,604 |
| 12/10/21 |
Distribution
$2.75 |
|
|
|
12.498 |
257 |
|
20,321 |
|
18,696 |
| 12/9/22 |
Distribution
$0.133 |
|
|
|
8.821 |
21 |
|
14,822 |
|
12,508 |
| 6/30/23 |
|
$ |
8,975 |
|
|
1,446 |
$ |
15,805 |
$ |
13,361 |
| Royce
Micro-Cap Trust |
|
|
|
|
|
|
|
|
|
| 12/14/93 |
Initial
Purchase |
$ |
7,500 |
$ |
7.500 |
1,000 |
$ |
7,250 |
$ |
7,500 |
| 10/28/94 |
Rights
Offering |
|
1,400 |
|
7.000 |
200 |
|
|
|
|
| 12/19/94 |
Distribution
$0.05 |
|
|
|
6.750 |
9 |
|
9,163 |
|
8,462 |
| 12/7/95 |
Distribution
$0.36 |
|
|
|
7.500 |
58 |
|
11,264 |
|
10,136 |
| 12/6/96 |
Distribution
$0.80 |
|
|
|
7.625 |
133 |
|
13,132 |
|
11,550 |
| 12/5/97 |
Distribution
$1.00 |
|
|
|
10.000 |
140 |
|
16,694 |
|
15,593 |
| 12/7/98 |
Distribution
$0.29 |
|
|
|
8.625 |
52 |
|
16,016 |
|
14,129 |
| 12/6/99 |
Distribution
$0.27 |
|
|
|
8.781 |
49 |
|
18,051 |
|
14,769 |
| 12/6/00 |
Distribution
$1.72 |
|
|
|
8.469 |
333 |
|
20,016 |
|
17,026 |
| 12/6/01 |
Distribution
$0.57 |
|
|
|
9.880 |
114 |
|
24,701 |
|
21,924 |
| 2002 |
Annual
distribution total $0.80 |
|
|
|
9.518 |
180 |
|
21,297 |
|
19,142 |
| 2003 |
Annual
distribution total $0.92 |
|
|
|
10.004 |
217 |
|
33,125 |
|
31,311 |
| 2004 |
Annual
distribution total $1.33 |
|
|
|
13.350 |
257 |
|
39,320 |
|
41,788 |
| 2005 |
Annual
distribution total $1.85 |
|
|
|
13.848 |
383 |
|
41,969 |
|
45,500 |
| 2006 |
Annual
distribution total $1.55 |
|
|
|
14.246 |
354 |
|
51,385 |
|
57,647 |
| 2007 |
Annual
distribution total $1.35 |
|
|
|
13.584 |
357 |
|
51,709 |
|
45,802 |
| 2008 |
Annual
distribution total $1.19³ |
|
|
|
8.237 |
578 |
|
28,205 |
|
24,807 |
| 3/11/09 |
Distribution
$0.22³ |
|
|
|
4.260 |
228 |
|
41,314 |
|
34,212 |
| 12/2/10 |
Distribution
$0.08 |
|
|
|
9.400 |
40 |
|
53,094 |
|
45,884 |
| 2011 |
Annual
distribution total $0.53³ |
|
|
|
8.773 |
289 |
|
49,014 |
|
43,596 |
| 2012 |
Annual
distribution total $0.51 |
|
|
|
9.084 |
285 |
|
57,501 |
|
49,669 |
| 2013 |
Annual
distribution total $1.38 |
|
|
|
11.864 |
630 |
|
83,110 |
|
74,222 |
| 2014 |
Annual
distribution total $2.90 |
|
|
|
10.513 |
1,704 |
|
86,071 |
|
76,507 |
| 2015 |
Annual
distribution total $1.26 |
|
|
|
7.974 |
1,256 |
|
75,987 |
|
64,222 |
| 2016 |
Annual
distribution total $0.64 |
|
|
|
7.513 |
779 |
|
92,689 |
|
78,540 |
| 2017 |
Annual
distribution total $0.69 |
|
|
|
8.746 |
783 |
|
109,076 |
|
98,254 |
| 2018 |
Annual
distribution total $0.75 |
|
|
|
8.993 |
893 |
|
96,398 |
|
83,853 |
| 2019 |
Annual
distribution total $0.68 |
|
|
|
8.297 |
955 |
|
118,025 |
|
104,666 |
| 2020 |
Annual
distribution total $0.61 |
|
|
|
6.944 |
1,120 |
|
128,811 |
|
135,365 |
| 2021 |
Annual
distribution total $0.84 |
|
|
|
11.377 |
1,014 |
|
187,933 |
|
166,205 |
| 2022 |
Annual
distribution total $0.953 |
|
|
|
8.887 |
1,598 |
|
156,203 |
|
138,776 |
| 2023 |
Year-to-Date
distribution total $0.35 |
|
|
|
8.554 |
661 |
|
|
|
|
| 6/30/23 |
|
$ |
8,900 |
|
|
16,649 |
$ |
166,324 |
$ |
145,679 |
| 1 | The
purchase price used for annual distribution totals is a weighted average of the distribution
reinvestment prices for the year. |
| 2 | Values
are stated as of December 31 of the year indicated, after reinvestment of distributions,
other than for initial purchase. |
| 3 | Includes
a return of capital. |
This
page is not part of the 2023 Semiannual Report to Stockholders | 55
History
Since Inception (unaudited) (continued)
| HISTORY |
|
AMOUNT
INVESTED |
PURCHASE
PRICE 1 |
SHARES |
|
NAV
VALUE² |
MARKET
VALUE² |
| Royce
Value Trust |
|
|
|
|
|
|
|
|
|
| 11/26/86 |
Initial
Purchase |
$ |
10,000 |
$ |
10.000 |
1,000 |
$ |
9,280 |
$ |
10,000 |
| 10/15/87 |
Distribution
$0.30 |
|
|
|
7.000 |
42 |
|
|
|
|
| 12/31/87 |
Distribution
$0.22 |
|
|
|
7.125 |
32 |
|
8,578 |
|
7,250 |
| 12/27/88 |
Distribution
$0.51 |
|
|
|
8.625 |
63 |
|
10,529 |
|
9,238 |
| 9/22/89 |
Rights
Offering |
|
405 |
|
9.000 |
45 |
|
|
|
|
| 12/29/89 |
Distribution
$0.52 |
|
|
|
9.125 |
67 |
|
12,942 |
|
11,866 |
| 9/24/90 |
Rights
Offering |
|
457 |
|
7.375 |
62 |
|
|
|
|
| 12/31/90 |
Distribution
$0.32 |
|
|
|
8.000 |
52 |
|
11,713 |
|
11,074 |
| 9/23/91 |
Rights
Offering |
|
638 |
|
9.375 |
68 |
|
|
|
|
| 12/31/91 |
Distribution
$0.61 |
|
|
|
10.625 |
82 |
|
17,919 |
|
15,697 |
| 9/25/92 |
Rights
Offering |
|
825 |
|
11.000 |
75 |
|
|
|
|
| 12/31/92 |
Distribution
$0.90 |
|
|
|
12.500 |
114 |
|
21,999 |
|
20,874 |
| 9/27/93 |
Rights
Offering |
|
1,469 |
|
13.000 |
113 |
|
|
|
|
| 12/31/93 |
Distribution
$1.15 |
|
|
|
13.000 |
160 |
|
26,603 |
|
25,428 |
| 10/28/94 |
Rights
Offering |
|
1,103 |
|
11.250 |
98 |
|
|
|
|
| 12/19/94 |
Distribution
$1.05 |
|
|
|
11.375 |
191 |
|
27,939 |
|
24,905 |
| 11/3/95 |
Rights
Offering |
|
1,425 |
|
12.500 |
114 |
|
|
|
|
| 12/7/95 |
Distribution
$1.29 |
|
|
|
12.125 |
253 |
|
35,676 |
|
31,243 |
| 12/6/96 |
Distribution
$1.15 |
|
|
|
12.250 |
247 |
|
41,213 |
|
36,335 |
| 1997 |
Annual
distribution total $1.21 |
|
|
|
15.374 |
230 |
|
52,556 |
|
46,814 |
| 1998 |
Annual
distribution total $1.54 |
|
|
|
14.311 |
347 |
|
54,313 |
|
47,506 |
| 1999 |
Annual
distribution total $1.37 |
|
|
|
12.616 |
391 |
|
60,653 |
|
50,239 |
| 2000 |
Annual
distribution total $1.48 |
|
|
|
13.972 |
424 |
|
70,711 |
|
61,648 |
| 2001 |
Annual
distribution total $1.49 |
|
|
|
15.072 |
437 |
|
81,478 |
|
73,994 |
| 2002 |
Annual
distribution total $1.51 |
|
|
|
14.903 |
494 |
|
68,770 |
|
68,927 |
| 1/28/03 |
Rights
Offering |
|
5,600 |
|
10.770 |
520 |
|
|
|
|
| 2003 |
Annual
distribution total $1.30 |
|
|
|
14.582 |
516 |
|
106,216 |
|
107,339 |
| 2004 |
Annual
distribution total $1.55 |
|
|
|
17.604 |
568 |
|
128,955 |
|
139,094 |
| 2005 |
Annual
distribution total $1.61 |
|
|
|
18.739 |
604 |
|
139,808 |
|
148,773 |
| 2006 |
Annual
distribution total $1.78 |
|
|
|
19.696 |
693 |
|
167,063 |
|
179,945 |
| 2007 |
Annual
distribution total $1.85 |
|
|
|
19.687 |
787 |
|
175,469 |
|
165,158 |
| 2008 |
Annual
distribution total $1.72³ |
|
|
|
12.307 |
1,294 |
|
95,415 |
|
85,435 |
| 3/11/09 |
Distribution
$0.32³ |
|
|
|
6.071 |
537 |
|
137,966 |
|
115,669 |
| 12/2/10 |
Distribution
$0.03 |
|
|
|
13.850 |
23 |
|
179,730 |
|
156,203 |
| 2011 |
Annual
distribution total $0.78³ |
|
|
|
13.043 |
656 |
|
161,638 |
|
139,866 |
| 2012 |
Annual
distribution total $0.80 |
|
|
|
13.063 |
714 |
|
186,540 |
|
162,556 |
| 2013 |
Annual
distribution total $2.194 |
|
|
|
16.647 |
1,658 |
|
250,219 |
|
220,474 |
| 2014 |
Annual
distribution total $1.82 |
|
|
|
14.840 |
1,757 |
|
252,175 |
|
222,516 |
| 2015 |
Annual
distribution total $1.24 |
|
|
|
12.725 |
1,565 |
|
231,781 |
|
201,185 |
| 2016 |
Annual
distribution total $1.02 |
|
|
|
12.334 |
1,460 |
|
293,880 |
|
248,425 |
| 2017 |
Annual
distribution total $1.16 |
|
|
|
14.841 |
1,495 |
|
350,840 |
|
324,176 |
| 2018 |
Distribution
through 6/30/18 $0.59 |
|
|
|
15.962 |
748 |
|
|
|
|
| 2018 |
Rights
Offering |
|
31,289 |
|
15.330 |
2,041 |
|
|
|
|
| 2018 |
Distribution
after 6/30/18 $0.67 |
|
|
|
12.706 |
1,168 |
|
329,589 |
|
283,259 |
| 2019 |
Annual
distribution total $1.10 |
|
|
|
14.100 |
1,929 |
|
429,986 |
|
383,045 |
| 2020 |
Annual
distribution total $1.04 |
|
|
|
11.888 |
2,357 |
|
523,949 |
|
456,617 |
| 2021 |
Annual
distribution total $1.67 |
|
|
|
18.124 |
2,690 |
|
628,604 |
|
609,918 |
| 2022 |
Annual
distribution total $1.323 |
|
|
|
14.525 |
2,907 |
|
495,104 |
|
449,355 |
| 2023 |
Year-to-Date
distribution total $0.52 |
|
|
|
13.233 |
1,345 |
|
|
|
|
| 6/30/23 |
|
$ |
53,211 |
|
|
35,233 |
$ |
553,158 |
$ |
486,215 |
| 1 | The
purchase price used for annual distribution totals is a weighted average of the distribution
reinvestment prices for the year. |
| 2 | Values
are stated as of December 31 of the year indicated, after reinvestment of distributions,
other than for initial purchase. |
| 3 | Includes
a return of capital. |
| 4 | Includes
Royce Global Value Trust spin-off of $1.40 per share. |
56
| This
page is not part of the 2023 Semiannual Report to Stockholders
Distribution
Reinvestment and Cash Purchase Options
Why
should I reinvest my distributions?
By
reinvesting distributions, a stockholder can maintain an undiluted investment in the Fund. The regular reinvestment of distributions
has a significant impact on stockholder returns. In contrast, the stockholder who takes distributions in cash is penalized when
shares are issued below net asset value to other stockholders.
How
does the reinvestment of distributions from the Royce closed-end funds work?
The
Funds automatically issue shares in payment of distributions unless you indicate otherwise. The shares are generally issued at
the lower of the market price or net asset value on the valuation date.
How
does this apply to registered stockholders?
If
your shares are registered directly with a Fund, your distributions are automatically reinvested unless you have otherwise instructed
the Funds’ transfer agent, Computershare, in writing, in which case you will receive your distribution in cash. A registered
stockholder also may have the option to receive the distribution in the form of a stock certificate.
What
if my shares are held by a brokerage firm or a bank?
If
your shares are held by a brokerage firm, bank, or other intermediary as the stockholder of record, you should contact your brokerage
firm or bank to be certain that it is automatically reinvesting distributions on your behalf. If they are unable to reinvest distributions
on your behalf, you should have your shares registered in your name in order to participate.
What
other features are available for registered stockholders?
The
Distribution Reinvestment and Cash Purchase Plans also allow registered stockholders to make optional cash purchases of shares
of a Fund’s common stock directly through Computershare on a monthly basis, and to deposit certificates representing your
RVT and RMT shares with Computershare for safekeeping. (RGT does not issue shares in certificated form). Plan participants are
subject to a $0.75 service fee for each voluntary cash purchase under the Plans. The Funds’ investment adviser absorbed
all commissions on optional cash purchases under the Plans through June 30, 2023.
How
do the Plans work for registered stockholders?
Computershare
maintains the accounts for registered stockholders in the Plans and sends written confirmation of all transactions in the account.
Shares in the account of each participant will be held by Computershare in non-certificated form in the name of the participant,
and each participant will be able to vote those shares at a stockholder meeting or by proxy. A participant may also send stock
certificates for RVT and RMT held by them to Computershare to be held in non-certificated form. RGT does not issue shares in
certificated form. There is no service fee charged to participants for reinvesting distributions. If a participant elects to sell
shares from a Plan account, Computershare will deduct a $2.50 service fee from the sale transaction. The Funds’ investment
adviser absorbed all commissions on optional sales under the Plans through June 30, 2023. If a nominee is the registered owner
of your shares, the nominee will maintain the accounts on your behalf.
How
can I get more information on the Plans?
You
can call an Investor Services Representative at (800) 221-4268 or you can request a copy of the Plan for your Fund from Computershare.
All correspondence (including notifications) should be directed to: [Name of Fund] Distribution Reinvestment and Cash Purchase
Plan, c/o Computershare, PO Box 43078, Providence, RI 02940-3078, telephone (800) 426-5523 (from 9:00 A.M. to 5:00 P.M.).
This
page is not part of the 2023 Semiannual Report to Stockholders | 57
Directors
and Officers
All
Directors and Officers may be reached c/o The Royce Funds, 745 Fifth Avenue, New York, NY 10151
Christopher
D. Clark, Director1, President
Age:
58 | Number
of Funds Overseen: 16 | Tenure:
Since 2014
Principal
Occupation(s) During Past Five Years: Chief Executive Officer (since July 2016), President (since July 2014), Co-Chief Investment
Officer (since January 2014), Managing Director of Royce, a Member of the Board of Managers of Royce, having been employed by
Royce since May 2007.
Patricia
W. Chadwick, Director
Age:
74 | Number
of Funds Overseen: 16 | Tenure:
Since 2009
Non-Royce
Directorships: Director of Voya Mutual Funds
Principal
Occupation(s) During Past 5 Years: Consultant and President, Ravengate Partners LLC (since 2000). Formerly Director, Wisconsin
Energy Corp. (until 2022).
Christopher
C. Grisanti, Director
Age:
61 | Number
of Funds Overseen: 16 | Tenure:
Since 2017
Non-Royce
Directorships: None
Principal
Occupation(s) During Past Five Years: Chief Equity Strategist and Senior Portfolio Manager, MAI Capital Management LLC (investment
advisory firm) (since May 2020). Formerly Co-Founder and Chief Executive Officer, Grisanti Capital Management LLC (investment
advisory firm) (from 1999 to 2020); Director of Research and Portfolio Manager, Spears Benzak, Salomon & Farrell (from 1994
to 1999); and Senior Associate, Simpson, Thacher & Bartlett (law firm) (from 1988 to 1994).
Cecile
B. Harper, Director
Age:
60 | Number
of Funds Overseen: 16 | Tenure:
Since 2020
Non-Royce
Directorships: None
Principal
Occupation(s) During Past Five Years: Chief Financial Officer and Chief Operating Officer, College Foundation at the University
of Virginia (since October 2019). Formerly Board Member, Pyramid Peak Foundation (January 2012 to 2022); Board Member, Regional
One Health Foundation (from June 2013 to September 2019); and Principal, Southeastern Asset Management (from December 1993 to
September 2019).
Arthur
S. Mehlman, Director
Age:
81 | Number
of Funds Overseen: 16 | Tenure:
Since 2004
Non-Royce
Directorships: None
Principal
Occupation(s) During Past Five Years: Director, University of Maryland Foundation (non-profits). Formerly Director/Trustee,
registered investment companies constituting the Legg Mason Funds (from 2002 to June 2021); Director, The League for People with
Disabilities, Inc. (from June 2003 to June 2018); Director, Municipal Mortgage & Equity, LLC (from October 2004 to April 2011);
Director, University of Maryland College Park Foundation (non-profit) (from 1998 to 2005); Director, Maryland Business Roundtable
for Education (from July 1984 to June 2002); and Partner, KPMG LLP (international accounting firm) (from 1972 to 2002)
G.
Peter O’Brien, Director
Age:
77 | Number
of Funds Overseen: 72 | Tenure:
Since 2001
Non-Royce
Directorships: Director/Trustee of registered investment companies constituting the 56 Legg Mason Funds.
Principal
Occupation(s) During Past Five Years: Trustee Emeritus, Colgate University (since 2005); and Emeritus Board Member, Hill House,
Inc. (since 2019). Formerly Director, TICC Capital Corp. (from 2003-2017); Trustee, Colgate University (from 1996 to 2005); President,
Hill House, Inc. (from 2001 to 2005); Board Member, Hill House, Inc. (from 1999 to 2019); Director, Bridges School (from 2006
to 2018); and Managing Director/ Equity Capital Markets Group, Merrill Lynch & Co. (from 1971 to 1999).
Julia
W. Poston, Director2
Age:
63 | Number of Funds Overseen: 16 | Tenure: Since 2023
Non-Royce
Directorships: Ohio National Fund, Inc. and The James Advantage Funds
Principal
Occupation(s) During Past Five Years: Director, Member of Nominating/Governance Committee, and Chair of Audit Committee, Al.
Neyer Corporation (since 2020); Director, Member of Governance Committee, and Chair of Audit Committee, Master Fluid Solutions
(since 2021); Trustee and Chair of Finance/Audit Committee, Cincinnati Museum Center (non-profit) (since 2015); and Director and
Founder, Cincinnati Women’s Executive Forum (non-profit) (since 2010). Formerly Senior Client Partner (2002-2020) and Assurance
Practice Group Leader for Ohio Valley Region (2014-2019), Ernst & Young, LLP (international accounting and services firm);
and Audit Partner, Arthur Andersen LLP (international accounting and services firm) (1982-2002).
Michael
K. Shields, Director
Age:
64 | Number
of Funds Overseen: 16 | Tenure:
Since 2015
Non-Royce
Directorships: None
Principal
Occupation(s) During Past Five Years: President and Chief
Executive Officer, Piedmont Trust Company (privately-owned North Carolina trust company) (since February 2012); Chairman, UNC
Charlotte Investment Fund Board (since February 2016); and Chairman, Halftime Carolinas Board (since February 2011). Formerly
Owner, Shields Advisors (investment consulting firm) (from April 2010 to June 2012); President and Chief Executive Officer, Eastover
Capital Management (2005- 2007); President and Chief Executive Officer, Campbell, Cowperthwait (investment subsidiary of U.S.
Trust Corporation) (1997-2002); and equity portfolio manager and co-manager of Quality Growth Team, Scudder, Stevens and Clark
(1992-1997).
Francis
D. Gannon, Vice President
Age:
55 | Tenure:
Since 2014
Principal
Occupation(s) During Past Five Years: Co-Chief Investment Officer (since January 2014) and Managing Director of Royce, having
been employed by Royce since September 2006.
Daniel
A. O’Byrne, Vice President
Age:
61 | Tenure:
Since 1994
Principal
Occupation(s) During Past Five Years: Principal and Vice President of Royce, having been employed by Royce since October 1986.
Peter
K. Hoglund, Treasurer
Age:
57 | Tenure:
Since 2015
Principal
Occupation(s) During Past Five Years: Chief Financial Officer, Chief Administrative Officer, and Managing Director of Royce,
having been employed by Royce since December 2014. Prior to joining Royce, Mr. Hoglund spent more than 20 years with Munder Capital
Management in Birmingham, MI, serving as Managing Director and Chief Financial Officer and overseeing all financial aspects of
the firm. He began his career at Munder as a portfolio manager.
John
E. Denneen, Secretary and Chief Legal Officer
Age:
56 | Tenure:
1996-2001 and Since 2002
Principal
Occupation(s) During Past Five Years: General Counsel, Managing Director, and, since June 2015, a Member of the Board of Managers
of Royce. Chief Legal and Compliance Officer and Secretary of Royce.
John
P. Schwartz, Chief Compliance Officer
Age:
52 | Tenure:
Since 2022
Principal
Occupation(s) During Past Five Years: Chief Compliance Officer of The Royce Funds (since May
2022) and Associate General Counsel and Compliance Officer of Royce (since March 2013).
1
Interested Director.
2
Became a Director effective as of the close of business on July 12, 2023.
Directors
will hold office until their successors have been duly elected and qualified or until their earlier resignation or removal. The
Statement of Additional Information, which contains additional information about the Trust’s directors
and officers, is available and can be obtained without charge at www.royceinvest.com or by calling (800) 221-4268.
| 58 | This
page is not part of the 2023 Semiannual Report to Stockholders |
|
Board
Approval of Investment Advisory Agreements
At
meetings held on June 14-15, 2023, the Board of Directors (each, a “Board” and collectively, the “Boards”),
including all of the non-interested directors, of each of Royce Value Trust, Inc., Royce Micro-Cap Trust, Inc., and Royce Global
Value Trust, Inc. (each, a “Fund” and collectively, the “Funds”) approved the continuation of the investment
advisory agreement between Royce & Associates, LP (“Royce”) and the relevant Fund (each, an “Agreement”
and collectively, the “Agreements”). In reaching these decisions, each Board reviewed the materials provided by Royce,
which included, among other things, information prepared internally by Royce and independently by Broadridge Financial Solutions,
Inc. (“Broadridge”) using the database and methodology of Morningstar Associates, LLC (“Morningstar”)
containing detailed investment advisory fee, expense ratio, and investment performance comparisons for each of the Funds with
other funds in its “peer group” and “category,” information regarding the past performance of each Fund
and other registered investment companies managed by Royce and a memorandum outlining the legal duties of each Board prepared
by independent legal counsel to the non-interested directors. Royce also provided each Board with an analysis of its profitability
with respect to providing investment advisory services to the relevant Fund. In addition, each Board took into account information
furnished throughout the year at regular Board meetings, including reports on investment performance, stockholder services, regulatory
compliance, brokerage commissions and research, and brokerage and other execution products and services provided to the relevant
Fund. Each Board also took into account information furnished by Royce in response to various trustee questions regarding Royce
operations and the Funds. Each Board also considered the other matters it deemed important to the approval process, such as allocation
of brokerage commissions, “soft dollar” research services Royce receives and other direct and indirect benefits Royce
and its affiliates receive from their relationship with the relevant Fund. The Boards also met throughout the year with investment
advisory personnel from Royce. Each Board also noted Royce’s efforts to provide enhanced analytical tools to its investment
staff. Each Board, in its deliberations, recognized that, for many of the relevant Fund’s stockholders, the decision to
purchase Fund shares included a decision to select Royce as the investment adviser and that there was a strong association in
the minds of Fund stockholders between Royce and the relevant Fund. In considering factors relating to the approval of the continuance
of the Agreement for each Fund, the non-interested directors received assistance and advice from, and met separately with, their
independent legal counsel. While continuation of the investment advisory and administrative arrangements for the Funds was considered
at the same Board meetings, the Boards considered the circumstances and interests of each Fund separately. Among other factors,
the Boards noted that they considered the following:
The
nature, extent and quality of services provided by Royce
Each
Board considered the following factors to be of fundamental importance to its consideration of whether to approve the continuance
of the Agreement for the relevant Fund: (i) Royce’s more than 50 years of value investing experience and track record; (ii)
the history of long-tenured Royce portfolio managers managing the Funds; (iii) Royce’s focus on micro-, small-, and mid-cap
value investing; (iv) the consistency of Royce’s approach to managing the relevant Fund, other closed-end funds, and open-end
mutual funds over more than 50 years; (v) the integrity and high ethical standards adhered to at Royce; (vi) Royce’s specialized
experience in the area of trading small- and micro-cap securities; (vii) Royce’s historical ability to attract and retain
portfolio management, research, and analytical talent (and, in this regard, considered the effort and resources Royce had committed
to acquiring portfolio management, research, and analytical talent during the preceding few years); and (viii) Royce’s focus
on stockholder interests as exemplified by expansive stockholder reporting and communications. The Boards also noted that Royce’s
compensation policy arrangements strongly encourage portfolio manager investment in each fund that they manage. Each Board reviewed
the services that Royce provides to the relevant Fund, including, but not limited to, managing each Fund’s investments in
accordance with the stated policies of each Fund. Each Board considered the fact that Royce provided certain administrative services
to the relevant Fund at cost pursuant to the Administration Agreement between Royce and the relevant Fund. Each Board determined
that the services to be provided to the relevant Fund by Royce would be the same as those that Royce previously provided to such
Fund. The Boards also took into consideration the histories, reputations and backgrounds of Royce’s portfolio managers for
the Funds, finding that these would likely have an impact on the continued success of the Funds. Each Board concluded that the
investment advisory services provided by Royce to the relevant Fund compared favorably to services provided by Royce to other
Royce client accounts, including other funds, in both nature and quality, and that the scope of services provided by Royce continues
to be suitable for the relevant Fund.
Investment
performance of the Funds and Royce
Royce
generally emphasizes a risk-averse approach to investing. In light of that approach, each Board believes that risk-adjusted performance
continues to be an appropriate measure of the relevant Fund’s investment performance. One measure of risk-adjusted performance
the Boards use have historically used in their review of the Funds’ performance is the Sharpe Ratio. The Sharpe Ratio is
a risk-adjusted measure of performance developed by Nobel Laureate William Sharpe. It is calculated by dividing a fund’s
annualized excess returns by its annualized standard deviation to determine reward per unit of risk. The higher the Sharpe Ratio,
the better a fund’s historical risk-adjusted performance. The Boards attach importance to risk-adjusted performance over
relatively long periods of time, typically 3 to 10 years, because such periods tend to encompass different market environments
and cycles, unlike shorter time periods. It was noted, however, that Royce Global Value Trust, Inc. (“RGT”) had less
than ten full calendar years of performance because its inception date was October 18, 2013.
Small-
and large-cap stocks confronted a variety of bearish macro factors in 2022, including high inflation, a hawkish Fed which ushered
in much higher interest rates, and the ongoing war in Ukraine, and experienced a decidedly difficult year in the process. The
Russell 2000 Index fell -20.4% for the year, its third-worst calendar year performance on record, trailing only 2008, during the
Financial Crisis, and 2002, the worst year, which followed the peak of the Internet Bubble. The Boards noted that large-cap companies
had a similarly negative experience in 2022, with the Russell 1000 Index falling -19.1% during the period. Within the small-cap
market, the Boards noted that small-cap value stocks fared better than small-cap growth stocks (falling -14.5% and -26.4%, respectively)
over the period. The Boards also noted that 2022’s double-digit losses were not limited to equities, as the Bloomberg Barclays
U.S. Aggregate Bond Index fell -13.0% while its global counterpart, the Bloomberg Barclays Global Aggregate Bond Index, declined
-16.2%.
It
was noted that Royce Value Trust, Inc. (“RVT”) ranked in the 3rd Sharpe Ratio quartile within its Morningstar category
for the 5-year period ended December 31, 2022, and in the 4th Sharpe Ratio quartile within its Morningstar category for each of
the 1-, 3-, and 10-year periods ended December 31, 2022. It was also noted that the Sharpe Ratio for RGT ranked in the 2nd, 3rd,
and 3rd quartiles within its Morningstar category for the 1-, 3-, and 5-year periods ended December 31, 2022, respectively. It
was further noted that
This
page is not part of the 2023 Semiannual Report to Stockholders | 59
Board
Approval of Investment Advisory Agreements (continued)
Royce
Micro-Cap Trust, Inc. (“RMT”) ranked in the 2nd, 1st, 2nd, and 3rd quartiles within its Morningstar category for the
1-, 3-, 5-, and 10-year periods ended December 31, 2022, respectively.
The
Boards noted that a large portion of the post-2008 market period and, with respect to RGT, a large portion of its existence, was
marked by historically low interest rates and significant U.S. Federal Reserve market intervention. During this period, highly
leveraged, non-earning companies and yield-oriented securities (e.g., master limited partnerships, real estate investment trusts,
and utilities) generally outperformed those companies with more conservative balance sheets, low leverage, the ability to generate
and effectively allocate free cash flow, and strong returns on invested capital and cyclical companies generally favored by the
Funds. In addition, the use of leverage by RVT and RMT through preferred stock (prior to November 15, 2012) and borrowings resulted
in higher volatility and worse down-market performance.
In
addition to the relative risk–adjusted performance of each Fund, the Boards also reviewed and considered each Fund’s
absolute total returns, down market performance, and, for RVT and RMT, long-term performance records over periods of 10 years
and longer.
The
Boards further noted that Royce manages a number of funds that invest in micro-cap, small-cap, and mid-cap issuers, many of which
had outperformed their benchmark indexes and their competitors during the periods prior to the U.S. Federal Reserve’s near
zero interest rate policy and related market interventions that followed the 2008 financial crisis as well as in more recent periods,
as referenced above. Although each Board recognized that past performance is not necessarily an indicator of future results, it
found that Royce had the necessary qualifications, experience and track record in managing micro-cap, small-cap, and mid-cap securities
to manage the relevant Fund. Each Board determined that Royce continues to be an appropriate investment adviser for the relevant
Fund.
Cost
of the services provided and profits realized by Royce from its relationship with each Fund
Each
Board considered the cost of the services provided by Royce and the profits realized by Royce from its relationship with the relevant
Fund. As part of the analysis, each Board discussed with Royce its methodology in allocating its costs to the relevant Fund and
concluded that Royce’s allocations were reasonable. Each Board concluded that Royce’s profits with respect to the
relevant Fund during the year ended December 31, 2022, were reasonable in relation to the nature and quality of services provided.
The
extent to which economies of scale would be realized as the Funds grow and whether fee levels would reflect such economies of
scale
While
acknowledging that the presence or absence of economies of scale in fund management businesses can be debated and is, in any event, difficult
to measure and directly assess, each Board considered whether there have been economies of scale in respect of the management of the
relevant Fund, whether the relevant Fund has appropriately benefited from any economies of scale and whether there is potential for realization
of any further economies of scale. The Boards noted the time and effort involved in managing portfolios of small- and micro-cap stocks
and that they did not involve the same efficiencies as do portfolios of large-cap stocks. The Boards noted that, as closed-end funds,
the Funds generally would not be expected to have significant inflows of capital that might produce increasing economies of scale. Each
Board concluded that the current fee structure for the relevant Fund is reasonable, that stockholders sufficiently participated in economies
of scale (while again noting the various potential issues with assessing such economies of scale both in general and under the facts
at hand) and that no changes were currently necessary.
Comparison
of services to be rendered and fees to be paid to those under other investment advisory contracts, such as contracts of the same
and other investment advisers or other clients
Each
Board reviewed the investment advisory fee paid by the relevant Fund and compared both the services to be rendered and the fees
to be paid under the relevant Agreement to other contracts of Royce and to contracts of other investment advisers to registered
investment companies investing in micro-, small-, and mid-cap stocks, as provided by Broadridge. With respect to RVT, its Board
noted that the amount of investment advisory fees paid by the Fund to Royce in 2022 was subject to a net downward adjustment due
to the Fund’s underperformance relative to that of the S&P 600 SmallCap Index during the relevant trailing 60-month
periods and, as a result, the Fund’s effective investment advisory fee rate was lower than the median of its Broadridge-assigned
peers in 2022. With respect to RGT, its Board noted that although the Fund’s effective investment advisory fee rate of 1.00%
ranked in the 4th quartile within its Broadridge-assigned peer group for 2022, the fee was only one basis point higher than the
median of such peer group. With respect to RMT, its Board noted that noted that although the Fund’s effective investment
advisory fee rate for 2022 ranked in the 4th quartile within its Broadridge-assigned peer group for 2022, the amount of investment
advisory fees paid by the Fund to Royce was subject to a significant net upward adjustment in 2022 due to the Fund’s investment
performance exceeding that of the Russell 2000 Index during the relevant trailing 36-month periods.
In
the case of RVT, its Board noted that it had a 1.00% basic fee that is subject to adjustment up or down (up to 0.50% in either
direction) based on its performance versus the S&P 600 SmallCap Index over a rolling period of 60 months. The fee is charged
on average net assets over that rolling period. As a result, in a rising market, the fee will be smaller than a fee calculated
on the current year’s average net assets, and vice versa. As noted above, the amount of investment advisory fees paid by
RVT to Royce in 2022 was subject to a net downward adjustment due to the Fund’s underperformance relative to that of the
S&P 600 SmallCap Index during the relevant trailing 60-month periods. The RVT Board determined that the performance adjustment
feature continues to serve as an appropriate incentive to Royce to manage RVT for the benefit of its long-term common stockholders.
The RVT Board also noted that the fee arrangement, which also includes a provision for no fee in periods where RVT’s trailing
three-year performance is negative, requires Royce to measure RVT’s performance monthly against the S&P 600, an unmanaged
index. Therefore, instead of receiving a set fee regardless of its performance, Royce is penalized for poor performance. The RVT
Board noted that the Fund’s net annual operating expense ratio of 0.97%, which includes interest expense for amounts borrowed
for investment purposes, placed in the 3rd quartile within its Broadridge-assigned peer group for 2022, only three basis points
higher than the median of such peer group. Excluding such interest expense, RVT’s net annual operating expense ratio would
have been 0.86% and would have placed in the 2nd quartile within its Broadridge-assigned peer group for 2022, eight basis points
lower than its peer group median.
In
the case of RMT, its Board noted that it had a 1.00% basic fee subject to adjustment up or down based on its performance versus
the Russell 2000 Index over a rolling 36-month period. The fee is charged on average net assets over that rolling period. As a
result, in a rising market, the fee will be smaller than a fee calculated on the current year’s average net assets, and
vice versa. As noted above, the amount of investment advisory fees paid by RMT to Royce was subject to a significant net upward
adjustment in 2022 due to the Fund’s investment performance exceeding that of the Russell 2000
60
| This page is not part of the 2023 Semiannual Report to Stockholders
Board
Approval of Investment Advisory Agreements (continued)
Index
during the relevant trailing 36-month periods. The Board determined that the performance adjustment feature continues to serve
as an incentive to Royce to manage RMT for the benefit of its long-term common stockholders. RMT’s net annual operating
expense ratio of 1.76%, which includes interest expense for amounts borrowed for investment purposes, ranked in the 4th quartile
within its Broadridge-assigned peer group for 2022, 53 basis points higher than the median of such peer group. Excluding such
interest expense, RMT’s net annual operating expense ratio would have been 1.63%. By comparison, the Fund’s net operating
expense ratios including and excluding interest expense for 2021 were 1.20% and 1.16%, respectively. The directors noted that
RMT’s higher net operating expense ratio for 2022 compared to 2021 and its 2022 ranking among its Broadridge-assigned peer
group resulted in large part from: (i) the significant net upward adjustment in the amount of investment advisory fees paid by
RMT to Royce in 2022 due to the Fund’s outperformance relative to the Russell 2000 Index during the relevant trailing 36-month
periods and (ii) a decline in net assets during 2022.
Finally,
in the case of RGT, its Board noted that the Fund’s net annual operating expense ratio of 1.54%, which includes interest
expense for amounts borrowed for investment purposes, ranked in the 4th quartile within its Broadridge-assigned peer group for
2022, 29 basis points higher than the median of such peer group. The RGT Board also noted that the Fund’s net annual operating
expense ratio excluding such interest expense was 1.38%, only 13 basis points higher than such peer group median. The RGT Board
further noted that the Fund’s Broadridge-assigned peer group for 2022 was extremely small, consisting of only 9 additional
funds, and that the completion of a tender offer in December 2020 substantially reduced the amount of net assets over which Fund
expenses could be spread during the calendar year ended December 31, 2022, which helped to increase its net annual operating expense
ratio during such period.
The
Boards also noted that Royce manages the Funds in an active fashion. The industry accepted metric for measuring how actively an
equity portfolio is managed is called “active share.” In particular, active share measures how much the holdings of
an equity portfolio differ from the holdings of its appropriate passive benchmark index. At the extremes, a portfolio with no
holdings in common with the benchmark would have 100% active share, while a portfolio that is identical to the benchmark would
have 0% active share. Royce presented several analyses to the Boards which demonstrated that mutual funds with high active share
scores had higher expense ratios than mutual funds with lower active share scores due to the resources required for the active
management of those funds. The Boards noted that the active share for RVT, RGT, and RMT were 82%, 98%, and 95%, respectively,
for the calendar year ended December 31, 2022.
The
Boards also considered fees charged by Royce to institutional and other clients and noted that, given the greater levels of services
that Royce provides to registered investment companies such as the Funds as compared to other accounts, the base investment advisory
fee for RVT and RMT and the advisory fee for RGT, compared favorably to the investment advisory fees charged to those other accounts.
No
single factor was cited as determinative to the decision of the Boards. Rather, after weighing all of the considerations and conclusions
discussed above, the entirety of each Board, including all the non-interested directors, determined to approve the continuation
of the existing Agreement for each Fund, concluding that continuation of the Agreement for each Fund is in the best interest of
the stockholders of the relevant Fund and that each Fund’s investment advisory fee rate is reasonable in relation to the
services provided.
This
page is not part of the 2023 Semiannual Report to Stockholders | 61
Notes
to Performance and Other Important Information
The
thoughts expressed in this Review and Report concerning recent market movements and future prospects for small company
stocks are solely the opinion of Royce at June 30, 2023, and, of course, historical market trends are not necessarily indicative
of future market movements. Statements regarding the future prospects for particular securities held in the Funds’ portfolios
and Royce’s investment intentions with respect to those securities reflect Royce’s opinions as of June 30, 2023 and
are subject to change at any time without notice. There can be no assurance that securities mentioned in this Review and Report
will be included in any Royce-managed portfolio in the future. Investments in securities of micro-cap, small-cap and/or mid-cap companies may involve considerably more risk than investments in securities of larger-cap companies. All publicly released
material information is always disclosed by the Funds on the website at www. royceinvest.com.
Sector
weightings are determined using the Global Industry Classification Standard (“GICS”). GICS was developed by, and is
the exclusive property of, Standard & Poor’s Financial Services LLC (“S&P”) and MSCI Inc. (“MSCI”).
GICS is the trademark of S&P and MSCI. “Global Industry Classification Standard (GICS)” and “GICS Direct”
are service marks of S&P and MSCI.
All
indexes referred to are unmanaged and capitalization weighted. Each index’s returns include net reinvested dividends and/or
interest income. Frank Russell Company (“Russell”) is the source and owner of the trademarks, service marks and copyrights
related to the Russell Indexes. Russell® is a trademark of Frank Russell Company. Neither Russell nor its licensors
accept any liability for any errors or omissions in the Russell Indexes and/or Russell ratings or underlying data and no party
may rely on any Russell Indexes and/or Russell ratings and/or underlying data contained in this communication. No further distribution
of Russell Data is permitted without Russell’s express written consent. Russell does not promote, sponsor or endorse the
content of this communication. The Russell 2000 Index is an index of domestic small-cap stocks. It measures the performance of
the 2,000 smallest publicly traded U.S. companies in the Russell 3000 Index. The Russell 2000 Value and Growth Indexes consist
of the respective value and growth stocks within the Russell 2000 as determined by Russell Investments. The Russell Microcap Index
includes 1,000 of the smallest securities in the small-cap Russell 2000 Index along with the next smallest eligible securities
as determined by Russell. The Russell 1000 Index is an index of domestic large-cap stocks. It measures the performance of the
1,000 largest publicly traded U.S. companies in the Russell 3000 Index. The Russell Top 50 Index is an index of domestic large-cap
stocks. It measures the performance of approximately 50 of the largest publicly traded companies in the Russell 3000 Index. Source:
MSCI. MSCI makes no express or implied warranties or representations and shall have no liability whatsoever with respect to any
MSCI data contained herein. The MSCI data may not be further redistributed or used as a basis for other indexes or any securities
or financial products. This report is not approved, endorsed, reviewed or produced by MSCI. None of the MSCI data is intended
to constitute investment advice or a recommendation to make (or refrain from making) any kind of investment decision and may not
be relied on as such. The MSCI ACWI Small Cap Index is an unmanaged, capitalization-weighted index of global small-cap stocks.
The MSCI ACWI ex USA Small Cap Index is an unmanaged, capitalization weighted index of global small-cap stocks, excluding the
United States. The MSCI ACWI ex USA Large Cap Index is an unmanaged, capitalization weighted index of global large-cap stocks,
excluding the United States. Index returns include net reinvested dividends and/or interest income. The S&P SmallCap 600 Index
is an index of U.S. small-cap stocks selected by Standard & Poor’s based on market size, liquidity, and industry grouping,
among other factors. The Nasdaq Composite Index is a market capitalization weighted index of more than 3,700 stocks listed on
the Nasdaq stock exchange. The (Center for Research in Security Prices) CRSP (Center for Research in Security Pricing) equally
divides the companies listed on the NYSE into 10 deciles based on market capitalization. Deciles 1-5 represent the largest domestic
equity companies and Deciles 6-10 represent the smallest. CRSP then sorts all listed domestic equity companies based on these
market cap ranges. By way of comparison, the CRSP 1-5 would have similar capitalization parameters to the S&P 500 and the
CRSP 6-10 would have similar capitalization parameters to those of the Russell 2000. The performance of an index does not represent
exactly any particular investment, as you cannot invest directly in an index. Index returns used in this Report were based on
information supplied to Royce by Russell for the Russell market indexes and by MSCI for the MSCI market indexes. Royce has not
independently verified the above described information.
The
Price-Earnings, or P/E, Ratio is calculated by dividing a company’s share price by its trailing 12-month earnings-per-share
(EPS). The Price-to-Book, or P/B, Ratio is calculated by dividing a company’s share price by its book value per share. Beta
is a measure of the volatility or risk of an investment compared to the market as a whole. Alpha describes an investment strategy’s
ability to beat the market. The Morningstar Style Map uses proprietary scores of a stock’s value and growth characteristics
to determine its placement in one of the five categories listed on the horizontal axis. These characteristics are then compared
to those of other stocks within the same market capitalization band. Each is scored from zero to 100 for both value and growth
attributes. The value score is subtracted from the growth score to determine the overall style score. For the vertical, market
cap axis, Morningstar subdivides into size groups. Giant-cap stocks are defined as those that account for the top 40% of the capitalization
of each style zone; large-cap stocks represent the next 30%; mid-cap stocks the next 20%; small-cap stocks the next 7%; micro-cap
stocks the smallest 3%. For the Morningstar Small Blend Category: © 2023 Morningstar. All Rights Reserved. The information
regarding the category in this piece is: (1) is proprietary to Morningstar and/or its content providers; (2) may not be copied
or distributed; and (3) is not warranted to be accurate, complete or timely. Neither Morningstar nor its content providers are
responsible for any damages or losses arising from any use of this information. Cyclical and Defensive are defined as follows:
Cyclical: Communication Services, Consumer Discretionary, Energy, Financials, Industrials, Information Technology, and Materials.
Defensive: Consumer Staples, Health Care, Real Estate, and Utilities. Return on Invested Capital is calculated by dividing a company’s
past 12 months of operating income (earnings before interest and taxes) by its average invested capital (total equity, less cash
and cash equivalents, plus total debt, minority interest, and preferred stock). The Royce Funds is a service mark of The Royce
Funds.
Investment
Objectives
The
investment objective of each Fund is long-term growth of capital.
Investment
Policies
Royce
Global Value Trust, Inc. (“RGT”). Under normal circumstances, RGT will invest at least 80% of its net assets in
equity securities, such as common stock and preferred stock. RGT generally invests a significant portion of its assets U.S. and
non-U.S. small/mid-cap stocks (generally market caps up to $10 billion). Under normal circumstances, at least 40% of RGT’s
net assets will be invested in the equity securities of companies headquartered in at least three countries outside the United
States. From time to time, a substantial portion of RGT’s assets may be invested in companies located in a single country.
Although there are no geographic limits on RGT’s investments, no more than 35% of RGT’s net assets may be invested
in the securities of companies headquartered in “developing countries,” also known as emerging markets. Generally,
developing countries include every country in the world other than the United States, Canada, Japan, Australia, New Zealand, Hong
Kong, Singapore, South Korea, Taiwan, Bermuda, and Western European countries (which include, Austria, Belgium, Denmark, France,
Finland, Germany, Greece, Ireland, Italy,
62
| This page is not part of the 2023 Semiannual Report to Stockholders
Notes
to Performance and Other Important Information (continued)
Luxembourg,
the Netherlands, Norway, Portugal, Spain, Sweden, Switzerland and the United Kingdom).
Royce
Micro-Cap Trust, Inc. (“RMT”). RMT normally invests at least 80% of its net assets in the equity securities of
micro-cap companies. Micro-cap companies are those that have a market capitalization not greater than that of the largest company
in the Russell Microcap® Index at the time of its most recent reconstitution. Royce employs a core approach that
combines multiple investment themes and focuses on companies with strong fundamentals and/or prospects selling at prices that
Royce believes do not fully reflect these attributes. RMT may invest up to 25% of its assets in securities of issuers headquartered
outside the United States.
Royce
Value Trust, Inc. (“RVT”). RVT normally invests at least 65% of its assets in the equity securities of small-
and micro-cap companies. Such companies are those that have a market capitalization not greater than that of the largest company
in the Russell 2000® Index at the time of its most recent reconstitution. Royce employs a core approach that combines
multiple investment themes and focuses on companies with high returns on invested capital or those with strong fundamentals and/or
prospects trading at what Royce believes are attractive valuations. A portion of the Fund’s assets is managed using a systematic
multi-factor selection process that is derived from the investment philosophies used by the Fund’s Portfolio Managers in
managing the remainder of the Fund. While this multi-factor process provides guidance, a Portfolio Manager has discretion for
which buys and sells are executed. RVT may invest up to 25% of its assets in securities of issuers headquartered outside the United
States.
Recent
Adoption of Certain Operating Policies
A
Fund’s fundamental investment policies may not be changed without the approval of a “majority of the outstanding voting
securities” (as defined in the Investment Company Act of 1940 Act (the “1940 Act”)) of that Fund. The investment
policies and limitations of a Fund that are not fundamental investment policies are referred to as operating policies and may
be changed by a majority vote of the Board of Directors of the relevant Fund and without stockholder approval. Notwithstanding
any fundamental investment policy that could be deemed to permit a Fund to enter into a “derivatives transaction”
within the meaning of Rule 18f-4 under the 1940 Act, the Funds recently adopted operating policies that, effective as of August
19, 2022, prohibit the Funds from entering into any such “derivatives transaction,” including investing in options.
Primary
Risks
As
with any closed-end fund that invests in common stocks, each Fund is subject to market risk—the possibility that common
stock prices will decline over short and/or extended periods of time due to overall market, financial, and economic conditions,
trends, or events, governmental or central bank actions or interventions, changes in investor sentiment, armed conflicts, economic
sanctions and countermeasures in response to sanctions, market disruptions caused by trade disputes or other factors, political
developments, major cybersecurity events and acts of terrorism, the global and domestic effects of a pandemic or epidemic, contagion
effects on the finance sector and the overall economy from banking industry instability, and other factors that may or may not
be directly related to the issuer of a security held by a Fund. Economies and financial markets throughout the world are increasingly
interconnected, and economic, financial, or political events in one country or region could have profound impacts on global economies
or markets. The COVID-19 pandemic and its subsequent variants, Russia’s invasion of Ukraine, and recent banking industry
instability may adversely affect global economies, markets, industries, and individual companies in ways that cannot necessarily
be foreseen. As a result, the value of your investment in a Fund will fluctuate, sometimes sharply and unpredictably, and you
could lose money over short and/or long periods of time.
Investors
wanting to buy or sell shares of a Fund must do so on a stock exchange, as with any publicly traded stock. Shares of closed-end
funds frequently trade at a discount to their net asset value. This is in contrast to open-end mutual funds, which sell and redeem
their shares at net asset value on a continuous basis.
The
prices of equity securities of the smaller companies in which the Funds invest are generally more volatile than those of larger-cap securities. In addition, because these securities tend to have significantly lower trading volumes than larger-cap securities,
the Funds may have difficulty selling holdings or may only be able to sell holdings at prices substantially lower than what Royce
believes they are worth. Therefore, each Fund may involve considerably more risk of loss and its returns may differ significantly
from funds investing in larger-cap companies or other asset classes. No assurance can be given that there will be net investment
income to distribute and/or that the Funds will achieve their investment goals.
Investment
in foreign securities involves risks that may not be encountered in U.S. investments, including adverse political, social, economic,
or other developments that are unique to a particular region or country. Prices of foreign securities in particular countries
or regions may, at times, move in a different direction and/or be more volatile than those of U.S. securities. Each Fund’s
investments are usually denominated in or tied to the currencies of the countries in which they are primarily traded. Because
the Funds do not intend to hedge their foreign currency exposure, the U.S. dollar value of the Funds’ investments may be
harmed by declines in the value of foreign currencies in relation to the U.S. dollar. This may occur even if the value of the
investment in the currency’s home country has not declined. These risk factors may affect the prices of foreign securities
issued by companies headquartered in developing countries more than those headquartered in developed countries. For example, many
developing countries have in the past experienced high rates of inflation or sharply devalued their currencies against the U.S.
dollar, thereby causing the value of investments in companies located in those countries to decline. Transaction costs are often
higher in developing countries, and there may be delays in settlement procedures. To the extent that a Fund’s investments
in the securities of international companies consists of non-U.S. headquartered companies that trade on a U.S. exchange, some
or all of the above-stated risks of investing in international companies may not apply.
Each
Fund may, from time to time, invest a significant portion of its assets in companies from a single sector or a limited number
of sectors. Such an investment approach may involve considerably more risk to investors than one that is more broadly diversified
across economic sectors because it may be more susceptible to corporate, economic, political, regulatory, or market events that
adversely affect the relevant sector(s). As of June 30, 2023, each of RGT and RVT invested a significant portion of its assets
in companies from the Industrials sector while RMT invested a significant portion of its assets in companies from the Information
Technology sector. Industrials sector companies can be significantly affected by general economic trends, commodity prices, legislation,
government regulation and spending, import and export controls, worldwide competition, changes in consumer sentiment and spending,
and liability for environmental damage, depletion of resources, and mandated expenditures for safety and pollution control. Companies
from the Information Technology sector can be significantly affected by obsolescence of existing technology, short product cycles,
falling prices and profits, competition from new market entrants, and general economic conditions.
Royce’s
estimate of a company’s current worth may prove to be inaccurate, or this estimate may not be recognized by other investors,
which could lead to portfolio losses or underperformance relative to similar funds and/or a Fund’s benchmark index(es).
Securities in the Funds’ portfolios may not increase as much as the market as a whole and
This
page is not part of the 2023 Semiannual Report to Stockholders | 63
Notes
to Performance and Other Important Information (continued)
some
securities may continue to be undervalued for long periods of time or may never reach what Royce believes are their full market
values.
Investments
in a Fund are not bank deposits and are not insured or guaranteed by the Federal Deposit Insurance Corporation or any other government
agency.
Environmental,
Social, and Governance (“ESG”) Investment Considerations and Risks
Royce
believes certain material ESG factors have the potential to contribute to a stock’s long-term performance, and therefore
Royce may evaluate the potential impacts of ESG considerations when assessing a company’s financial condition and profitability.
This analysis allows Royce’s portfolio managers to determine whether a company’s ESG practices pose a material financial
risk or create an opportunity for investment. The Funds’ investments in cash and cash equivalents and any securities lending
activities will not be assessed for ESG factors. Consideration of ESG factors and risks is only one component of Royce’s
assessment of potential investments and, as with its consideration of other factors and risks, may not be a determinative factor
in any decision to purchase, sell, or hold a security. In addition, where ESG factors are considered, the weight given to ESG
factors may vary between Funds and across different types of investments, sectors, industries, regions, and issuers; and ESG factors
and weights considered may change over time. Royce may not assess every investment for ESG factors and, when it does, not every
ESG factor may be identified or evaluated. Royce’s assessment of a company’s ESG factors is subjective and may differ
from that of institutional investors, third-party service providers (e.g., ratings providers), and/or other funds, and may be
dependent on the availability of timely, complete, and accurate ESG data reports from issuers and/ or third-party research providers,
the timeliness, completeness, and accuracy of which is outside of Royce’s control. ESG factors are often not uniformly
measured or defined, which could impact Royce’s ability to evaluate a company. While Royce views certain ESG factors as
having the potential to contribute to a stock’s long-term performance, there is no guarantee that such results will be achieved.
Forward-Looking
Statements
This
material contains forward-looking statements within the meaning of the Securities Exchange Act of 1934, as amended (the “Exchange
Act”), that involve risks and uncertainties, including, among others, statements as to:
| ● | the
Funds’ future operating results |
| ● | the
prospects of the Funds’ portfolio companies |
| ● | the
impact of investments that the Funds have made or may make |
| ● | the
dependence of the Funds’ future success on the general economy and its impact on
the companies and industries in which the Funds invest, and |
| ● | the
ability of the Funds’ portfolio companies to achieve their objectives. |
This
Review and Report uses words such as “anticipates,” “believes,” “expects,” “future,”
“intends,” and similar expressions to identify forward-looking statements. Actual results may differ materially from
those projected in the forward-looking statements for any reason.
The
Royce Funds have based the forward-looking statements included in this Review and Report on information available to us
on the date of the report, and we assume no obligation to update any such forward-looking statements. Although The Royce Funds
undertake no obligation to revise or update any forward-looking statements, whether as a result of new information, future events
or otherwise, you are advised to consult any additional disclosures that we may make through future stockholder communications
or reports.
Authorized
Share Transactions
Royce
Global Value Trust, Royce Micro-Cap Trust, and Royce Value Trust may each repurchase up to 5% of the issued and outstanding shares
of its respective common stock during the year ending December 31, 2023. Any such repurchases would take place at then prevailing
prices in the open market or in other transactions. Common stock repurchases would be effected at a price per share that is less
than the share’s then current net asset value.
Royce
Global Value Trust, Royce Micro-Cap Trust, and Royce Value Trust are also authorized to offer their common stockholders an opportunity
to subscribe for additional shares of their common stock through rights offerings at a price per share that may be less than the
share’s then current net asset value. The timing and terms of any such offerings are within each Board’s discretion.
Annual
Certifications
As
required, the Funds have submitted to the New York Stock Exchange (“NYSE”) for the annual certification of the Funds’
Chief Executive Officer that he is not aware of any violation of the NYSE’s listing standards. The Funds also have included
the certification of the Funds’ Chief Executive Officer and Chief Financial Officer required by section 302 of the Sarbanes-Oxley
Act of 2002 as exhibits to the Funds’ form N-CSR for the period ended December 31, 2022, filed with the Securities and Exchange
Commission.
Proxy
Voting
A
copy of the policies and procedures that The Royce Funds use to determine how to vote proxies relating to portfolio securities
and information regarding how each of The Royce Funds voted proxies relating to portfolio securities during the most recent 12-month
period ended June 30 is available, without charge, on The Royce Funds’ website at www.royceinvest.com, by calling (800)
221-4268 (toll-free) and on the website of the Securities and Exchange Commission (“SEC”), at www.sec.gov.
Disclosure
of Portfolio Holdings
The
Funds’ complete portfolio holdings are also available on Exhibit F to Form N-PORT, which filings are made with the SEC within
60 days of the end of the first and third fiscal quarters. The Funds’ Form N-PORT filings are available on the SEC’s
website at http://www.sec.gov.
64
| This page is not part of the 2023 Semiannual Report to Stockholders


About Royce Investment Partners
Unparalleled Knowledge + Experience
Pioneers in small-cap investing, with 50+ years
of experience, depth of knowledge,
and focus.
Independent Thinking
The confidence to go against consensus, the insight
to uncover opportunities others might miss, and the
tenacity to stay the course through market cycles.
Specialized Approaches
U.S., international, and global investment strategies
that pursue approaches with different
risk profiles.
Unwavering Commitment
Our team of 17 portfolio managers
has significant
personal investments in the strategies
they manage.
Contact
Us
GENERAL INFORMATION
General Royce Funds information including
an
overview of our firm and Funds
(800) 221-4268
COMPUTERSHARE
Transfer Agent and Registrar
Speak with a representative about:
| • | Your
account, transactions, and forms |
(800) 426-5523
FINANCIAL ADVISORS AND BROKER-DEALERS
Speak
with your regional Royce contact regarding:
| • | Information about our firm, strategies, and Funds |
CE-REP-0623
Item 2. Code(s) of Ethics. Not applicable to this semi-annual
report.
Item 3. Audit Committee Financial
Expert. Not applicable to this semi-annual report.
Item 4. Principal Accountant Fees and Services. Not
applicable to this semi-annual report.
Item 5. Audit Committee of Listed Registrants. Not applicable
to this semi-annual report.
Item 6. Investments.
(a) See Item 1.
(b) Not Applicable.
Item 7. Disclosure of Proxy Voting Policies and Procedures
for Closed-End Management Investment Companies. Not applicable to this semi-annual report.
Item 8. Portfolio Managers of Closed-End Management Investment
Companies. Not applicable to this semi-annual report.
Item 9. Purchases of Equity Securities by Closed-End Management
Investment Company and Affiliated Purchasers. Not Applicable.
Item 10. Submission of Matters to a Vote of Security Holders.
Not Applicable.
Item 11. Controls and Procedures.
(a) Disclosure Controls and Procedures. The Principal Executive
and Financial Officers concluded that the Registrant's Disclosure Controls and Procedures are effective based on their evaluation
of the Disclosure Controls and Procedures as of a date within 90 days of the filing date of this report.
(b) Internal Control over Financial Reporting. There were no
significant changes in Registrant's internal control over financial reporting or in other factors that could significantly affect
this control subsequent to the date of the evaluation, including any corrective actions with regard to significant deficiencies
and material weaknesses during the period covered by this report.
Item 12. Exhibits. Attached hereto.
(a)(1) Not applicable to this semi-annual report.
(a)(2) Separate certifications by the Registrant’s Principal Executive Officer and Principal Financial Officer as required by Rule 30a-2(a) under the Investment Company Act of 1940.
(a)(3) Not Applicable.
(b) Separate certifications by the Registrant’s Principal Executive Officer and Principal Financial Officer, pursuant to Section 906 of the Sarbanes-Oxley Act of 2002 and required by Rule 30a-2(b) under the Investment Company Act of 1940.
Pursuant to the requirements of the Securities Exchange Act
of 1934 and the Investment Company Act of 1940, the registrant has duly caused this report to be signed on its behalf by the undersigned,
thereunto duly authorized.
ROYCE GLOBAL VALUE TRUST, INC.
| BY: | /s/ Christopher D. Clark |
|
Christopher D. Clark
President
Date: August 10, 2023
Pursuant to the requirements of the Securities Exchange Act
of 1934 and the Investment Company Act of 1940, this report has been signed below by the following persons on behalf of the registrant
and in the capacities and on the dates indicated.
| ROYCE GLOBAL VALUE TRUST, INC. |
|
ROYCE GLOBAL VALUE TRUST,
INC. |
|
| |
|
|
|
|
|
| BY: |
/s/ Christopher D. Clark |
|
BY: |
/s/ Peter K. Hoglund |
|
| Christopher D. Clark |
|
Peter K. Hoglund |
|
| President |
|
Chief Financial Officer |
|
| |
|
|
|
| Date: August 10, 2023 |
|
Date: August 10, 2023 |
|
Item 12(a)(2):
CERTIFICATIONS
I, Christopher D. Clark, certify that:
1. I have reviewed this report on Form N-CSR of Royce Global Value Trust, Inc.;
2. Based on my knowledge, this report does not contain any untrue
statement of a material fact or omit to state a material fact necessary to make the statements made, in light of the circumstances
under which such statements were made, not misleading with respect to the period covered by this report;
3. Based on my knowledge, the financial statements, and other
financial information included in this report, fairly present in all material respects the financial condition, results of operations,
changes in net assets, and cash flows (if the financial statements are required to include a statement of cash flows) of the registrant
as of, and for, the periods presented in this report;
4. The registrant's other certifying officer and I are responsible
for establishing and maintaining disclosure controls and procedures (as defined in Rule 30a-3(c) under the Investment Company Act
of 1940) and internal control over financial reporting (as defined in Rule 30a-3(d) under the Investment Company Act of 1940) for
the registrant and have:
a) designed such disclosure controls and procedures, or caused
such disclosure controls and procedures to be designed under our supervision, to ensure that material information relating to the
registrant, including its consolidated subsidiaries, is made known to us by others within those entities, particularly during the
period in which this report is being prepared;
b) designed such internal control over financial reporting,
or caused such internal control over financial reporting to be designed under our supervision, to provide reasonable assurance
regarding the reliability of financial reporting and the preparation of financial statements for external purposes in accordance
with generally accepted accounting principles;
c) evaluated the effectiveness of the registrant’s disclosure
controls and procedures and presented in this report our conclusions about the effectiveness of the disclosure controls and procedures,
as of a date within 90 days prior to the filing date of this report based on such evaluation; and
d) disclosed in this report any change in the registrant’s
internal control over financial reporting that occurred during the period covered by this report that has materially affected,
or is reasonably likely to materially affect, the registrant’s internal control over financial reporting; and
5. The registrant's other certifying officer and I have disclosed
to the registrant's auditors and the audit committee of the registrant's board of directors (or persons performing the equivalent
functions):
a) all significant deficiencies and material weaknesses in the
design or operation of internal control over financial reporting which are reasonably likely to adversely affect the registrant's
ability to record, process, summarize, and report financial information; and
b) any fraud, whether or not material, that involves management
or other employees who have a significant role in the registrant's internal control over financial reporting.
Date: August 10, 2023
| |
/s/ Christopher D. Clark |
|
| |
Christopher D. Clark |
|
| |
President |
|
Item 12(a)(2):
CERTIFICATIONS
I, Peter K. Hoglund, certify that:
1. I have reviewed this report on Form N-CSR of Royce Global Value Trust, Inc.;
2. Based on my knowledge, this report does not contain any untrue
statement of a material fact or omit to state a material fact necessary to make the statements made, in light of the circumstances
under which such statements were made, not misleading with respect to the period covered by this report;
3. Based on my knowledge, the financial statements, and other
financial information included in this report, fairly present in all material respects the financial condition, results of operations,
changes in net assets, and cash flows (if the financial statements are required to include a statement of cash flows) of the registrant
as of, and for, the periods presented in this report;
4. The registrant's other certifying officer and I are responsible
for establishing and maintaining disclosure controls and procedures (as defined in Rule 30a-3(c) under the Investment Company Act
of 1940) and internal control over financial reporting (as defined in Rule 30a-3(d) under the Investment Company Act of 1940) for
the registrant and have:
a) designed such disclosure controls and procedures, or caused
such disclosure controls and procedures to be designed under our supervision, to ensure that material information relating to the
registrant, including its consolidated subsidiaries, is made known to us by others within those entities, particularly during the
period in which this report is being prepared;
b) designed such internal control over financial reporting,
or caused such internal control over financial reporting to be designed under our supervision, to provide reasonable assurance
regarding the reliability of financial reporting and the preparation of financial statements for external purposes in accordance
with generally accepted accounting principles;
c) evaluated the effectiveness of the registrant’s disclosure
controls and procedures and presented in this report our conclusions about the effectiveness of the disclosure controls and procedures,
as of a date within 90 days prior to the filing date of this report based on such evaluation; and
d) disclosed in this report any change in the registrant’s
internal control over financial reporting that occurred during the period covered by this report that has materially affected,
or is reasonably likely to materially affect, the registrant’s internal control over financial reporting; and
5. The registrant's other certifying officer and I have disclosed
to the registrant's auditors and the audit committee of the registrant's board of directors (or persons performing the equivalent
functions):
a) all significant deficiencies and material weaknesses in the
design or operation of internal control over financial reporting which are reasonably likely to adversely affect the registrant's
ability to record, process, summarize, and report financial information; and
b) any fraud, whether or not material, that involves management
or other employees who have a significant role in the registrant's internal control over financial reporting.
Date: August 10, 2023
| |
/s/ Peter K. Hoglund |
|
| |
Peter K. Hoglund |
|
| |
Chief Financial Officer |
|
Item 12(b):
CERTIFICATION PURSUANT TO 18 U.S.C. SECTION
1350,
AS ADOPTED PURSUANT TO
SECTION 906 OF THE SARBANES-OXLEY ACT
OF 2002
Name of Issuer: ROYCE GLOBAL VALUE TRUST, INC.
In connection with the Report on Form N-CSR of the above-named
issuer that is accompanied by this certification, the undersigned hereby certifies, to his knowledge, that:
1. The Report fully complies with the requirements of Section
13(a) or 15 (d) of the Securities Exchange Act of 1934; and
2. The information contained in the Report fairly presents,
in all materials respects, the financial condition and results of operations of the issuer.
Date: August 10, 2023
| |
/s/ Christopher D. Clark |
|
| |
Christopher D. Clark |
|
| |
President |
|
Item 12(b):
CERTIFICATION PURSUANT TO 18 U.S.C. SECTION
1350,
AS ADOPTED PURSUANT TO
SECTION 906 OF THE SARBANES-OXLEY ACT
OF 2002
Name of Issuer: ROYCE GLOBAL VALUE TRUST, INC.
In connection with the Report on Form N-CSR of the above-named
issuer that is accompanied by this certification, the undersigned hereby certifies, to his knowledge, that:
1. The Report fully complies with the requirements of Section
13(a) or 15 (d) of the Securities Exchange Act of 1934; and
2. The information contained in the Report
fairly presents, in all materials respects, the financial condition and results of operations of the issuer.
Date: August 10, 2023
| |
/s/ Peter K. Hoglund |
|
| |
Peter K. Hoglund |
|
| |
Chief Financial Officer |
|
Royce Global Value (NYSE:RGT)
Historical Stock Chart
Von Mär 2024 bis Apr 2024

Royce Global Value (NYSE:RGT)
Historical Stock Chart
Von Apr 2023 bis Apr 2024
