UNITED STATES
SECURITIES AND EXCHANGE COMMISSION
Washington, D.C. 20549
FORM N-CSR
CERTIFIED SHAREHOLDER REPORT
OF
REGISTERED MANAGEMENT INVESTMENT COMPANIES
Investment Company Act File Number: 811-22532
Name of Registrant: Royce Global Value Trust,
Inc.
Address of Registrant: 745 Fifth Avenue
New York, NY 10151
Name of agent for service: John E. Denneen,
Esquire
Address of agent for service: 745 Fifth
Avenue
New York, NY 10151
Registrant’s telephone number, including
area code: (212) 508-4500
Date of fiscal year end: December 31
Date of reporting period: January 1, 2023
– December 31, 2023
| Item 1. | Reports to Shareholders. |

royceinvest.com
Royce Closed-End Funds 2023 Annual
Review and Report to Stockholders
December 31, 2023
Royce Global Value Trust
Royce Micro-Cap Trust
Royce Value Trust
A Few Words on Closed-End
Funds
Royce
Investment Partners (“Royce”) manages three closed-end funds: Royce Global Value Trust, which primarily invests in
both U.S. and non-U.S. companies with market capitalization below $10 billion; Royce Micro-Cap Trust, which primarily invests
in micro-cap securities; and Royce Value Trust, which primarily invests in small-cap securities. A closed-end fund is an investment
company whose shares are listed and traded on a stock exchange. Like all investment companies, including open-end mutual funds,
the assets of a closed-end fund are professionally managed in accordance with the investment objectives and policies approved
by the fund’s Board of Directors. A closed-end fund raises cash for investment by issuing a fixed number of shares through
initial and other public offerings that may include shelf offerings and periodic rights offerings. Proceeds from the offerings
are invested in an actively managed portfolio of securities. Investors wanting to buy or sell shares of a publicly traded closed-end
fund after the initial and any subsequent offerings must do so on a stock exchange, as with any publicly traded stock. Shares
of closed-end funds frequently trade at a discount to their net asset value. This is in contrast to open-end mutual funds, which
sell and redeem their shares at net asset value on a continuous basis.
A Closed-End
Fund Can Offer Several Distinct Advantages
| • | A
closed-end fund does not issue redeemable securities or offer its securities on a continuous basis, so it does not need to liquidate
securities or hold uninvested assets to meet investor demands for cash redemptions. |
| • | In
a closed-end fund, not having to meet investor redemption requests or invest at inopportune times can be effective for value managers
who attempt to buy stocks when prices are depressed and sell securities when prices are high. |
| • | A
closed-end fund may invest in less liquid portfolio securities because it is not subject to potential stockholder redemption demands.
This is potentially beneficial for Royce-managed closed-end funds, with significant investments in small- and micro-cap securities. |
| • | The
fixed capital structure allows permanent leverage to be employed as a means to enhance capital appreciation potential. |
| • | Royce
Micro-Cap Trust and Royce Value Trust distribute capital gains, if any, on a quarterly basis. Each of these Funds has adopted
a quarterly distribution policy for its common stock. |
We
believe that the closed-end fund structure can be an appropriate investment for a long-term investor who understands the benefits
of a more stable pool of capital.
Why Dividend
Reinvestment Is Important
A
very important component of an investor’s total return comes from the reinvestment of distributions. By reinvesting distributions,
our investors can maintain an undiluted investment in a Fund. To get a fair idea of the impact of reinvested distributions, please
see the charts on pages 61 and 62. For additional information on the Funds’ Distribution Reinvestment and Cash Purchase
Options and the benefits for stockholders, please see page 63 or visit our website at www.royceinvest.com.
Managed Distribution
Policy
The
Board of Directors of each of Royce Micro-Cap Trust and Royce Value Trust has authorized a managed distribution policy (MDP).
Under the MDP, Royce Micro-Cap Trust and Royce Value Trust pay quarterly distributions at an annual rate of 7% of the average
of the prior four quarter-end net asset values, with the fourth quarter being the greater of these annualized rates or the distribution
required by IRS regulations. With each distribution, the Fund will issue a notice to its stockholders and an accompanying press
release that provides detailed information regarding the amount and composition of the distribution (including whether any portion
of the distribution represents a return of capital) and other information required by a Fund’s MDP. You should not draw
any conclusions about a Fund’s investment performance from the amount of distributions or from the terms of a Fund’s
MDP. A Fund’s Board of Directors may amend or terminate the MDP at any time without prior notice to stockholders; however,
at this time there are no reasonably foreseeable circumstances that might cause the termination of any of the MDPs.
This
page is not part of the 2023 Annual Report to Stockholders
Table
of Contents

This
page is not part of the 2023 Annual Report to Stockholders | 1
Letter
to Our Stockholders

2023: THE DOG THAT DIDN’T BARK
While every year is eventful and interesting in its own right, we think 2023 held particular interest for equity investors—specifically
those of us who focus on small-cap stocks. There was no shortage of consequential geopolitical developments. Some, like the
war in Ukraine, showed no evidence of ending or abating, while others, like the terrorist attack on Israel and consequent
bombings in Gaza, were new events, as were the well publicized implosions of Silicon Valley, Signature, and First Republic
Banks. The contagion was contained, however, and the rest the of the economic news was much brighter, at least here in the
U.S. The year began with inflation still stubbornly high and, as a consequence, the Fed still hiking rates and committed to
doing so until the rate of rising prices slowed. This commitment bred a curious form of cognitive dissonance, with every public
statement from a Fed official pledging adherence to the central bank’s target of 2% inflation almost immediately meeting
with word from a financial or investment pundit insisting that they really meant 3-4%.
This was understandable to some degree. Many observers pointed to both inflation’s moderating pace (after peaking in
June of 2022) and the resilience of the U.S. economy as evidence that the Fed should take a victory lap and leave rates untouched—or
cut them. Many investors shared these views while no doubt hoping that the positive returns for equities through the first
half of 2023 would not be put at risk by another round of rate hikes. To be sure, some investors were concerned that “higher
for longer” might be all it took to snuff out a nascent recovery for stocks. We shared some of this anxiety. After all,
2022 saw the most aggressive rate hike cycle in the Fed’s history. And it was not just a bad year for the capital markets,
it was historically awful: the third-worst calendar year performance for both the small-cap Russell 2000 Index and the large-cap
Russell 1000 Index since their shared inception date at the end of 1978, with each posting their lowest respective returns
since 2008. It was the seventh worst year for the S&P 500 since its inception in 1928, and the worst ever for the Bloomberg
Barclays US Aggregate Bond Index since its inception in 1976. As we wrote one year ago, 2022 offered nowhere to run and nowhere
to hide.
2
| This page is not part of the 2023 Annual Report to Stockholders
LETTER TO OUR STOCKHOLDERS
The most interesting, and ultimately most significant, element to 2023 was perhaps what did not happen.
The most consistently predicted and regularly anticipated recession—said to be imminent since 2021—
once again failed to materialize in 2023.
In this context, the fear of a second straight down year for stocks, which periodically rattled the U.S. equity markets at
various times in 2023, seemed almost logical, hitting small and large-cap stocks at different points—and with different
intensities—throughout the year. However, by the end of December these worries had mostly dissipated. With the Fed holding
the line on rates, higher for longer ultimately did not hold back returns. A growing economy, burgeoning optimism about a
soft landing for inflation, and confidence that the rate hike cycle had ended combined to lift share prices, as did optimism
for rate reductions in 2024. Despite these developments, however, the most interesting, and ultimately most significant, element
to 2023 was perhaps what did not happen. The most consistently predicted and regularly anticipated recession—said to
be imminent since 2021—once again failed to materialize in 2023. Its absence reminded us of “the curious incident
of the dog in the night-time” from the famous Sherlock Holmes story, “The Adventure of Silver Blaze.” The
iconic detective solves the case by pointing out how odd it was that the dog guarding the pen where the titular racehorse
was stabled failed to bark when Silver Blaze was stolen. The phrase has since been used as shorthand to describe situations
when what doesn’t happen matters at least as much, if not more, than what does. Which is about as apt a description
of 2023 as we think can be found.
THE
STATE OF SMALL-CAP
As
measured by the Russell 2000 Index, small-cap stocks did quite well in 2023, advancing 16.9%. Yet most of this gain came in a
robust rally from the 2023 low on October 31st through the end of the year. So, although small-caps kicked off the
year with high returns, they trended mostly downward from early February into Halloween. All told, the Russell 2000 had a positive
return in just five months in 2023: January, June, July, November, and December, with the last two months combining to post an
impressive gain of 22.4%. Thanks to this exceptional close, the Russell 2000 escaped a bear market at the end of
2023, though the small-cap index remained down -14.3% from its last peak on 11/8/21, while large-caps continued to establish
new highs in December and into January 2024. Moreover, as of 12/31/23, the average stock in the small-cap index was -25.1%
off its 52-week high. In this context, it was not terribly surprising that small-cap’s excellent finish could not lift
its calendar-year return above large-cap’s. The Russell 1000 Index gained 26.5% in 2023 while also beating small-cap
for the 3-, 5-, and 10-year periods ended 12/31/23. In fact, large-caps outpaced small-caps in nine of the last 10 calendar
years.
Small-Caps Lagged Large-Caps from the Russell 2000’s Last Peak
Russell 2000 and Russell 1000 Cumulative Returns, 11/8/21-12/31/23

Past performance is no guarantee of future results.
This seemingly chronic bout of underperformance has made the current cycle a deeply frustrating one for small-cap investors.
At the end of January 2024, 594 days had passed from the current cycle low for the Russell 2000, making it the second longest
stretch without recovering its prior peak on record. The two other lengthy small-cap cycles each encompassed dramatic developments:
the implosion of high-flying technology stocks in 2000-02, when the Russell 2000 needed 456 days from its trough to match
its previous peak, and the 2008-09 Financial Crisis, when 704 days passed before small-caps recovered from the trough during
that global financial catastrophe. So, while the current small-cap cycle has taken place amid ample uncertainty along with
a record pace of interest rate increases, it
This page is not part of the 2023 Annual Report to Stockholders | 3
LETTER TO OUR STOCKHOLDERS
has lacked the existential threats that characterized the Internet Bubble and, even more so, the Financial Crisis. The latter
period also saw less bifurcation between small- and large-cap returns. The key question, then, is when will this cycle end
and potentially usher in a small-cap outperformance run? It’s a point we’ll touch on later in this letter.
Within small-cap, both the value and growth indexes had strong finishes to the year, with the 4Q23 advantage squarely in value’s
favor: the Russell 2000 Value Index advanced 15.3% versus 12.7% for the Russell 2000 Growth Index. It’s comparatively
rare for small-cap value to beat its growth sibling in a positive quarter, particularly one with double-digit gains. It’s
happened in only 42 of 119 positive quarters, or 35% of the time since the Russell 2000’s inception on 12/31/78. The
Russell 2000 Value also led from the previous 2023 small-cap high on July 31st, up 4.0% versus -0.2% through the end of December.
For 2023 as a whole, however, growth led, gaining 18.7% versus 14.6%. It’s worth noting that 2023’s results contributed
to something of a sawtooth pattern of relative performance. The Russell 2000 Value led for the 3-year (in which the Russell
2000 Growth lost -3.5%) and 5-year periods while small-cap growth, in addition to its 1-year advantage, also outperformed
for the 10-year period ended 12/31/23.
THE
VALUATION SITUATION
Reviewing long-term performance patterns, we find that small-cap enjoyed a longstanding advantage over large-cap— just
as small-cap value did versus small-cap growth. Each of these dynamics began to shift in the aftermath of the Financial Crisis,
starting in earnest in 2011. In eight of the last 13 years, the Russell 1000 and Russell 2000 Growth each had higher returns
than both the Russell 2000 and Russell 2000 Value. Yet prior to that, the long-term edge was with the Russell 2000 and Russell
2000 Value. In light of this dominance from large-caps—and more recently mega-cap stocks—it appears that many
investors may have forgotten how anomalous the backdrop to the last 13 years has been until just recently, with anemic economic
growth and record low interest rates.
Now that both GDP and rates are returning to more historically typical levels, we expect to see some meaningful long-term
mean reversion going forward. To that end, large-cap outperformance cycles have historically peaked when a relatively small
number of the largest stocks were winning the lion’s share of performance—which was the case with the S&P
500 and the Nasdaq Composite Indexes in 1973 and March 2000.
We therefore see something of a silver lining to the recent relative performance woes for small-cap stocks versus their
Large-Cap Cycles Peak at Market Tops Crowded with Mega-Caps
Weight
of Top 5 S&P 500 Stocks vs. Small-Cap Relative Performance, 9/29/72-12/31/23
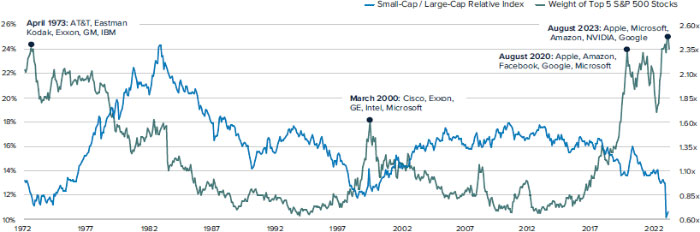
Source: Furey Research Partners
Past performance is no guarantee of future results.
4
| This page is not part of the 2023 Annual Report to Stockholders
LETTER TO OUR STOCKHOLDERS
Relative Valuations for Small Caps vs. Large Caps Are Near Their Lowest in 25 Years
Russell 2000 vs Russell 1000 Median LTM EV/EBIT¹ (ex. Negative EBIT Companies), 12/31/98 through 12/31/23

1
Earnings Before Interest and Taxes
Past performance is no guarantee of future results. Source: FactSet
larger peers. The Russell 2000 sported a far more attractive valuation than its large-cap counterpart at the end of last year.
Using our preferred index valuation metric of enterprise value to earnings before interest and taxes, or EV/EBIT, the Russell
2000 finished 2023 not far from its 25-year low relative to the Russell 1000.
Similarly, small-cap value continued to sell at a below average valuation compared to small-cap growth at the end of the year,
as measured by EV/EBIT. Micro-cap stocks also remain very attractively valued relative to large-cap based on EV/EBIT. As small-cap
specialists, we see the combination of more attractive valuations and reversals in long-term performance patterns as showing
the significant performance potential that exists for small-cap, small-cap value, and micro-cap stocks—especially when
stacked against their large- and mega-cap counterparts.
SMALL-CAP
OPPORTUNITIES
To be sure, with the Fed’s decision on 1/31/24 to leave interest rates unchanged for a third consecutive time, the backdrop
of normalized interest rates, tamer inflation, and a growing, nicely resilient U.S. economy appears amenable to strong equity
performance. It also looks to us that small-cap’s
lengthy stretch in the relative performance wilderness has run its course. Our reasoning is rooted in the notion that, as
the economy continues to stabilize, valuations are likely to rise for those businesses that have largely sat out the megacap
performance regime. Such a move looks more likely to benefit small-cap companies than larger ones. Moreover, the early tracking
estimates for real GDP in 1Q24 are highly favorable, and ongoing positive GDP growth brings the U.S. economy that much closer
to the Fed’s desired “soft landing.”
Of course, we are bottom-up stock pickers and portfolio managers, not economists—and we eschew predictions. But we also
understand that long-term mean reversion to small-cap leadership requires a catalyst. For all of the encouraging developments,
the U.S. economy is at this writing in something of a schizoid condition, with high levels of consumer spending on one hand
and a manufacturing and industrial slowdown on the other. Yet in 2024, the U.S. economy will see more tangible benefits from
reshoring, the CHIPS Act, and several infrastructure projects. Closer to our zone of expertise, earnings growth for small-cap
companies is currently expected to be higher than for larger-cap businesses in 2024.
This page is not part of the 2023 Annual Report to Stockholders | 5
LETTER TO OUR STOCKHOLDERS
We are looking forward to what we think should be a favorable cycle for small-cap stocks
and active management. We are more optimistic about the long-term prospects
for select small-caps than we have been in several years.
Small-Cap’s Estimated Earnings Growth Is Expected to Be Higher
in 2024 than Large-Cap’s
One Year EPS Growth as of 12/31/23

Earnings per share (EPS) is calculated as a company’s profit divided by the outstanding shares of its common stock. The EPS Growth Estimates
are the pre-calculated mean long-term EPS growth rate estimates by brokerage analysts. Long Term Growth (LTG) is the annual
EPS growth that the company can sustain over the next 3 or 5 years. Both estimates are the average of those provided by analysts
working for brokerage firms who provide research coverage on each individual security as reported by FactSet. All non-equity
securities, investment companies, and companies without brokerage analyst coverage are excluded.
One critical consequence of interest rates normalizing is that access to capital now has real costs—which should benefit
conservatively capitalized, fiscally prudent small-cap companies and the asset managers who hold them. The price of carrying
leverage on the balance sheet began to climb when the Fed first started raising rates in March of 2022—and its increased
cost means that advantages should accrue to those businesses with low debt, the ability to generate free cash flow, and proven
skill allocating capital prudently and effectively. Returns are thus likely to be spread more widely over the next few years,
with the reign of the Magnificent 7—the mega-cap cohort of Alphabet, Amazon, Apple, Meta, Microsoft, Nvidia, and Tesla—likely
coming to an end and with it, small-cap’s long stretch of underperformance. To be sure, attractively priced, high-quality
and/or growing small-cap businesses that have largely sat out the mega-cap performance regime could be clear beneficiaries.
To us, this represents a great opportunity for active managers seeking to identify those small-cap businesses best positioned
for long-term success. Our outlook is therefore constructive. Of course, we always put the most stock in what we’re
hearing from management teams—most of whom remain cautiously optimistic about 2024. We are therefore looking forward
to what we think should be a favorable cycle for small-cap stocks and active management. We are more optimistic about the
long-term prospects for select small-caps than we have been in several years.
Sincerely,
 |
 |
 |
|
| Charles M. Royce |
Christopher
D. Clark |
Francis
D. Gannon |
|
| Chairman, |
Chief Executive
Officer, and |
Co-Chief Investment
Officer, |
|
| Royce Investment Partners |
Co-Chief Investment
Officer, |
Royce Investment
Partners |
|
| January 31, 2024 |
Royce Investment
Partners |
|
|
| |
|
|
6
| This page is not part of the 2023 Annual Report to Stockholders
Performance
NAV Average Annual Total Returns
As
of December 31, 2023 (%)
| |
|
|
|
|
|
|
|
|
SINCE |
INCEPTION |
| |
1-YR |
3-YR |
5-YR |
10-YR |
15-YR |
20-YR |
25-YR |
30-YR |
INCEPTION |
DATE |
| Royce Global Value
Trust |
16.15 |
-0.47 |
9.13 |
5.53 |
N/A |
N/A |
N/A |
N/A |
5.69 |
10/17/13 |
| Royce Micro-Cap Trust |
16.64 |
4.93 |
13.58 |
8.16 |
13.24 |
8.90 |
10.21 |
10.66 |
10.65 |
12/14/93 |
| Royce Value Trust |
21.62 |
4.75 |
12.81 |
8.16 |
12.36 |
8.55 |
9.28 |
9.91 |
10.32 |
11/26/86 |
| INDEX |
|
|
|
|
|
|
|
|
|
|
| MSCI ACWI Small Cap
Index |
16.84 |
3.33 |
9.85 |
6.66 |
11.16 |
8.47 |
8.31 |
N/A |
N/A |
N/A |
| Russell Microcap Index |
9.33 |
0.61 |
8.56 |
5.79 |
10.65 |
6.39 |
N/A |
N/A |
N/A |
N/A |
| Russell
2000 Index |
16.93 |
2.22 |
9.97 |
7.16 |
11.30 |
8.11 |
7.91 |
8.56 |
N/A |
N/A |
Important
Performance and Risk Information
All
performance information in this Review and Report reflects past performance, is presented on a total return basis, net
of the Fund’s investment advisory fee, reflects the reinvestment of distributions and does not reflect the deduction of
taxes that a shareholder would pay on Fund distributions or the sale of Fund shares. Past performance is no guarantee of future
results. Investment return and principal value of an investment will fluctuate, so that shares may be worth more or less than
their original cost when sold. Current performance may be higher or lower than performance quoted. Current month-end performance
may be obtained at www.royceinvest.com. The Funds are closed-end registered investment companies whose respective shares of common
stock may trade at a discount to the net asset value. Shares of each Fund’s common stock are also subject to the market
risk of investing in the underlying portfolio securities held by each Fund. Each Fund is subject to market risk-the possibility
that common stock prices will decline, sometimes sharply and unpredictably, over short or extended periods of time. Such declines
may be caused by various factors, including market, financial, and economic conditions, governmental or central bank actions,
and other factors, such as the recent Covid pandemic or the recent conflicts in Ukraine and the Middle East, that may not be directly
related to the issuer of a security held by a Fund. These conflicts and the recent pandemic could adversely affect global market,
financial, and economic conditions in ways that cannot necessarily be foreseen. Investments in securities of micro-cap or small-cap
companies may involve considerably more risk than investments in securities of larger-cap companies. Investments in securities
of foreign issuers may be subject to different risks than investments in securities of U.S. companies, including adverse political,
social, economic, or other developments that are unique to a particular country or region. Therefore, the prices of securities
of foreign companies in particular countries or regions may, at times, move in a different direction than those of securities
of U.S. companies. Because such investments are usually denominated in foreign currencies and the Funds do not intend to hedge
their foreign currency exposures, the U.S. dollar value of such investments may be harmed by declines in the value of foreign
currencies in relation to the U.S. dollar. Royce Global Value Trust invests a significant portion of its assets in foreign companies.
A broadly diversified portfolio does not ensure a profit or guarantee against loss. All indexes referenced are unmanaged and capitalization-weighted.
Each index’s returns include net reinvested dividends and/or interest income. Source: MSCI. MSCI makes no express or implied
warranties or representations and shall have no liability whatsoever with respect to any MSCI data contained herein. The MSCI
data may not be further redistributed or used as a basis for other indexes or any securities or financial products. This report
is not approved, endorsed, reviewed or produced by MSCI. None of the MSCI data is intended to constitute investment advice or
a recommendation to make (or refrain from making) any kind of investment decision and may not be relied on as such. Russell Investment
Group is the source and owner of the trademarks, service marks and copyrights related to the Russell Indexes. Russell®
is a trademark of Russell Investment Group. The Russell 2000 Index is an index of domestic small-cap stocks that measures
the performance of the 2,000 smallest publicly traded U.S. companies in the Russell 3000 Index. The Russell Microcap Index includes
1,000 of the smallest securities in the small-cap Russell 2000 Index, along with the next smallest eligible securities as determined
by Russell. The MSCI ACWI Small Cap Index is an unmanaged, capitalization-weighted index of global small-cap stocks. The performance
of an index does not represent exactly any particular investment, as you cannot invest directly in an index. Index returns include
net reinvested dividends and/or interest income. Royce Global Value, Micro-Cap, and Value Trust shares of common stock trade on
the NYSE. Royce Fund Services, LLC (“RFS”) is a member of FINRA and files certain material with FINRA on behalf of
each Fund. RFS is not an underwriter or distributor of any of the Funds.
This page is not part of the 2023 Annual Report to Stockholders | 7
MANAGER’S
DISCUSSION (UNAUDITED)
Royce
Global Value Trust (RGT)

Chuck Royce
FUND
PERFORMANCE
Royce
Global Value Trust (RGT) gained 16.2% on a net asset value (NAV) basis and 14.5% on a market price basis in 2023 versus an increase
of 16.8% for its unleveraged benchmark, the MSCI ACWI Small Cap Index, for the same period.
WHAT
WORKED… AND WHAT DIDN’T
Seven
of the Fund’s 10 equity sectors contributed positively to 2023’s performance, led by Industrials, Information Technology,
and Financials, while Communication Services, Health Care, and Real Estate were the detractors. At the industry level, capital
markets (Financials) contributed most, followed by two groups in Industrials: machinery and trading companies & distributors.
The top-detracting industries were entertainment (Communication Services), life sciences tools & services (Health Care), and
professional services (Industrials).
The
Fund’s top-contributing position was U.K.-based housing developer Vistry Group, which designs, builds, and sells new homes
for both private customers and social landlords. It offers a portfolio of properties ranging from apartments to large detached
family homes. We like its asset-light business model and its ongoing prospects as lower mortgage rates in the U.K. should help
to stoke demand. APi Group provides safety, specialty, and industrial services globally, though its focus is on North America.
The company announced record 2023 first-quarter results in May that included double-digit organic growth and expanded margins,
a backlog near record highs, and vibrant activity across both its safety and specialty segments. This streak of robust demand,
strong revenues and earnings, and margin expansion continued through the end of the year. ESAB Corporation is a U.S. company that
provides fabrication technology and gas control solutions, offering its customers advanced equipment, consumables, robotics,
and digital solutions. The company reported strong third-quarter results in November of 2023, characterized by organic growth,
margin expansion, and positive cash flows, which led ESAB to raise full-year earnings guidance.
Chicken
Soup for the Soul Entertainment, which produces and distributes video content, was the Fund’s top detractor in 2023. The
hoped for spikes in DVD rental activity never materialized in 2023, and its streaming video business also disappointed, issues
that influenced our decision to exit the position in the Fund. Shares of South African financial services company Transaction
Capital went into freefall in March of 2023 after the firm issued a profit warning and record losses. We trimmed our position
substantially in 2023’s second half. Mesa Laboratories develops and manufactures electronic measurement instruments for
industrial and hemodialysis customers, including pipeline flow meters and calibration instruments. Its shares fell in 2023’s
first half on currency headwinds across the company’s divisions, slower biopharmaceutical spending that affected its
Biopharmaceutical Development Division, a significant decrease in Covid-driven revenues, and the loss taken in its high-margin
Sema4 business, which is part of Mesa’s Clinical Genomics division. Later in the year, Mesa reported disappointing results
due to sluggish capital equipment orders in its biopharmaceutical vertical and a key customer loss in its Clinical Genomics division.
While confident that its business can rebound, we trimmed our position in the second half of 2023.
| |
|
|
|
|
|
|
| |
Top
Contributors to Performance |
|
Top
Detractors from Performance |
|
| |
For
2023 (%)1 |
|
|
For
2023 (%)2 |
|
|
| |
Vistry
Group |
1.58 |
|
Chicken
Soup for the Soul Entertainment
Cl. A |
-2.36 |
|
| |
APi
Group |
1.54 |
|
Transaction
Capital |
-0.83 |
|
| |
ESAB
Corporation |
1.16 |
|
Mesa
Laboratories |
-0.61 |
|
| |
Vontier
Corporation |
1.00 |
|
IPH |
-0.56 |
|
| |
Griffon
Corporation |
0.94 |
|
Restore |
-0.31 |
|
| |
1
Includes dividends |
|
|
2
Net of dividends |
|
|
| |
|
|
|
|
|
|
The
Fund’s disadvantage versus the MSCI ACWI Small Cap came from stock selection in two sectors: Communication Services, which
detracted significantly, and Health Care. Conversely, our substantially higher weighting in Industrials, stock selection in Financials,
and lack of exposure to Utilities were most additive relative to the benchmark in 2023.
CURRENT POSITIONING
AND OUTLOOK
Our
long-term outlook remains essentially unchanged. The near-term forecast for equities remains unclear, though we see better weather
on the horizon, especially for global small-cap stocks. There continues to be an array of potential triggers that we anticipate
will jumpstart small-cap performance in the coming months. First, a soft landing for the U.S. economy looks more and more likely,
and a recession—specifically the kind of deep and potentially lengthy contraction many have been anticipating since late
2021—looks less likely. Indeed, throughout 2022 and into 2023, we have been struck by the contrast between the more confident—albeit
cautious—outlooks from the many management teams we met with, and the fatalistic headlines seen almost every day. Of course,
our companies boast generally strong long-term growth prospects, low debt, positive free cash flows, high returns on invested
capital, and/or proven management expertise. Overall, we think they appear well positioned for a market that is more focused on
fundamentals and/or from a reaccelerating global economy. And while recession remains a reality or possibility (depending on geography),
none of us knows how long it will last or how deep it will go. What we do know is that any recession—like any bear market—is
ultimately finite. Any recession will be followed by a recovery. It’s worth keeping in mind that history also shows that
small caps will likely begin an upward move before many of us know for sure that the economy is rebounding in earnest. For this
and other reasons, we would welcome any degree of increased scrutiny of company fundamentals.
8
| 2023
Annual Report to Stockholders
| PERFORMANCE
AND PORTFOLIO REVIEW (UNAUDITED) |
SYMBOLS MARKET
PRICE RGT NAV XRGTX |
Performance
Average Annual
Total Return (%) Through 12/31/23
| |
JUL-DEC
20231 |
1-YR |
3-YR |
5-YR |
10-YR |
SINCE
INCEPTION (10/17/13) |
| RGT
(NAV) |
8.92 |
16.15 |
-0.47 |
9.13 |
5.53 |
5.69 |
1
Not Annualized
Market Price
Performance History Since Inception (10/17/13)
Cumulative Performance
of Investment through 12/31/231
| |
1-YR |
5-YR |
10-YR |
15-YR |
20-YR |
SINCE
INCEPTION (10/17/13) |
| RGT |
14.5% |
51.1% |
61.1% |
N/A |
N/A |
59.5% |

| ¹ | Reflects
the cumulative performance experience of a continuous common stockholder who
purchased one share at inception ($8.975 IPO) and reinvested all
distributions. |
| ² | Reflects
the actual month-end market price movement of one share as it has traded on NYSE. |
Morningstar
Style Map™ As of 12/31/23
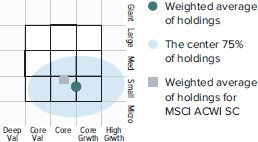
The
Morningstar Style Map is the Morningstar Style Box™ with the center 75% of fund holdings plotted as the Morningstar
Ownership Zone™. The Morningstar Style Box is designed to reveal a fund’s investment strategy. The Morningstar
Ownership Zone provides detail about a portfolio’s investment style by showing the range of stock sizes and styles. The
Ownership Zone is derived by plotting each stock in the portfolio within the proprietary Morningstar Style Box. Over time, the
shape and location of a fund's ownership zone may vary. See page 65 for additional information.
Value
of $10,000
Invested
on 10/17/13 as of 12/31/23 ($)

Top
10 Positions
%
of Net Assets
| Vistry
Group |
3.2 |
| EVI
Industries |
2.5 |
| Transcat |
2.4 |
| APi
Group |
2.4 |
| Morningstar |
2.1 |
| SEI
Investments |
2.0 |
| Artisan
Partners Asset Management Cl. A |
2.0 |
| ESAB
Corporation |
2.0 |
| Sprott |
1.9 |
| Griffon
Corporation |
1.8 |
Portfolio
Sector Breakdown
%
of Net Assets
| Industrials |
37.3 |
| Financials |
22.4 |
| Information
Technology |
14.0 |
| Consumer
Discretionary |
7.4 |
| Materials |
7.2 |
| Health
Care |
6.1 |
| Communication
Services |
4.5 |
| Energy |
1.2 |
| Consumer
Staples |
1.0 |
| Real
Estate |
1.0 |
| Investment
Companies |
0.6 |
| Outstanding Line of Credit, Net
of Cash and
Cash Equivalents |
-2.7 |
Calendar
Year Total Returns (%)
| YEAR |
RGT |
| 2023 |
16.1 |
| 2022 |
-27.0 |
| 2021 |
16.3 |
| 2020 |
19.7 |
| 2019 |
31.2 |
| 2018 |
-16.1 |
| 2017 |
31.1 |
| 2016 |
11.1 |
| 2015 |
-3.4 |
| 2014 |
-6.2 |
Portfolio
Country Breakdown 1,2
%
of Net Assets
| United
States |
43.4 |
| Canada |
15.0 |
| United
Kingdom |
11.5 |
| Sweden |
4.2 |
| Israel |
4.1 |
| Australia |
3.4 |
| India |
3.2 |
1 Represents
countries that are 3% or more of net assets.
2
Securities are categorized by the country of their headquarters.
Portfolio
Diagnostics
| Fund
Net Assets |
$75
million |
| Number
of Holdings |
118 |
| Turnover
Rate |
14% |
| Net
Asset Value |
$11.72 |
| Market
Price |
$9.75 |
| Net
Leverage1 |
2.7% |
| Average
Market Capitalization2 |
$2,006
million |
| Weighted
Average P/E Ratio3,4 |
21.5x |
| Weighted
Average P/B Ratio3 |
2.5x |
| Active
Share5 |
98% |
| 1 | Net leverage
is the percentage, in excess of 100%, of the total value of equity type investments,
divided by net assets. |
| 2 | Geometric
Average. This weighted calculation uses each portfolio holding’s market cap
in a way designed to not skew the effect of very large or small holdings; instead, it
aims to better identify the portfolio’s center, which Royce believes offers a more
accurate measure of average market cap than a simple mean or median. |
| 3 | Harmonic
Average. This weighted calculation evaluates a portfolio as if it were a single stock
and measures it overall. It compares the total market value of the portfolio to the portfolio’s
share in the earnings or book value, as the case may be, of its underlying stocks. |
| 4 | The
Fund’s P/E Ratio calculation excludes companies with zero or negative earnings
(14% of portfolio holdings as of 12/31/23). |
| 5 | Active Share
is the sum of the absolute values of the different weightings of each holding in
the Fund versus each holding in the benchmark, divided by two. |
Important
Performance and Risk Information
All
performance information reflects past performance, is presented on a total return basis, net of the Fund’s investment advisory
fee, reflects the reinvestment of distributions and does not reflect the deduction of taxes that a shareholder would pay on Fund
distributions or the sale of Fund shares. Past performance is no guarantee of future results. Current performance may be higher
or lower than performance quoted. Returns as of the most recent month-end may be obtained at www.royceinvest.com. The market price
of the Fund’s shares will fluctuate, so that shares may be worth more or less than their original cost when sold. The Fund
invests primarily in securities of small- and mid-cap companies, which may involve considerably more risk than investments in
securities of larger-cap companies. The Fund’s broadly diversified portfolio does not ensure a profit or guarantee against
loss. The Fund generally invests a significant portion of its net assets in foreign securities, which may involve political, economic,
currency and other risks not encountered in U.S. investments. Regarding the “Top Contributors” and “Top Detractors”
tables shown above, the sum of all contributors to, and all detractors from, performance for all securities in the portfolio would
approximate the Fund’s year-to-date performance for 2023.
2023
Annual Report to Stockholders |
9
Royce
Global Value Trust
Schedule
of Investments
Common
Stocks – 102.1%
| | |
| | |
|
| | |
SHARES | | |
VALUE |
| | |
| | |
|
| AUSTRALIA
– 3.4% | |
| | |
|
| Cochlear | |
| 4,000 | | |
$ | 814,115 |
| IPH | |
| 253,881 | | |
| 1,108,976 |
| Steadfast
Group | |
| 53,300 | | |
| 211,390 |
| Technology
One | |
| 40,400 | | |
| 423,145 |
| Total
(Cost $1,471,791) | |
| | | |
| 2,557,626 |
| | |
| | |
|
| BERMUDA
– 0.9% | |
| | | |
| |
| Bank
of N.T. Butterfield & Son | |
| 21,000 | | |
| 672,210 |
| Total
(Cost $745,408) | |
| | | |
| 672,210 |
| | |
| | |
|
| BRAZIL
– 1.5% | |
| | | |
| |
| Odontoprev | |
| 171,600 | | |
| 410,489 |
| TOTVS | |
| 97,885 | | |
| 678,884 |
| Total
(Cost $750,794) | |
| | | |
| 1,089,373 |
| | |
| | |
|
| CANADA
– 15.0% | |
| | | |
| |
| Alamos
Gold Cl. A | |
| 94,100 | | |
| 1,265,509 |
| Altus
Group | |
| 14,760 | | |
| 469,406 |
| AutoCanada
1 | |
| 38,200 | | |
| 660,186 |
| Canaccord
Genuity Group | |
| 84,472 | | |
| 484,500 |
| Computer
Modelling Group | |
| 101,500 | | |
| 775,967 |
| Descartes
Systems Group (The) 1,2 | |
| 8,424 | | |
| 708,121 |
| FirstService
Corporation | |
| 1,400 | | |
| 226,926 |
| IMAX
Corporation 1 | |
| 21,100 | | |
| 316,922 |
| Major
Drilling Group International 1 | |
| 194,300 | | |
| 1,350,517 |
| Onex
Corporation | |
| 13,300 | | |
| 928,757 |
| Pan
American Silver 2 | |
| 12,700 | | |
| 207,391 |
| Pason
Systems | |
| 71,300 | | |
| 870,096 |
| Sprott | |
| 42,642 | | |
| 1,444,303 |
| TELUS
Corporation | |
| 16,311 | | |
| 290,263 |
| TMX
Group | |
| 47,600 | | |
| 1,151,338 |
| Total
(Cost $7,961,986) | |
| | | |
| 11,150,202 |
| | |
| | |
|
| DENMARK
– 0.2% | |
| | | |
| |
| Chr.
Hansen Holding | |
| 1,800 | | |
| 150,926 |
| Total
(Cost $155,783) | |
| | | |
| 150,926 |
| | |
| | |
|
| FRANCE
– 0.8% | |
| | | |
| |
| †ALD | |
| 39,000 | | |
| 277,483 |
| Esker | |
| 1,800 | | |
| 317,143 |
| Total
(Cost $516,235) | |
| | | |
| 594,626 |
| | |
| | |
|
| GERMANY
– 0.9% | |
| | | |
| |
| Carl
Zeiss Meditec | |
| 3,400 | | |
| 370,989 |
| CompuGroup
Medical | |
| 3,300 | | |
| 138,071 |
| STRATEC | |
| 3,300 | | |
| 165,940 |
| Total
(Cost $626,695) | |
| | | |
| 675,000 |
| | |
| | |
|
| GREECE
– 0.8% | |
| | | |
| |
| Sarantis | |
| 64,500 | | |
| 596,696 |
| Total
(Cost $554,222) | |
| | | |
| 596,696 |
| | |
| | |
|
| ICELAND
– 0.3% | |
| | | |
| |
| Ossur
1 | |
| 51,000 | | |
| 207,317 |
| Total
(Cost $321,244) | |
| | | |
| 207,317 |
| | |
| | |
|
| INDIA
– 3.2% | |
| | | |
| |
| AIA
Engineering | |
| 28,440 | | |
| 1,258,399 |
| Dish
TV India 1 | |
| 3,777,000 | | |
| 828,352 |
| Tarsons
Products 1 | |
| 49,000 | | |
| 310,321 |
| Total
(Cost $1,928,470) | |
| | | |
| 2,397,072 |
| | |
| | |
|
| INDONESIA
– 0.3% | |
| | | |
| |
| Ace
Hardware Indonesia | |
| 4,000,000 | | |
| 187,050 |
| Total
(Cost $169,716) | |
| | | |
| 187,050 |
| | |
| | |
|
| ISRAEL
– 4.1% | |
| | | |
| |
| †Cellebrite
DI 1 | |
| 46,600 | | |
| 403,556 |
| Global-e
Online 1 | |
| 5,200 | | |
| 206,076 |
| Nova
1,2,3 | |
| 5,700 | | |
| 783,123 |
| Phoenix
Holdings | |
| 48,500 | | |
| 490,954 |
| Tel
Aviv Stock Exchange | |
| 222,300 | | |
| 1,182,555 |
| Total
(Cost $1,973,383) | |
| | | |
| 3,066,264 |
| | |
| | |
|
| ITALY
– 1.3% | |
| | | |
| |
| Carel
Industries | |
| 35,800 | | |
| 980,131 |
| Total
(Cost $434,504) | |
| | | |
| 980,131 |
| | |
| | |
|
| JAPAN
– 2.6% | |
| | | |
| |
| As
One | |
| 5,600 | | |
| 222,411 |
| Benefit
One | |
| 13,700 | | |
| 206,229 |
| Fukui
Computer Holdings | |
| 10,800 | | |
| 193,021 |
| NSD | |
| 12,200 | | |
| 234,569 |
| Square
Enix Holdings | |
| 6,800 | | |
| 244,173 |
| TechnoPro
Holdings | |
| 7,200 | | |
| 189,702 |
| TKC
Corporation | |
| 25,500 | | |
| 680,000 |
| Total
(Cost $1,611,241) | |
| | | |
| 1,970,105 |
| | |
| | |
|
| MEXICO
– 0.2% | |
| | | |
| |
| Becle | |
| 63,000 | | |
| 123,359 |
| Total
(Cost $100,233) | |
| | | |
| 123,359 |
| | |
| | |
|
| NETHERLANDS
– 1.3% | |
| | | |
| |
| IMCD | |
| 5,500 | | |
| 956,600 |
| Total
(Cost $387,492) | |
| | | |
| 956,600 |
| | |
| | |
|
| NEW
ZEALAND – 0.3% | |
| | | |
| |
| Fisher
& Paykel Healthcare | |
| 17,000 | | |
| 253,619 |
| Total
(Cost $101,973) | |
| | | |
| 253,619 |
| | |
| | |
|
| NORWAY
– 1.9% | |
| | | |
| |
| Protector
Forsikring | |
| 70,000 | | |
| 1,240,170 |
| Tomra
Systems | |
| 12,000 | | |
| 145,808 |
| Total
(Cost $778,544) | |
| | | |
| 1,385,978 |
| | |
| | |
|
| SINGAPORE
– 0.2% | |
| | | |
| |
| Midas
Holdings 1,4 | |
| 400,000 | | |
| 0 |
| XP
Power | |
| 8,660 | | |
| 149,682 |
| Total
(Cost $241,148) | |
| | | |
| 149,682 |
| | |
| | |
|
| SOUTH
AFRICA – 2.6% | |
| | | |
| |
| CA
Sales Holdings | |
| 147,597 | | |
| 83,108 |
| Curro
Holdings | |
| 258,594 | | |
| 164,691 |
| KAL
Group | |
| 17,606 | | |
| 38,980 |
| PSG
Financial Services | |
| 550,976 | | |
| 462,347 |
| Stadio
Holdings | |
| 3,686,928 | | |
| 1,052,112 |
| Transaction
Capital 1 | |
| 344,100 | | |
| 150,112 |
| Total
(Cost $1,680,804) | |
| | | |
| 1,951,350 |
| | |
| | |
|
| SWEDEN
– 4.2% | |
| | | |
| |
| Biotage | |
| 37,900 | | |
| 502,400 |
| Bravida
Holding | |
| 68,900 | | |
| 553,670 |
| Karnov
Group 1 | |
| 145,381 | | |
| 799,981 |
| OEM
International Cl. B | |
| 118,850 | | |
| 1,241,991 |
| Total
(Cost $2,309,190) | |
| | | |
| 3,098,042 |
| 10 |
2023 Annual Report to Stockholders |
THE
ACCOMPANYING NOTES ARE AN INTEGRAL PART OF THESE FINANCIAL STATEMENTS |
December
31, 2023
Schedule
of Investments (continued)
| | |
SHARES | | |
VALUE |
| | |
| | |
|
| SWITZERLAND – 1.8% | |
| | | |
| |
| Kardex Holding | |
| 2,400 | | |
$ | 622,079 |
| LEM Holding | |
| 150 | | |
| 370,073 |
| VZ Holding | |
| 2,900 | | |
| 338,601 |
| Total
(Cost $482,877) | |
| | | |
| 1,330,753 |
| | |
| | | |
| |
| UNITED KINGDOM – 11.5% | |
| | | |
| |
| Diploma | |
| 8,200 | | |
| 374,395 |
| DiscoverIE Group | |
| 60,800 | | |
| 612,240 |
| FDM Group Holdings | |
| 46,800 | | |
| 273,512 |
| Genuit Group | |
| 54,600 | | |
| 280,819 |
| Halma | |
| 18,700 | | |
| 544,413 |
| †Judges Scientific | |
| 2,600 | | |
| 302,245 |
| Keystone Law Group | |
| 95,940 | | |
| 623,679 |
| Learning Technologies Group | |
| 342,800 | | |
| 353,930 |
| Marlowe 1 | |
| 112,600 | | |
| 617,160 |
| Mortgage Advice Bureau Holdings | |
| 36,100 | | |
| 377,322 |
| Restore | |
| 166,254 | | |
| 466,215 |
| RWS Holdings | |
| 45,100 | | |
| 144,177 |
| SThree | |
| 146,600 | | |
| 781,090 |
| Team Internet Group | |
| 137,427 | | |
| 218,964 |
| Vistry Group | |
| 201,008 | | |
| 2,350,772 |
| YouGov | |
| 18,600 | | |
| 279,760 |
| Total
(Cost $7,197,203) | |
| | | |
| 8,600,693 |
| | |
| | | |
| |
| UNITED STATES – 42.8% | |
| | | |
| |
| ACV
Auctions Cl. A 1 | |
| 39,200 | | |
| 593,880 |
| Air
Lease Cl. A 2 | |
| 21,161 | | |
| 887,492 |
| APi
Group 1,2,3 | |
| 51,120 | | |
| 1,768,752 |
| Arcosa | |
| 14,060 | | |
| 1,161,918 |
| Artisan Partners Asset Management
Cl. A | |
| 33,200 | | |
| 1,466,776 |
| Blue Owl Capital Cl. A | |
| 55,280 | | |
| 823,672 |
| Diodes 1,2 | |
| 7,000 | | |
| 563,640 |
| Element
Solutions 2 | |
| 36,400 | | |
| 842,296 |
| Enovis
Corporation 1 | |
| 11,966 | | |
| 670,335 |
| ESAB Corporation | |
| 16,800 | | |
| 1,455,216 |
| EVI
Industries 2 | |
| 79,273 | | |
| 1,881,148 |
| FormFactor 1,2,3 | |
| 20,000 | | |
| 834,200 |
| †FTAI Aviation | |
| 21,360 | | |
| 991,104 |
| GCM Grosvenor Cl. A | |
| 119,626 | | |
| 1,071,849 |
| Griffon
Corporation 2 | |
| 22,500 | | |
| 1,371,375 |
| Hagerty
Cl. A 1 | |
| 39,300 | | |
| 306,540 |
| Hayward
Holdings 1 | |
| 58,500 | | |
| 795,600 |
| Innospec 2 | |
| 6,228 | | |
| 767,539 |
| Kadant 2 | |
| 2,664 | | |
| 746,746 |
| KBR 2 | |
| 18,240 | | |
| 1,010,678 |
| †Laureate
Education 2 | |
| 50,000 | | |
| 685,500 |
| Lindsay
Corporation 2 | |
| 3,519 | | |
| 454,514 |
| MarketWise Cl. A | |
| 123,100 | | |
| 336,063 |
| Mesa Laboratories | |
| 4,630 | | |
| 485,085 |
| Morningstar
2 | |
| 5,358 | | |
| 1,533,674 |
| NewtekOne | |
| 45,300 | | |
| 625,140 |
| nLIGHT 1 | |
| 73,100 | | |
| 986,850 |
| PAR Technology 1,2,3 | |
| 24,241 | | |
| 1,055,453 |
| †Richardson Electronics | |
| 11,356 | | |
| 151,603 |
| Royal Gold | |
| 6,320 | | |
| 764,467 |
| SEI
Investments 2 | |
| 24,050 | | |
| 1,528,378 |
| Transcat
1,2 | |
| 16,377 | | |
| 1,790,497 |
| Vontier
Corporation 2,3 | |
| 33,210 | | |
| 1,147,406 |
| Ziff
Davis 1 | |
| 5,950 | | |
| 399,781 |
| Total
(Cost $23,326,875) | |
| | | |
| 31,955,167 |
| | |
| | | |
| |
| TOTAL
COMMON STOCKS | |
| | | |
| |
| (Cost
$55,827,811) | |
| | | |
| 76,099,841 |
| | |
| | | |
| |
| INVESTMENT COMPANIES –
0.6% | |
| | | |
| |
| | |
| | | |
| |
| UNITED STATES – 0.6% | |
| | | |
| |
| †VanEck
Junior Gold Miners ETF | |
| 12,500 | | |
| 473,875 |
| (Cost
$547,814) | |
| | | |
| 473,875 |
| | |
| | | |
| |
| REPURCHASE AGREEMENT–
2.5% | |
| | | |
| |
Fixed
Income Clearing Corporation, 4.75% dated 12/29/23, due 1/2/24, maturity value
$1,873,712 (collateralized by obligations of
U.S. Government Agencies, 2.75%
due 2/15/28, valued at $1,910,251) |
| (Cost
$1,872,724) | |
| | | |
| 1,872,724 |
| | |
| | | |
| |
| TOTAL
INVESTMENTS – 105.2% | |
| | | |
| |
| (Cost
$58,248,349) | |
| | | |
| 78,446,440 |
| | |
| | | |
| |
| LIABILITIES LESS CASH AND
OTHER ASSETS – (5.2)% | |
| | | |
| (3,868,321) |
| | |
| | | |
| |
| NET
ASSETS – 100.0% | |
| | | |
$ | 74,578,119 |
| † | New
additions in 2023. |
| 1 | Non-income
producing. |
| 2 | All
or a portion of these securities were pledged as collateral in connection with the Fund’s
revolving credit agreement as of December 31, 2023. Total market value of pledged securities
as of December 31, 2023, was $9,389,355. |
| 3 | As
of December 31, 2023, a portion of these securities, in the aggregate amount of $2,506,726,
were rehypothecated by BNP Paribas Prime Brokerage International, Limited in connection
with the Fund’s revolving credit agreement. See Notes to Financial Statements. |
| 4 | A
security for which market quotations are not readily available represents 0.0% of net
assets. This security has been valued at its fair value under procedures approved by
the Fund’s Board of Directors. This security is defined as a Level 3 security due
to the use of significant unobservable inputs in the determination of fair value. See
Notes to Financial Statements. |
Securities
are categorized by the country of their headquarters.
Bold
indicates the Fund’s 20 largest equity holdings in terms of December 31, 2023, market value.
TAX
INFORMATION: The cost of total investments for Federal income tax purposes was $59,153,990. As of December 31, 2023, net unrealized
appreciation for all securities was $19,292,450 consisting of aggregate gross unrealized appreciation of $23,870,896 and aggregate
gross unrealized depreciation of $4,578,446. The primary causes of the difference between book and tax basis cost are the timing
of the recognition of losses on securities sold and mark-to-market of Passive Foreign Investment Companies.
| THE
ACCOMPANYING NOTES ARE AN INTEGRAL PART OF THESE FINANCIAL STATEMENTS |
2023
Annual Report to Stockholders | 11 |
| Royce
Global Value Trust |
December
31, 2023 |
Statement
of Assets and Liabilities
| ASSETS: | |
| |
| Investments at value | |
$ | 76,573,716 | |
| Repurchase agreements (at cost
and value) | |
| 1,872,724 | |
| Foreign currency (cost $141,435) | |
| 141,645 | |
| Receivable for dividends and interest | |
| 234,903 | |
| Receivable for insurance reimbursement | |
| 285,836 | |
| Prepaid expenses and other assets | |
| 18,846 | |
| Total Assets | |
| 79,127,670 | |
| LIABILITIES: | |
| | |
| Revolving credit agreement | |
| 4,000,000 | |
| Payable for investment advisory
fee | |
| 61,171 | |
| Payable for directors’ fees | |
| 9,595 | |
| Payable for interest expense | |
| 22,458 | |
| Accrued legal expense | |
| 353,851 | |
| Accrued other expenses | |
| 57,593 | |
| Deferred capital gains tax | |
| 44,883 | |
| Total Liabilities | |
| 4,549,551 | |
| Contingent
Liabilities1 | |
| | |
| Net Assets | |
$ | 74,578,119 | |
| ANALYSIS OF NET ASSETS: | |
| | |
| Paid-in capital - $0.001 par value per share; 6,361,220
shares outstanding (150,000,000 shares authorized) | |
$ | 56,154,829 | |
| Total distributable earnings (loss) | |
| 18,423,290 | |
| Net Assets (net asset value per
share - $11.72) | |
$ | 74,578,119 | |
| Investments at identified cost | |
$ | 56,375,625 | |
1
See Notes to Financial Statements.
| 12
| 2023 Annual Report to Stockholders |
THE
ACCOMPANYING NOTES ARE AN INTEGRAL PART OF THESE FINANCIAL STATEMENTS |
| Royce
Global Value Trust |
Year
Ended December 31, 2023 |
Statement
of Operations
| INVESTMENT INCOME: | |
| |
| INCOME: | |
| |
| Dividends | |
$ | 1,509,686 | |
| Foreign withholding tax | |
| (116,141 | ) |
| Interest | |
| 18,213 | |
| Rehypothecation income | |
| 72 | |
| Total
income | |
| 1,411,830 | |
| EXPENSES: | |
| | |
| Investment advisory fees | |
| 682,163 | |
| Legal1 | |
| 502,341 | |
| Interest expense | |
| 251,946 | |
| Custody and transfer agent fees | |
| 72,900 | |
| Stockholder reports | |
| 68,789 | |
| Administrative and office facilities | |
| 46,176 | |
| Audit | |
| 37,472 | |
| Directors’ fees | |
| 29,770 | |
| Other expenses | |
| 27,307 | |
| Total expenses | |
| 1,718,864 | |
| Net
investment income (loss) | |
| (307,034 | ) |
| REALIZED AND UNREALIZED GAIN (LOSS) ON INVESTMENTS
AND FOREIGN CURRENCY: | |
| | |
| NET REALIZED GAIN (LOSS): | |
| | |
| Investments | |
| 169,896 | |
| Foreign currency transactions | |
| 573 | |
| NET CHANGE IN UNREALIZED APPRECIATION
(DEPRECIATION): | |
| | |
| Investments | |
| 10,510,878 | |
| Other assets and liabilities denominated
in foreign currency | |
| (25,472 | ) |
| Net
realized and unrealized gain (loss) on investments and foreign currency | |
| 10,655,875 | |
| NET
INCREASE (DECREASE) IN NET ASSETS FROM INVESTMENT OPERATIONS | |
$ | 10,348,841 | |
| 1 | The
Fund accrued net $500,000 in legal fees and expenses through December 31, 2023 in connection
with an action filed on June 29, 2023 against the Fund and numerous unrelated funds in
Saba Capital Master Funds., Ltd., et al. v. Clearbridge Energy Midstream Opportunity
Fund, Inc., et al., No. 1:23-cv-05568 (S.D.N.Y.). The Fund incurred an additional $285,836
in legal fees and expenses through December 31, 2023, which was paid by the Fund in 2024.
Although amounts incurred for legal fees and expenses above $500,000 for this action
are currently expected to be reimbursed to the Fund under its insurance policy, no assurance
can be given that all or any portion of such reimbursement will be made to the Fund.
See Notes to Financial Statements. |
| THE
ACCOMPANYING NOTES ARE AN INTEGRAL PART OF THESE FINANCIAL STATEMENTS |
2023
Annual Report to Stockholders | 13 |
Royce
Global Value Trust
Statement
of Changes in Net Assets
| | |
YEAR
ENDED 12/31/23 | | |
YEAR
ENDED 12/31/22 | |
| | |
| | | |
| | |
| INVESTMENT OPERATIONS: | |
| | | |
| | |
| Net investment income
(loss) | |
$ | (307,034 | ) | |
$ | 550,924 | |
| Net realized gain (loss) on investments
and foreign currency | |
| 170,469 | | |
| 47,904 | |
| Net change in unrealized appreciation
(depreciation) on investments and foreign currency | |
| 10,485,406 | | |
| (24,860,232 | ) |
| Net increase
(decrease) in net assets from investment operations | |
| 10,348,841 | | |
| (24,261,404 | ) |
| DISTRIBUTIONS: | |
| | | |
| | |
| Total distributable earnings | |
| (946,548 | ) | |
| (793,689 | ) |
| Return of capital | |
| – | | |
| (21,014 | ) |
| Total distributions | |
| (946,548 | ) | |
| (814,703 | ) |
| CAPITAL STOCK TRANSACTIONS: | |
| | | |
| | |
| Reinvestment of distributions | |
| 483,560 | | |
| 374,330 | |
| Total capital
stock transactions | |
| 483,560 | | |
| 374,330 | |
| Net Increase
(Decrease) In Net Assets | |
| 9,885,853 | | |
| (24,701,777 | ) |
| NET ASSETS: | |
| | | |
| | |
| Beginning of year | |
| 64,692,266 | | |
| 89,394,043 | |
| End of year | |
$ | 74,578,119 | | |
$ | 64,692,266 | |
| 14
| 2023 Annual Report to Stockholders |
THE
ACCOMPANYING NOTES ARE AN INTEGRAL PART OF THESE FINANCIAL STATEMENTS |
| Royce
Global Value Trust |
Year
Ended December 31, 2023 |
Statement
of Cash Flows
| CASH FLOWS FROM OPERATING ACTIVITIES: | |
| |
| Net increase (decrease)
in net assets from investment operations | |
$ | 10,348,841 | |
| Adjustments to reconcile net increase
(decrease) in net assets from investment operations to net cash provided by operating activities: | |
| | |
| Purchases
of long-term investments | |
| (10,248,405 | ) |
| Proceeds
from sales and maturities of long-term investments | |
| 12,357,334 | |
| Net purchases,
sales and maturities of short-term investments | |
| (1,147,227 | ) |
| Net (increase)
decrease in dividends and interest receivable and other assets | |
| (73,535 | ) |
| Net increase
(decrease) in interest expense payable, accrued expenses and other liabilities | |
| 43,025 | |
| Net change
in unrealized appreciation (depreciation) on investments | |
| (10,510,878 | ) |
| Net realized
gain (loss) on investments | |
| (169,896 | ) |
| Net
cash provided by operating activities | |
| 599,259 | |
| CASH FLOWS FROM FINANCING ACTIVITIES: | |
| | |
| Distributions net of reinvestment
(reinvestment $483,560) | |
| (462,988 | ) |
| Net
cash used for financing activities | |
| (462,988 | ) |
| INCREASE
(DECREASE) IN CASH: | |
| 136,271 | |
| Cash
and foreign currency at beginning of year | |
| 5,374 | |
| Cash
and foreign currency at end of year | |
$ | 141,645 | |
Supplemental
disclosure of cash flow information:
For
the year ended December 31, 2023, the Fund paid $247,668 in interest expense.
| THE
ACCOMPANYING NOTES ARE AN INTEGRAL PART OF THESE FINANCIAL STATEMENTS |
2023
Annual Report to Stockholders | 15 |
Royce
Global Value Trust
Financial
Highlights
This
table is presented to show selected data for a share of Common Stock outstanding throughout each period, and to assist stockholders
in evaluating the Fund’s performance for the periods presented.
| | |
YEARS ENDED |
| | |
12/31/23 |
| |
12/31/22 |
| |
12/31/21 |
| |
12/31/20 |
| |
12/31/19 |
|
| Net Asset Value,
Beginning of Period | |
$ | 10.25 | | |
$ | 14.26 | | |
$ | 14.95 | | |
$ | 13.60 | | |
$ | 10.42 | |
| INVESTMENT OPERATIONS: | |
| | | |
| | | |
| | | |
| | | |
| | |
| Net investment income (loss) | |
| (0.05 | )1,2 | |
| 0.09 | | |
| (0.01 | ) | |
| (0.05 | ) | |
| 0.06 | |
| Net realized and unrealized gain
(loss) on investments and foreign currency | |
| 1.69 | | |
| (3.96 | ) | |
| 2.19 | | |
| 2.63 | | |
| 3.18 | |
| Net increase
(decrease) in net assets from investment operations | |
| 1.64 | | |
| (3.87 | ) | |
| 2.18 | | |
| 2.58 | | |
| 3.24 | |
| DISTRIBUTIONS: | |
| | | |
| | | |
| | | |
| | | |
| | |
| Net investment income | |
| – | | |
| (0.10 | ) | |
| (0.09 | ) | |
| – | | |
| (0.06 | ) |
| Net realized gain on investments
and foreign currency | |
| (0.15 | ) | |
| (0.03 | ) | |
| (2.66 | ) | |
| (1.19 | ) | |
| – | |
| Return of capital | |
| – | | |
| (0.00 | ) | |
| – | | |
| – | | |
| – | |
| Total distributions | |
| (0.15 | ) | |
| (0.13 | ) | |
| (2.75 | ) | |
| (1.19 | ) | |
| (0.06 | ) |
| CAPITAL STOCK TRANSACTIONS: | |
| | | |
| | | |
| | | |
| | | |
| | |
| Effect of reinvestment of distributions
by Common Stockholders | |
| (0.02 | ) | |
| (0.01 | ) | |
| (0.12 | ) | |
| (0.04 | ) | |
| (0.00 | ) |
| Total capital
stock transactions | |
| (0.02 | ) | |
| (0.01 | ) | |
| (0.12 | ) | |
| (0.04 | ) | |
| (0.00 | ) |
| Net Asset Value, End of Period | |
$ | 11.72 | | |
$ | 10.25 | | |
$ | 14.26 | | |
$ | 14.95 | | |
$ | 13.60 | |
| Market Value, End of Period | |
$ | 9.75 | | |
$ | 8.65 | | |
$ | 13.12 | | |
$ | 13.36 | | |
$ | 11.69 | |
| TOTAL RETURN:3 | |
| | | |
| | | |
| | | |
| | | |
| | |
| Net Asset Value | |
| 16.15 | % | |
| (27.04 | )% | |
| 16.34 | % | |
| 19.67 | % | |
| 31.20 | % |
| Market Value | |
| 14.50 | % | |
| (33.08 | )% | |
| 19.77 | % | |
| 24.42 | % | |
| 32.33 | % |
| RATIOS BASED ON AVERAGE NET ASSETS: | |
| | | |
| | | |
| | | |
| | | |
| | |
| Investment advisory fee expense | |
| 1.00 | % | |
| 1.00 | % | |
| 1.00 | % | |
| 1.00 | % | |
| 1.00 | % |
| Other operating expenses | |
| 1.52 | %1 | |
| 0.54 | % | |
| 0.39 | % | |
| 0.34 | % | |
| 0.50 | % |
| Total expenses (net) | |
| 2.52 | %1 | |
| 1.54 | % | |
| 1.39 | % | |
| 1.34 | % | |
| 1.50 | % |
| Expenses excluding interest expense | |
| 2.15 | %1 | |
| 1.38 | % | |
| 1.33 | % | |
| 1.24 | % | |
| 1.29 | % |
| Expenses prior to balance credits | |
| 2.52 | %1 | |
| 1.54 | % | |
| 1.39 | % | |
| 1.34 | % | |
| 1.50 | % |
| Net investment income (loss) | |
| (0.45 | )%1,2 | |
| 0.79 | % | |
| (0.13 | )% | |
| (0.15 | )% | |
| 0.46 | % |
| SUPPLEMENTAL DATA: | |
| | | |
| | | |
| | | |
| | | |
| | |
| Net Assets, End of Period (in
thousands) | |
$ | 74,578 | | |
$ | 64,692 | | |
$ | 89,394 | | |
$ | 83,752 | | |
$ | 142,810 | |
| Portfolio Turnover Rate | |
| 14 | % | |
| 24 | % | |
| 52 | % | |
| 54 | % | |
| 48 | % |
| REVOLVING CREDIT AGREEMENT: | |
| | | |
| | | |
| | | |
| | | |
| | |
| Asset coverage | |
| 1964 | % | |
| 1717 | % | |
| 2335 | % | |
| 1147 | % | |
| 1885 | % |
| Asset coverage per $1,000 | |
$ | 19,645 | | |
$ | 17,173 | | |
$ | 23,349 | | |
$ | 11,469 | | |
$ | 18,851 | |
| | |
| | | |
| | | |
| | | |
| | | |
| | |
| 1 | Due
to a recent action filed against the Fund and numerous unrelated funds in Saba Capital
Master Funds., Ltd., et al. v. Clearbridge Energy Midstream Opportunity Fund, Inc., et
al., No. 1:23-cv-05568 (S.D.N.Y.), the Fund accrued net $500,000 in legal fees and expenses
which resulted in a decrease in net investment income (loss) per share of $0.08, a decrease
in the ratio of net investment income (loss) to average net assets of 0.73% and an increase
in the noted expense ratios to average net assets of 0.73%. The Fund currently expects
to be reimbursed for legal fees and expenses in excess of $500,000 that were incurred
in 2023 ($285,836). The impact of such legal fees and expenses in excess of $500,000
would have resulted in an additional decrease in net investment income (loss) per share
of $0.05, an additional decrease in the ratio of net investment income (loss) to average
net assets of 0.42% and an additional increase to the noted expense ratios to average
net assets of 0.42%. No assurance can be given that all or any portion of such reimbursement
will be made to the Fund. |
| 2 | A
special distribution from Tel Aviv Stock Exchange resulted in an increase in net investment
income (loss) per share of $0.02 and an increase in the ratio of net investment income
(loss) to average net assets of 0.17% |
| 3 | The
Market Value Total Return is calculated assuming a purchase of Common Stock on the opening
of the first business day and a sale on the closing of the last business day of each
period. Dividends and distributions are assumed for the purposes of this calculation
to be reinvested at prices obtained under the Fund’s Distribution Reinvestment
and Cash Purchase Plan. Net Asset Value Total Return is calculated on the same basis,
except that the Fund’s net asset value is used on the purchase, sale and dividend
reinvestment dates instead of market value. |
| 16
| 2023 Annual Report to Stockholders |
THE
ACCOMPANYING NOTES ARE AN INTEGRAL PART OF THESE FINANCIAL STATEMENTS |
Royce
Global Value Trust
Notes
to Financial Statements
Summary
of Significant Accounting Policies
Royce
Global Value Trust, Inc. (the “Fund”), is a diversified closed-end investment company that was incorporated under
the laws of the State of Maryland on February 14, 2011. The Fund commenced operations on October 18, 2013.
The
preparation of financial statements in conformity with accounting principles generally accepted in the United States of America
requires management to make estimates and assumptions that affect the reported amounts of assets and liabilities and the disclosure
of contingent assets and liabilities at the date of the financial statements and the reported amounts of income and expenses during
the reporting period. Actual results could differ from those estimates.
The
Fund is an investment company registered under the Investment Company Act of 1940 (the “1940 Act”) and accordingly
follows the investment company accounting and reporting guidance of the Financial Accounting Standards Board (FASB) Accounting
Standard Codification Topic 946 “Financial Services-Investment Companies.”
Royce
& Associates, LP, the Fund’s investment adviser, is a majority-owned subsidiary of Franklin Resources, Inc. and primarily
conducts business using the name Royce Investment Partners (“Royce”). As of December 31, 2023, officers and employees
of Royce, Fund directors, the Royce retirement plans and other affiliates owned more than 19% of the Fund.
VALUATION
OF INVESTMENTS:
Portfolio
securities held by the Fund are valued as of the close of trading on the New York Stock Exchange (“NYSE”) (generally
4:00 p.m. Eastern time) on the valuation date. Investments in money market funds are valued at net asset value per share. Values
for non-U.S. dollar denominated equity securities are converted to U.S. dollars daily based upon prevailing foreign currency exchange
rates as quoted by a major bank.
Portfolio
securities that are listed on an exchange or Nasdaq, or traded on OTC Market Group Inc.’s OTC Link ATS or other alternative
trading system, are valued: (i) on the basis of their last reported sales prices or official closing prices, as applicable, on
a valuation date; or (ii) at their highest reported bid prices in the event such equity securities did not trade on a valuation
date. Such inputs are generally referred to as “Level 1” inputs because they represent reliable quoted prices in active
markets for identical securities.
If
the value of a portfolio security held by the Fund cannot be determined solely by reference to Level 1 inputs, such portfolio
security will be “fair valued.” The Fund’s Board of Directors has designated Royce as valuation designee to
perform fair value determinations for such portfolio securities in accordance with Rule 2a-5 under the 1940 Act (“Rule 2a-5”).
Pursuant to Rule 2a-5, fair values are determined in accordance with policies and procedures approved by the Fund’s Board
of Directors and policies and procedures adopted by Royce in its capacity as valuation designee for the Fund. Fair valued securities
are reported as either “Level 2” or “Level 3” securities.
As
a general principle, the fair value of a security is the amount which the Fund might reasonably expect to receive for the security
upon its current sale. However, in light of the judgment involved in fair valuations, no assurance can be given that a fair value
assigned to a particular portfolio security will be the amount which the Fund might be able to receive upon its current sale.
When a fair value pricing methodology is used, the fair value prices used by the Fund for such securities will likely differ from
the quoted or published prices for the same securities.
Level
2 inputs are other significant observable inputs (e.g., dealer bid side quotes and quoted prices for securities with comparable
characteristics). Examples of situations in which Level 2 inputs are used to fair value portfolio securities held by the Fund
on a particular valuation date include:
| ● | Over-the-counter
equity securities other than those traded on OTC Market Group Inc.’s OTC Link ATS
or other alternative trading system (collectively referred to herein as “Other
OTC Equity Securities”) are fair valued at their highest bid price when Royce receives
at least two bid side quotes from dealers who make markets in such securities; |
| ● | Certain
bonds and other fixed income securities may be fair valued by reference to other securities
with comparable ratings, interest rates, and maturities in accordance with valuation
methodologies maintained by certain independent pricing services; and |
| ● | The
Fund uses an independent pricing service to fair value certain non-U.S. equity securities
when U.S. market volatility exceeds a certain threshold. This pricing service uses proprietary
correlations it has developed between the movement of prices
of non-U.S. equity securities and indices of U.S.-traded securities, futures contracts, and other indications to estimate the
fair value of such non-U.S. securities.
|
Level
3 inputs are significant unobservable inputs. Examples of Level 3 inputs include (without limitation) the last trade price for
a security before trading was suspended or terminated; discounts to last trade price for lack of marketability or otherwise; market
price information regarding other securities; information received from the issuer and/or published documents, including SEC filings
and financial statements; and other publicly available information. Pursuant to the above-referenced policies and procedures,
Royce may use various techniques in making fair value determinations based upon Level 3 inputs, which techniques may include (without
limitation): (i) workout valuation methods (e.g., earnings multiples, discounted cash flows, liquidation values, derivations of
book value, firm or probable
2023
Annual Report to Stockholders | 17
Royce
Global Value Trust
Notes
to Financial Statements (continued)
VALUATION
OF INVESTMENTS (continued):
offers
from qualified buyers for the issuer’s ongoing business, etc.); (ii) discount or premium from market, or compilation of
other observable market information, for other similar freely traded securities; (iii) conversion from the readily available market
price of a security into which an affected security is convertible or exchangeable; and (iv) pricing models or other formulas.
In the case of restricted securities, fair value determinations generally start with the inherent or intrinsic worth of the relevant
security, without regard to the restrictive feature, and are reduced for any diminution in value resulting from the restrictive
feature. Due to the inherent uncertainty of such valuations, these fair values may differ significantly from the values that would
have been used had an active market existed.
A
security that is valued by reference to Level 1 or Level 2 inputs may drop to Level 3 on a particular valuation date for several
reasons, including if:
| ● | an
equity security that is listed on an exchange or Nasdaq, or traded on OTC Market Group
Inc.’s OTC Link ATS or other alternative trading system, has not traded and there
are no bids; |
| ● | Royce
does not receive at least two bid side quotes for an Other OTC Equity Security; |
| ● | the
independent pricing services are unable to supply fair value prices; or |
| ● | the
Level 1 or Level 2 inputs become otherwise unreliable for any reason (e.g., a significant
event occurs after the close of trading for a security but prior to the time the Fund
prices its shares). |
The
table below shows the aggregate value of the various Level 1, Level 2, and Level 3 securities held by the Fund as of December
31, 2023. Any Level 2 or Level 3 securities held by the Fund are noted in its Schedule of Investments. The inputs or methodology
used for valuing securities are not necessarily an indication of the risk associated with owning those securities.
| | |
LEVEL
1 | |
LEVEL
2 | |
LEVEL
3 | |
TOTAL |
| Common
Stocks | |
| $76,099,841 | | |
| $ – | | |
| $0 | | |
| $76,099,841 | |
| Investment
Companies | |
| 473,875 | | |
| – | | |
| – | | |
| 473,875 | |
| Repurchase
Agreement | |
| – | | |
| 1,872,724 | | |
| – | | |
| 1,872,724 | |
REPURCHASE
AGREEMENTS:
The
Fund may enter into repurchase agreements with institutions that the Fund’s investment adviser has determined are creditworthy.
The Fund restricts repurchase agreements to maturities of no more than seven days. Securities pledged as collateral for repurchase
agreements, which are held until maturity of the repurchase agreements, are marked-to-market daily and maintained at a value at
least equal to the principal amount of the repurchase agreement (including accrued interest). Repurchase agreements could involve
certain risks in the event of default or insolvency of the counter-party, including possible delays or restrictions upon the ability
of the Fund to dispose of its underlying securities. The remaining contractual maturity of the repurchase agreement held by the
Fund as of December 31, 2023, is next business day and continuous.
FOREIGN
CURRENCY:
Net
realized foreign exchange gains or losses arise from sales and maturities of short-term securities, sales of foreign currencies,
expiration of currency forward contracts, currency gains or losses realized between the trade and settlement dates on securities
transactions, and the difference between the amounts of dividends, interest, and foreign withholding taxes recorded on the Fund’s
books and the U.S. dollar equivalent of the amounts actually received or paid. Net unrealized foreign exchange gains and losses
arise from changes in the value of assets and liabilities, other than investments in securities at the end of the reporting period,
as a result of changes in foreign currency exchange rates.
The
Fund does not isolate that portion of the results of operations resulting from fluctuations in foreign exchange rates on investments
from the fluctuations arising from changes in market prices of securities held. Such fluctuations are included with the net realized
and unrealized gain or loss on investments.
The
Fund invests a significant portion of its assets in foreign companies that may be subject to different risks than investments
in securities of U.S. companies, including adverse political, social, economic, or other developments that are unique to a particular
country or region. Therefore, the prices of securities of foreign companies in particular countries or regions may, at times,
move in a different direction than those of securities of U.S. companies. Because such investments in securities of foreign companies
are usually denominated in foreign currencies and the Fund does not intend to hedge its foreign currency exposure, the U.S. dollar
value of such investments may be harmed by declines in the value of foreign currencies in relation to the U.S. dollar.
For
the purposes of the Statement of Cash Flows, the Fund defines Cash as cash, including foreign currency.
18
| 2023 Annual Report to Stockholders
Royce
Global Value Trust
Notes
to Financial Statements (continued)
DISTRIBUTIONS
AND TAXES:
As
a qualified regulated investment company under Subchapter M of the Internal Revenue Code, the Fund is not subject to income taxes
to the extent that it distributes substantially all of its taxable income for its fiscal year. The Schedule of Investments includes
information regarding income taxes under the caption “Tax Information.”
The
Fund pays any dividends and capital gain distributions annually in December. Because federal income tax regulations differ from
generally accepted accounting principles, income and capital gain distributions determined in accordance with tax regulations
may differ from net investment income and realized gains recognized for financial reporting purposes. Accordingly, the character
of distributions and composition of net assets for tax purposes differ from those reflected in the accompanying financial statements.
CAPITAL
GAINS TAXES:
The
Fund may be subject to a tax imposed on capital gains on securities of issuers domiciled in certain countries. The Fund records
an estimated deferred tax liability for gains in these securities that have been held for less than one year. This amount, if
any, is reported as deferred capital gains tax in the accompanying Statement of Assets and Liabilities, assuming those positions
were disposed of at the end of the period, and accounted for as a reduction in the market value of the security.
INVESTMENT
TRANSACTIONS AND RELATED INVESTMENT INCOME:
Investment
transactions are accounted for on the trade date. Dividend income is recorded on the ex-dividend date except for certain dividends
from securities where the dividend rate is not available. In such cases, the dividend is recorded as soon as the information is
received by the Fund. Non-cash dividend income is recorded at the fair market value of the securities received. Interest income
is recorded on an accrual basis. Premiums and discounts on debt securities are amortized using the effective yield-to-maturity
method. Realized gains and losses from investment transactions are determined on the basis of identified cost for book and tax
purposes.
EXPENSES:
The
Fund incurs direct and indirect expenses. Expenses directly attributable to the Fund are charged to the Fund, while expenses applicable
to more than one of the Royce Funds are allocated equitably. Certain personnel, occupancy costs and other administrative expenses
related to all of the Royce Funds are allocated by Royce under an administration agreement and are included in administrative
and office facilities and legal expenses.
INDEMNIFICATION
PROVISIONS:
Reference
is made to Maryland law, the Fund’s Articles of Incorporation, as amended and supplemented, and the Fund’s Amended
and Restated By-laws, each of which provides for the indemnification by the Fund of the Fund’s officers and directors under
the circumstances and to the extent set forth therein. Reference is also made to the investment advisory agreement between the
Fund and Royce which provides for the indemnification by the Fund of Royce under the circumstances and to the extent set forth
therein. Additionally, in the normal course of business, the Fund enters into contracts with service providers that contain general
indemnification provisions in favor of such service providers and other covered persons. The amount of any potential Fund liability
under these indemnification arrangements, if any, currently cannot be determined with any degree of specificity. The Fund is not
currently in possession of any information that would cause it to believe that the Fund is reasonably likely to be subject to
any material adverse impact from the operation of these indemnification arrangements. No assurance can be given, however, that
the Fund will not incur any liability from the operation of these indemnification arrangements. Any future liability to the Fund
that may arise from the operation of such arrangements will be publicly disclosed to the extent required by relevant accounting
guidance and applicable laws, rules, and regulations.
Capital
Stock:
The
Fund issued 50,902 and 43,376 shares of Common Stock as reinvestment of distributions for the years ended December 31, 2023, and
December 31, 2022, respectively.
Borrowings:
The
Fund is party to a revolving credit agreement (the “credit agreement”) with BNP Paribas Prime Brokerage International,
Limited (BNPPI). The Fund pays a commitment fee of 0.50% per annum on the unused portion of the then-current maximum amount that
may be borrowed by the Fund under the credit agreement. The credit agreement has a 179-day rolling term that resets daily. The
Fund pledges eligible portfolio securities as collateral and has granted a security interest in such pledged securities to, and
in favor of, BNPPI as security for the loan balance outstanding. The amount of eligible portfolio securities required to be pledged
as collateral is determined by BNPPI in accordance with the credit agreement. In determining collateral requirements, the value
of eligible securities pledged as collateral is subject to discount by BNPPI based upon a variety of factors set forth in the
credit agreement. As of December 31, 2023, the market value of eligible securities pledged as collateral exceeded two times the
loan balance outstanding.
2023
Annual Report to Stockholders | 19
Royce
Global Value Trust
Notes
to Financial Statements (continued)
Borrowings
(continued):
If
the Fund fails to meet certain requirements, or comply with other financial covenants set forth in the credit agreement, the Fund
may be required to repay immediately, in part or in full, the loan balance outstanding under the credit agreement, which may necessitate
the sale of portfolio securities at potentially inopportune times. BNPPI may terminate the credit agreement upon certain ratings
downgrades of its corporate parent, which would result in the Fund’s entire loan balance becoming immediately due and payable.
The occurrence of such ratings downgrades may necessitate the sale of portfolio securities at potentially inopportune times. BNPPI
may also terminate the credit agreement upon sixty (60) calendar days’ prior written notice to the Fund in the event the
Fund’s net asset value per share as of the close of business on the last business day of any calendar month declines by
thirty-five percent (35%) or more from the Fund’s net asset value per share as of the close of business on the last business
day of the immediately preceding calendar month.
The
credit agreement also permits, subject to certain conditions, BNPPI to rehypothecate portfolio securities pledged by the Fund
up to the amount of the loan balance outstanding. The Fund continues to receive payments in lieu of dividends and interest on
rehypothecated securities. The Fund also has the right under the credit agreement to recall the rehypothecated securities from
BNPPI on demand. If BNPPI fails to deliver the recalled security in a timely manner, the Fund is compensated by BNPPI for any
fees or losses related to the failed delivery or, in the event a recalled security is not returned by BNPPI, the Fund, upon notice
to BNPPI, may reduce the loan balance outstanding by the value of the recalled security failed to be returned. The Fund receives
a portion of the fees earned by BNPPI in connection with the rehypothecation of portfolio securities.
The
maximum amount the Fund may borrow under the credit agreement is $4,000,000. The Fund has the right to reduce the maximum amount
it can borrow under the credit agreement upon one (1) business day’s prior written notice to BNPPI. In addition, the Fund
and BNPPI may agree to increase the maximum amount the Fund can borrow under the credit agreement, which amount may not exceed
$15,000,000.
As
of December 31, 2023, the Fund had outstanding borrowings of $4,000,000. During the year ended December 31, 2023, the Fund had
an average daily loan balance of $4,000,000 at a weighted average borrowing cost of 6.21%. The maximum loan balance outstanding
during the year ended December 31, 2023, was $4,000,000. As of December 31, 2023, the aggregate value of rehypothecated securities
was $2,506,726. During the year ended December 31, 2023, the Fund earned $72 in fees from rehypothecated securities.
Investment
Advisory Agreement:
The
investment advisory agreement between Royce and the Fund provides for fees to be paid at an annual rate of 1.00% of the Fund’s
average daily net assets, computed daily and payable monthly. For the year ended December 31, 2023, the Fund expensed Royce investment
advisory fees totaling $682,163.
Purchases
and Sales of Investment Securities:
For
the year ended December 31, 2023, the costs of purchases and proceeds from sales of investment securities, other than short-term
securities, amounted to $10,248,620, and $12,357,907, respectively.
Tax
Information:
Distributions
during the years ended December 31, 2023 and 2022, were characterized as follows for tax purposes:
| ORDINARY
INCOME | |
LONG-TERM
CAPITAL GAINS | |
RETURN
OF CAPITAL |
| 2023 | |
2022 | |
2023 | |
2022 | |
2023 | |
2022 |
| $456,300 | | |
| $588,297 | | |
| $490,248 | | |
| $205,392 | | |
| $
– | | |
| $21,014 | |
The
tax basis components of distributable earnings as of December 31, 2023, were as follows:
| | |
| |
| |
QUALIFIED LATE YEAR | |
|
| | |
| |
NET
UNREALIZED | |
ORDINARY AND | |
TOTAL |
| UNDISTRIBUTED | |
UNDISTRIBUTED LONG-TERM | |
APPRECIATION | |
POST-OCTOBER LOSS | |
DISTRIBUTABLE |
| ORDINARY INCOME | |
CAPITAL GAINS | |
(DEPRECIATION)1 | |
DEFERRALS2 | |
EARNINGS |
| $477,388 | | |
$ – | |
| $19,251,356 | | |
$(1,305,454) | |
| $18,423,290 | |
| 1 | Includes
timing differences on foreign currency, recognition of losses on securities sold and
mark-to-market of Passive Foreign Investment Companies. |
| 2 | Under
the current tax law, capital losses and qualified late year ordinary losses incurred
after October 31 may be deferred and treated as occurring on the first day of the following
fiscal year. |
For
financial reporting purposes, capital accounts and distributions to stockholders are adjusted to reflect the tax character of
permanent book/tax differences. For the year ended December 31, 2023, the Fund had no reclassifications.
Management
has analyzed the Fund’s tax positions taken on federal income tax returns for all open tax years (2020-2023) and has concluded
that as of December 31, 2023, no provision for income tax is required in the Fund’s financial statements.
20
| 2023 Annual Report to Stockholders
Royce
Global Value Trust
Notes
to Financial Statements (continued)
Commitments/Contingencies:
On
June 29, 2023, an action was filed against the Fund and numerous unrelated funds in Saba Capital Master Funds., Ltd., et al. v.
Clearbridge Energy Midstream Opportunity Fund, Inc., et al., No. 1:23-cv-05568 (S.D.N.Y.). The action seeks to rescind the defendants’
election to opt into, and become subject to, the provisions of the Maryland Control Share Acquisition Act (“MCSAA”),
attorneys’ fees/costs, and other relief. On the same day, the plaintiffs also filed a motion for summary judgment against
the various defendants. On October 31, 2023, the Fund and certain unrelated funds filed motions to dismiss such action based upon
various grounds. On December 5, 2023, the Court issued an order denying such motions to dismiss, granting plaintiffs’ motion
for summary judgment against the remaining defendants, and directing rescission of the bylaw provisions that sought to implement
the provisions of the MCSAA. The Court subsequently issued the corresponding judgment and a legal opinion on January 4, 2024.
The Fund filed a notice of appeal from such judgment with the United States Court of Appeals for the Second Circuit on January
4, 2024. The ultimate outcome of this action is unknown.
The
Fund incurred $785,836 ($353,851 of which is payable as of December 31, 2023) in legal fees and expenses in connection with this
action through December 31, 2023. The effect of such accrued expense is reflected in various ratios for the Fund for the fiscal
period ended December 31, 2023 that appear under “Financial Highlights.” The deductible amount for this action under
the Fund’s insurance policy is $500,000. Although amounts incurred for legal fees and expenses above $500,000 for this action
are currently expected to be reimbursed to the Fund by the insurer, no assurance can be given that all or any portion of such
reimbursement to the Fund will be made.
Subsequent
Events:
Subsequent
events have been evaluated through the date the financial statements were issued and it has been determined that no events have
occurred that require disclosure, other than as disclosed within.
2023
Annual Report to Stockholders | 21
Report
of Independent Registered Public Accounting Firm
To
the Board of Directors and Stockholders of Royce Global Value Trust, Inc.:
Opinion
on the Financial Statements
We
have audited the accompanying statement of assets and liabilities, including the schedule of investments, of Royce Global Value
Trust, Inc. (the “Fund”) as of December 31, 2023, the related statements of operations and cash flows for the year
ended December 31, 2023, the statement of changes in net assets for each of the two years in the period ended December 31, 2023,
including the related notes, and the financial highlights for each of the five years in the period ended December 31, 2023 (collectively
referred to as the “financial statements”). In our opinion, the financial statements present fairly, in all material
respects, the financial position of the Fund as of December 31, 2023, the results of its operations and its cash flows for the
year then ended, the changes in its net assets for each of the two years in the period ended December 31, 2023 and the financial
highlights for each of the five years in the period ended December 31, 2023 in conformity with accounting principles generally
accepted in the United States of America.
Basis
for Opinion
These
financial statements are the responsibility of the Fund’s management. Our responsibility is to express an opinion on the
Fund’s financial statements based on our audits. We are a public accounting firm registered with the Public Company Accounting
Oversight Board (United States) (PCAOB) and are required to be independent with respect to the Fund in accordance with the U.S.
federal securities laws and the applicable rules and regulations of the Securities and Exchange Commission and the PCAOB.
We
conducted our audits of these financial statements in accordance with the standards of the PCAOB. Those standards require that
we plan and perform the audit to obtain reasonable assurance about whether the financial statements are free of material misstatement,
whether due to error or fraud.
Our
audits included performing procedures to assess the risks of material misstatement of the financial statements, whether due to
error or fraud, and performing procedures that respond to those risks. Such procedures included examining, on a test basis, evidence
regarding the amounts and disclosures in the financial statements. Our audits also included evaluating the accounting principles
used and significant estimates made by management, as well as evaluating the overall presentation of the financial statements.
Our procedures included confirmation of securities owned as of December 31, 2023 by correspondence with the custodian and brokers.
We believe that our audits provide a reasonable basis for our opinion.
/s/PricewaterhouseCoopers
LLP
New
York, New York
February
22, 2024
We
have served as the auditor of one or more investment companies in the Franklin Templeton Group of Funds since 1948.
22
| 2023 Annual Report to Stockholders
This
page is intentionally left blank.
2023
Annual Report to Stockholders | 23
MANAGERS’
DISCUSSION (UNAUDITED)
Royce Micro-Cap Trust (RMT)

Chuck
Royce, Jim Stoeffel,
Brendan Hartmann
FUND
PERFORMANCE
Royce
Micro-Cap Trust (RMT) advanced 16.6% on an NAV (net asset value) basis and 15.9% on a market price basis in 2023, versus respective
gains of 16.9% and 9.3% for its primary unleveraged benchmark, the small-cap Russell 2000 Index and its secondary benchmark, the
unleveraged Russell Microcap Index, for the same period. The Fund beat the Russell 2000 on both an NAV and market price basis
for the 3-, 5-, 10-, 15-, 20-, 25-, 30-year, and since inception (12/14/93) periods ended 12/31/23.
WHAT
WORKED… AND WHAT DIDN’T
Eight of the Fund’s 11 equity sectors made positive contributions to performance in 2023, with the biggest coming from
Industrials, Information Technology, and Energy, while the detractors were Communication Services, Consumer Staples, and Real
Estate. The biggest contributors at the industry level were semiconductors & semiconductor equipment (Information Technology),
machinery, and trading companies & distributors (both in Industrials). Communications equipment (Information Technology),
entertainment (Communication Services), and professional services (Industrials) were the biggest detractors.
The top contributor at the position level was CIRCOR International, which makes pumps, valves, and other flow-control products
for the aerospace & defense, chemicals, and refineries industries. The company agreed to be acquired by KKR in June at
a roughly 50% premium before a second suitor made a better offer later that month. KKR then upped its price, which sent CIRCOR’s
shares soaring. In October, CIRCOR announced the successful completion of its acquisition by KKR. Camtek manufactures metrology
and inspection tools for the semiconductor equipment industry. Its Advanced Packaging segment has been benefiting from the
shrinking line widths of semiconductors and the corresponding need to stack many semiconductors together to drive improved
performance. This phenomenon is even more acute for semiconductors being developed for AI applications, where Camtek is beginning
to see significant orders. Transcat provides accredited calibration, repair, inspection and laboratory instrument services
and distributes professional grade handheld test, measurement, and control instrumentation.
| |
|
|
|
|
|
|
| |
Top Contributors to Performance |
|
Top Detractors from Performance |
|
| |
For
2023 (%)1 |
|
|
For
2023 (%)2 |
|
|
| |
CIRCOR International |
1.91 |
|
Clearfield |
-0.87 |
|
| |
Camtek |
1.42 |
|
Mesa Laboratories |
-0.82 |
|
| |
Transcat |
1.15 |
|
Chicken Soup for the Soul |
|
|
| |
PAR Technology |
1.08 |
|
Entertainment Cl. A |
-0.54 |
|
| |
Dorian LPG |
0.91 |
|
Cutera |
-0.53 |
|
| |
1
Includes dividends |
|
|
B. Riley Financial |
-0.51 |
|
| |
|
|
|
2
Net of dividends |
|
|
The company continued to execute on its automation and process improvement initiatives, while demand in its distribution business
remained robust.
RMT’s top detractor in 2023 was Clearfield, which provides equipment and cable products principally to more rural cable
companies. It has been hurt by inventory corrections as supply chains have normalized post-Covid. Mesa Laboratories develops
and manufactures electronic measurement instruments for industrial and hemodialysis customers. Its shares fell in 2023’s
first half on currency headwinds across the company’s divisions, slower biopharmaceutical spending that affected its
Biopharmaceutical Development Division, a significant decrease in Covid-driven revenues, and the loss taken in its high-margin
Sema4 business, which is part of Mesa’s Clinical Genomics division. Later in the year, Mesa reported disappointing results
due to sluggish capital equipment orders in its biopharmaceutical vertical and a key customer loss in its Clinical Genomics
division. Confident that its business can rebound, we added shares in 2023. Chicken Soup for the Soul Entertainment produces
and distributes video content. The hoped for spikes in DVD rental activity never materialized in 2023, and its streaming video
business also disappointed. We trimmed our position substantially in 2023’s second half.
The Fund’s advantage, before expenses, over the Russell 2000 in 2023 came from our sector allocation decisions. At the
sector level, stock selection in Industrials (along with a smaller impact from our higher weighting) and Energy (helped by
our lower weighting), along with having virtually no exposure to Utilities helped relative results most. Conversely, stock
selection in Communication Services and Financials, as well as both stock selection and a lower weight in Consumer Discretionary,
detracted most from relative results.
CURRENT POSITIONING
AND OUTLOOK
As 2023 drew to a close, investors became more hopeful that the Fed had reached the end of its tightening cycle and may be
on the verge of cutting rates in 2024. We view financial liquidity as a key element of micro-cap performance, which could
be seen in 4Q23’s strong results. Although we believe we have not yet seen the full lagged impact of the Fed’s
tightening cycle, the U.S. economy remains fairly resilient and inflationary pressures have eased as supply chains have normalized
from Covid related disruptions. In spite of lingering macro uncertainty, we remain upbeat on the intermediate to long-term
opportunities for companies in our domestically focused portfolio. Key among these is the ongoing trend towards re-industrialization
of the U.S. economy, which we believe is being driven by a desire to shorten supply chains as well as an increasing realization
of the strategic importance of domestic semiconductor manufacturing. The increased fiscal spending on domestic infrastructure
projects is also just beginning to take hold, which we expect to provide tailwinds to many of our companies in the near to
intermediate term.
24
| 2023
Annual Report to Stockholders
| PERFORMANCE
AND PORTFOLIO REVIEW (UNAUDITED) |
SYMBOLS MARKET
PRICE RMT NAV XOTCX |
Performance
Average Annual
Total Return (%) Through 12/31/23
| |
JUL-DEC
20231 |
1-YR |
3-YR |
5-YR |
10-YR |
15-YR |
20-YR |
25-YR |
30-YR |
SINCE
INCEPTION
(12/14/93) |
| RMT
(NAV) |
9.54 |
16.64 |
4.93 |
13.58 |
8.16 |
13.24 |
8.90 |
10.21 |
10.66 |
10.65 |
1
Not Annualized
Market Price Performance History Since Inception (12/14/93)
Cumulative Performance of Investment through 12/31/231
| |
1-YR |
5-YR |
10-YR |
15-YR |
20-YR |
SINCE INCEPTION (12/14/93) |
| RMT |
15.9% |
91.7% |
116.6% |
547.9% |
413.5% |
1694.5% |

| ¹ | Reflects the cumulative performance experience of a continuous common stockholder who purchased one share at inception ($7.50
IPO), reinvested all distributions and fully participated in the primary subscription of the Fund's 1994 rights offering. |
| ² | Reflects
the actual month-end market price movement of one share as it has traded on NYSE and, prior to 12/1/03, on the Nasdaq. |
Morningstar
Style Map™ As of 12/31/23

The Morningstar Style Map is the Morningstar Style Box™ with the center 75% of fund
holdings plotted as the Morningstar Ownership Zone™. The Morningstar Style Box is designed to reveal a fund’s
investment strategy. The Morningstar Ownership Zone provides detail about a portfolio’s investment style by showing the range
of stock sizes and styles. The Ownership Zone is derived by plotting each stock in the portfolio within the proprietary Morningstar
Style Box. Over time, the shape and location of a fund’s ownership zone may vary. See page 65 for additional information.
Value
of $10,000
Invested on 6/30/2000 (Russell Microcap Inception) as of 12/31/23 ($)

Top
10 Positions
%
of Net Assets
| Transcat |
2.9 |
| PAR
Technology |
2.4 |
| Major
Drilling Group International |
2.2 |
| nLIGHT |
1.8 |
| Camtek |
1.8 |
| Mesa
Laboratories |
1.8 |
| Sprott |
1.7 |
| EVI
Industries |
1.6 |
| Haynes
International |
1.5 |
| Aspen
Aerogels |
1.5 |
Portfolio
Sector Breakdown
%
of Net Assets
| Information
Technology |
23.1 |
| Industrials |
18.7 |
| Financials |
14.6 |
| Health
Care |
12.7 |
| Materials |
9.2 |
| Consumer
Discretionary |
7.5 |
| Energy |
5.7 |
| Communication
Services |
2.7 |
| Real
Estate |
2.3 |
| Consumer
Staples |
0.7 |
| Utilities |
0.3 |
| Investment
Companies |
0.5 |
| Preferred
Stock |
0.0 |
| Cash
and Cash Equivalents, Net of Outstanding Line of Credit |
2.0 |
Calendar
Year Total Returns (%)
| YEAR |
RMT |
| 2023 |
16.6 |
| 2022 |
-16.9 |
| 2021 |
19.2 |
| 2020 |
33.6 |
| 2019 |
22.4 |
| 2018 |
-11.6 |
| 2017 |
17.7 |
| 2016 |
22.0 |
| 2015 |
-11.7 |
| 2014 |
3.5 |
| 2013 |
44.5 |
| 2012 |
17.3 |
| 2011 |
-7.7 |
| 2010 |
28.5 |
| 2009 |
46.5 |
Portfolio Diagnostics
| Fund Net Assets |
$520
million |
| Number of Holdings |
259 |
| Turnover Rate |
30% |
| Net Asset Value |
$10.47 |
| Market Price |
$9.24 |
| Average
Market Capitalization 1 |
$710
million |
| Weighted
Average P/B Ratio 2 |
2.0x |
| Active
Share 3 |
95% |
| U.S. Investments (% of Net Assets) |
76.1% |
| Non-U.S. Investments (% of Net
Assets) |
21.9% |
| 1 | Geometric Average. This weighted calculation uses each portfolio holding’s
market cap in a way designed to not skew the effect of very large or small holdings; instead, it aims to better identify the portfolio’s
center, which Royce believes offers a more accurate measure of average market cap than a simple mean or median. |
| 2 | Harmonic Average. This weighted calculation evaluates a portfolio as
if it were a single stock and measures it overall. It compares the total market value of the portfolio to the portfolio’s
share in the earnings or book value, as the case may be, of its underlying stocks. |
| 3 | Active Share is the sum of the absolute values of the different
weightings of each holding in the Fund versus each holding in the benchmark, divided by two. |
Important
Performance and Risk Information
All performance information reflects past performance, is presented on a total return basis, net of the Fund’s investment
advisory fee, reflects the reinvestment of distributions and does not reflect the deduction of taxes that a shareholder would
pay on Fund distributions or the sale of Fund shares. Past performance is no guarantee of future results. Current performance
may be higher or lower than performance quoted. Returns as of the most recent month-end may be obtained at www.royceinvest.com.
The market price of the Fund’s shares will fluctuate, so that shares may be worth more or less than their original cost
when sold. The Fund normally invests in micro-cap companies, which may involve considerably more risk than investments in
securities of larger-cap companies. The Fund’s broadly diversified portfolio does not ensure a profit or guarantee against
loss. From time to time, the Fund may invest a significant portion of its net assets in foreign securities, which may involve
political, economic, currency and other risks not encountered in U.S. investments. Regarding the “Top Contributors”
and “Top Detractors” tables shown above, the sum of all contributors to, and all detractors from, performance
for all securities in the portfolio would approximate the Fund’s year-to-date performance for 2023.
2023
Annual Report to Stockholders |
25
Royce
Micro-Cap Trust
Schedule
of Investments
Common
Stocks – 97.5%
| | |
SHARES | | |
VALUE |
| | |
| | |
|
| COMMUNICATION SERVICES
– 2.7% | |
| | |
|
| DIVERSIFIED TELECOMMUNICATION SERVICES - 0.0% | |
| | |
|
| LICT
Corporation 1,2 | |
| 12 | | |
$ | 213,600 |
| ENTERTAINMENT - 1.0% | |
| | | |
| |
| Chicken
Soup for the Soul Entertainment Cl. A 2 | |
| 477,611 | | |
| 104,788 |
| IMAX
Corporation 2 | |
| 321,900 | | |
| 4,834,938 |
| | |
| | | |
| 4,939,726 |
| INTERACTIVE MEDIA &
SERVICES - 0.7% | |
| | | |
| |
| Eventbrite
Cl. A 2 | |
| 78,220 | | |
| 653,919 |
| QuinStreet 2 | |
| 221,200 | | |
| 2,835,784 |
| †ZipRecruiter
Cl. A 2 | |
| 18,886 | | |
| 262,516 |
| | |
| | | |
| 3,752,219 |
| MEDIA - 1.0% | |
| | | |
| |
| Magnite 2 | |
| 298,173 | | |
| 2,784,936 |
| †TechTarget
2 | |
| 72,168 | | |
| 2,515,776 |
| | |
| | | |
| 5,300,712 |
| Total
(Cost $15,096,635) | |
| | | |
| 14,206,257 |
| | |
| | | |
| |
| CONSUMER
DISCRETIONARY – 7.5% | |
| | | |
| |
| AUTOMOBILE COMPONENTS
- 1.3% | |
| | | |
| |
| Motorcar
Parts of America 2 | |
| 54,800 | | |
| 511,832 |
| Patrick
Industries 3 | |
| 8,360 | | |
| 838,926 |
| Sebang
Global Battery | |
| 50,500 | | |
| 2,282,087 |
| Standard
Motor Products 3 | |
| 47,460 | | |
| 1,889,383 |
| Stoneridge
2,3 | |
| 56,200 | | |
| 1,099,834 |
| | |
| | | |
| 6,622,062 |
| BROADLINE RETAIL - 0.2% | |
| | | |
| |
| 1stdibs.com
2 | |
| 198,787 | | |
| 930,323 |
| DIVERSIFIED CONSUMER
SERVICES - 1.1% | |
| | | |
| |
| Park
Lawn | |
| 50,000 | | |
| 744,878 |
| Universal
Technical Institute 2 | |
| 395,000 | | |
| 4,945,400 |
| | |
| | | |
| 5,690,278 |
| HOTELS, RESTAURANTS &
LEISURE - 1.9% | |
| | | |
| |
| Century
Casinos 2 | |
| 222,500 | | |
| 1,085,800 |
| Inspired
Entertainment 2 | |
| 150,000 | | |
| 1,482,000 |
| Lindblad
Expeditions Holdings 2,3 | |
| 629,194 | | |
| 7,091,016 |
| | |
| | | |
| 9,658,816 |
| HOUSEHOLD DURABLES -
1.4% | |
| | | |
| |
| Cavco
Industries 2,3,4 | |
| 6,900 | | |
| 2,391,678 |
| Legacy
Housing 2 | |
| 162,038 | | |
| 4,086,598 |
| Lifetime
Brands 3 | |
| 119,294 | | |
| 800,463 |
| | |
| | | |
| 7,278,739 |
| LEISURE PRODUCTS - 0.3% | |
| | | |
| |
| Clarus
Corporation | |
| 254,903 | | |
| 1,757,556 |
| SPECIALTY RETAIL - 1.3% | |
| | | |
| |
| AutoCanada
2 | |
| 321,700 | | |
| 5,559,737 |
| Barnes
& Noble Education 2 | |
| 50,000 | | |
| 74,500 |
| Destination
XL Group 2 | |
| 75,000 | | |
| 330,000 |
| Shoe
Carnival 3 | |
| 34,632 | | |
| 1,046,233 |
| | |
| | | |
| 7,010,470 |
| Total
(Cost $31,629,391) | |
| | | |
| 38,948,244 |
| | |
| | | |
| |
| CONSUMER
STAPLES – 0.7% | |
| | | |
| |
| BEVERAGES - 0.1% | |
| | | |
| |
| Primo
Water | |
| 26,791 | | |
| 403,204 |
| CONSUMER STAPLES DISTRIBUTION
& RETAIL - 0.0% | |
| | | |
| |
| Rite
Aid 1,2 | |
| 200,000 | | |
| 41,000 |
| FOOD PRODUCTS - 0.6% | |
| | | |
| |
| CubicFarm
Systems 2 | |
| 400,000 | | |
| 6,038 |
| J
G Boswell Company 1 | |
| 2,490 | | |
| 1,518,900 |
| John
B. Sanfilippo & Son 3 | |
| 7,900 | | |
| 814,016 |
| Seneca
Foods Cl. A 2 | |
| 15,603 | | |
| 818,221 |
| | |
| | | |
| 3,157,175 |
| Total
(Cost $3,633,940) | |
| | | |
| 3,601,379 |
| | |
| | | |
| |
| ENERGY – 5.7% | |
| | | |
| |
| ENERGY EQUIPMENT &
SERVICES - 3.2% | |
| | | |
| |
| Bristow
Group 2,3 | |
| 177,900 | | |
| 5,029,233 |
| Pason
Systems | |
| 470,366 | | |
| 5,740,023 |
| SEACOR
Marine Holdings 2,3 | |
| 216,957 | | |
| 2,731,489 |
| TerraVest
Industries | |
| 90,000 | | |
| 3,005,547 |
| | |
| | | |
| 16,506,292 |
| OIL, GAS & CONSUMABLE
FUELS - 2.5% | |
| | | |
| |
| Dorchester
Minerals L.P. | |
| 76,981 | | |
| 2,450,305 |
| Dorian
LPG | |
| 84,553 | | |
| 3,709,340 |
| GeoPark | |
| 69,218 | | |
| 593,199 |
| Kimbell
Royalty Partners L.P. | |
| 55,724 | | |
| 838,646 |
| Navigator
Holdings | |
| 175,000 | | |
| 2,546,250 |
| Northern
Oil and Gas 3 | |
| 34,200 | | |
| 1,267,794 |
| StealthGas
2 | |
| 229,664 | | |
| 1,483,630 |
| | |
| | | |
| 12,889,164 |
| Total
(Cost $21,068,699) | |
| | | |
| 29,395,456 |
| | |
| | | |
| |
| FINANCIALS – 14.6% | |
| | | |
| |
| BANKS - 1.9% | |
| | | |
| |
| Bank
of N.T. Butterfield & Son | |
| 21,867 | | |
| 699,963 |
| BankFirst
Capital 1 | |
| 3,755 | | |
| 116,442 |
| Bay
Community Bancorp Cl. A 1 | |
| 16,500 | | |
| 127,050 |
| Chemung
Financial 3 | |
| 31,000 | | |
| 1,543,800 |
| Citizens
Bancshares 1 | |
| 3,160 | | |
| 119,132 |
| †First
National Bank Alaska 1 | |
| 695 | | |
| 135,525 |
| Harbor
Bankshares 1 | |
| 8,419 | | |
| 79,644 |
| HBT
Financial | |
| 46,300 | | |
| 977,393 |
| Live
Oak Bancshares 3 | |
| 30,900 | | |
| 1,405,950 |
| M&F
Bancorp 1 | |
| 7,300 | | |
| 113,150 |
| Midway
Investments 2,5 | |
| 735,647 | | |
| 0 |
| OP
Bancorp | |
| 14,500 | | |
| 158,775 |
| United
Bancorporation of Alabama 1 | |
| 3,447 | | |
| 143,395 |
| Virginia
National Bankshares 3 | |
| 89,910 | | |
| 3,091,106 |
| WSFS
Financial | |
| 22,500 | | |
| 1,033,425 |
| | |
| | | |
| 9,744,750 |
| CAPITAL MARKETS - 9.5% | |
| | | |
| |
| B.
Riley Financial 3 | |
| 186,600 | | |
| 3,916,734 |
| Barings
BDC | |
| 215,300 | | |
| 1,847,274 |
| Bolsa
Mexicana de Valores | |
| 1,068,000 | | |
| 2,208,202 |
| †Bridge
Investment Group Holdings Cl. A | |
| 36,937 | | |
| 361,244 |
| Canaccord
Genuity Group | |
| 574,893 | | |
| 3,297,375 |
| Donnelley
Financial Solutions 2,3 | |
| 78,100 | | |
| 4,871,097 |
| Fiera
Capital Cl. A | |
| 78,000 | | |
| 358,492 |
| GCM
Grosvenor Cl. A | |
| 257,535 | | |
| 2,307,514 |
| †MarketWise
Cl. A | |
| 500,000 | | |
| 1,365,000 |
| †Open
Lending 2 | |
| 67,170 | | |
| 571,617 |
| †OTC
Markets Group 1 | |
| 42,577 | | |
| 2,380,054 |
| †Perella
Weinberg Partners Cl. A | |
| 81,980 | | |
| 1,002,615 |
| Silvercrest
Asset Management Group Cl. A 3 | |
| 372,901 | | |
| 6,339,317 |
| Sprott | |
| 262,453 | | |
| 8,889,393 |
| StoneX
Group 2,3 | |
| 45,997 | | |
| 3,395,959 |
| Tel
Aviv Stock Exchange | |
| 343,000 | | |
| 1,824,634 |
| 26
| 2023 Annual Report to Stockholders |
THE
ACCOMPANYING NOTES ARE AN INTEGRAL PART OF THESE FINANCIAL STATEMENTS |
December 31,
2023
Schedule
of Investments (continued)
| | |
SHARES | | |
VALUE |
| | |
| | |
|
| FINANCIALS (continued) | |
| | |
|
| CAPITAL MARKETS (continued) | |
| | |
|
| U.S. Global Investors Cl. A | |
| 439,454 | | |
$ | 1,239,260 |
| Urbana Corporation | |
| 237,600 | | |
| 849,948 |
| Value Line | |
| 18,570 | | |
| 905,288 |
| Westaim
Corporation (The) 2 | |
| 500,000 | | |
| 1,416,928 |
| | |
| | | |
| 49,347,945 |
| CONSUMER FINANCE - 0.3% | |
| | | |
| |
| EZCORP
Cl. A 2,3,4 | |
| 201,000 | | |
| 1,756,740 |
| FINANCIAL SERVICES - 2.8% | |
| | | |
| |
| Acacia
Research 2,3,4 | |
| 543,623 | | |
| 2,131,002 |
| Cantaloupe 2 | |
| 50,000 | | |
| 370,500 |
| ECN Capital | |
| 1,031,200 | | |
| 2,334,705 |
| International
Money Express 2 | |
| 83,300 | | |
| 1,840,097 |
| NewtekOne | |
| 378,975 | | |
| 5,229,855 |
| Repay
Holdings Cl. A 2 | |
| 273,708 | | |
| 2,337,466 |
| Waterloo
Investment Holdings 2,5 | |
| 806,000 | | |
| 225,680 |
| | |
| | | |
| 14,469,305 |
| INSURANCE - 0.1% | |
| | | |
| |
| †Ambac
Financial Group 2 | |
| 48,084 | | |
| 792,424 |
| Total (Cost $69,598,380) | |
| | | |
| 76,111,164 |
| | |
| | |
|
| HEALTH CARE – 12.7% | |
| | |
|
| BIOTECHNOLOGY - 2.6% | |
| | |
|
| †Absci
Corporation 2 | |
| 387,773 | | |
| 1,628,647 |
| †Actinium
Pharmaceuticals 2 | |
| 50,000 | | |
| 254,000 |
| Agios Pharmaceuticals
2 | |
| 7,338 | | |
| 163,417 |
| Arcturus
Therapeutics Holdings 2 | |
| 129,836 | | |
| 4,093,729 |
| Avid
Bioservices 2 | |
| 29,070 | | |
| 188,955 |
| C4 Therapeutics 2 | |
| 42,554 | | |
| 240,430 |
| CareDx 2 | |
| 100,000 | | |
| 1,200,000 |
| Caribou
Biosciences 2 | |
| 253,102 | | |
| 1,450,274 |
| †Fate
Therapeutics 2 | |
| 107,318 | | |
| 401,369 |
| 4D
Molecular Therapeutics 2 | |
| 18,769 | | |
| 380,260 |
| †Inhibrx 2 | |
| 12,995 | | |
| 493,810 |
| †Kymera
Therapeutics 2 | |
| 16,004 | | |
| 407,462 |
| MeiraGTx
Holdings 2 | |
| 114,400 | | |
| 803,088 |
| †Prime
Medicine 2 | |
| 39,837 | | |
| 352,956 |
| †Relay
Therapeutics 2 | |
| 32,025 | | |
| 352,595 |
| Travere
Therapeutics 2 | |
| 41,641 | | |
| 374,353 |
| †Viking
Therapeutics 2 | |
| 28,037 | | |
| 521,769 |
| †X4
Pharmaceuticals 2 | |
| 388,363 | | |
| 325,642 |
| | |
| | | |
| 13,632,756 |
| HEALTH CARE EQUIPMENT & SUPPLIES - 2.5% | |
| | | |
| |
| Artivion 2 | |
| 62,700 | | |
| 1,121,076 |
| AtriCure 2,3 | |
| 15,000 | | |
| 535,350 |
| Atrion Corporation | |
| 1,200 | | |
| 454,548 |
| ClearPoint
Neuro 2 | |
| 53,065 | | |
| 360,311 |
| Cutera 2,3,4 | |
| 49,700 | | |
| 175,193 |
| †Establishment
Labs Holdings 2 | |
| 16,190 | | |
| 419,159 |
| LeMaitre Vascular | |
| 7,885 | | |
| 447,553 |
| OrthoPediatrics
Corp. 2 | |
| 13,975 | | |
| 454,327 |
| Profound
Medical 2 | |
| 189,100 | | |
| 1,584,099 |
| Semler
Scientific 2,3 | |
| 22,400 | | |
| 992,096 |
| Surmodics 2,3 | |
| 98,787 | | |
| 3,590,907 |
| UFP
Technologies 2,3 | |
| 8,949 | | |
| 1,539,586 |
| Utah Medical Products | |
| 15,114 | | |
| 1,272,901 |
| | |
| | | |
| 12,947,106 |
| HEALTH CARE PROVIDERS & SERVICES - 2.0% | |
| | | |
| |
| †Castle
Biosciences 2 | |
| 31,642 | | |
| 682,835 |
| Cross
Country Healthcare 2,3 | |
| 58,900 | | |
| 1,333,496 |
| Great
Elm Group 2 | |
| 682,245 | | |
| 1,323,555 |
| Hims
& Hers Health Cl. A 2 | |
| 200,000 | | |
| 1,780,000 |
| Joint
Corp. (The) 2 | |
| 127,484 | | |
| 1,225,121 |
| †ModivCare 2 | |
| 25,000 | | |
| 1,099,750 |
| National
Research 3 | |
| 71,668 | | |
| 2,835,186 |
| | |
| | | |
| 10,279,943 |
| HEALTH CARE TECHNOLOGY - 0.6% | |
| | | |
| |
| Simulations
Plus 3 | |
| 72,770 | | |
| 3,256,458 |
| LIFE SCIENCES TOOLS & SERVICES - 4.6% | |
| | | |
| |
| Azenta 2,3 | |
| 15,700 | | |
| 1,022,698 |
| BioLife
Solutions 2 | |
| 257,950 | | |
| 4,191,687 |
| Harvard
Bioscience 2 | |
| 317,400 | | |
| 1,698,090 |
| Lifecore
Biomedical 2,3 | |
| 75,610 | | |
| 468,026 |
| MaxCyte 2 | |
| 157,338 | | |
| 739,489 |
| Mesa
Laboratories 3 | |
| 88,169 | | |
| 9,237,466 |
| †OmniAb 2 | |
| 160,148 | | |
| 988,113 |
| Quanterix
Corporation 2 | |
| 199,800 | | |
| 5,462,532 |
| | |
| | | |
| 23,808,101 |
| PHARMACEUTICALS - 0.4% | |
| | |
|
| †Avadel
Pharmaceuticals ADR 2 | |
| 20,981 | | |
| 296,252 |
| Knight
Therapeutics 2 | |
| 237,000 | | |
| 928,289 |
| Theravance
Biopharma 2,3,4 | |
| 59,009 | | |
| 663,261 |
| | |
| | | |
| 1,887,802 |
| Total (Cost $58,629,978) | |
| | | |
| 65,812,166 |
| | |
| | | |
| |
| INDUSTRIALS – 18.7% | |
| | | |
| |
| AEROSPACE & DEFENSE - 0.7% | |
| | | |
| |
| Astronics
Corporation 2 | |
| 56,929 | | |
| 991,703 |
| CPI
Aerostructures 2 | |
| 189,700 | | |
| 517,881 |
| Innovative
Solutions and Support 2 | |
| 78,828 | | |
| 672,403 |
| Park Aerospace | |
| 101,300 | | |
| 1,489,110 |
| | |
| | | |
| 3,671,097 |
| BUILDING PRODUCTS - 0.9% | |
| | | |
| |
| Burnham
Holdings Cl. A 1 | |
| 117,000 | | |
| 1,368,900 |
| Insteel
Industries 3 | |
| 49,700 | | |
| 1,903,013 |
| †Janus
International Group 2 | |
| 97,610 | | |
| 1,273,811 |
| Quanex Building Products | |
| 9,900 | | |
| 302,643 |
| | |
| | | |
| 4,848,367 |
| COMMERCIAL SERVICES & SUPPLIES - 1.0% | |
| | | |
| |
| Acme United | |
| 25,000 | | |
| 1,071,500 |
| Civeo Corporation | |
| 37,499 | | |
| 856,852 |
| †Montrose
Environmental Group 2 | |
| 48,041 | | |
| 1,543,558 |
| †VSE Corporation | |
| 30,087 | | |
| 1,943,921 |
| | |
| | | |
| 5,415,831 |
| CONSTRUCTION & ENGINEERING - 2.2% | |
| | | |
| |
| Construction
Partners Cl. A 2 | |
| 38,973 | | |
| 1,696,105 |
| Granite Construction | |
| 13,500 | | |
| 686,610 |
| IES
Holdings 2,3 | |
| 62,874 | | |
| 4,980,878 |
| †Limbach
Holdings 2 | |
| 12,915 | | |
| 587,245 |
| MasTec 2 | |
| 13,287 | | |
| 1,006,092 |
| Matrix
Service 2,3 | |
| 40,425 | | |
| 395,356 |
| Northwest
Pipe 2,3 | |
| 65,100 | | |
| 1,969,926 |
| | |
| | | |
| 11,322,212 |
| ELECTRICAL EQUIPMENT - 1.3% | |
| | | |
| |
| American
Superconductor 2 | |
| 104,225 | | |
| 1,161,066 |
| †Hammond Power Solutions Cl. A | |
| 15,250 | | |
| 940,285 |
| LSI Industries | |
| 199,970 | | |
| 2,815,578 |
| THE
ACCOMPANYING NOTES ARE AN INTEGRAL PART OF THESE FINANCIAL STATEMENTS |
2023
Annual Report to Stockholders | 27 |
Royce
Micro-Cap Trust
Schedule
of Investments (continued)
| | |
SHARES | | |
VALUE |
| | |
| | |
|
| INDUSTRIALS (continued) | |
| | |
|
| ELECTRICAL EQUIPMENT (continued) | |
| | |
|
| Powell Industries | |
| 21,400 | | |
$ | 1,891,760 |
| | |
| | | |
| 6,808,689 |
| GROUND TRANSPORTATION - 1.0% | |
| | | |
| |
| Covenant Logistics Group Cl. A | |
| 24,786 | | |
| 1,141,147 |
| †FTAI Infrastructure | |
| 89,132 | | |
| 346,724 |
| Universal
Logistics Holdings 3 | |
| 125,240 | | |
| 3,509,225 |
| | |
| | | |
| 4,997,096 |
| MACHINERY - 2.6% | |
| | | |
| |
| Graham
Corporation 2 | |
| 149,850 | | |
| 2,842,654 |
| Hurco
Companies 3 | |
| 16,566 | | |
| 356,666 |
| L.
B. Foster Company 2,3 | |
| 95,300 | | |
| 2,095,647 |
| Lindsay
Corporation 3 | |
| 37,500 | | |
| 4,843,500 |
| Luxfer
Holdings 3 | |
| 22,198 | | |
| 198,450 |
| Shyft Group (The) | |
| 41,476 | | |
| 506,837 |
| Standex International | |
| 5,700 | | |
| 902,766 |
| Tennant Company | |
| 19,200 | | |
| 1,779,648 |
| | |
| | | |
| 13,526,168 |
| MARINE TRANSPORTATION - 1.3% | |
| | | |
| |
| Algoma Central | |
| 40,000 | | |
| 451,304 |
| Clarkson | |
| 52,700 | | |
| 2,126,059 |
| Eagle
Bulk Shipping 3 | |
| 71,728 | | |
| 3,973,731 |
| | |
| | | |
| 6,551,094 |
| PASSENGER AIRLINES - 0.1% | |
| | | |
| |
| Harbor
Diversified 1,2 | |
| 201,262 | | |
| 408,562 |
| PROFESSIONAL SERVICES - 1.7% | |
| | | |
| |
| Forrester
Research 2,3 | |
| 188,829 | | |
| 5,062,506 |
| Franklin
Covey 2,3 | |
| 40,100 | | |
| 1,745,553 |
| NV5 Global 2 | |
| 11,400 | | |
| 1,266,768 |
| Resources Connection | |
| 59,300 | | |
| 840,281 |
| Spire
Global Cl. A 2 | |
| 6,250 | | |
| 48,875 |
| | |
| | | |
| 8,963,983 |
| TRADING COMPANIES & DISTRIBUTORS - 5.9% | |
| | | |
| |
| BlueLinx
Holdings 2 | |
| 9,982 | | |
| 1,131,060 |
| Distribution
Solutions Group 2 | |
| 184,590 | | |
| 5,825,660 |
| EVI
Industries 3 | |
| 352,409 | | |
| 8,362,666 |
| Hudson
Technologies 2 | |
| 38,684 | | |
| 521,847 |
| Transcat
2,3 | |
| 137,333 | | |
| 15,014,617 |
| | |
| | | |
| 30,855,850 |
| Total
(Cost $70,847,345) | |
| | | |
| 97,368,949 |
| | |
| | | |
| |
| INFORMATION TECHNOLOGY – 23.1% | |
| | | |
| |
| COMMUNICATIONS EQUIPMENT - 1.7% | |
| | | |
| |
| Applied
Optoelectronics 2 | |
| 21,030 | | |
| 406,300 |
| Aviat
Networks 2 | |
| 23,961 | | |
| 782,566 |
| Clearfield 2,3 | |
| 58,600 | | |
| 1,704,088 |
| Digi
International 2,3 | |
| 70,000 | | |
| 1,820,000 |
| Genasys 2 | |
| 86,392 | | |
| 175,376 |
| Harmonic 2 | |
| 190,300 | | |
| 2,481,512 |
| Ituran Location and Control | |
| 50,000 | | |
| 1,362,000 |
| | |
| | | |
| 8,731,842 |
| ELECTRONIC EQUIPMENT, INSTRUMENTS & COMPONENTS - 8.7% | |
| | | |
| |
| Bel Fuse Cl. A | |
| 18,805 | | |
| 1,205,777 |
| †Evolv
Technologies Holdings 2 | |
| 318,000 | | |
| 1,500,960 |
| Fabrinet 2 | |
| 2,200 | | |
| 418,726 |
| FARO
Technologies 2,3,4 | |
| 104,800 | | |
| 2,361,144 |
| HollySys
Automation Technologies 2 | |
| 51,900 | | |
| 1,367,565 |
| Luna
Innovations 2 | |
| 566,211 | | |
| 3,765,303 |
| nLIGHT
2,3 | |
| 698,185 | | |
| 9,425,497 |
| PAR
Technology 2,3 | |
| 287,024 | | |
| 12,497,025 |
| Powerfleet
NJ 2 | |
| 1,143,450 | | |
| 3,910,599 |
| Richardson Electronics | |
| 535,322 | | |
| 7,146,549 |
| Vishay
Precision Group 2,3 | |
| 45,600 | | |
| 1,553,592 |
| | |
| | | |
| 45,152,737 |
| IT SERVICES - 0.4% | |
| | | |
| |
| †Couchbase 2 | |
| 11,467 | | |
| 258,237 |
| Hackett
Group (The) 3 | |
| 77,700 | | |
| 1,769,229 |
| Liberated
Syndication 2,5 | |
| 56,000 | | |
| 0 |
| | |
| | | |
| 2,027,466 |
| SEMICONDUCTORS & SEMICONDUCTOR EQUIPMENT - 7.4% | |
| | | |
| |
| Alpha
and Omega Semiconductor 2,3 | |
| 17,900 | | |
| 466,474 |
| Amtech
Systems 2,3 | |
| 92,184 | | |
| 387,173 |
| Axcelis
Technologies 2 | |
| 3,800 | | |
| 492,822 |
| AXT 2 | |
| 300,909 | | |
| 722,182 |
| Camtek
2 | |
| 134,492 | | |
| 9,331,055 |
| Cohu 2,3 | |
| 38,990 | | |
| 1,379,856 |
| FormFactor 2,3,4 | |
| 22,869 | | |
| 953,866 |
| Ichor
Holdings 2 | |
| 54,812 | | |
| 1,843,327 |
| Nova 2,3 | |
| 35,000 | | |
| 4,808,650 |
| NVE
Corporation 3 | |
| 34,400 | | |
| 2,697,992 |
| Onto
Innovation 2,3,4 | |
| 39,740 | | |
| 6,076,246 |
| PDF
Solutions 2,3 | |
| 29,700 | | |
| 954,558 |
| Photronics
2 | |
| 183,100 | | |
| 5,743,847 |
| Ultra
Clean Holdings 2,3 | |
| 81,000 | | |
| 2,765,340 |
| | |
| | | |
| 38,623,388 |
| SOFTWARE - 4.1% | |
| | | |
| |
| Alkami
Technology 2 | |
| 100,156 | | |
| 2,428,783 |
| American
Software Cl. A 3 | |
| 111,152 | | |
| 1,256,018 |
| Cellebrite
DI 2 | |
| 714,100 | | |
| 6,184,106 |
| Computer Modelling Group | |
| 629,875 | | |
| 4,815,391 |
| Digital
Turbine 2 | |
| 241,500 | | |
| 1,656,690 |
| Mitek
Systems 2 | |
| 32,917 | | |
| 429,238 |
| Model
N 2 | |
| 25,000 | | |
| 673,250 |
| Optiva 2 | |
| 28,000 | | |
| 69,733 |
| PROS
Holdings 2,3,4 | |
| 69,390 | | |
| 2,691,638 |
| †Riskified
Cl. A 2 | |
| 79,637 | | |
| 372,701 |
| Upland
Software 2 | |
| 244,100 | | |
| 1,032,543 |
| | |
| | | |
| 21,610,091 |
| TECHNOLOGY HARDWARE, STORAGE & PERIPHERALS - 0.8% | |
| | | |
| |
| AstroNova 2 | |
| 115,860 | | |
| 1,883,883 |
| Intevac
2 | |
| 539,400 | | |
| 2,330,208 |
| | |
| | | |
| 4,214,091 |
| Total
(Cost $87,950,510) | |
| | | |
| 120,359,615 |
| | |
| | | |
| |
| MATERIALS – 9.2% | |
| | | |
| |
| CHEMICALS - 2.3% | |
| | | |
| |
| Aspen
Aerogels 2 | |
| 499,612 | | |
| 7,883,877 |
| †Bioceres
Crop Solutions 2 | |
| 50,000 | | |
| 686,500 |
| LSB
Industries 2 | |
| 176,540 | | |
| 1,643,587 |
| †Orion | |
| 61,583 | | |
| 1,707,697 |
| Rayonier
Advanced Materials 2 | |
| 50,000 | | |
| 202,500 |
| | |
| | | |
| 12,124,161 |
| METALS & MINING - 6.9% | |
| | | |
| |
| Alamos Gold Cl. A | |
| 261,044 | | |
| 3,510,663 |
| Altius Minerals | |
| 171,100 | | |
| 2,381,106 |
| Haynes
International 3 | |
| 138,458 | | |
| 7,899,029 |
| Imdex | |
| 569,466 | | |
| 731,498 |
| 28
| 2023 Annual Report to Stockholders |
THE
ACCOMPANYING NOTES ARE AN INTEGRAL PART OF THESE FINANCIAL STATEMENTS |
December
31, 2023
| Schedule of Investments (continued) | |
| | |
|
| | |
| | |
|
| | |
SHARES | | |
VALUE |
| | |
| | |
|
| MATERIALS (continued) | |
| | | |
| |
| METALS & MINING (continued) | |
| | | |
| |
| MAG
Silver 2 | |
| 154,050 | | |
$ | 1,603,660 |
| Major
Drilling Group International 2 | |
| 1,627,672 | | |
| 11,313,429 |
| Olympic
Steel 3 | |
| 27,100 | | |
| 1,807,570 |
| †Ryerson Holding Corporation | |
| 48,128 | | |
| 1,669,079 |
| Sandstorm
Gold 3 | |
| 810,000 | | |
| 4,074,300 |
| Universal
Stainless & Alloy Products 2,3 | |
| 33,620 | | |
| 675,090 |
| | |
| | | |
| 35,665,424 |
| Total
(Cost $34,825,251) | |
| | | |
| 47,789,585 |
| | |
| | | |
| |
| REAL ESTATE – 2.3% | |
| | | |
| |
| OFFICE REITS - 0.3% | |
| | | |
| |
| Postal Realty Trust Cl.
A | |
| 114,000 | | |
| 1,659,840 |
| REAL ESTATE MANAGEMENT & DEVELOPMENT - 2.0% | |
| | | |
| |
| Altus Group | |
| 101,400 | | |
| 3,224,781 |
| †RE/MAX Holdings Cl. A | |
| 27,947 | | |
| 372,534 |
| Real
Matters 2 | |
| 229,500 | | |
| 1,091,166 |
| RMR
Group (The) Cl. A 3 | |
| 108,200 | | |
| 3,054,486 |
| Tejon
Ranch 2,3 | |
| 154,994 | | |
| 2,665,897 |
| | |
| | | |
| 10,408,864 |
| Total
(Cost $13,368,016) | |
| | | |
| 12,068,704 |
| | |
| | | |
| |
| UTILITIES – 0.3% | |
| | | |
| |
| WATER UTILITIES - 0.3% | |
| | | |
| |
| †Cadiz 2 | |
| 102,450 | | |
| 286,860 |
| Global Water
Resources | |
| 106,000 | | |
| 1,386,480 |
| Total
(Cost $1,016,318) | |
| | | |
| 1,673,340 |
| | |
| | | |
| |
| TOTAL COMMON
STOCKS | |
| | | |
| |
| (Cost
$407,664,463) | |
| | | |
| 507,334,859 |
| | |
| | | |
| |
| INVESTMENT COMPANIES – 0.5% | |
| | | |
| |
| | |
| | | |
| |
| FINANCIALS – 0.5% | |
| | | |
| |
| CAPITAL MARKETS - 0.5% | |
| | | |
| |
| ASA Gold and
Precious Metals | |
| 171,150 | | |
| 2,577,519 |
| (Cost
$2,914,815) | |
| | | |
| 2,577,519 |
| | |
| | | |
| |
| PREFERRED STOCK – 0.0% | |
| | | |
| |
| ENERGY – 0.0% | |
| | | |
| |
| OIL, GAS & CONSUMABLE FUELS - 0.0% | |
| | | |
| |
| Imperial Petroleum
8.75% Series A | |
| 4,784 | | |
| 100,464 |
| (Cost
$71,808) | |
| | | |
| 100,464 |
| | |
| | | |
| |
| REPURCHASE AGREEMENT– 2.4% | |
| | | |
| |
Fixed Income Clearing Corporation, 4.75% dated 12/29/23, due 1/2/24, maturity value
$12,456,575 (collateralized by obligations of .S. Government Agencies, 2.75%
due 2/15/28, valued at $12,699,076) | |
| | | |
| |
| (Cost $12,450,004) | |
| | | |
| 12,450,004 |
| | |
| | | |
| |
| TOTAL INVESTMENTS – 100.4% | |
| | | |
| |
| (Cost $423,101,090) | |
| | | |
| 522,462,846 |
| LIABILITIES
LESS CASH AND OTHER ASSETS – (0.4)% | |
| (1,969,504) |
| | |
| |
| NET ASSETS – 100.0% | |
$ | 520,493,342 |
ADR
– American Depository Receipt
| † | New
additions in 2023. |
| 1 | These
securities are defined as Level 2 securities due to fair value being based on quoted
prices for similar securities and/or due to the application of fair value factors. See
Notes to Financial Statements. |
| 2 | Non-income
producing. |
| 3 | All
or a portion of these securities were pledged as collateral in connection with the Fund’s
revolving credit agreement as of December 31, 2023. Total market value of pledged securities
as of December 31, 2023, was $5,897,949. |
| 4 | As
of December 31, 2023, a portion of these securities, in the aggregate amount of $1,171,409,
were rehypothecated by BNP Paribas Prime Brokerage International, Limited in connection
with the Fund’s revolving credit agreement. See Notes to Financial Statements.
|
| 5 | Securities
for which market quotations are not readily available represent 0.0% of net assets. These
securities have been valued at their fair value under procedures approved by the Fund’s
Board of Directors. These securities are defined as Level 3 securities due to the use
of significant unobservable inputs in the determination of fair value. See Notes to Financial
Statements. |
Bold
indicates the Fund’s 20 largest equity holdings in terms of December 31, 2023, market value.
TAX
INFORMATION: The cost of total investments for Federal income tax purposes was $426,401,096. As of December 31, 2023, net
unrealized appreciation for all securities was $96,061,750 consisting of aggregate gross unrealized appreciation of $139,009,732
and aggregate gross unrealized depreciation of $42,947,982. The primary causes of the difference between book and tax basis cost
are the timing of the recognition of losses on securities sold, investments in publicly traded partnerships and Trusts, investments
in Real Estate Investment Trusts and mark-to-market of Passive Foreign Investment Companies.
| THE
ACCOMPANYING NOTES ARE AN INTEGRAL PART OF THESE FINANCIAL STATEMENTS |
2023
Annual Report to Stockholders | 29 |
| Royce Micro-Cap
Trust |
December
31, 2023 |
Statement of Assets and Liabilities
| ASSETS: | |
| |
| Investments at value | |
$ | 510,012,842 | |
| Repurchase agreements (at cost and value) | |
| 12,450,004 | |
| Cash | |
| 59,188 | |
| Foreign currency (cost $36,268) | |
| 36,208 | |
| Receivable for investments sold | |
| 866,042 | |
| Receivable for dividends and interest | |
| 389,391 | |
| Prepaid expenses and other assets | |
| 43,358 | |
| Total Assets | |
| 523,857,033 | |
| LIABILITIES: | |
| | |
| Revolving credit agreement | |
| 2,000,000 | |
| Payable for investments purchased | |
| 658,714 | |
| Payable for investment advisory fee | |
| 539,575 | |
| Payable for directors' fees | |
| 29,199 | |
| Payable for interest expense | |
| 11,229 | |
| Accrued expenses | |
| 124,974 | |
| Total Liabilities | |
| 3,363,691 | |
| Net Assets | |
$ | 520,493,342 | |
| ANALYSIS OF NET ASSETS: | |
| | |
| Paid-in capital - $0.001 par value per share; 49,718,794 shares outstanding (150,000,000 shares authorized) | |
$ | 418,493,945 | |
| Total distributable earnings (loss) | |
| 101,999,397 | |
| Net Assets (net asset value per share - $10.47) | |
$ | 520,493,342 | |
| Investments at identified cost | |
$ | 410,651,086 | |
| 30 | 2023 Annual Report to Stockholders |
THE ACCOMPANYING NOTES ARE AN INTEGRAL PART OF THESE FINANCIAL STATEMENTS |
| Royce Micro-Cap Trust |
Year Ended
December 31, 2023 |
Statement of Operations
| INVESTMENT INCOME: | |
| |
| INCOME: | |
| |
| Dividends | |
$ | 7,761,347 | |
| Foreign withholding tax | |
| (287,149 | ) |
| Interest | |
| 784,930 | |
| Rehypothecation income | |
| 5,141 | |
| Total income | |
| 8,264,269 | |
| EXPENSES: | |
| | |
| Investment advisory fees | |
| 7,007,879 | |
| Interest expense | |
| 1,116,031 | |
| Administrative and office facilities | |
| 244,801 | |
| Stockholder reports | |
| 134,321 | |
| Custody and transfer agent fees | |
| 108,276 | |
| Directors' fees | |
| 100,705 | |
| Professional fees | |
| 69,726 | |
| Other expenses | |
| 70,384 | |
| Total expenses | |
| 8,852,123 | |
| Net investment income (loss) | |
| (587,854 | ) |
| REALIZED AND UNREALIZED GAIN (LOSS) ON INVESTMENTS AND FOREIGN CURRENCY: | |
| | |
| NET REALIZED GAIN (LOSS): | |
| | |
| Investments | |
| 67,079,230 | |
| Foreign currency transactions | |
| 39,989 | |
| NET CHANGE IN UNREALIZED APPRECIATION (DEPRECIATION): | |
| | |
| Investments | |
| 6,363,463 | |
| Other assets and liabilities denominated in foreign currency | |
| (542 | ) |
| Net realized and unrealized gain (loss) on investments and foreign currency | |
| 73,482,140 | |
| NET INCREASE (DECREASE) IN NET ASSETS FROM INVESTMENT OPERATIONS | |
$ | 72,894,286 | |
| THE ACCOMPANYING NOTES ARE AN INTEGRAL PART OF THESE FINANCIAL STATEMENTS |
2023 Annual Report to Stockholders | 31 |
Royce
Micro-Cap Trust
Statement of Changes in Net Assets
| | |
YEAR ENDED 12/31/23 | | |
YEAR ENDED 12/31/22 | |
| INVESTMENT OPERATIONS: | |
| | | |
| | |
| Net investment income (loss) | |
$ | (587,854 | ) | |
$ | (1,024,108 | ) |
| Net realized gain (loss) on investments and foreign currency | |
| 67,119,219 | | |
| 13,560,141 | |
| Net change in unrealized appreciation (depreciation) on investments and foreign currency | |
| 6,362,921 | | |
| (115,297,978 | ) |
| Net increase (decrease) in net assets from investment operations | |
| 72,894,286 | | |
| (102,761,945 | ) |
| DISTRIBUTIONS: | |
| | | |
| | |
| Total distributable earnings | |
| (35,849,605 | ) | |
| (43,327,856 | ) |
| Return of capital | |
| – | | |
| (396,334 | ) |
| Total distributions | |
| (35,849,605 | ) | |
| (43,724,190 | ) |
| CAPITAL STOCK TRANSACTIONS: | |
| | | |
| | |
| Reinvestment of distributions | |
| 17,559,078 | | |
| 22,062,341 | |
| Total capital stock transactions | |
| 17,559,078 | | |
| 22,062,341 | |
| Net Increase (Decrease) In Net Assets | |
| 54,603,759 | | |
| (124,423,794 | ) |
| NET ASSETS: | |
| | | |
| | |
| | |
| | | |
| | |
| Beginning of year | |
| 465,889,583 | | |
| 590,313,377 | |
| End of year | |
$ | 520,493,342 | | |
$ | 465,889,583 | |
| 32 | 2023 Annual Report to Stockholders |
THE ACCOMPANYING NOTES ARE AN INTEGRAL PART OF THESE FINANCIAL STATEMENTS |
| Royce Micro-Cap Trust |
Year Ended
December 31, 2023 |
Statement of Cash Flows
| CASH FLOWS FROM OPERATING ACTIVITIES: | |
| |
| Net increase (decrease) in net assets from investment operations | |
$ | 72,894,286 | |
| Adjustments to reconcile net increase (decrease) in net assets from investment operations to net cash provided by operating activities: | |
| | |
| Purchases of long-term investments | |
| (163,231,196 | ) |
| Proceeds from sales and maturities of long-term investments | |
| 183,234,267 | |
| Net purchases, sales and maturities of short-term investments | |
| 8,142,577 | |
| Net (increase) decrease in dividends and interest receivable and other assets | |
| (24,966 | ) |
| Net increase (decrease) in interest expense payable, accrued expenses and other liabilities | |
| (214,416 | ) |
| Net change in unrealized appreciation (depreciation) on investments | |
| (6,363,463 | ) |
| Net realized gain (loss) on investments | |
| (67,079,230 | ) |
| Net cash provided by operating activities | |
| 27,357,859 | |
| CASH FLOWS FROM FINANCING ACTIVITIES: | |
| | |
| Gross increase in revolving credit agreement | |
| (20,000,000 | ) |
| Gross decrease in revolving credit agreement | |
| 9,000,000 | |
| Distributions net of reinvestment (reinvestment $17,559,078) | |
| (18,290,527 | ) |
| Net cash used for financing activities | |
| (27,290,527 | ) |
| INCREASE (DECREASE) IN CASH: | |
| 67,332 | |
| Cash and foreign currency at beginning of year | |
| 28,064 | |
| Cash and foreign currency at end of year | |
$ | 95,396 | |
Supplemental disclosure of cash flow information:
For the year ended December 31, 2023, the Fund paid $1,177,805
in interest expense.
| THE ACCOMPANYING NOTES ARE AN INTEGRAL PART OF THESE FINANCIAL STATEMENTS |
2023 Annual Report to Stockholders | 33 |
Royce Micro-Cap Trust
Financial Highlights
This table is presented to show selected data for a
share of Common Stock outstanding throughout each period, and to assist stockholders in evaluating the Fund's performance for the
periods presented.
| | |
YEARS ENDED | |
| | |
| 12/31/23 | | |
| 12/31/22 | | |
| 12/31/21 | | |
| 12/31/20 | | |
| 12/31/19 | |
| Net Asset Value, Beginning of Period | |
$ | 9.77 | | |
$ | 13.06 | | |
$ | 11.79 | | |
$ | 9.63 | | |
$ | 8.53 | |
| INVESTMENT OPERATIONS: | |
| | | |
| | | |
| | | |
| | | |
| | |
| Net investment income (loss) | |
| (0.01 | ) | |
| (0.02 | ) | |
| 0.04 | 1 | |
| (0.03 | ) | |
| 0.01 | |
| Net realized and unrealized gain (loss) on investments and foreign currency | |
| 1.50 | | |
| (2.26 | ) | |
| 2.12 | | |
| 2.86 | | |
| 1.81 | |
| Net increase (decrease) in net assets from investment operations | |
| 1.49 | | |
| (2.28 | ) | |
| 2.16 | | |
| 2.83 | | |
| 1.82 | |
| DISTRIBUTIONS: | |
| | | |
| | | |
| | | |
| | | |
| | |
| Net investment income | |
| – | | |
| (0.05 | ) | |
| – | | |
| (0.08 | ) | |
| (0.03 | ) |
| Net realized gain on investments and foreign currency | |
| (0.74 | ) | |
| (0.89 | ) | |
| (0.84 | ) | |
| (0.53 | ) | |
| (0.65 | ) |
| Return of capital | |
| – | | |
| (0.01 | ) | |
| – | | |
| – | | |
| – | |
| Total distributions | |
| (0.74 | ) | |
| (0.95 | ) | |
| (0.84 | ) | |
| (0.61 | ) | |
| (0.68 | ) |
| CAPITAL STOCK TRANSACTIONS: | |
| | | |
| | | |
| | | |
| | | |
| | |
| Effect of reinvestment of distributions by Common Stockholders | |
| (0.05 | ) | |
| (0.06 | ) | |
| (0.05 | ) | |
| (0.06 | ) | |
| (0.04 | ) |
| Total capital stock transactions | |
| (0.05 | ) | |
| (0.06 | ) | |
| (0.05 | ) | |
| (0.06 | ) | |
| (0.04 | ) |
| Net Asset Value, End of Period | |
$ | 10.47 | | |
$ | 9.77 | | |
$ | 13.06 | | |
$ | 11.79 | | |
$ | 9.63 | |
| Market Value, End of Period | |
$ | 9.24 | | |
$ | 8.68 | | |
$ | 11.55 | | |
$ | 10.12 | | |
$ | 8.54 | |
| TOTAL RETURN:2 | |
| | | |
| | | |
| | | |
| | | |
| | |
| Net Asset Value | |
| 16.64 | % | |
| (16.89 | )% | |
| 19.17 | % | |
| 33.60 | % | |
| 22.44 | % |
| Market Value | |
| 15.86 | % | |
| (16.51 | )% | |
| 22.78 | % | |
| 29.32 | % | |
| 24.82 | % |
| RATIOS BASED ON AVERAGE NET ASSETS: | |
| | | |
| | | |
| | | |
| | | |
| | |
| Investment advisory fee expense3 | |
| 1.46 | % | |
| 1.47 | % | |
| 1.04 | % | |
| 1.19 | % | |
| 0.85 | % |
| Other operating expenses | |
| 0.39 | % | |
| 0.29 | % | |
| 0.16 | % | |
| 0.24 | % | |
| 0.35 | % |
| Total expenses (net) | |
| 1.85 | % | |
| 1.76 | % | |
| 1.20 | % | |
| 1.43 | % | |
| 1.20 | % |
| Expenses excluding interest expense | |
| 1.62 | % | |
| 1.63 | % | |
| 1.16 | % | |
| 1.34 | % | |
| 1.01 | % |
| Expenses prior to balance credits | |
| 1.85 | % | |
| 1.76 | % | |
| 1.20 | % | |
| 1.43 | % | |
| 1.20 | % |
| Net investment income (loss) | |
| (0.12 | )% | |
| (0.21 | )% | |
| 0.30 | %1 | |
| (0.34 | )% | |
| 0.10 | % |
| SUPPLEMENTAL DATA: | |
| | | |
| | | |
| | | |
| | | |
| | |
| Net Assets, End of Period (in thousands) | |
$ | 520,493 | | |
$ | 465,890 | | |
$ | 590,313 | | |
$ | 515,916 | | |
$ | 404,807 | |
| Portfolio Turnover Rate | |
| 30 | % | |
| 26 | % | |
| 15 | % | |
| 17 | % | |
| 15 | % |
| REVOLVING CREDIT AGREEMENT: | |
| | | |
| | | |
| | | |
| | | |
| | |
| Asset coverage | |
| 26125 | % | |
| 4335 | % | |
| 2783 | % | |
| 2445 | % | |
| 1940 | % |
| Asset coverage per $1,000 | |
$ | 261,247 | | |
$ | 43,354 | | |
$ | 27,832 | | |
$ | 24,451 | | |
$ | 19,400 | |
| 1 | A special distribution from ECN Capital resulted in an
increase in net investment income (loss) per share of $0.07 and an increase in the ratio of net investment income (loss) to average
net assets of 0.51%. |
| 2 | The Market Value Total Return is calculated assuming a
purchase of Common Stock on the opening of the first business day and a sale on the closing of the last business day of each period.
Dividends and distributions are assumed for the purposes of this calculation to be reinvested at prices obtained under the Fund's
Distribution Reinvestment and Cash Purchase Plan. Net Asset Value Total Return is calculated on the same basis, except that the
Fund's net asset value is used on the purchase, sale and dividend reinvestment dates instead of market value. |
| 3 | The investment advisory fee is calculated based on average
net assets over a rolling 36-month basis, while the above ratios of investment advisory fee expenses are based on the average
net assets over a 12-month basis. |
| 34 | 2023 Annual Report to Stockholders |
THE ACCOMPANYING NOTES ARE AN INTEGRAL PART OF THESE FINANCIAL STATEMENTS |
Royce
Micro-Cap Trust
Notes
to Financial Statements
Summary
of Significant Accounting Policies
Royce
Micro-Cap Trust, Inc. (the “Fund”), is a diversified closed-end investment company that was incorporated under the
laws of the State of Maryland on September 9, 1993. The Fund commenced operations on December 14, 1993.
The
preparation of financial statements in conformity with accounting principles generally accepted in the United States of America
requires management to make estimates and assumptions that affect the reported amounts of assets and liabilities and the disclosure
of contingent assets and liabilities at the date of the financial statements and the reported amounts of income and expenses during
the reporting period. Actual results could differ from those estimates.
The
Fund is an investment company registered under the Investment Company Act of 1940 (the “1940 Act”) and accordingly
follows the investment company accounting and reporting guidance of the Financial Accounting Standards Board (FASB) Accounting
Standard Codification Topic 946 “Financial Services-Investment Companies.”
Royce
& Associates, LP, the Fund’s investment adviser, is a majority-owned subsidiary of Franklin Resources, Inc. and primarily
conducts business using the name Royce Investment Partners (“Royce”).
VALUATION
OF INVESTMENTS:
Portfolio
securities held by the Fund are valued as of the close of trading on the New York Stock Exchange (“NYSE”) (generally
4:00 p.m. Eastern time) on the valuation date. Investments in money market funds are valued at net asset value per share. Values
for non-U.S. dollar denominated equity securities are converted to U.S. dollars daily based upon prevailing foreign currency exchange
rates as quoted by a major bank.
Portfolio
securities that are listed on an exchange or Nasdaq, or traded on OTC Market Group Inc.’s OTC Link ATS or other alternative
trading system, are valued: (i) on the basis of their last reported sales prices or official closing prices, as applicable, on
a valuation date; or (ii) at their highest reported bid prices in the event such equity securities did not trade on a valuation
date. Such inputs are generally referred to as “Level 1” inputs because they represent reliable quoted prices in active
markets for identical securities.
If
the value of a portfolio security held by the Fund cannot be determined solely by reference to Level 1 inputs, such portfolio
security will be “fair valued.” The Fund’s Board of Directors has designated Royce as valuation designee to
perform fair value determinations for such portfolio securities in accordance with Rule 2a-5 under the 1940 Act (“Rule 2a-5”).
Pursuant to Rule 2a-5, fair values are determined in accordance with policies and procedures approved by the Fund’s Board
of Directors and policies and procedures adopted by Royce in its capacity as valuation designee for the Fund. Fair valued securities
are reported as either “Level 2” or “Level 3” securities.
As
a general principle, the fair value of a security is the amount which the Fund might reasonably expect to receive for the security
upon its current sale. However, in light of the judgment involved in fair valuations, no assurance can be given that a fair value
assigned to a particular portfolio security will be the amount which the Fund might be able to receive upon its current sale.
When a fair value pricing methodology is used, the fair value prices used by the Fund for such securities will likely differ from
the quoted or published prices for the same securities.
Level
2 inputs are other significant observable inputs (e.g., dealer bid side quotes and quoted prices for securities with comparable
characteristics). Examples of situations in which Level 2 inputs are used to fair value portfolio securities held by the Fund
on a particular valuation date include:
| ● | Over-the-counter
equity securities other than those traded on OTC Market Group Inc.’s OTC Link ATS
or other alternative trading system (collectively referred to herein as “Other
OTC Equity Securities”) are fair valued at their highest bid price when Royce receives
at least two bid side quotes from dealers who make markets in such securities; |
| ● | Certain
bonds and other fixed income securities may be fair valued by reference to other securities
with comparable ratings, interest rates, and maturities in accordance with valuation
methodologies maintained by certain independent pricing services; and |
| ● | The
Fund uses an independent pricing service to fair value certain non-U.S. equity securities
when U.S. market volatility exceeds a certain threshold. This pricing service uses proprietary
correlations it has developed between the movement of prices
of non-U.S. equity securities and indices of U.S.-traded securities, futures contracts, and other indications to estimate the
fair value of such non-U.S. securities. |
Level
3 inputs are significant unobservable inputs. Examples of Level 3 inputs include (without limitation) the last trade price for
a security before trading was suspended or terminated; discounts to last trade price for lack of marketability or otherwise; market
price information regarding other securities; information received from the issuer and/or published documents, including SEC filings
and financial statements; and other publicly available information. Pursuant to the above-referenced policies and procedures,
Royce may use
2023
Annual Report to Stockholders | 35
Royce
Micro-Cap Trust
Notes
to Financial Statements (continued)
VALUATION
OF INVESTMENTS (continued):
various
techniques in making fair value determinations based upon Level 3 inputs, which techniques may include (without limitation): (i)
workout valuation methods (e.g., earnings multiples, discounted cash flows, liquidation values, derivations of book value, firm
or probable offers from qualified buyers for the issuer’s ongoing business, etc.); (ii) discount or premium from market,
or compilation of other observable market information, for other similar freely traded securities; (iii) conversion from the readily
available market price of a security into which an affected security is convertible or exchangeable; and (iv) pricing models or
other formulas. In the case of restricted securities, fair value determinations generally start with the inherent or intrinsic
worth of the relevant security, without regard to the restrictive feature, and are reduced for any diminution in value resulting
from the restrictive feature. Due to the inherent uncertainty of such valuations, these fair values may differ significantly from
the values that would have been used had an active market existed.
A
security that is valued by reference to Level 1 or Level 2 inputs may drop to Level 3 on a particular valuation date for several
reasons, including if:
| ● | an
equity security that is listed on an exchange or Nasdaq, or traded on OTC Market Group
Inc.’s OTC Link ATS or other alternative trading system, has not traded and there
are no bids; |
| ● | Royce
does not receive at least two bid side quotes for an Other OTC Equity Security; |
| ● | the
independent pricing services are unable to supply fair value prices; or |
| ● | the
Level 1 or Level 2 inputs become otherwise unreliable for any reason (e.g., a significant
event occurs after the close of trading
for a security but prior to the time the Fund prices its shares). |
The
table below shows the aggregate value of the various Level 1, Level 2, and Level 3 securities held by the Fund as of December
31, 2023. Any Level 2 or Level 3 securities held by the Fund are noted in its Schedule of Investments. The inputs or methodology
used for valuing securities are not necessarily an indication of the risk associated with owning those securities.
| | |
LEVEL
1 | |
LEVEL
2 | |
LEVEL
3 | |
TOTAL |
| Common Stocks | |
| $500,343,824 | | |
| $ 6,765,355 | | |
| $225,680 | | |
| $507,334,859 | |
| Investment Companies | |
| 2,577,519 | | |
| – | | |
| – | | |
| 2,577,519 | |
| Preferred Stock | |
| 100,464 | | |
| – | | |
| – | | |
| 100,464 | |
| Repurchase Agreement | |
| – | | |
| 12,450,004 | | |
| – | | |
| 12,450,004 | |
Level
3 Reconciliation:
| | |
| | | |
| | | |
| | | |
| | | |
UNREALIZED
GAIN (LOSS) 1 | |
| | |
| | |
| BALANCE
AS OF 12/31/22 | | |
| PURCHASES | | |
| SALES | | |
| REALIZED
GAIN (LOSS) 1 | | |
CURRENTLY HELD
SECURITIES | |
SECURITIES NO
LONGER HELD | |
| BALANCE
AS
OF 12/31/23 | |
| Common
Stocks | |
| $225,680 | | |
| $ – | | |
| $ – | | |
| $ – | | |
$0 | |
$ – | |
| $225,680 | |
| 1 | The
net change in unrealized appreciation (depreciation) is included in the accompanying
Statement of Operations. Change in unrealized appreciation (depreciation) includes net
unrealized appreciation (depreciation) resulting from changes in investment values during
the reporting period and the reversal of previously recorded unrealized appreciation
(depreciation) when gains or losses are realized. Net realized gain (loss) from investments
and foreign currency transactions is included in the accompanying Statement of Operations. |
REPURCHASE
AGREEMENTS:
The
Fund may enter into repurchase agreements with institutions that the Fund’s investment adviser has determined are creditworthy.
The Fund restricts repurchase agreements to maturities of no more than seven days. Securities pledged as collateral for repurchase
agreements, which are held until maturity of the repurchase agreements, are marked-to-market daily and maintained at a value at
least equal to the principal amount of the repurchase agreement (including accrued interest). Repurchase agreements could involve
certain risks in the event of default or insolvency of the counter-party, including possible delays or restrictions upon the ability
of the Fund to dispose of its underlying securities. The remaining contractual maturity of the repurchase agreement held by the
Fund as of December 31, 2023, is next business day and continuous.
FOREIGN
CURRENCY:
Net
realized foreign exchange gains or losses arise from sales and maturities of short-term securities, sales of foreign currencies,
expiration of currency forward contracts, currency gains or losses realized between the trade and settlement dates on securities
transactions, and the difference between the amounts of dividends, interest, and foreign withholding taxes recorded on the Fund’s
books and the U.S. dollar equivalent of the amounts actually received or paid. Net unrealized foreign exchange gains and losses
arise from changes in the value of assets and liabilities, other than investments in securities at the end of the reporting period,
as a result of changes in foreign currency exchange rates.
The
Fund does not isolate that portion of the results of operations resulting from fluctuations in foreign exchange rates on investments
from the fluctuations arising from changes in market prices of securities held. Such fluctuations are included with the net realized
and unrealized gain or loss on investments.
For
the purposes of the Statement of Cash Flows, the Fund defines Cash as cash, including foreign currency.
36
| 2023 Annual Report to Stockholders
Royce
Micro-Cap Trust
Notes
to Financial Statements (continued)
TAXES:
As
a qualified regulated investment company under Subchapter M of the Internal Revenue Code, the Fund is not subject to income taxes
to the extent that it distributes substantially all of its taxable income for its fiscal year. The Schedule of Investments includes
information regarding income taxes under the caption “Tax Information.”
DISTRIBUTIONS:
The
Fund pays quarterly distributions on the Fund’s Common Stock at the annual rate of 7% of the rolling average of the prior
four calendar quarter-end NAVs of the Fund’s Common Stock, with the fourth quarter distribution being the greater of 1.75%
of the rolling average or the distribution required by IRS regulations. Distributions to Common Stockholders are recorded on ex-dividend
date. To the extent that distributions in any year are not paid from long-term capital gains, net investment income or net short-term
capital gains, they will represent a return of capital. Distributions are determined in accordance with income tax regulations
that may differ from accounting principles generally accepted in the United States of America. Permanent book and tax differences
relating to stockholder distributions will result in reclassifications within the capital accounts. Undistributed net investment
income may include temporary book and tax basis differences, which will reverse in a subsequent period. Any taxable income or
gain remaining undistributed at fiscal year end is distributed in the following year.
INVESTMENT
TRANSACTIONS AND RELATED INVESTMENT INCOME:
Investment
transactions are accounted for on the trade date. Dividend income is recorded on the ex-dividend date except for certain dividends
from securities where the dividend rate is not available. In such cases, the dividend is recorded as soon as the information is
received by the Fund. Non-cash dividend income is recorded at the fair market value of the securities received. Interest income
is recorded on an accrual basis. Premiums and discounts on debt securities are amortized using the effective yield-to-maturity
method. Realized gains and losses from investment transactions are determined on the basis of identified cost for book and tax
purposes.
EXPENSES:
The
Fund incurs direct and indirect expenses. Expenses directly attributable to the Fund are charged to the Fund, while expenses applicable
to more than one of the Royce Funds are allocated equitably. Certain personnel, occupancy costs and other administrative expenses
related to all of the Royce Funds are allocated by Royce under an administration agreement and are included in administrative
and office facilities and professional fees.
INDEMNIFICATION
PROVISIONS:
Reference
is made to Maryland law, the Fund’s Articles of Incorporation, as amended and supplemented, and the Fund’s Amended
and Restated By-laws, each of which provides for the indemnification by the Fund of the Fund’s officers and directors under
the circumstances and to the extent set forth therein. Reference is also made to the investment advisory agreement between the
Fund and Royce which provides for the indemnification by the Fund of Royce under the circumstances and to the extent set forth
therein. Additionally, in the normal course of business, the Fund enters into contracts with service providers that contain general
indemnification provisions in favor of such service providers and other covered persons. The amount of any potential Fund liability
under these indemnification arrangements, if any, currently cannot be determined with any degree of specificity. The Fund is not
currently in possession of any information that would cause it to believe that the Fund is reasonably likely to be subject to
any material adverse impact from the operation of these indemnification arrangements. No assurance can be given, however, that
the Fund will not incur any liability from the operation of these indemnification arrangements. Any future liability to the Fund
that may arise from the operation of such arrangements will be publicly disclosed to the extent required by relevant accounting
guidance and applicable laws, rules, and regulations.
Capital
Stock:
The
Fund issued 2,030,423 and 2,488,423 shares of Common Stock as reinvestment of distributions for the years ended December 31, 2023,
and December 31, 2022, respectively.
Borrowings:
The
Fund is party to a revolving credit agreement (the “credit agreement”) with BNP Paribas Prime Brokerage International,
Limited (BNPPI). The Fund pays a commitment fee of 0.50% per annum on the unused portion of the then-current maximum amount that
may be borrowed by the Fund under the credit agreement. The credit agreement has a 179-day rolling term that resets daily. The
Fund pledges eligible portfolio securities as collateral and has granted a security interest in such pledged securities to, and
in favor of, BNPPI as security for the loan balance outstanding. The amount of eligible portfolio securities required to be pledged
as collateral is determined by BNPPI in accordance with the credit agreement. In determining collateral requirements, the value
of eligible securities pledged as collateral is subject to discount by BNPPI based upon a variety of factors set forth in the
credit agreement. As of December 31, 2023, the market value of eligible securities pledged as collateral exceeded two times the
loan balance outstanding.
2023
Annual Report to Stockholders | 37
Royce
Micro-Cap Trust
Notes
to Financial Statements (continued)
Borrowings
(continued):
If
the Fund fails to meet certain requirements, or comply with other financial covenants set forth in the credit agreement, the Fund
may be required to repay immediately, in part or in full, the loan balance outstanding under the credit agreement, which may necessitate
the sale of portfolio securities at potentially inopportune times. BNPPI may terminate the credit agreement upon certain ratings
downgrades of its corporate parent, which would result in the Fund’s entire loan balance becoming immediately due and payable.
The occurrence of such ratings downgrades may necessitate the sale of portfolio securities at potentially inopportune times. BNPPI
may also terminate the credit agreement upon sixty (60) calendar days’ prior written notice to the Fund in the event the
Fund’s net asset value per share as of the close of business on the last business day of any calendar month declines by
thirty-five percent (35%) or more from the Fund’s net asset value per share as of the close of business on the last business
day of the immediately preceding calendar month.
The
credit agreement also permits, subject to certain conditions, BNPPI to rehypothecate portfolio securities pledged by the Fund
up to the amount of the loan balance outstanding. The Fund continues to receive payments in lieu of dividends and interest on
rehypothecated securities. The Fund also has the right under the credit agreement to recall the rehypothecated securities from
BNPPI on demand. If BNPPI fails to deliver the recalled security in a timely manner, the Fund is compensated by BNPPI for any
fees or losses related to the failed delivery or, in the event a recalled security is not returned by BNPPI, the Fund, upon notice
to BNPPI, may reduce the loan balance outstanding by the value of the recalled security failed to be returned. The Fund receives
a portion of the fees earned by BNPPI in connection with the rehypothecation of portfolio securities.
The
maximum amount the Fund may borrow under the credit agreement is $22,000,000. The Fund has the right to further reduce the maximum
amount it can borrow under the credit agreement upon one (1) business day’s prior written notice to BNPPI. In addition,
the Fund and BNPPI may agree to increase the maximum amount the Fund can borrow under the credit agreement, which amount may not
exceed $60,000,000.
As
of December 31, 2023, the Fund had outstanding borrowings of $2,000,000. During the year ended December 31, 2023, the Fund had
an average daily loan balance of $17,846,575 at a weighted average borrowing cost of 6.21%. The maximum loan balance outstanding
during the year ended December 31, 2023, was $22,000,000. As of December 31, 2023, the aggregate value of rehypothecated securities
was $1,171,409. During the year ended December 31, 2023, the Fund earned $5,141 in fees from rehypothecated securities.
Investment
Advisory Agreement:
As
compensation for its services under the investment advisory agreement, Royce receives a fee comprised of a Basic Fee (“Basic
Fee”) and an adjustment to the Basic Fee based on the investment performance of the Fund in relation to the investment record
of the Russell 2000. The fee is payable monthly.
The
Basic Fee is a monthly fee equal to 1/12 of 1% (1% on an annualized basis) of the average of the Fund’s month-end net assets
for the rolling 36-month period ending with such month (the “performance period”). The Basic Fee for each month is
increased or decreased at the rate of 1/12 of .05% for each percentage point that the investment performance of the Fund exceeds,
or is exceeded by, the percentage change in the investment record of the Russell 2000 for the performance period by more than
two percentage points. The performance period for each such month is a rolling 36-month period ending with such month. The maximum
increase or decrease in the Basic Fee for any month may not exceed 1/12 of .5%. Accordingly, for each month, the maximum monthly
fee rate as adjusted for performance is 1/12 of 1.5% and is payable if the investment performance of the Fund exceeds the percentage
change in the investment record of the Russell 2000 by 12 or more percentage points for the performance period, and the minimum
monthly fee rate as adjusted for performance is 1/12 of .5% and is payable if the percentage change in the investment record of
the Russell 2000 exceeds the investment performance of the Fund by 12 or more percentage points for the performance period.
For
the twelve rolling 36-month periods in 2023, the Fund’s investment performance ranged from 5% above to 26% above the investment
performance of the Russell 2000. Accordingly, the net investment advisory fee consisted of a Basic Fee of $5,087,501 and a net
upward adjustment of $1,920,378 for the performance of the Fund relative to that of the Russell 2000. For the year ended December
31, 2023, the Fund expensed Royce investment advisory fees totaling $7,007,879.
Purchases
and Sales of Investment Securities:
For
the year ended December 31, 2023, the costs of purchases and proceeds from sales of investment securities, other than short-term
securities, amounted to $141,091,940 and $167,715,946, respectively.
38 |
2023 Annual Report to Stockholders
Royce
Micro-Cap Trust
Notes
to Financial Statements (continued)
Purchases
and Sales of Investment Securities (continued):
Cross
trades may be executed by the Fund pursuant to Rule 17a-7 under the 1940 Act. Cross trading is the buying or selling of portfolio
securities between funds to which Royce or an affiliate of Franklin Resources, Inc. serves as investment adviser. The Fund’s
Chief Compliance Officer reviews such transactions each quarter for compliance with the requirements and restrictions set forth
by Rule 17a-7, and reports the results of that review to the Board of Directors. Cross trades for the year ended December 31,
2023, were as follows:
| COSTS
OF PURCHASES |
PROCEEDS
FROM SALES |
REALIZED
GAIN (LOSS) |
| $1,718,239 |
$403,665 |
$338,215 |
Tax
Information:
Distributions
during the years ended December 31, 2023 and 2022, were characterized as follows for tax purposes:
| ORDINARY
INCOME |
LONG-TERM CAPITAL GAINS |
RETURN
OF CAPITAL |
| 2023 |
2022 |
2023 |
2022 |
2023 |
2022 |
| $7,402,359 |
$3,507,505 |
$28,447,246 |
$39,820,351 |
$
– |
$396,334 |
The
tax basis components of distributable earnings as of December 31, 2023, were as follows:
| |
|
|
QUALIFIED LATE YEAR |
TOTAL |
| UNDISTRIBUTED |
UNDISTRIBUTED LONG-TERM |
NET UNREALIZED
APPRECIATION |
ORDINARY AND
POST-OCTOBER LOSS |
DISTRIBUTABLE ORDINARY |
| INCOME |
CAPITAL
GAINS |
(DEPRECIATION)1 |
DEFERRALS2 |
EARNINGS |
| $2,049,581 |
$3,888,607 |
$96,061,209 |
$
– |
$101,999,397 |
| 1 | Includes
timing differences on foreign currency, recognition of losses on securities sold, investments
in Real Estate Investment Trusts, investments in publicly traded partnerships and Trusts
and mark-to-market of Passive Foreign Investment Companies. |
| 2 | Under
the current tax law, capital losses and qualified late year ordinary losses incurred
after October 31 may be deferred and treated as occurring on the first day of the following
fiscal year. This column also includes passive activity losses. |
For
financial reporting purposes, capital accounts and distributions to stockholders are adjusted to reflect the tax character of
permanent book/tax differences. For the year ended December 31, 2023, the Fund recorded the following permanent reclassifications,
which relate primarily to investments in trusts:
| TOTAL DISTRIBUTABLE EARNINGS (LOSS) |
PAID-IN
CAPITAL |
| $(545,849) |
$545,849 |
Management
has analyzed the Fund’s tax positions taken on federal income tax returns for all open tax years (2020-2023) and has concluded
that as of December 31, 2023, no provision for income tax is required in the Fund’s financial statements.
Subsequent
Events:
Subsequent
events have been evaluated through the date the financial statements were issued and it has been determined that no events have
occurred that require disclosure.
2023 Annual Report to Stockholders | 39
Report
of Independent Registered Public Accounting Firm
To
the Board of Directors and Stockholders of Royce Micro-Cap Trust, Inc.:
Opinion
on the Financial Statements
We
have audited the accompanying statement of assets and liabilities, including the schedule of investments, of Royce Micro-Cap
Trust, Inc. (the “Fund”) as of December 31, 2023, the related statements of operations and cash flows for the
year ended December 31, 2023, the statement of changes in net assets for each of the two years in the period ended December
31, 2023, including the related notes, and the financial highlights for each of the five years in the period ended December
31, 2023 (collectively referred to as the “financial statements”). In our opinion, the financial statements
present fairly, in all material respects, the financial position of the Fund as of December 31, 2023, the results of its
operations and its cash flows for the year then ended, the changes in its net assets for each of the two years in the period
ended December 31, 2023 and the financial highlights for each of the five years in the period ended December 31, 2023 in
conformity with accounting principles generally accepted in the United States of America.
Basis
for Opinion
These
financial statements are the responsibility of the Fund’s management. Our responsibility is to express an opinion on
the Fund’s financial statements based on our audits. We are a public accounting firm registered with the Public Company
Accounting Oversight Board (United States) (PCAOB) and are required to be independent with respect to the Fund in accordance
with the U.S. federal securities laws and the applicable rules and regulations of the Securities and Exchange Commission and
the PCAOB.
We
conducted our audits of these financial statements in accordance with the standards of the PCAOB. Those standards require that
we plan and perform the audit to obtain reasonable assurance about whether the financial statements are free of material misstatement,
whether due to error or fraud.
Our
audits included performing procedures to assess the risks of material misstatement of the financial statements, whether due to
error or fraud, and performing procedures that respond to those risks. Such procedures included examining, on a test basis, evidence
regarding the amounts and disclosures in the financial statements. Our audits also included evaluating the accounting principles
used and significant estimates made by management, as well as evaluating the overall presentation of the financial statements.
Our procedures included confirmation of securities owned as of December 31, 2023 by correspondence with the custodian and brokers;
when replies were not received from brokers, we performed other auditing procedures. We believe that our audits provide a reasonable
basis for our opinion.
/s/PricewaterhouseCoopers
LLP
New
York, New York
February
22, 2024
We
have served as the auditor of one or more investment companies in the Franklin Templeton Group of Funds since 1948.
40
| 2023 Annual Report to Stockholders
This
page is intentionally left blank.
2023 Annual Report to Stockholders | 41
MANAGERS’
DISCUSSION (UNAUDITED)
Royce Value Trust (RVT)

Chuck
Royce, Lauren Romeo, CFA®,
Steven McBoyle, Andrew Palen,
George Necakov, CFA®
FUND
PERFORMANCE
Royce
Value Trust (RVT) advanced 21.6% on an NAV (net asset value) basis and 18.8% on a market price basis in 2023 versus respective
gains of 16.9% and 15.9% for its primary smallcap benchmark, the unleveraged Russell 2000 Index, and the unleveraged S&P SmallCap
600 Index, for the same period. The Fund also maintained its longer-term relative advantages over the Russell 2000, beating
it on both an NAV and market price basis for the 3-, 5-, 10-, 15-, 25-, 30-, 35-year, and since inception (11/26/86) periods ended
12/31/23.
WHAT
WORKED… AND WHAT DIDN’T
All of RVT’S 11 equity sectors made positive contributions to calendar-year performance, led by Industrials, Information
Technology, and Financials while Utilities, Consumer Staples, and Communication Services made the smallest contributions.
At the industry level, machinery (Industrials), semiconductors & semiconductor equipment (Information Technology), and
capital markets (Financials) made the biggest positive impact. The biggest detractors were communications equipment (Information
Technology), biotechnology (Health Care), and air freight & logistics (Industrials).
The top-contributing position in 2023 was First Citizens BancShares, which we’ve owned for many years, due mostly to
its strong liquidity position and stellar deposit franchise. We began adding shares in late 2022 that were trading at roughly
5x earnings per share. In March 2023, First Citizens was chosen by the FDIC to acquire Silicon Valley Bank, most likely owing
to its long history of buying failed banks. Silicon Valley’s travails notwithstanding, the purchase was accretive to
First Citizens’ tangible book value and earnings, and helped spur a sharp rise in its stock—as did the lack of
a banking crisis in the subsequent months. IES Holdings designs and installs electrical and technology systems and provides
infrastructure products and services to data centers, residential housing, and commercial and industrial facilities. It operates
through four segments: Communications, Residential, Commercial and Industrial, and Infrastructure Solutions. Revenue, earnings,
and profit margins all moved up in 2023, driven mostly by strength in its Communications, Residential, and Infrastructure
Solutions groups.
| |
|
|
|
|
|
|
| |
Top
Contributors to Performance |
|
Top
Detractors from Performance |
|
| |
For
2023 (%)1 |
|
|
For
2023 (%)2 |
|
|
| |
First Citizens BancShares Cl. A |
0.88 |
|
Valmont Industries |
-0.32 |
|
| |
IES Holdings |
0.78 |
|
First Republic Bank |
-0.26 |
|
| |
Alamos Gold Cl. A |
0.57 |
|
Driven Brands Holdings |
-0.25 |
|
| |
APi Group |
0.56 |
|
Calix |
-0.24 |
|
| |
CIRCOR International |
0.53 |
|
Forward Air |
-0.23 |
|
| |
1
Includes dividends |
|
|
2
Net of dividends |
|
|
| |
|
|
|
|
|
|
The top-detracting position was Valmont Industries, which makes products for the infrastructure and agricultural markets,
including those used in utility grid resilience, solar energy, upgrades to lighting and transportation infrastructure, and
the 5G rollout. The company’s Agriculture Technology unit was hampered by slower growth and lower-than-expected adoption
rates, while the firm was also facing more widespread inflationary pressures and lower sales in its telecom business. To address
these issues, Valmont initiated an organizational realignment that entailed executive leadership changes designed to improve
efficiency and streamline decision-making. The ensuing short-term disruptions and uncertainty helped drive its stock down.
San Francisco-based regional bank, First Republic Bank, was the third bank to declare insolvency in 2023 (following Silicon
Valley and Signature Banks) and the second-largest failure since the fall of Washington Mutual in the 2008 Financial Crisis.
It was hurt by having too many uninsured deposits and too many reserves in long-term debt instruments, which began losing value
when interest rates began to rise. The result was a bailout by JPMorgan Chase in May.
RVT’s advantage over the Russell 2000 came mostly from both sector allocation and stock selection in 2023, with the
former having the most impact. Altogether, seven of 11 equity sectors contributed to the Fund’s relative edge. Both
stock selection and our higher weighting in Industrials, stock selection and, to a lesser degree, our slightly lower allocation
in Financials, and having virtually no exposure to Utilities drove relative outperformance most. Conversely, stock selection
in Information Technology, Consumer Staples, and Health Care detracted most.
CURRENT POSITIONING
AND OUTLOOK
Our outlook is constructive. First, we suspect that returns are likely to be spread more widely over the next few years and
that the reign of the Magnificent 7—the mega-cap cohort of Alphabet, Amazon, Apple, Meta, Microsoft, Nvidia, and Tesla—may
be coming to an end, especially if 2023’s fourth quarter and early January 2024 are any indication. The backdrop of
moderating inflation, normalized interest rates, and a still growing U.S. economy also bolsters our belief that small-cap’s
lengthy stretch in the relative performance wilderness has run its course. We believe moderate economic growth and the more
normalized rate environment should support a broadening of equity market returns where small-caps could be clear beneficiaries,
especially those businesses that have largely sat out the mega-cap performance regime. Even more important is what we’ve
been hearing from management teams—most of whom remain cautiously optimistic about 2024. We see an increasing likelihood,
for example, that the U.S. economy will achieve the much-desired soft landing—which is encouraging for many reasons.
The next few years will see even more tangible benefits of reshoring, the CHIPS Act, and numerous infrastructure projects,
and many of our holdings are poised to benefit from these developments. So, we’re looking forward to what we think should
be a favorable cycle for small-cap stocks.
42
| 2023
Annual Report to Stockholders
| PERFORMANCE
AND PORTFOLIO REVIEW (UNAUDITED) |
SYMBOLS MARKET
PRICE RVT NAV XRVTX |
Performance
Average Annual
Total Return (%) Through 12/31/23
| |
JUL-DEC 20231 |
1-YR |
3-YR |
5-YR |
10-YR |
15-YR |
20-YR |
25-YR |
30-YR |
35-YR |
SINCE
INCEPTION
(11/26/86) |
| RVT
(NAV) |
8.86 |
21.62 |
4.75 |
12.81 |
8.16 |
12.36 |
8.55 |
9.28 |
9.91 |
10.57 |
10.32 |
1
Not Annualized
Market Price
Performance History Since Inception (11/26/86)
Cumulative Performance
of Investment through 12/31/231
| |
1-YR |
5-YR |
10-YR |
15-YR |
20-YR |
SINCE
INCEPTION (11/26/86) |
| RVT |
18.8% |
88.5% |
120.8% |
470.0% |
353.8% |
3099.0% |
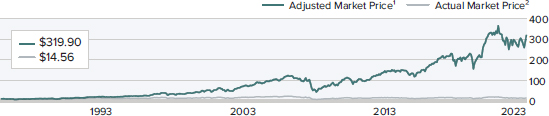
| 1 | Reflects the cumulative performance of an investment made by a stockholder who purchased one share at inception ($10.00 IPO),
reinvested all distributions and fully participated in primary subscriptions of the Fund's rights offerings. |
| 2 | Reflects the actual month-end market price movement of one share as it has traded on the NYSE. |
Morningstar
Style Map™ As of 12/31/23

The
Morningstar Style Map is the Morningstar Style Box™ with the center 75% of fund holdings plotted as the Morningstar
Ownership Zone™. The Morningstar Style Box is designed to reveal a fund’s investment strategy. The Morningstar Ownership Zone provides
detail about a portfolio’s investment style by showing the range of stock sizes and styles. The Ownership Zone is derived
by plotting each stock in the portfolio within the proprietary Morningstar Style Box. Over time, the shape and location of
a fund's ownership zone may vary. See page 65 for additional information.
Value
of $10,000
Invested on 11/26/86 as of 12/31/23 ($)

Top
10 Positions
%
of Net Assets
| Enovis
Corporation |
1.4 |
| Alamos
Gold Cl. A |
1.4 |
| Fabrinet |
1.2 |
| SEI
Investments |
1.1 |
| MKS
Instruments |
1.1 |
| Assured
Guaranty |
1.1 |
| IES
Holdings |
1.0 |
| APi
Group |
1.0 |
| Arcosa |
1.0 |
| Ziff
Davis |
1.0 |
Portfolio
Sector Breakdown
%
of Net Assets
| Industrials |
23.8 |
| Financials |
18.6 |
| Information
Technology |
16.5 |
| Health
Care |
10.8 |
| Consumer
Discretionary |
10.0 |
| Materials |
7.8 |
| Real
Estate |
3.4 |
| Communication
Services |
2.8 |
| Energy |
2.0 |
| Consumer
Staples |
1.9 |
| Utilities |
0.1 |
| Investment
Companies |
0.9 |
| Cash and Cash Equivalents,
Net of |
|
| Outstanding
Line of Credit |
1.4 |
Calendar
Year Total Returns (%)
| YEAR |
RVT |
| 2023 |
21.6 |
| 2022 |
-21.2 |
| 2021 |
20.0 |
| 2020 |
21.9 |
| 2019 |
30.5 |
| 2018 |
-14.4 |
| 2017 |
19.4 |
| 2016 |
26.8 |
| 2015 |
-8.1 |
| 2014 |
0.8 |
| 2013 |
34.1 |
| 2012 |
15.4 |
| 2011 |
-10.1 |
| 2010 |
30.3 |
| 2009 |
44.6 |
Portfolio
Diagnostics
| Fund
Net Assets |
$1,864
million |
| Number
of Holdings |
393 |
| Turnover
Rate |
67% |
| Net
Asset Value |
$16.42 |
| Market
Price |
$14.56 |
| Average
Market Capitalization 1 |
$2,874
million |
| Weighted
Average P/E Ratio 2,3 |
16.0x |
| Weighted
Average P/B Ratio 2 |
2.1x |
| Active
Share 4 |
81% |
| U.S.
Investments (% of Net Assets) |
84.4% |
| Non-U.S.
Investments (% of Net Assets) |
14.2% |
| 1 | Geometric
Average. This weighted calculation uses each portfolio holding’s market cap in a way designed to not skew the effect of very
large or small holdings; instead, it aims to better identify the portfolio’s center, which Royce believes offers a more
accurate measure of average market cap than a simple mean or median. |
| 2 | Harmonic
Average. This weighted calculation evaluates a portfolio as if it were a single stock and measures it overall. It compares the total
market value of the portfolio to the portfolio’s share in the earnings or book value, as the case may be, of its underlying
stocks. |
| 3 | The
Fund’s P/E Ratio calculation excludes companies with zero or negative earnings (20% of portfolio holdings as of 12/31/23). |
| 4 | Active Share
is the sum of the absolute values of the different weightings of each holding in the Fund versus each holding in the benchmark,
divided by two. |
Important
Performance and Risk Information
All performance information reflects past performance, is presented on a total return basis, net of the Fund’s investment
advisory fee, reflects the reinvestment of distributions and does not reflect the deduction of taxes that a shareholder would
pay on Fund distributions or the sale of Fund shares. Past performance is no guarantee of future results. Current performance
may be higher or lower than performance quoted. Returns as of the most recent month-end may be obtained at www.royceinvest.com.
Certain immaterial adjustments were made to the net assets of Royce Value Trust at 12/31/22 for financial reporting purposes,
and as a result the net asset value originally calculated on that date and the total return based on that net asset value
differs from the adjusted net asset value and total return reported in the Financial Highlights. The market price of the Fund’s
shares will fluctuate, so that shares may be worth more or less than their original cost when sold. The Fund invests primarily
in securities of small- and micro-cap companies, which may involve considerably more risk than investing in larger-cap companies.
The Fund’s broadly diversified portfolio does not ensure a profit or guarantee against loss. From time to time, the
Fund may invest a significant portion of its net assets in foreign securities, which may involve political, economic, currency
and other risks not encountered in U.S. investments. Regarding the “Top Contributors” and “Top Detractors”
tables shown above, the sum of all contributors to, and all detractors from, performance for all securities in the portfolio
would approximate the Fund’s year-to-date performance for 2023.
2023
Annual Report to Stockholders |
43
Royce
Value Trust
| Schedule
of Investments | |
| | |
| |
| Common
Stocks – 97.7% | |
| | |
| |
| | |
SHARES | | |
VALUE | |
| | |
| | |
| |
| COMMUNICATION
SERVICES – 2.8% | |
| | |
| |
| DIVERSIFIED
TELECOMMUNICATION SERVICES - 0.9% | |
| | |
| |
| Cogent
Communications Holdings 1 | |
| 37,892 | | |
$ | 2,882,066 | |
| Globalstar 2 | |
| 5,535,611 | | |
| 10,739,085 | |
| IDT
Corporation Cl. B 2 | |
| 74,270 | | |
| 2,531,864 | |
| Liberty
Latin America Cl. C 1,2,3 | |
| 83,228 | | |
| 610,894 | |
| | |
| | | |
| 16,763,909 | |
| ENTERTAINMENT - 0.1% | |
| | | |
| | |
| IMAX
Corporation 2 | |
| 87,950 | | |
| 1,321,009 | |
| INTERACTIVE MEDIA &
SERVICES - 1.5% | |
| | | |
| | |
| Cars.com 2 | |
| 182,200 | | |
| 3,456,334 | |
| QuinStreet 1,2 | |
| 203,754 | | |
| 2,612,126 | |
| Shutterstock | |
| 27,211 | | |
| 1,313,747 | |
| TripAdvisor 2 | |
| 32,499 | | |
| 699,703 | |
| Yelp 2 | |
| 41,272 | | |
| 1,953,817 | |
| Ziff
Davis 1,2,3 | |
| 274,498 | | |
| 18,443,521 | |
| | |
| | | |
| 28,479,248 | |
| MEDIA - 0.3% | |
| | | |
| | |
| AMC
Networks Cl. A 2 | |
| 37,495 | | |
| 704,531 | |
| John
Wiley & Sons Cl. A | |
| 41,908 | | |
| 1,330,160 | |
| TechTarget 1,2 | |
| 44,518 | | |
| 1,551,898 | |
| Thryv
Holdings 2 | |
| 78,358 | | |
| 1,594,585 | |
| | |
| | | |
| 5,181,174 | |
| WIRELESS TELECOMMUNICATION
SERVICES - 0.0% | |
| | | |
| | |
| †Gogo
2 | |
| 63,033 | | |
| 638,524 | |
| Total
(Cost $54,571,719) | |
| | | |
| 52,383,864 | |
| | |
| | | |
| | |
| CONSUMER
DISCRETIONARY – 10.0% | |
| | | |
| | |
| AUTOMOBILE COMPONENTS
- 1.6% | |
| | | |
| | |
| †Atmus
Filtration Technologies 2 | |
| 57,800 | | |
| 1,357,722 | |
| Dorman
Products 1,2,3 | |
| 65,324 | | |
| 5,448,675 | |
| Gentex
Corporation 1 | |
| 201,027 | | |
| 6,565,542 | |
| LCI
Industries 1 | |
| 116,890 | | |
| 14,694,242 | |
| Patrick
Industries 1 | |
| 6,981 | | |
| 700,543 | |
| | |
| | | |
| 28,766,724 | |
| DIVERSIFIED CONSUMER
SERVICES - 0.7% | |
| | | |
| | |
| Adtalem
Global Education 2 | |
| 10,330 | | |
| 608,953 | |
| Perdoceo
Education | |
| 100,194 | | |
| 1,759,407 | |
| Stride 2 | |
| 37,049 | | |
| 2,199,599 | |
| Universal
Technical Institute 2 | |
| 639,032 | | |
| 8,000,681 | |
| | |
| | | |
| 12,568,640 | |
| HOTELS, RESTAURANTS &
LEISURE - 0.6% | |
| | | |
| | |
| Bloomin'
Brands 1 | |
| 51,316 | | |
| 1,444,545 | |
| Century
Casinos 2 | |
| 142,462 | | |
| 695,215 | |
| Denny's
Corporation 2 | |
| 266,666 | | |
| 2,901,326 | |
| Lindblad
Expeditions Holdings 2 | |
| 373,700 | | |
| 4,211,599 | |
| Monarch
Casino & Resort | |
| 21,872 | | |
| 1,512,449 | |
| | |
| | | |
| 10,765,134 | |
| HOUSEHOLD DURABLES -
1.4% | |
| | | |
| | |
| Cavco
Industries 1,2,3 | |
| 16,956 | | |
| 5,877,289 | |
| Ethan
Allen Interiors 1 | |
| 61,917 | | |
| 1,976,391 | |
| Helen of Troy 2 | |
| 23,578 | | |
| 2,848,458 | |
| Installed
Building Products | |
| 28,231 | | |
| 5,161,191 | |
| M/I
Homes 2 | |
| 7,296 | | |
| 1,004,951 | |
| Meritage
Homes | |
| 6,092 | | |
| 1,061,226 | |
| Skyline
Champion 2 | |
| 59,772 | | |
| 4,438,669 | |
| TopBuild
Corp. 2 | |
| 5,736 | | |
| 2,146,755 | |
| †Tri
Pointe Homes 2 | |
| 49,565 | | |
| 1,754,601 | |
| | |
| | | |
| 26,269,531 | |
| LEISURE
PRODUCTS - 0.4% | |
| | |
| |
| Brunswick
Corporation 1 | |
| 41,557 | | |
| 4,020,640 | |
| Vista
Outdoor 2 | |
| 20,752 | | |
| 613,637 | |
| YETI
Holdings 2 | |
| 45,385 | | |
| 2,350,035 | |
| | |
| | | |
| 6,984,312 | |
| SPECIALTY RETAIL - 4.2% | |
| | | |
| | |
| Academy
Sports and Outdoors | |
| 88,429 | | |
| 5,836,314 | |
| Advance
Auto Parts | |
| 177,403 | | |
| 10,826,905 | |
| American
Eagle Outfitters | |
| 94,852 | | |
| 2,007,068 | |
| America's
Car-Mart 1,2,3 | |
| 87,700 | | |
| 6,645,029 | |
| Asbury
Automotive Group 2 | |
| 18,116 | | |
| 4,075,557 | |
| AutoCanada 2 | |
| 625,600 | | |
| 10,811,849 | |
| Chico's
FAS 2 | |
| 185,193 | | |
| 1,403,763 | |
| Five
Below 1,2,3 | |
| 9,820 | | |
| 2,093,231 | |
| Monro | |
| 21,576 | | |
| 633,040 | |
| Murphy
USA | |
| 11,187 | | |
| 3,988,837 | |
| ODP
Corporation (The) 2 | |
| 30,135 | | |
| 1,696,600 | |
| 1-800-FLOWERS.COM
Cl. A 2 | |
| 76,000 | | |
| 819,280 | |
| OneWater
Marine Cl. A 2 | |
| 142,853 | | |
| 4,827,003 | |
| Signet
Jewelers | |
| 94,874 | | |
| 10,176,185 | |
| †Valvoline
2 | |
| 348,652 | | |
| 13,102,342 | |
| | |
| | | |
| 78,943,003 | |
| TEXTILES, APPAREL &
LUXURY GOODS - 1.1% | |
| | | |
| | |
| Carter's | |
| 45,063 | | |
| 3,374,768 | |
| G-III
Apparel Group 2 | |
| 48,507 | | |
| 1,648,268 | |
| Movado
Group | |
| 90,156 | | |
| 2,718,203 | |
| Ralph
Lauren Cl. A | |
| 38,700 | | |
| 5,580,540 | |
| Steven
Madden | |
| 185,354 | | |
| 7,784,868 | |
| | |
| | | |
| 21,106,647 | |
| Total
(Cost $141,603,253) | |
| | | |
| 185,403,991 | |
| | |
| | | |
| | |
| CONSUMER
STAPLES – 1.9% | |
| | | |
| | |
| CONSUMER STAPLES DISTRIBUTION
& RETAIL - 0.1% | |
| | | |
| | |
| PriceSmart | |
| 25,933 | | |
| 1,965,203 | |
| FOOD PRODUCTS - 1.2% | |
| | | |
| | |
| Freshpet 1,2,3 | |
| 26,000 | | |
| 2,255,760 | |
| John
B. Sanfilippo & Son | |
| 18,633 | | |
| 1,919,944 | |
| Nomad
Foods 1,2 | |
| 486,865 | | |
| 8,252,362 | |
| Seneca
Foods Cl. A 2 | |
| 183,460 | | |
| 9,620,642 | |
| | |
| | | |
| 22,048,708 | |
| HOUSEHOLD PRODUCTS -
0.0% | |
| | | |
| | |
| Central
Garden & Pet 2 | |
| 13,569 | | |
| 679,943 | |
| PERSONAL CARE PRODUCTS
- 0.5% | |
| | | |
| | |
| Inter
Parfums 1 | |
| 60,196 | | |
| 8,668,826 | |
| USANA
Health Sciences 2 | |
| 23,616 | | |
| 1,265,817 | |
| | |
| | | |
| 9,934,643 | |
| TOBACCO - 0.1% | |
| | | |
| | |
| Vector
Group | |
| 116,570 | | |
| 1,314,910 | |
| Total
(Cost $24,589,796) | |
| | | |
| 35,943,407 | |
| | |
| | | |
| | |
| ENERGY – 2.0% | |
| | | |
| | |
| ENERGY EQUIPMENT &
SERVICES - 1.1% | |
| | | |
| | |
| Bristow
Group 1,2 | |
| 219,464 | | |
| 6,204,247 | |
| Core
Laboratories 1 | |
| 99,369 | | |
| 1,754,857 | |
| Pason
Systems | |
| 893,858 | | |
| 10,908,029 | |
| Patterson-UTI
Energy | |
| 23,275 | | |
| 251,370 | |
| RPC | |
| 64,137 | | |
| 466,917 | |
| †U.S.
Silica Holdings 2 | |
| 81,400 | | |
| 920,634 | |
| | |
| | | |
| 20,506,054 | |
| 44 |
2023 Annual Report to Stockholders |
THE ACCOMPANYING
NOTES ARE AN INTEGRAL PART OF THESE FINANCIAL STATEMENTS |
December
31, 2023
| Schedule
of Investments (continued) | |
| | |
| |
| |
| | |
| |
| | |
SHARES | | |
VALUE | |
| | |
| | |
| |
| ENERGY
(continued) | |
| | |
| |
| OIL,
GAS & CONSUMABLE FUELS - 0.9% | |
| | |
| |
| CONSOL
Energy 1 | |
| 17,965 | | |
$ | 1,806,022 | |
| †CVR
Energy | |
| 27,207 | | |
| 824,372 | |
| Dorchester
Minerals L.P. 1,3 | |
| 279,148 | | |
| 8,885,281 | |
| Northern
Oil and Gas | |
| 4,295 | | |
| 159,216 | |
| †Par Pacific
Holdings 2 | |
| 20,451 | | |
| 743,803 | |
| REX
American Resources 2 | |
| 23,384 | | |
| 1,106,063 | |
| World
Kinect 1 | |
| 112,613 | | |
| 2,565,324 | |
| | |
| | | |
| 16,090,081 | |
| Total
(Cost $27,957,803) | |
| | | |
| 36,596,135 | |
| | |
| | | |
| | |
| FINANCIALS – 18.6% | |
| | | |
| | |
| BANKS - 4.6% | |
| | | |
| | |
| †Atlantic
Union Bankshares | |
| 25,000 | | |
| 913,500 | |
| Axos
Financial 2 | |
| 27,164 | | |
| 1,483,154 | |
| †Bancorp
(The) 2 | |
| 25,000 | | |
| 964,000 | |
| Bank
of N.T. Butterfield & Son 1 | |
| 241,503 | | |
| 7,730,511 | |
| BankUnited 1 | |
| 306,961 | | |
| 9,954,745 | |
| †Cathay
General Bancorp | |
| 21,889 | | |
| 975,593 | |
| Central
Pacific Financial | |
| 31,637 | | |
| 622,616 | |
| Customers
Bancorp 2 | |
| 57,093 | | |
| 3,289,699 | |
| Dime
Community Bancshares | |
| 89,026 | | |
| 2,397,470 | |
| Eagle
Bancorp | |
| 53,319 | | |
| 1,607,035 | |
| †First
Bancorp | |
| 19,000 | | |
| 703,190 | |
| First
Bancshares (The) | |
| 97,112 | | |
| 2,848,295 | |
| First
Citizens BancShares Cl. A | |
| 8,087 | | |
| 11,475,210 | |
| Fulton
Financial | |
| 117,954 | | |
| 1,941,523 | |
| Hanmi
Financial | |
| 186,925 | | |
| 3,626,345 | |
| HBT
Financial | |
| 40,400 | | |
| 852,844 | |
| †Hingham
Institution for Savings | |
| 16,526 | | |
| 3,212,654 | |
| Home
BancShares | |
| 197,617 | | |
| 5,005,639 | |
| †Hope
Bancorp | |
| 223,038 | | |
| 2,694,299 | |
| Independent
Bank Group | |
| 109,141 | | |
| 5,553,094 | |
| OFG
Bancorp | |
| 39,357 | | |
| 1,475,100 | |
| Origin
Bancorp | |
| 73,207 | | |
| 2,603,973 | |
| Preferred
Bank | |
| 26,255 | | |
| 1,917,928 | |
| †S&T
Bancorp | |
| 22,616 | | |
| 755,827 | |
| †Valley
National Bancorp | |
| 221,668 | | |
| 2,407,315 | |
| †Veritex
Holdings | |
| 79,691 | | |
| 1,854,410 | |
| †WaFd | |
| 74,044 | | |
| 2,440,490 | |
| Western
Alliance Bancorp 1,3 | |
| 73,632 | | |
| 4,844,249 | |
| | |
| | | |
| 86,150,708 | |
| CAPITAL MARKETS - 5.8% | |
| | | |
| | |
| Ares
Management Cl. A 1 | |
| 43,500 | | |
| 5,173,020 | |
| Artisan
Partners Asset Management Cl. A 1 | |
| 271,351 | | |
| 11,988,287 | |
| Blue
Owl Capital Cl. A | |
| 55,900 | | |
| 832,910 | |
| Bolsa
Mexicana de Valores | |
| 1,723,106 | | |
| 3,562,703 | |
| BrightSphere
Investment Group | |
| 52,538 | | |
| 1,006,628 | |
| Donnelley
Financial Solutions 1,2,3 | |
| 35,500 | | |
| 2,214,135 | |
| Evercore
Cl. A | |
| 10,538 | | |
| 1,802,525 | |
| GCM
Grosvenor Cl. A | |
| 801,494 | | |
| 7,181,386 | |
| Houlihan
Lokey Cl. A 1 | |
| 58,554 | | |
| 7,021,210 | |
| Lazard 1 | |
| 107,967 | | |
| 3,757,252 | |
| MarketWise
Cl. A | |
| 500,000 | | |
| 1,365,000 | |
| Morningstar 1 | |
| 21,056 | | |
| 6,027,069 | |
| Onex
Corporation | |
| 168,900 | | |
| 11,794,511 | |
| SEI
Investments 1 | |
| 328,494 | | |
| 20,875,794 | |
| Sprott | |
| 230,880 | | |
| 7,820,003 | |
| Tel
Aviv Stock Exchange | |
| 221,179 | | |
| 1,176,591 | |
| TMX
Group | |
| 441,150 | | |
| 10,670,433 | |
| Tradeweb
Markets Cl. A | |
| 30,815 | | |
| 2,800,467 | |
| | |
| | | |
| 107,069,924 | |
| CONSUMER FINANCE - 0.6% | |
| | | |
| | |
| Bread
Financial Holdings 1,3 | |
| 100,143 | | |
| 3,298,710 | |
| Encore
Capital Group 1,2,3 | |
| 25,000 | | |
| 1,268,750 | |
| Enova
International 2 | |
| 71,177 | | |
| 3,940,359 | |
| PRA
Group 2 | |
| 104,469 | | |
| 2,737,088 | |
| PROG
Holdings 2 | |
| 19,871 | | |
| 614,212 | |
| | |
| | | |
| 11,859,119 | |
| FINANCIAL SERVICES -
1.8% | |
| | | |
| | |
| Banco
Latinoamericano de Comercio Exterior
Cl. E | |
| 73,446 | | |
| 1,817,054 | |
| †Burford
Capital | |
| 175,000 | | |
| 2,730,000 | |
| Compass
Diversified Holdings | |
| 124,976 | | |
| 2,805,711 | |
| ECN
Capital | |
| 888,800 | | |
| 2,012,302 | |
| EVERTEC | |
| 44,843 | | |
| 1,835,873 | |
| NewtekOne | |
| 336,358 | | |
| 4,641,740 | |
| NMI
Holdings Cl. A 2 | |
| 144,671 | | |
| 4,293,835 | |
| Radian
Group | |
| 95,986 | | |
| 2,740,400 | |
| Repay
Holdings Cl. A 2 | |
| 787,331 | | |
| 6,723,807 | |
| Shift4
Payments Cl. A 2 | |
| 50,000 | | |
| 3,717,000 | |
| Waterloo
Investment Holdings 2,4 | |
| 2,972,000 | | |
| 832,160 | |
| | |
| | | |
| 34,149,882 | |
| INSURANCE - 5.8% | |
| | | |
| | |
| American
Equity Investment Life Holding Company 1,2 | |
| 27,031 | | |
| 1,508,330 | |
| Assured
Guaranty | |
| 270,123 | | |
| 20,213,304 | |
| Axis
Capital Holdings | |
| 49,834 | | |
| 2,759,309 | |
| Berkley
(W.R.) | |
| 94,578 | | |
| 6,688,556 | |
| E-L
Financial | |
| 21,650 | | |
| 17,126,873 | |
| Employers
Holdings | |
| 15,188 | | |
| 598,407 | |
| Erie
Indemnity Cl. A | |
| 22,600 | | |
| 7,569,192 | |
| First
American Financial | |
| 39,441 | | |
| 2,541,578 | |
| Genworth
Financial Cl. A 2 | |
| 491,552 | | |
| 3,283,567 | |
| Hagerty
Cl. A 2 | |
| 460,700 | | |
| 3,593,460 | |
| International
General Insurance Holdings | |
| 557,557 | | |
| 7,181,334 | |
| ProAssurance
Corporation 1,3 | |
| 298,675 | | |
| 4,118,728 | |
| RenaissanceRe
Holdings | |
| 32,902 | | |
| 6,448,792 | |
| RLI
Corp. 1 | |
| 61,529 | | |
| 8,190,741 | |
| Safety
Insurance Group | |
| 40,945 | | |
| 3,111,411 | |
| Stewart
Information Services 1 | |
| 6,879 | | |
| 404,141 | |
| White
Mountains Insurance Group | |
| 7,725 | | |
| 11,626,202 | |
| | |
| | | |
| 106,963,925 | |
| Total
(Cost $285,444,852) | |
| | | |
| 346,193,558 | |
| | |
| | | |
| | |
| HEALTH
CARE – 10.8% | |
| | | |
| | |
| BIOTECHNOLOGY - 0.8% | |
| | | |
| | |
| Avid
Bioservices 2 | |
| 178,000 | | |
| 1,157,000 | |
| Catalyst
Pharmaceuticals 2 | |
| 250,097 | | |
| 4,204,131 | |
| Dynavax
Technologies 2 | |
| 149,656 | | |
| 2,092,191 | |
| †Halozyme
Therapeutics 2 | |
| 29,353 | | |
| 1,084,887 | |
| Ironwood
Pharmaceuticals Cl. A 2 | |
| 288,637 | | |
| 3,302,007 | |
| United
Therapeutics 2 | |
| 10,000 | | |
| 2,198,900 | |
| Vir
Biotechnology 2 | |
| 102,900 | | |
| 1,035,174 | |
| | |
| | | |
| 15,074,290 | |
| HEALTH CARE EQUIPMENT
& SUPPLIES - 4.6% | |
| | | |
| | |
| †Alphatec
Holdings 2 | |
| 99,914 | | |
| 1,509,700 | |
| THE ACCOMPANYING NOTES ARE AN INTEGRAL PART OF THESE FINANCIAL STATEMENTS |
2023 Annual Report to Stockholders |
45 |
Royce
Value Trust
| Schedule
of Investments (continued) | |
| | |
| |
| |
| | |
| |
| | |
SHARES | | |
VALUE | |
| | |
| | |
| |
| HEALTH
CARE (continued) | |
| | |
| |
| HEALTH
CARE EQUIPMENT & SUPPLIES (continued) | |
| | |
| |
| Atrion
Corporation | |
| 1,100 | | |
$ | 416,669 | |
| Embecta
Corp. | |
| 107,542 | | |
| 2,035,770 | |
| Enovis
Corporation 2 | |
| 478,633 | | |
| 26,813,021 | |
| Haemonetics
Corporation 2 | |
| 201,205 | | |
| 17,205,039 | |
| Inspire
Medical Systems 2 | |
| 18,467 | | |
| 3,756,742 | |
| †Insulet
Corporation 2 | |
| 20,643 | | |
| 4,479,118 | |
| Integer
Holdings Corporation 1,2,3 | |
| 75,700 | | |
| 7,500,356 | |
| OraSure
Technologies 2 | |
| 56,649 | | |
| 464,522 | |
| QuidelOrtho
Corporation 2 | |
| 10,000 | | |
| 737,000 | |
| Surmodics 1,2 | |
| 161,000 | | |
| 5,852,350 | |
| TransMedics
Group 2 | |
| 160,500 | | |
| 12,668,265 | |
| UFP
Technologies 2 | |
| 9,821 | | |
| 1,689,605 | |
| | |
| | | |
| 85,128,157 | |
| HEALTH CARE PROVIDERS
& SERVICES - 1.4% | |
| | | |
| | |
| Addus
HomeCare 1,2 | |
| 12,978 | | |
| 1,205,007 | |
| AMN
Healthcare Services 1,2 | |
| 49,469 | | |
| 3,704,239 | |
| CorVel
Corporation 2 | |
| 1,719 | | |
| 424,954 | |
| Cross
Country Healthcare 2 | |
| 127,100 | | |
| 2,877,544 | |
| NeoGenomics 2 | |
| 41,750 | | |
| 675,515 | |
| Pediatrix
Medical Group 2 | |
| 121,432 | | |
| 1,129,318 | |
| †Premier
Cl. A | |
| 38,432 | | |
| 859,339 | |
| †Privia
Health Group 2 | |
| 299,400 | | |
| 6,895,182 | |
| Select
Medical Holdings | |
| 95,900 | | |
| 2,253,650 | |
| U.S.
Physical Therapy | |
| 62,300 | | |
| 5,802,622 | |
| | |
| | | |
| 25,827,370 | |
| HEALTH CARE TECHNOLOGY
- 0.4% | |
| | | |
| | |
| Doximity
Cl. A 2 | |
| 63,910 | | |
| 1,792,036 | |
| Simulations
Plus 1 | |
| 80,656 | | |
| 3,609,356 | |
| Veradigm
2 | |
| 163,353 | | |
| 1,713,573 | |
| | |
| | | |
| 7,114,965 | |
| LIFE SCIENCES TOOLS &
SERVICES - 2.6% | |
| | | |
| | |
| Azenta
1,2,3 | |
| 237,743 | | |
| 15,486,579 | |
| BioLife
Solutions 2 | |
| 240,300 | | |
| 3,904,875 | |
| Bio-Rad
Laboratories Cl. A 2 | |
| 5,366 | | |
| 1,732,628 | |
| Bio-Techne 1 | |
| 89,612 | | |
| 6,914,462 | |
| Charles
River Laboratories International 2 | |
| 7,420 | | |
| 1,754,088 | |
| Harvard
Bioscience 2 | |
| 102,050 | | |
| 545,967 | |
| Medpace
Holdings 2 | |
| 5,575 | | |
| 1,708,905 | |
| Mesa
Laboratories 1 | |
| 82,033 | | |
| 8,594,597 | |
| Revvity | |
| 15,121 | | |
| 1,652,877 | |
| Stevanato
Group | |
| 246,879 | | |
| 6,737,328 | |
| | |
| | | |
| 49,032,306 | |
| PHARMACEUTICALS - 1.0% | |
| | | |
| | |
| Collegium
Pharmaceutical 2 | |
| 35,038 | | |
| 1,078,470 | |
| Corcept
Therapeutics 2 | |
| 267,800 | | |
| 8,698,144 | |
| Harmony
Biosciences Holdings 1,2,3 | |
| 107,045 | | |
| 3,457,553 | |
| Innoviva 2 | |
| 75,896 | | |
| 1,217,372 | |
| Ligand
Pharmaceuticals 2 | |
| 18,931 | | |
| 1,352,052 | |
| Prestige
Consumer Healthcare 2 | |
| 56,300 | | |
| 3,446,686 | |
| | |
| | | |
| 19,250,277 | |
| Total
(Cost $181,806,281) | |
| | | |
| 201,427,365 | |
| | |
| | | |
| | |
| INDUSTRIALS – 23.8% | |
| | | |
| | |
| AEROSPACE & DEFENSE
- 1.3% | |
| | | |
| | |
| HEICO
Corporation 1 | |
| 31,030 | | |
| 5,550,336 | |
| HEICO
Corporation Cl. A 1 | |
| 36,533 | | |
| 5,203,761 | |
| Leonardo
DRS 2 | |
| 397,627 | | |
| 7,968,445 | |
| Magellan
Aerospace | |
| 943,092 | | |
| 5,587,164 | |
| National
Presto Industries | |
| 9,773 | | |
| 784,577 | |
| | |
| | | |
| 25,094,283 | |
| AIR FREIGHT & LOGISTICS
- 0.4% | |
| | | |
| | |
| Forward
Air 1 | |
| 71,915 | | |
| 4,521,296 | |
| Hub
Group Cl. A 2 | |
| 24,947 | | |
| 2,293,627 | |
| | |
| | | |
| 6,814,923 | |
| BUILDING PRODUCTS - 2.1% | |
| | | |
| | |
| Advanced
Drainage Systems | |
| 50,005 | | |
| 7,032,703 | |
| American
Woodmark 2 | |
| 22,458 | | |
| 2,085,225 | |
| AZZ 1,3 | |
| 20,000 | | |
| 1,161,800 | |
| Carlisle
Companies | |
| 13,700 | | |
| 4,280,291 | |
| CSW
Industrials | |
| 45,000 | | |
| 9,333,450 | |
| Gibraltar
Industries 2 | |
| 7,575 | | |
| 598,274 | |
| †Janus
International Group 2 | |
| 71,505 | | |
| 933,140 | |
| Quanex
Building Products | |
| 23,878 | | |
| 729,951 | |
| Simpson
Manufacturing 1 | |
| 22,600 | | |
| 4,474,348 | |
| UFP
Industries | |
| 63,024 | | |
| 7,912,663 | |
| | |
| | | |
| 38,541,845 | |
| COMMERCIAL SERVICES &
SUPPLIES - 1.9% | |
| | | |
| | |
| ACV
Auctions Cl. A 2 | |
| 98,800 | | |
| 1,496,820 | |
| Brady
Corporation Cl. A 1 | |
| 265,192 | | |
| 15,564,118 | |
| CompX
International Cl. A 1 | |
| 183,197 | | |
| 4,631,220 | |
| Driven
Brands Holdings 2 | |
| 168,783 | | |
| 2,406,846 | |
| GFL
Environmental 1,3 | |
| 76,850 | | |
| 2,652,094 | |
| Healthcare
Services Group 2 | |
| 349,174 | | |
| 3,620,934 | |
| †Montrose
Environmental Group 2 | |
| 74,993 | | |
| 2,409,525 | |
| RB
Global 1 | |
| 31,617 | | |
| 2,114,861 | |
| | |
| | | |
| 34,896,418 | |
| CONSTRUCTION & ENGINEERING
- 4.5% | |
| | | |
| | |
| APi
Group 1,2,3 | |
| 546,800 | | |
| 18,919,280 | |
| Arcosa
1 | |
| 228,834 | | |
| 18,910,842 | |
| Comfort
Systems USA 1 | |
| 21,089 | | |
| 4,337,374 | |
| EMCOR
Group | |
| 14,441 | | |
| 3,111,025 | |
| IES
Holdings 1,2 | |
| 242,045 | | |
| 19,174,805 | |
| MasTec 2 | |
| 78,980 | | |
| 5,980,365 | |
| Northwest
Pipe 2 | |
| 36,049 | | |
| 1,090,843 | |
| Valmont
Industries 1 | |
| 37,112 | | |
| 8,666,023 | |
| WillScot
Mobile Mini Holdings Corp. 2 | |
| 95,312 | | |
| 4,241,384 | |
| | |
| | | |
| 84,431,941 | |
| ELECTRICAL EQUIPMENT
- 1.8% | |
| | | |
| | |
| Atkore 2 | |
| 24,300 | | |
| 3,888,000 | |
| Encore
Wire | |
| 23,685 | | |
| 5,059,116 | |
| GrafTech
International | |
| 48,796 | | |
| 106,863 | |
| LSI
Industries | |
| 496,657 | | |
| 6,992,931 | |
| Powell
Industries | |
| 69,726 | | |
| 6,163,778 | |
| Preformed
Line Products | |
| 41,020 | | |
| 5,490,937 | |
| †Vertiv
Holdings Cl. A | |
| 122,250 | | |
| 5,871,668 | |
| | |
| | | |
| 33,573,293 | |
| GROUND TRANSPORTATION
- 0.7% | |
| | | |
| | |
| ArcBest
Corporation | |
| 13,718 | | |
| 1,649,041 | |
| Knight-Swift
Transportation Holdings | |
| 8,388 | | |
| 483,568 | |
| Landstar
System 1 | |
| 55,808 | | |
| 10,807,219 | |
| | |
| | | |
| 12,939,828 | |
| MACHINERY - 6.2% | |
| | | |
| | |
| Chart
Industries 2 | |
| 5,436 | | |
| 741,090 | |
| Douglas
Dynamics | |
| 104,064 | | |
| 3,088,620 | |
| Enpro | |
| 64,311 | | |
| 10,080,106 | |
| ESAB
Corporation 1 | |
| 152,470 | | |
| 13,206,951 | |
| 46 | 2023 Annual Report to Stockholders |
THE ACCOMPANYING NOTES ARE AN INTEGRAL PART OF THESE
FINANCIAL STATEMENTS |
December
31, 2023
| Schedule
of Investments (continued) | |
| | |
| |
| |
| | |
| |
| | |
SHARES | | |
VALUE | |
| | |
| | |
| |
| INDUSTRIALS
(continued) | |
| | |
| |
| MACHINERY
(continued) | |
| | |
| |
| ESCO
Technologies 1 | |
| 108,139 | | |
$ | 12,655,507 | |
| Helios
Technologies 1 | |
| 44,900 | | |
| 2,036,215 | |
| John
Bean Technologies 1 | |
| 124,095 | | |
| 12,341,248 | |
| Kadant 1 | |
| 51,384 | | |
| 14,403,449 | |
| Lincoln
Electric Holdings 1 | |
| 23,900 | | |
| 5,197,294 | |
| Lindsay
Corporation 1 | |
| 70,900 | | |
| 9,157,444 | |
| Miller
Industries | |
| 70,615 | | |
| 2,986,308 | |
| Mueller
Industries 1 | |
| 72,543 | | |
| 3,420,403 | |
| RBC
Bearings 2 | |
| 22,110 | | |
| 6,298,918 | |
| Tennant
Company 1 | |
| 80,500 | | |
| 7,461,545 | |
| Titan
International 2 | |
| 116,490 | | |
| 1,733,371 | |
| Wabash
National | |
| 22,701 | | |
| 581,600 | |
| Watts
Water Technologies Cl. A 1 | |
| 46,400 | | |
| 9,666,976 | |
| | |
| | | |
| 115,057,045 | |
| MARINE TRANSPORTATION
- 0.1% | |
| | | |
| | |
| Kirby
Corporation 2 | |
| 16,026 | | |
| 1,257,720 | |
| Matson | |
| 8,586 | | |
| 941,026 | |
| | |
| | | |
| 2,198,746 | |
| PASSENGER AIRLINES -
0.1% | |
| | | |
| | |
| Sun
Country Airlines Holdings 2 | |
| 88,126 | | |
| 1,386,222 | |
| PROFESSIONAL SERVICES
- 1.9% | |
| | | |
| | |
| CBIZ 1,2 | |
| 54,465 | | |
| 3,408,964 | |
| Dun
& Bradstreet Holdings | |
| 297,912 | | |
| 3,485,570 | |
| Forrester
Research 1,2,3 | |
| 286,922 | | |
| 7,692,379 | |
| Heidrick
& Struggles International | |
| 17,490 | | |
| 516,480 | |
| Jacobs
Solutions 1 | |
| 27,500 | | |
| 3,569,500 | |
| KBR 1 | |
| 131,069 | | |
| 7,262,533 | |
| Korn
Ferry 1 | |
| 136,530 | | |
| 8,103,056 | |
| Resources
Connection | |
| 93,610 | | |
| 1,326,454 | |
| TrueBlue
2 | |
| 26,363 | | |
| 404,408 | |
| | |
| | | |
| 35,769,344 | |
| TRADING COMPANIES &
DISTRIBUTORS - 2.8% | |
| | | |
| | |
| Air
Lease Cl. A 1 | |
| 308,486 | | |
| 12,937,903 | |
| Applied
Industrial Technologies | |
| 31,957 | | |
| 5,518,654 | |
| Boise
Cascade 1 | |
| 20,019 | | |
| 2,589,658 | |
| †Core
& Main Cl. A 1,2,3 | |
| 46,714 | | |
| 1,887,713 | |
| Distribution
Solutions Group 2 | |
| 98,956 | | |
| 3,123,051 | |
| FTAI
Aviation | |
| 187,009 | | |
| 8,677,218 | |
| GMS 2 | |
| 9,744 | | |
| 803,198 | |
| Hudson
Technologies 2 | |
| 116,442 | | |
| 1,570,802 | |
| MSC
Industrial Direct Cl. A | |
| 14,383 | | |
| 1,456,423 | |
| Transcat
2 | |
| 130,431 | | |
| 14,260,021 | |
| | |
| | | |
| 52,824,641 | |
| Total
(Cost $271,839,205) | |
| | | |
| 443,528,529 | |
| | |
| | | |
| | |
| INFORMATION
TECHNOLOGY – 16.5% | |
| | | |
| | |
| COMMUNICATIONS EQUIPMENT
- 0.6% | |
| | | |
| | |
| Calix 1,2 | |
| 46,530 | | |
| 2,032,896 | |
| Digi
International 2 | |
| 38,250 | | |
| 994,500 | |
| Extreme
Networks 2 | |
| 62,933 | | |
| 1,110,138 | |
| Harmonic 2 | |
| 259,835 | | |
| 3,388,248 | |
| NetScout
Systems 2 | |
| 116,730 | | |
| 2,562,224 | |
| | |
| | | |
| 10,088,006 | |
| ELECTRONIC EQUIPMENT,
INSTRUMENTS & COMPONENTS - 7.2% | |
| | | |
| | |
| Cognex
Corporation 1 | |
| 246,500 | | |
| 10,288,910 | |
| Coherent 1,2 | |
| 174,520 | | |
| 7,596,856 | |
| Crane
NXT | |
| 143,300 | | |
| 8,149,471 | |
| CTS
Corporation | |
| 21,992 | | |
| 961,930 | |
| Fabrinet
1,2 | |
| 119,608 | | |
| 22,764,991 | |
| FARO
Technologies 1,2,3 | |
| 228,848 | | |
| 5,155,945 | |
| Insight
Enterprises 2 | |
| 9,623 | | |
| 1,705,099 | |
| IPG
Photonics 2 | |
| 57,741 | | |
| 6,267,208 | |
| Kimball
Electronics 2 | |
| 119,263 | | |
| 3,214,138 | |
| Littelfuse 1 | |
| 23,935 | | |
| 6,404,049 | |
| Luna
Innovations 2 | |
| 86,450 | | |
| 574,893 | |
| Methode
Electronics | |
| 113,147 | | |
| 2,571,831 | |
| Mirion
Technologies Cl. A 2 | |
| 225,000 | | |
| 2,306,250 | |
| †NAPCO
Security Technologies | |
| 15,000 | | |
| 513,750 | |
| PAR
Technology 1,2,3 | |
| 379,239 | | |
| 16,512,066 | |
| PC
Connection | |
| 22,999 | | |
| 1,545,763 | |
| Richardson
Electronics | |
| 433,407 | | |
| 5,785,983 | |
| Rogers
Corporation 2 | |
| 87,268 | | |
| 11,525,485 | |
| Sanmina
Corporation 2 | |
| 13,994 | | |
| 718,872 | |
| Teledyne
Technologies 2 | |
| 9,660 | | |
| 4,311,161 | |
| TTM
Technologies 1,2,3 | |
| 337,529 | | |
| 5,336,334 | |
| Vishay
Precision Group 2 | |
| 109,919 | | |
| 3,744,940 | |
| Vontier
Corporation | |
| 170,889 | | |
| 5,904,215 | |
| | |
| | | |
| 133,860,140 | |
| IT SERVICES - 0.8% | |
| | | |
| | |
| Hackett
Group (The) 1 | |
| 405,798 | | |
| 9,240,020 | |
| Kyndryl
Holdings 2 | |
| 303,664 | | |
| 6,310,138 | |
| | |
| | | |
| 15,550,158 | |
| SEMICONDUCTORS &
SEMICONDUCTOR EQUIPMENT - 5.8% | |
| | | |
| | |
| Axcelis
Technologies 2 | |
| 21,537 | | |
| 2,793,133 | |
| Camtek 2 | |
| 26,300 | | |
| 1,824,694 | |
| Cirrus
Logic 1,2 | |
| 87,810 | | |
| 7,304,914 | |
| Cohu 1,2,3 | |
| 48,082 | | |
| 1,701,622 | |
| Diodes 1,2,3 | |
| 84,717 | | |
| 6,821,413 | |
| FormFactor 2 | |
| 226,824 | | |
| 9,460,829 | |
| Impinj 1,2,3 | |
| 173,889 | | |
| 15,655,227 | |
| indie
Semiconductor Cl. A 2 | |
| 80,000 | | |
| 648,800 | |
| Kulicke
& Soffa Industries 1 | |
| 49,774 | | |
| 2,723,633 | |
| MaxLinear 2 | |
| 148,212 | | |
| 3,522,999 | |
| MKS
Instruments | |
| 200,757 | | |
| 20,651,873 | |
| Onto
Innovation 1,2,3 | |
| 83,790 | | |
| 12,811,491 | |
| Photronics 2 | |
| 254,989 | | |
| 7,999,005 | |
| Rambus 2 | |
| 90,701 | | |
| 6,190,343 | |
| Silicon
Motion Technology ADR | |
| 53,907 | | |
| 3,302,882 | |
| SiTime
Corporation 2 | |
| 9,620 | | |
| 1,174,410 | |
| Ultra
Clean Holdings 2 | |
| 103,610 | | |
| 3,537,245 | |
| | |
| | | |
| 108,124,513 | |
| SOFTWARE - 2.1% | |
| | | |
| | |
| Adeia 1 | |
| 10,609 | | |
| 131,446 | |
| Agilysys 1,2 | |
| 26,500 | | |
| 2,247,730 | |
| Alkami
Technology 2 | |
| 118,082 | | |
| 2,863,488 | |
| †BlackLine 2 | |
| 42,629 | | |
| 2,661,755 | |
| Consensus
Cloud Solutions 1,2,3 | |
| 42,952 | | |
| 1,125,772 | |
| Descartes
Systems Group (The) 2 | |
| 5,000 | | |
| 420,300 | |
| InterDigital 1 | |
| 20,125 | | |
| 2,184,367 | |
| JFrog 2 | |
| 200,000 | | |
| 6,922,000 | |
| Progress
Software | |
| 79,199 | | |
| 4,300,506 | |
| †PROS
Holdings 2 | |
| 142,773 | | |
| 5,538,165 | |
| †Q2 Holdings
2 | |
| 46,900 | | |
| 2,035,929 | |
| Sapiens
International | |
| 106,143 | | |
| 3,071,778 | |
| Sprout
Social Cl. A 2 | |
| 10,000 | | |
| 614,400 | |
| Teradata
Corporation 2 | |
| 78,920 | | |
| 3,433,809 | |
| THE ACCOMPANYING NOTES ARE AN INTEGRAL PART OF THESE FINANCIAL STATEMENTS |
2023 Annual Report to Stockholders |
47 |
Royce
Value Trust
| Schedule
of Investments (continued) | |
| | |
| |
| |
| | |
| |
| | |
SHARES | | |
VALUE | |
| | |
| | |
| |
| INFORMATION TECHNOLOGY (continued) | |
| | | |
| | |
| SOFTWARE (continued) | |
| | | |
| | |
| Workiva Cl.
A 2 | |
| 19,959 | | |
$ | 2,026,437 | |
| | |
| | | |
| 39,577,882 | |
| Total (Cost $238,572,743) | |
| | | |
| 307,200,699 | |
| | |
| | | |
| | |
| MATERIALS – 7.8% | |
| | | |
| | |
| CHEMICALS - 3.6% | |
| | | |
| | |
| AdvanSix 1 | |
| 49,580 | | |
| 1,485,417 | |
| Aspen Aerogels 2 | |
| 47,200 | | |
| 744,816 | |
| Element Solutions 1 | |
| 570,202 | | |
| 13,194,475 | |
| Hawkins 1 | |
| 97,521 | | |
| 6,867,429 | |
| Ingevity Corporation
2 | |
| 154,733 | | |
| 7,306,492 | |
| Innospec
1 | |
| 121,538 | | |
| 14,978,343 | |
| NewMarket Corporation | |
| 8,000 | | |
| 4,366,640 | |
| Quaker Houghton | |
| 85,134 | | |
| 18,169,298 | |
| | |
| | | |
| 67,112,910 | |
| CONTAINERS & PACKAGING - 0.3% | |
| | | |
| | |
| Graphic Packaging Holding Company | |
| 101,029 | | |
| 2,490,365 | |
| Silgan Holdings | |
| 64,662 | | |
| 2,925,955 | |
| | |
| | | |
| 5,416,320 | |
| METALS & MINING - 3.3% | |
| | | |
| | |
| Alamos Gold Cl. A | |
| 1,976,000 | | |
| 26,574,333 | |
| Gold Fields ADR | |
| 536,500 | | |
| 7,757,790 | |
| Haynes International
1 | |
| 102,500 | | |
| 5,847,625 | |
| IAMGOLD Corporation 2 | |
| 500,000 | | |
| 1,265,000 | |
| Major Drilling Group
International 2 | |
| 1,496,691 | | |
| 10,403,022 | |
| Materion Corporation | |
| 25,000 | | |
| 3,253,250 | |
| †Olympic Steel | |
| 29,687 | | |
| 1,980,123 | |
| Reliance Steel &
Aluminum 1 | |
| 4,701 | | |
| 1,314,776 | |
| †Ryerson Holding Corporation | |
| 33,381 | | |
| 1,157,653 | |
| TimkenSteel Corporation
2 | |
| 29,423 | | |
| 689,969 | |
| Warrior Met Coal | |
| 13,716 | | |
| 836,265 | |
| | |
| | | |
| 61,079,806 | |
| PAPER & FOREST PRODUCTS - 0.6% | |
| | | |
| | |
| Louisiana-Pacific | |
| 74,997 | | |
| 5,312,037 | |
| Stella-Jones | |
| 83,000 | | |
| 4,830,731 | |
| Sylvamo Corporation 1 | |
| 45,309 | | |
| 2,225,125 | |
| | |
| | | |
| 12,367,893 | |
| Total (Cost $84,035,378) | |
| | | |
| 145,976,929 | |
| | |
| | | |
| | |
| REAL ESTATE – 3.4% | |
| | | |
| | |
| DIVERSIFIED REITS - 0.0% | |
| | | |
| | |
| New York REIT 2,4 | |
| 15,000 | | |
| 163,200 | |
| REAL ESTATE MANAGEMENT & DEVELOPMENT - 3.4% | |
| | | |
| | |
| Colliers International Group | |
| 61,871 | | |
| 7,827,919 | |
| DigitalBridge Group Cl. A | |
| 105,934 | | |
| 1,858,082 | |
| FirstService Corporation | |
| 100,452 | | |
| 16,282,265 | |
| FRP Holdings 1,2 | |
| 67,913 | | |
| 4,270,369 | |
| Kennedy-Wilson Holdings
1 | |
| 889,962 | | |
| 11,017,730 | |
| Marcus & Millichap
1,3 | |
| 285,265 | | |
| 12,460,375 | |
| St. Joe Company (The)
1 | |
| 78,800 | | |
| 4,742,184 | |
| Tejon Ranch 1,2,3 | |
| 313,818 | | |
| 5,397,670 | |
| | |
| | | |
| 63,856,594 | |
| Total (Cost $45,557,382) | |
| | | |
| 64,019,794 | |
| | |
| | | |
| | |
| UTILITIES 0.1% | |
| | | |
| | |
| ELECTRIC UTILITIES - 0.1% | |
| | | |
| | |
| †Otter Tail | |
| 24,388 | | |
| 2,072,248 | |
| | |
| | |
| |
| GAS UTILITIES - 0.0% | |
| | | |
| | |
| Chesapeake Utilities | |
| 557 | | |
| 58,836 | |
| Total (Cost $1,972,129) | |
| | | |
| 2,131,084 | |
| | |
| | | |
| | |
| TOTAL COMMON STOCKS | |
| | | |
| | |
| (Cost $1,357,950,541) | |
| | | |
| 1,820,805,355 | |
| | |
| | | |
| | |
| INVESTMENT COMPANIES – 0.9% | |
| | | |
| | |
| | |
| | | |
| | |
| DIVERSIFIED INVESTMENT COMPANIES –
0.0% | |
| | | |
| | |
| CLOSED-END FUNDS - 0.0% | |
| | | |
| | |
| Eagle Point Credit | |
| 42,054 | | |
| 399,513 | |
| Total (Cost $370,947) | |
| | | |
| 399,513 | |
| | |
| | | |
| | |
| MATERIALS – 0.9% | |
| | | |
| | |
| METALS & MINING - 0.9% | |
| | | |
| | |
| VanEck Junior Gold Miners ETF | |
| 419,426 | | |
| 15,900,440 | |
| Total (Cost $14,964,577) | |
| | | |
| 15,900,440 | |
| | |
| | | |
| | |
| TOTAL INVESTMENT COMPANIES | |
| | | |
| | |
| (Cost $15,335,524) | |
| | | |
| 16,299,953 | |
| | |
| | | |
| | |
| REPURCHASE AGREEMENT – 3.1% | |
| | | |
| | |
Fixed Income Clearing Corporation, 4.75% dated 12/29/23, due 1/2/24, maturity value
$58,855,723 (collateralized by obligations of U.S. Government Agencies, 2.75%
due 2/15/28, valued at $60,001,175) | |
| | | |
| | |
| (Cost $58,824,677) | |
| | | |
| 58,824,677 | |
| | |
| | | |
| | |
| TOTAL INVESTMENTS – 101.7% | |
| | | |
| | |
| (Cost $1,432,110,742) | |
| | | |
| 1,895,929,985 | |
| | |
| | | |
| | |
| LIABILITIES LESS CASH
AND OTHER ASSETS – (1.7)% | |
| | | |
| (31,951,585) | |
| | |
| | | |
| | |
| NET ASSETS
– 100.0% | |
| | | |
$ | 1,863,978,400 | |
| 48 | 2023 Annual Report to Stockholders |
THE ACCOMPANYING NOTES ARE AN INTEGRAL PART OF THESE
FINANCIAL STATEMENTS |
December
31, 2023
ADR – American
Depository Receipt
† New
additions in 2023.
| 1 | All or
a portion of these securities were pledged as collateral in connection with the Fund's
revolving credit agreement as of December 31, 2023. Total market value of pledged securities
as of December 31, 2023, was $72,490,887. |
| 3 | As of
December 31, 2023, a portion of these securities, in the aggregate amount of $31,277,208,
were rehypothecated by BNP Paribas Prime Brokerage International, Limited in connection
with the Fund's revolving credit agreement. See Notes to Financial Statements. |
| 4 | Securities for
which market quotations are not readily available represent 0.1% of net assets. These
securities have been valued at their fair value under procedures approved by the Fund's
Board of Directors. These securities are defined as Level 3 securities due to the use
of significant unobservable inputs in the determination of fair value. See Notes to Financial
Statements. |
Bold
indicates the Fund’s 20 largest equity holdings in terms of December 31, 2023, market value.
TAX
INFORMATION: The cost of total investments for Federal income tax purposes was $1,441,272,627. As of December 31, 2023, net
unrealized appreciation for all securities was $454,657,358 consisting of aggregate gross unrealized appreciation of $536,721,222
and aggregate gross unrealized depreciation of $82,063,864. The primary causes of the difference between book and tax basis cost
are the timing of the recognition of losses on securities sold, investments in publicly traded partnerships, investments in Real
Estate Investment Trusts and mark-to-market of Passive Foreign Investment Companies.
| THE ACCOMPANYING NOTES ARE AN INTEGRAL PART OF THESE FINANCIAL STATEMENTS |
2023 Annual Report to Stockholders |
49 |
| Royce
Value Trust |
December
31, 2023 |
Statement
of Assets and Liabilities
| ASSETS: | |
| |
| Investments at value | |
$ | 1,837,105,308 | |
| Repurchase agreements (at cost
and value) | |
| 58,824,677 | |
| Foreign currency (cost $84,072) | |
| 83,932 | |
| Receivable for investments sold | |
| 6,037,009 | |
| Receivable for dividends and interest | |
| 1,142,982 | |
| Prepaid expenses and other assets | |
| 467,636 | |
| Total
Assets | |
| 1,903,661,544 | |
| LIABILITIES: | |
| | |
| Revolving credit agreement | |
| 35,000,000 | |
| Payable to custodian for cash
overdrawn | |
| 841 | |
| Payable for investments purchased | |
| 2,123,662 | |
| Payable for investment advisory
fee | |
| 2,004,334 | |
| Payable for directors’ fees | |
| 57,280 | |
| Payable for interest expense | |
| 196,506 | |
| Accrued expenses | |
| 300,521 | |
| Total
Liabilities | |
| 39,683,144 | |
| Net
Assets | |
$ | 1,863,978,400 | |
| ANALYSIS OF NET ASSETS: | |
| | |
| Paid-in capital - $0.001 par value per share; 113,509,213
shares outstanding (150,000,000 shares authorized) | |
$ | 1,410,063,074 | |
| Total distributable earnings (loss) | |
| 453,915,326 | |
| Net
Assets (net asset value per share - $16.42) | |
$ | 1,863,978,400 | |
| Investments at identified cost | |
$ | 1,373,286,065 | |
| 50
| 2023 Annual Report to Stockholders |
THE
ACCOMPANYING NOTES ARE AN INTEGRAL PART OF THESE FINANCIAL STATEMENTS |
| Royce
Value Trust |
Year
Ended December 31, 2023 |
Statement
of Operations
| INVESTMENT INCOME: | |
| |
| INCOME: | |
| |
| Dividends | |
$ | 21,482,310 | |
| Foreign withholding tax | |
| (357,731 | ) |
| Interest | |
| 1,150,080 | |
| Rehypothecation income | |
| 5,077 | |
| Total
income | |
| 22,279,736 | |
| EXPENSES: | |
| | |
| Investment advisory fees | |
| 19,911,994 | |
| Interest expense | |
| 2,204,533 | |
| Administrative and office facilities | |
| 831,105 | |
| Stockholder reports | |
| 406,487 | |
| Custody and transfer agent fees | |
| 245,744 | |
| Directors’ fees | |
| 205,231 | |
| Professional fees | |
| 126,425 | |
| Other expenses | |
| 186,256 | |
| Total
expenses | |
| 24,117,775 | |
| Net
investment income (loss) | |
| (1,838,039 | ) |
| REALIZED AND UNREALIZED GAIN (LOSS) ON INVESTMENTS
AND FOREIGN CURRENCY: | |
| | |
| NET REALIZED GAIN (LOSS): | |
| | |
| Investments | |
| 115,080,019 | |
| Foreign currency transactions | |
| (31,328 | ) |
| NET CHANGE IN UNREALIZED APPRECIATION
(DEPRECIATION): | |
| | |
| Investments | |
| 216,432,683 | |
| Other assets and liabilities denominated
in foreign currency | |
| (5,412 | ) |
| Net
realized and unrealized gain (loss) on investments and foreign currency | |
| 331,475,962 | |
| NET
INCREASE (DECREASE) IN NET ASSETS FROM INVESTMENT OPERATIONS | |
$ | 329,637,923 | |
| THE
ACCOMPANYING NOTES ARE AN INTEGRAL PART OF THESE FINANCIAL STATEMENTS |
2023
Annual Report to Stockholders | 51 |
Royce
Value Trust
Statement
of Changes in Net Assets
| | |
YEAR
ENDED 12/31/23 | | |
YEAR
ENDED 12/31/22 | |
| INVESTMENT OPERATIONS: | |
| | | |
| | |
| Net investment income
(loss) | |
$ | (1,838,039 | ) | |
$ | 6,839,471 | |
| Net realized gain (loss) on investments
and foreign currency | |
| 115,048,691 | | |
| 79,828,689 | |
| Net change in unrealized appreciation
(depreciation) on investments and foreign currency | |
| 216,427,271 | | |
| (547,272,242 | ) |
| Net increase
(decrease) in net assets from investment operations | |
| 329,637,923 | | |
| (460,604,082 | ) |
| DISTRIBUTIONS: | |
| | | |
| | |
| Total distributable earnings | |
| (119,069,508 | ) | |
| (121,045,358 | ) |
| Return of capital | |
| – | | |
| (20,627,640 | ) |
| Total distributions | |
| (119,069,508 | ) | |
| (141,672,998 | ) |
| CAPITAL STOCK TRANSACTIONS: | |
| | | |
| | |
| Reinvestment of distributions | |
| 48,230,613 | | |
| 57,586,181 | |
| Total capital
stock transactions | |
| 48,230,613 | | |
| 57,586,181 | |
| Net Increase
(Decrease) In Net Assets | |
| 258,799,028 | | |
| (544,690,899 | ) |
| NET ASSETS: | |
| | | |
| | |
| Beginning of year | |
| 1,605,179,372 | | |
| 2,149,870,271 | |
| End of year | |
$ | 1,863,978,400 | | |
$ | 1,605,179,372 | |
| 52
| 2023 Annual Report to Stockholders |
THE
ACCOMPANYING NOTES ARE AN INTEGRAL PART OF THESE FINANCIAL STATEMENTS |
| Royce
Value Trust |
Year
Ended December 31, 2023 |
Statement
of Cash Flows
| CASH FLOWS FROM OPERATING ACTIVITIES: | |
| |
| Net increase (decrease)
in net assets from investment operations | |
$ | 329,637,923 | |
| Adjustments to reconcile net increase
(decrease) in net assets from investment operations to net cash provided by operating activities: | |
| | |
| Purchases
of long-term investments | |
| (1,158,126,307 | ) |
| Proceeds
from sales and maturities of long-term investments | |
| 1,172,833,103 | |
| Net purchases,
sales and maturities of short-term investments | |
| 57,124,751 | |
| Net (increase)
decrease in dividends and interest receivable and other assets | |
| 199,994 | |
| Net increase
(decrease) in interest expense payable, accrued expenses and other liabilities | |
| 722,564 | |
| Net change
in unrealized appreciation (depreciation) on investments | |
| (216,432,683 | ) |
| Net realized
gain (loss) on investments | |
| (115,080,019 | ) |
| Net cash provided
by operating activities | |
| 70,879,326 | |
| CASH FLOWS FROM FINANCING ACTIVITIES: | |
| | |
| Distributions net of reinvestment
(reinvestment $48,230,613) | |
| (70,838,895 | ) |
| Net cash used
for financing activities | |
| (70,838,895 | ) |
| INCREASE (DECREASE)
IN CASH: | |
| 40,431 | |
| Cash and foreign
currency at beginning of year | |
| 42,660 | |
| Cash and
foreign currency at end of year | |
$ | 83,932 | |
| Cash and foreign
currency overdrawn at end of year | |
$ | 841 | |
Supplemental
disclosure of cash flow information:
For
the year ended December 31, 2023, the Fund paid $2,167,102 in interest expense.
| THE
ACCOMPANYING NOTES ARE AN INTEGRAL PART OF THESE FINANCIAL STATEMENTS |
2023
Annual Report to Stockholders | 53 |
Royce
Value Trust
Financial
Highlights
This
table is presented to show selected data for a share of Common Stock outstanding throughout each period, and to assist stockholders
in evaluating the Fund’s performance for the periods presented.
| | |
YEARS
ENDED |
| | |
| 12/31/23 | |
| 12/31/22 | |
| 12/31/21 | |
| 12/31/20 | |
| 12/31/19 |
| Net Asset Value,
Beginning of Period | |
$ | 14.60 | | |
$ | 20.29 | | |
$ | 18.52 | | |
$ | 16.58 | | |
$ | 13.73 | |
| INVESTMENT OPERATIONS: | |
| | | |
| | | |
| | | |
| | | |
| | |
| Net investment income (loss) | |
| (0.01 | ) | |
| 0.06 | | |
| 0.04 | 1 | |
| 0.03 | | |
| 0.11 | |
| Net realized and unrealized gain
(loss) on investments and foreign currency | |
| 2.96 | | |
| (4.40 | ) | |
| 3.46 | | |
| 3.02 | | |
| 3.90 | |
| Net increase
(decrease) in net assets from investment operations | |
| 2.95 | | |
| (4.34 | ) | |
| 3.50 | | |
| 3.05 | | |
| 4.01 | |
| DISTRIBUTIONS: | |
| | | |
| | | |
| | | |
| | | |
| | |
| Net investment income | |
| – | | |
| (0.12 | ) | |
| (0.02 | ) | |
| (0.09 | ) | |
| (0.11 | ) |
| Net realized gain on investments
and foreign currency | |
| (1.07 | ) | |
| (1.01 | ) | |
| (1.65 | ) | |
| (0.95 | ) | |
| (0.99 | ) |
| Return of capital | |
| – | | |
| (0.19 | ) | |
| – | | |
| – | | |
| – | |
| Total distributions | |
| (1.07 | ) | |
| (1.32 | ) | |
| (1.67 | ) | |
| (1.04 | ) | |
| (1.10 | ) |
| CAPITAL STOCK TRANSACTIONS: | |
| | | |
| | | |
| | | |
| | | |
| | |
| Effect of reinvestment of distributions
by Common Stockholders | |
| (0.06 | ) | |
| (0.03 | ) | |
| (0.06 | ) | |
| (0.07 | ) | |
| (0.06 | ) |
| Total capital
stock transactions | |
| (0.06 | ) | |
| (0.03 | ) | |
| (0.06 | ) | |
| (0.07 | ) | |
| (0.06 | ) |
| Net Asset Value, End of Period | |
$ | 16.42 | | |
$ | 14.60 | | |
$ | 20.29 | | |
$ | 18.52 | | |
$ | 16.58 | |
| Market Value, End of Period | |
$ | 14.56 | | |
$ | 13.26 | | |
$ | 19.59 | | |
$ | 16.14 | | |
$ | 14.77 | |
| TOTAL RETURN:2 | |
| | | |
| | | |
| | | |
| | | |
| | |
| Net Asset Value | |
| 21.71 | % | |
| (21.29 | )% | |
| 19.97 | % | |
| 21.85 | % | |
| 30.46 | % |
| Market Value | |
| 18.83 | % | |
| (25.96 | )% | |
| 32.91 | % | |
| 19.20 | % | |
| 35.23 | % |
| RATIOS BASED ON AVERAGE NET ASSETS: | |
| | | |
| | | |
| | | |
| | | |
| | |
| Investment
advisory fee expense3 | |
| 1.17 | % | |
| 0.74 | % | |
| 1.02 | % | |
| 1.15 | % | |
| 0.49 | % |
| Other operating expenses | |
| 0.24 | % | |
| 0.23 | % | |
| 0.13 | % | |
| 0.19 | % | |
| 0.27 | % |
| Total expenses (net) | |
| 1.41 | % | |
| 0.97 | % | |
| 1.15 | % | |
| 1.34 | % | |
| 0.76 | % |
| Expenses excluding interest expense | |
| 1.29 | % | |
| 0.86 | % | |
| 1.11 | % | |
| 1.26 | % | |
| 0.61 | % |
| Expenses prior to balance credits | |
| 1.41 | % | |
| 0.97 | % | |
| 1.15 | % | |
| 1.34 | % | |
| 0.76 | % |
| Net investment income (loss) | |
| (0.11 | )% | |
| 0.39 | % | |
| 0.21 | %1 | |
| 0.16 | % | |
| 0.69 | % |
| SUPPLEMENTAL DATA: | |
| | | |
| | | |
| | | |
| | | |
| | |
| Net Assets, End of Period (in
thousands) | |
$ | 1,863,978 | | |
$ | 1,605,179 | | |
$ | 2,149,870 | | |
$ | 1,888,606 | | |
$ | 1,628,039 | |
| Portfolio Turnover Rate | |
| 67 | % | |
| 60 | % | |
| 44 | % | |
| 36 | % | |
| 30 | % |
| REVOLVING CREDIT AGREEMENT: | |
| | | |
| | | |
| | | |
| | | |
| | |
| Asset coverage | |
| 5426 | % | |
| 4686 | % | |
| 3171 | % | |
| 2798 | % | |
| 2426 | % |
| Asset coverage per $1,000 | |
$ | 54,257 | | |
$ | 46,862 | | |
$ | 31,712 | | |
$ | 27,980 | | |
$ | 24,258 | |
| 1 | A
special distribution from ECN Capital resulted in an increase in net investment income
(loss) per share of $0.05 and an increase in the ratio of net investment income (loss)
to average net assets of 0.26%. |
| 2 | The
Market Value Total Return is calculated assuming a purchase of Common Stock on the opening
of the first business day and a sale on the closing of the last business day of each
period. Dividends and distributions are assumed for the purposes of this calculation
to be reinvested at prices obtained under the Fund’s Distribution Reinvestment
and Cash Purchase Plan. Net Asset Value Total Return is calculated on the same basis,
except that the Fund’s net asset value is used on the purchase, sale and dividend
reinvestment dates instead of market value. |
| 3 | The
investment advisory fee is calculated based on average net assets over a rolling 60-month
basis, while the above ratios of investment advisory fee expenses are based on the average
net assets over a 12-month basis. |
| 54
| 2023 Annual Report to Stockholders |
THE
ACCOMPANYING NOTES ARE AN INTEGRAL PART OF THESE FINANCIAL STATEMENTS |
Royce
Value Trust
Notes
to Financial Statements
Summary
of Significant Accounting Policies:
Royce
Value Trust, Inc. (the “Fund”), is a diversified closed-end investment company that was incorporated under the laws
of the State of Maryland on July 1, 1986. The Fund commenced operations on November 26, 1986.
The
preparation of financial statements in conformity with accounting principles generally accepted in the United States of America
requires management to make estimates and assumptions that affect the reported amounts of assets and liabilities and the disclosure
of contingent assets and liabilities at the date of the financial statements and the reported amounts of income and expenses during
the reporting period. Actual results could differ from those estimates.
The
Fund is an investment company registered under the Investment Company Act of 1940 (the “1940 Act”) and accordingly
follows the investment company accounting and reporting guidance of the Financial Accounting Standards Board (FASB) Accounting
Standard Codification Topic 946 “Financial Services-Investment Companies.”
Royce
& Associates, LP, the Fund’s investment adviser, is a majority-owned subsidiary of Franklin Resources, Inc. and primarily
conducts business using the name Royce Investment Partners (“Royce”).
VALUATION
OF INVESTMENTS:
Portfolio
securities held by the Fund are valued as of the close of trading on the New York Stock Exchange (“NYSE”) (generally
4:00 p.m. Eastern time) on the valuation date. Investments in money market funds are valued at net asset value per share. Values
for non-U.S. dollar denominated equity securities are converted to U.S. dollars daily based upon prevailing foreign currency exchange
rates as quoted by a major bank.
Portfolio
securities that are listed on an exchange or Nasdaq, or traded on OTC Market Group Inc.’s OTC Link ATS or other alternative
trading system, are valued: (i) on the basis of their last reported sales prices or official closing prices, as applicable, on
a valuation date; or (ii) at their highest reported bid prices in the event such equity securities did not trade on a valuation
date. Such inputs are generally referred to as “Level 1” inputs because they represent reliable quoted prices in active
markets for identical securities.
If
the value of a portfolio security held by the Fund cannot be determined solely by reference to Level 1 inputs, such portfolio
security will be “fair valued.” The Fund’s Board of Directors has designated Royce as valuation designee to
perform fair value determinations for such portfolio securities in accordance with Rule 2a-5 under the 1940 Act (“Rule 2a-5”).
Pursuant to Rule 2a-5, fair values are determined in accordance with policies and procedures approved by the Fund’s Board of Directors
and policies and procedures adopted by Royce in its capacity as valuation designee for the Fund. Fair valued securities are reported
as either “Level 2” or “Level 3” securities.
As
a general principle, the fair value of a security is the amount which the Fund might reasonably expect to receive for the security
upon its current sale. However, in light of the judgment involved in fair valuations, no assurance can be given that a fair value
assigned to a particular portfolio security will be the amount which the Fund might be able to receive upon its current sale.
When a fair value pricing methodology is used, the fair value prices used by the Fund for such securities will likely differ from
the quoted or published prices for the same securities.
Level
2 inputs are other significant observable inputs (e.g., dealer bid side quotes and quoted prices for securities with comparable
characteristics). Examples of situations in which Level 2 inputs are used to fair value portfolio securities held by the Fund
on a particular valuation date include:
| ● | Over-the-counter
equity securities other than those traded on OTC Market Group Inc.’s OTC Link ATS
or other alternative trading system (collectively referred to herein as “Other
OTC Equity Securities”) are fair valued at their highest bid price when Royce receives
at least two bid side quotes from dealers who make markets in such securities; |
| ● | Certain
bonds and other fixed income securities may be fair valued by reference to other securities
with comparable ratings, interest rates, and maturities in accordance with valuation
methodologies maintained by certain independent pricing services; and |
| ● | The
Fund uses an independent pricing service to fair value certain non-U.S. equity securities
when U.S. market volatility exceeds a certain threshold. This pricing service uses proprietary
correlations it has developed between the movement of prices of non-U.S. equity securities
and indices of U.S.-traded securities, futures contracts, and other indications to estimate
the fair value of such non-U.S. securities. |
Level
3 inputs are significant unobservable inputs. Examples of Level 3 inputs include (without limitation) the last trade price for
a security before trading was suspended or terminated; discounts to last trade price for lack of marketability or otherwise; market
price information regarding other securities; information received from the issuer and/or published documents, including SEC filings
and financial statements; and other publicly available information. Pursuant to the above-referenced policies and procedures,
Royce may use
2023 Annual Report to Stockholders | 55
Royce
Value Trust
Notes
to Financial Statements (continued)
VALUATION
OF INVESTMENTS (continued):
various
techniques in making fair value determinations based upon Level 3 inputs, which techniques may include (without limitation): (i)
workout valuation methods (e.g., earnings multiples, discounted cash flows, liquidation values, derivations of book value, firm
or probable offers from qualified buyers for the issuer’s ongoing business, etc.); (ii) discount or premium from market,
or compilation of other observable market information, for other similar freely traded securities; (iii) conversion from the readily
available market price of a security into which an affected security is convertible or exchangeable; and (iv) pricing models or
other formulas. In the case of restricted securities, fair value determinations generally start with the inherent or intrinsic
worth of the relevant security, without regard to the restrictive feature, and are reduced for any diminution in value resulting
from the restrictive feature. Due to the inherent uncertainty of such valuations, these fair values may differ significantly from
the values that would have been used had an active market existed.
A
security that is valued by reference to Level 1 or Level 2 inputs may drop to Level 3 on a particular valuation date for several
reasons, including if:
| ● | an
equity security that is listed on an exchange or Nasdaq, or traded on OTC Market Group
Inc.’s OTC Link ATS or other alternative trading system, has not traded and there
are no bids; |
| ● | Royce
does not receive at least two bid side quotes for an Other OTC Equity Security; |
| ● | the
independent pricing services are unable to supply fair value prices; or |
| ● | the
Level 1 or Level 2 inputs become otherwise unreliable for any reason (e.g., a significant
event occurs after the close of trading for a security but prior to the time the Fund
prices its shares). |
The
table below shows the aggregate value of the various Level 1, Level 2, and Level 3 securities held by the Fund as of December
31, 2023. Any Level 2 or Level 3 securities held by the Fund are noted in its Schedule of Investments. The inputs or methodology
used for valuing securities are not necessarily an indication of the risk associated with owning those securities.
| |
LEVEL
1 |
LEVEL
2 |
LEVEL
3 |
TOTAL |
| Common
Stocks |
$1,819,809,995 |
$ |
– |
$995,360 |
$1,820,805,355 |
| Investment
Companies |
16,299,953 |
|
– |
– |
16,299,953 |
| Repurchase
Agreement |
– |
|
58,824,677 |
– |
58,824,677 |
Level
3 Reconciliation:
| |
|
|
|
|
UNREALIZED
GAIN (LOSS) 1 |
|
| |
BALANCE
AS OF
12/31/22 |
PURCHASES |
CORPORATE
ACTIONS |
REALIZED
GAIN (LOSS) 1 |
CURRENTLY
HELD
SECURITIES |
SECURITIES
NO
LONGER
HELD |
BALANCE
AS OF
12/31/23 |
| Common
Stocks |
$999,110 |
$
– |
$(3,750) |
$
– |
$0 |
$
– |
$995,360 |
| 1 | The
net change in unrealized appreciation (depreciation) is included in the accompanying
Statement of Operations. Change in unrealized appreciation (depreciation) includes net
unrealized appreciation (depreciation) resulting from changes in investment values during
the reporting period and the reversal of previously recorded unrealized appreciation
(depreciation) when gains or losses are realized. Net realized gain (loss) from investments
and foreign currency transactions is included in the accompanying Statement of Operations. |
REPURCHASE
AGREEMENTS:
The
Fund may enter into repurchase agreements with institutions that the Fund’s investment adviser has determined are creditworthy.
The Fund restricts repurchase agreements to maturities of no more than seven days. Securities pledged as collateral for repurchase
agreements, which are held until maturity of the repurchase agreements, are marked-to-market daily and maintained at a value at
least equal to the principal amount of the repurchase agreement (including accrued interest). Repurchase agreements could involve
certain risks in the event of default or insolvency of the counter-party, including possible delays or restrictions upon the ability
of the Fund to dispose of its underlying securities. The remaining contractual maturity of the repurchase agreement held by the
Fund as of December 31, 2023, is next business day and continuous.
FOREIGN
CURRENCY:
Net
realized foreign exchange gains or losses arise from sales and maturities of short-term securities, sales of foreign currencies,
expiration of currency forward contracts, currency gains or losses realized between the trade and settlement dates on securities
transactions, and the difference between the amounts of dividends, interest, and foreign withholding taxes recorded on the Fund’s
books and the U.S. dollar equivalent of the amounts actually received or paid. Net unrealized foreign exchange gains and losses
arise from changes in the value of assets and liabilities, other than investments in securities at the end of the reporting period,
as a result of changes in foreign currency exchange rates.
The
Fund does not isolate that portion of the results of operations resulting from fluctuations in foreign exchange rates on investments
from the fluctuations arising from changes in market prices of securities held. Such fluctuations are included with the net realized
and unrealized gain or loss on investments.
For
the purposes of the Statement of Cash Flows, the Fund defines Cash as cash, including foreign currency.
56 | 2023 Annual Report to Stockholders
Royce
Value Trust
Notes
to Financial Statements (continued)
TAXES:
As
a qualified regulated investment company under Subchapter M of the Internal Revenue Code, the Fund is not subject to income taxes to
the extent that it distributes substantially all of its taxable income for its fiscal year. The Schedule of Investments includes information
regarding income taxes under the caption “Tax Information.”
DISTRIBUTIONS:
The
Fund pays quarterly distributions on the Fund’s Common Stock at the annual rate of 7% of the rolling average of the prior four
calendar quarter-end NAVs of the Fund’s Common Stock, with the fourth quarter distribution being the greater of 1.75% of the rolling
average or the distribution required by IRS regulations. Distributions to Common Stockholders are recorded on ex-dividend date. To the
extent that distributions in any year are not paid from long-term capital gains, net investment income or net short-term capital gains,
they will represent a return of capital. Distributions are determined in accordance with income tax regulations that may differ from
accounting principles generally accepted in the United States of America. Permanent book and tax differences relating to stockholder
distributions will result in reclassifications within the capital accounts. Undistributed net investment income may include temporary
book and tax basis differences, which will reverse in a subsequent period. Any taxable income or gain remaining undistributed at fiscal
year end is distributed in the following year.
INVESTMENT
TRANSACTIONS AND RELATED INVESTMENT INCOME:
Investment
transactions are accounted for on the trade date. Dividend income is recorded on the ex-dividend date except for certain dividends from
securities where the dividend rate is not available. In such cases, the dividend is recorded as soon as the information is received by
the Fund. Non-cash dividend income is recorded at the fair market value of the securities received. Interest income is recorded on an
accrual basis. Premiums and discounts on debt securities are amortized using the effective yield-to-maturity method. Realized gains and
losses from investment transactions are determined on the basis of identified cost for book and tax purposes.
EXPENSES:
The
Fund incurs direct and indirect expenses. Expenses directly attributable to the Fund are charged to the Fund, while expenses applicable
to more than one of the Royce Funds are allocated equitably. Certain personnel, occupancy costs and other administrative expenses related
to all of the Royce Funds are allocated by Royce under an administration agreement and are included in administrative and office facilities
and professional fees.
INDEMNIFICATION
PROVISIONS:
Reference
is made to Maryland law, the Fund’s Articles of Incorporation, as amended and supplemented, and the Fund’s Amended and Restated
By-laws, each of which provides for the indemnification by the Fund of the Fund’s officers and directors under the circumstances
and to the extent set forth therein. Reference is also made to the investment advisory agreement between the Fund and Royce which provides
for the indemnification by the Fund of Royce under the circumstances and to the extent set forth therein. Additionally, in the normal
course of business, the Fund enters into contracts with service providers that contain general indemnification provisions in favor of
such service providers and other covered persons. The amount of any potential Fund liability under these indemnification arrangements,
if any, currently cannot be determined with any degree of specificity. The Fund is not currently in possession of any information that
would cause it to believe that the Fund is reasonably likely to be subject to any material adverse impact from the operation of these
indemnification arrangements. No assurance can be given, however, that the Fund will not incur any liability from the operation of these
indemnification arrangements. Any future liability to the Fund that may arise from the operation of such arrangements will be publicly
disclosed to the extent required by relevant accounting guidance and applicable laws, rules, and regulations.
Capital
Stock:
The
Fund issued 3,593,871 and 3,966,554 shares of Common Stock as reinvestment of distributions for the years ended December 31, 2023, and
December 31, 2022, respectively.
Borrowings:
The
Fund is party to a revolving credit agreement (the “credit agreement”) with BNP Paribas Prime Brokerage International, Limited (BNPPI).
The Fund pays a commitment fee of 0.50% per annum on the unused portion of the then-current maximum amount that may be borrowed by the
Fund under the credit agreement. The credit agreement has a 179-day rolling term that resets daily. The Fund pledges eligible portfolio
securities as collateral and has granted a security interest in such pledged securities to, and in favor of, BNPPI as security for the
loan balance outstanding. The amount of eligible portfolio securities required to be pledged as collateral is determined by BNPPI in
accordance with the credit agreement. In determining collateral requirements, the value of eligible securities pledged as collateral
is subject to discount by BNPPI based upon a variety of factors set forth in the credit agreement. As of December 31, 2023, the market
value of eligible securities pledged as collateral exceeded two times the loan balance outstanding.
2023 Annual Report to Stockholders | 57
Royce
Value Trust
Notes
to Financial Statements (continued)
Borrowings
(continued):
If
the Fund fails to meet certain requirements, or comply with other financial covenants set forth in the credit agreement, the Fund
may be required to repay immediately, in part or in full, the loan balance outstanding under the credit agreement, which may necessitate
the sale of portfolio securities at potentially inopportune times. BNPPI may terminate the credit agreement upon certain ratings
downgrades of its corporate parent, which would result in the Fund’s entire loan balance becoming immediately due and payable.
The occurrence of such ratings downgrades may necessitate the sale of portfolio securities at potentially inopportune times. BNPPI
may also terminate the credit agreement upon sixty (60) calendar days’ prior written notice to the Fund in the event the
Fund’s net asset value per share as of the close of business on the last business day of any calendar month declines by
thirty-five percent (35%) or more from the Fund’s net asset value per share as of the close of business on the last business
day of the immediately preceding calendar month.
The
credit agreement also permits, subject to certain conditions, BNPPI to rehypothecate portfolio securities pledged by the Fund
up to the amount of the loan balance outstanding. The Fund continues to receive payments in lieu of dividends and interest on
rehypothecated securities. The Fund also has the right under the credit agreement to recall the rehypothecated securities from
BNPPI on demand. If BNPPI fails to deliver the recalled security in a timely manner, the Fund is compensated by BNPPI for any
fees or losses related to the failed delivery or, in the event a recalled security is not returned by BNPPI, the Fund, upon notice
to BNPPI, may reduce the loan balance outstanding by the value of the recalled security failed to be returned. The Fund receives
a portion of the fees earned by BNPPI in connection with the rehypothecation of portfolio securities.
The
Fund and BNPPI have agreed that the current maximum amount the Fund may borrow under the credit agreement is $70,000,000. The
Fund has the right to further reduce the maximum amount it can borrow under the credit agreement upon one (1) business day’s
prior written notice to BNPPI. In addition, the Fund and BNPPI may agree to increase the maximum amount the Fund can borrow under
the credit agreement, which amount may not exceed $150,000,000.
As
of December 31, 2023, the Fund had outstanding borrowings of $35,000,000. During the year ended December 31, 2023, the Fund had
an average daily loan balance of $35,000,000 at a weighted average borrowing cost of 6.21%. The maximum loan balance outstanding
during the year ended December 31, 2023, was $35,000,000. As of December 31, 2023, the aggregate value of rehypothecated securities
was $31,277,208. During the year ended December 31, 2023, the Fund earned $5,077 in fees from rehypothecated securities.
Investment
Advisory Agreement:
As
compensation for its services under the investment advisory agreement, Royce receives a fee comprised of a Basic Fee (“Basic
Fee”) and an adjustment to the Basic Fee based on the investment performance of the Fund in relation to the investment record
of the S&P SmallCap 600 Index (“S&P 600”). The fee is payable monthly.
The
Basic Fee is a monthly fee equal to 1/12 of 1% (1% on an annualized basis) of the average of the Fund’s month-end net assets
for the rolling 60-month period ending with such month (the “performance period”). The Basic Fee for each month is increased
or decreased at the rate of 1/12 of .05% for each percentage point that the investment performance of the Fund exceeds, or is
exceeded by, the percentage change in the investment record of the S&P 600 for the performance period by more than two percentage
points. The performance period for each such month is a rolling 60-month period ending with such month. The maximum increase or
decrease in the Basic Fee for any month may not exceed 1/12 of .5%. Accordingly, for each month, the maximum monthly fee rate
as adjusted for performance is 1/12 of 1.5% and is payable if the investment performance of the Fund exceeds the percentage change
in the investment record of the S&P 600 by 12 or more percentage points for the performance period, and the minimum monthly
fee rate as adjusted for performance is 1/12 of .5% and is payable if the percentage change in the investment record of the S&P
600 exceeds the investment performance of the Fund by 12 or more percentage points for the performance period.
Notwithstanding
the foregoing, Royce is not entitled to receive any fee for any month when the investment performance of the Fund for the rolling
36-month period ending with such month is negative. In the event that the Fund’s investment performance for such a performance
period is less than zero, Royce will not be required to refund to the Fund any fee earned in respect of any prior performance
period.
For
the twelve rolling 60-month periods in 2023, the Fund’s investment performance ranged from 8% below to 11% above the investment
performance of the S&P 600. Accordingly, the net investment advisory fee consisted of a Basic Fee of $16,987,847 and a net
upward adjustment of $2,924,147 for the performance of the Fund relative to that of the S&P 600. For the year ended December
31, 2023, the Fund expensed Royce investment advisory fees totaling $19,911,994.
Purchases
and Sales of Investment Securities:
For
the year ended December 31, 2023, the costs of purchases and proceeds from sales of investment securities, other than short-term
securities, amounted to $1,151,609,776 and $1,141,712,468, respectively.
58 | 2023 Annual Report to Stockholders
Royce
Value Trust
Notes
to Financial Statements (continued)
Purchases
and Sales of Investment Securities (continued):
Cross
trades were executed by the Fund pursuant to Rule 17a-7 under the 1940 Act. Cross trading is the buying or selling of portfolio
securities between funds to which Royce or an affiliate of Franklin Resources, Inc. serves as investment adviser. The Fund’s
Chief Compliance Officer reviews such transactions each quarter for compliance with the requirements and restrictions set forth
by Rule 17a-7, and reports the results of that review to the Board of Directors. Cross trades for the year ended December 31,
2023, were as follows:
| COSTS
OF PURCHASES |
PROCEEDS
FROM SALES |
REALIZED
GAIN (LOSS) |
| $647,965 |
$623,239 |
$(1,447,727) |
Tax
Information:
Distributions
during the years ended December 31, 2023 and 2022, were characterized as follows for tax purposes:
| ORDINARY
INCOME |
LONG-TERM
CAPITAL GAINS |
RETURN
OF CAPITAL |
| 2023 |
2022 |
2023 |
2022 |
2023 |
2022 |
| $15,316,939 |
$25,777,270 |
$103,752,569 |
$95,268,088 |
$
– |
$20,627,640 |
The
tax basis components of distributable earnings as of December 31, 2023, were as follows:
UNDISTRIBUTED
ORDINARY INCOME |
UNDISTRIBUTED
LONG-TERM CAPITAL GAINS |
NET UNREALIZED
APPRECIATION
(DEPRECIATION)1 |
QUALIFIED LATE YEAR
ORDINARY AND POST-OCTOBER
LOSS DEFERRALS2 |
TOTAL
DISTRIBUTABLE EARNINGS |
| $4,753,638 |
$14,750 |
$454,656,762 |
$(5,509,824) |
$453,915,326 |
| 1 | Includes
timing differences on foreign currency, recognition of losses on securities sold, investments
in Real Estate Investment Trusts, investments in publicly traded partnerships and mark-to-market
of Passive Foreign Investment Companies. |
| 2 | Under
the current tax law, capital losses and qualified late year ordinary losses incurred
after October 31 may be deferred and treated as occurring on the first day of the following
fiscal year. |
For
financial reporting purposes, capital accounts and distributions to stockholders are adjusted to reflect the tax character of
permanent book/tax differences. For the year ended December 31, 2023, the Fund recorded the following permanent reclassifications,
which relate primarily to investments in partnerships and passive foreign investment companies:
| TOTAL DISTRIBUTABLE EARNINGS (LOSS) |
PAID-IN
CAPITAL |
| $(1,522,903) |
$1,522,903 |
Management
has analyzed the Fund’s tax positions taken on federal income tax returns for all open tax years (2020-2023) and has concluded
that as of December 31, 2023, no provision for income tax is required in the Fund’s financial statements.
Subsequent
Events:
Subsequent
events have been evaluated through the date the financial statements were issued and it has been determined that no events have
occurred that require disclosure.
2023 Annual Report to Stockholders | 59
Report
of Independent Registered Public Accounting Firm
To
the Board of Directors and Stockholders of Royce Value Trust, Inc.:
Opinion
on the Financial Statements
We
have audited the accompanying statement of assets and liabilities, including the schedule of investments, of Royce Value Trust,
Inc. (the “Fund”) as of December 31, 2023, the related statements of operations and cash flows for the year ended December
31, 2023, the statement of changes in net assets for each of the two years in the period ended December 31, 2023, including the
related notes, and the financial highlights for each of the five years in the period ended December 31, 2023 (collectively referred
to as the “financial statements”). In our opinion, the financial statements present fairly, in all material respects,
the financial position of the Fund as of December 31, 2023, the results of its operations and its cash flows for the year then
ended, the changes in its net assets for each of the two years in the period ended December 31, 2023 and the financial highlights
for each of the five years in the period ended December 31, 2023 in conformity with accounting principles generally accepted in
the United States of America.
Basis
for Opinion
These
financial statements are the responsibility of the Fund’s management. Our responsibility is to express an opinion on the
Fund’s financial statements based on our audits. We are a public accounting firm registered with the Public Company Accounting
Oversight Board (United States) (PCAOB) and are required to be independent with respect to the Fund in accordance with the U.S.
federal securities laws and the applicable rules and regulations of the Securities and Exchange Commission and the PCAOB.
We
conducted our audits of these financial statements in accordance with the standards of the PCAOB. Those standards require that
we plan and perform the audit to obtain reasonable assurance about whether the financial statements are free of material misstatement,
whether due to error or fraud.
Our
audits included performing procedures to assess the risks of material misstatement of the financial statements, whether due to
error or fraud, and performing procedures that respond to those risks. Such procedures included examining, on a test basis, evidence
regarding the amounts and disclosures in the financial statements. Our audits also included evaluating the accounting principles
used and significant estimates made by management, as well as evaluating the overall presentation of the financial statements.
Our procedures included confirmation of securities owned as of December 31, 2023 by correspondence with the custodian and brokers;
when replies were not received from brokers, we performed other auditing procedures. We believe that our audits provide a reasonable
basis for our opinion.
/s/PricewaterhouseCoopers
LLP
New York, New York
February
22, 2024
We
have served as the auditor of one or more investment companies in the Franklin Templeton Group of Funds since 1948.
60 | 2023 Annual Report to Stockholders
History
Since Inception (unaudited)
The
following table details the share accumulations by an initial investor in the Funds who reinvested all distributions and participated
fully in primary subscriptions for each of the rights offerings. Full participation in distribution reinvestments and rights offerings
can maximize the returns available to a long-term investor. This table should be read in conjunction with the Performance and
Portfolio Reviews of the Funds.
| HISTORY |
|
AMOUNT
INVESTED |
PURCHASE
PRICE 1 |
SHARES |
|
NAV
VALUE 2 |
MARKET
VALUE 2 |
| Royce
Global Value Trust |
|
|
|
|
|
|
|
|
|
| 10/17/13 |
Initial
Purchase |
$ |
8,975 |
$ |
8.975 |
1,000 |
$ |
9,780 |
$ |
8,975 |
| 12/11/14 |
Distribution
$0.15 |
|
|
|
7.970 |
19 |
|
9,426 |
|
8,193 |
| 12/10/15 |
Distribution
$0.10 |
|
|
|
7.230 |
14 |
|
9,101 |
|
7,696 |
| 12/9/16 |
Distribution
$0.14 |
|
|
|
7.940 |
18 |
|
10,111 |
|
8,446 |
| 12/12/17 |
Distribution
$0.11 |
|
|
|
10.610 |
11 |
|
13,254 |
|
11,484 |
| 12/12/18 |
Distribution
$0.04 |
|
|
|
8.500 |
5 |
|
11,118 |
|
9,475 |
| 12/11/19 |
Distribution
$0.06 |
|
|
|
10.670 |
6 |
|
14,593 |
|
12,543 |
| 12/17/20 |
Distribution
$1.19 |
|
|
|
13.441 |
95 |
|
17,462 |
|
15,604 |
| 12/10/21 |
Distribution
$2.75 |
|
|
|
12.498 |
257 |
|
20,321 |
|
18,696 |
| 12/9/22 |
Distribution
$0.133 |
|
|
|
8.821 |
21 |
|
14,822 |
|
12,508 |
| 12/8/23 |
Distribution
$0.15 |
|
|
|
9.430 |
23 |
|
|
|
|
| 12/31/23 |
|
$ |
8,975 |
|
|
1,469 |
$ |
17,217 |
$ |
14,323 |
| |
|
|
|
|
|
|
|
|
|
| Royce
Micro-Cap Trust |
|
|
|
|
|
|
|
|
|
| 12/14/93 |
Initial
Purchase |
$ |
7,500 |
$ |
7.500 |
1,000 |
$ |
7,250 |
$ |
7,500 |
| 10/28/94 |
Rights
Offering |
|
1,400 |
|
7.000 |
200 |
|
|
|
|
| 12/19/94 |
Distribution
$0.05 |
|
|
|
6.750 |
9 |
|
9,163 |
|
8,462 |
| 12/7/95 |
Distribution
$0.36 |
|
|
|
7.500 |
58 |
|
11,264 |
|
10,136 |
| 12/6/96 |
Distribution
$0.80 |
|
|
|
7.625 |
133 |
|
13,132 |
|
11,550 |
| 12/5/97 |
Distribution
$1.00 |
|
|
|
10.000 |
140 |
|
16,694 |
|
15,593 |
| 12/7/98 |
Distribution
$0.29 |
|
|
|
8.625 |
52 |
|
16,016 |
|
14,129 |
| 12/6/99 |
Distribution
$0.27 |
|
|
|
8.781 |
49 |
|
18,051 |
|
14,769 |
| 12/6/00 |
Distribution
$1.72 |
|
|
|
8.469 |
333 |
|
20,016 |
|
17,026 |
| 12/6/01 |
Distribution
$0.57 |
|
|
|
9.880 |
114 |
|
24,701 |
|
21,924 |
| 2002 |
Annual
distribution total $0.80 |
|
|
|
9.518 |
180 |
|
21,297 |
|
19,142 |
| 2003 |
Annual
distribution total $0.92 |
|
|
|
10.004 |
217 |
|
33,125 |
|
31,311 |
| 2004 |
Annual
distribution total $1.33 |
|
|
|
13.350 |
257 |
|
39,320 |
|
41,788 |
| 2005 |
Annual
distribution total $1.85 |
|
|
|
13.848 |
383 |
|
41,969 |
|
45,500 |
| 2006 |
Annual
distribution total $1.55 |
|
|
|
14.246 |
354 |
|
51,385 |
|
57,647 |
| 2007 |
Annual
distribution total $1.35 |
|
|
|
13.584 |
357 |
|
51,709 |
|
45,802 |
| 2008 |
Annual
distribution total $1.193 |
|
|
|
8.237 |
578 |
|
28,205 |
|
24,807 |
| 3/11/09 |
Distribution
$0.223 |
|
|
|
4.260 |
228 |
|
41,314 |
|
34,212 |
| 12/2/10 |
Distribution
$0.08 |
|
|
|
9.400 |
40 |
|
53,094 |
|
45,884 |
| 2011 |
Annual
distribution total $0.533 |
|
|
|
8.773 |
289 |
|
49,014 |
|
43,596 |
| 2012 |
Annual
distribution total $0.51 |
|
|
|
9.084 |
285 |
|
57,501 |
|
49,669 |
| 2013 |
Annual
distribution total $1.38 |
|
|
|
11.864 |
630 |
|
83,110 |
|
74,222 |
| 2014 |
Annual
distribution total $2.90 |
|
|
|
10.513 |
1,704 |
|
86,071 |
|
76,507 |
| 2015 |
Annual
distribution total $1.26 |
|
|
|
7.974 |
1,256 |
|
75,987 |
|
64,222 |
| 2016 |
Annual
distribution total $0.64 |
|
|
|
7.513 |
779 |
|
92,689 |
|
78,540 |
| 2017 |
Annual
distribution total $0.69 |
|
|
|
8.746 |
783 |
|
109,076 |
|
98,254 |
| 2018 |
Annual
distribution total $0.75 |
|
|
|
8.993 |
893 |
|
96,398 |
|
83,853 |
| 2019 |
Annual
distribution total $0.68 |
|
|
|
8.297 |
955 |
|
118,025 |
|
104,666 |
| 2020 |
Annual
distribution total $0.61 |
|
|
|
6.944 |
1,120 |
|
128,811 |
|
135,365 |
| 2021 |
Annual
distribution total $0.84 |
|
|
|
11.377 |
1,014 |
|
187,933 |
|
166,205 |
| 2022 |
Annual
distribution total $0.953 |
|
|
|
8.887 |
1,598 |
|
156,203 |
|
138,776 |
| 2023 |
Annual
distribution total $0.74 |
|
|
|
8.648 |
1,413 |
|
|
|
|
| 12/31/23 |
|
$ |
8,900 |
|
|
17,401 |
$ |
182,188 |
$ |
160,785 |
| 1 | The
purchase price used for annual distribution totals is a weighted average of the distribution
reinvestment prices for the year. |
| 2 | Values
are stated as of December 31 of the year indicated, after reinvestment of distributions,
other than for initial purchase. |
| 3 | Includes
a return of capital. |
This page is not part of the 2023 Annual Report to Stockholders | 61
History
Since Inception (unaudited) (continued)
| HISTORY |
|
AMOUNT
INVESTED |
PURCHASE
PRICE 1 |
SHARES |
|
NAV
VALUE2 |
MARKET
VALUE2 |
| Royce
Value Trust |
|
|
|
|
|
|
|
|
|
| 11/26/86 |
Initial
Purchase |
$ |
10,000 |
$ |
10.000 |
1,000 |
$ |
9,280 |
$ |
10,000 |
| 10/15/87 |
Distribution
$0.30 |
|
|
|
7.000 |
42 |
|
|
|
|
| 12/31/87 |
Distribution
$0.22 |
|
|
|
7.125 |
32 |
|
8,578 |
|
7,250 |
| 12/27/88 |
Distribution
$0.51 |
|
|
|
8.625 |
63 |
|
10,529 |
|
9,238 |
| 9/22/89 |
Rights
Offering |
|
405 |
|
9.000 |
45 |
|
|
|
|
| 12/29/89 |
Distribution
$0.52 |
|
|
|
9.125 |
67 |
|
12,942 |
|
11,866 |
| 9/24/90 |
Rights
Offering |
|
457 |
|
7.375 |
62 |
|
|
|
|
| 12/31/90 |
Distribution
$0.32 |
|
|
|
8.000 |
52 |
|
11,713 |
|
11,074 |
| 9/23/91 |
Rights
Offering |
|
638 |
|
9.375 |
68 |
|
|
|
|
| 12/31/91 |
Distribution
$0.61 |
|
|
|
10.625 |
82 |
|
17,919 |
|
15,697 |
| 9/25/92 |
Rights
Offering |
|
825 |
|
11.000 |
75 |
|
|
|
|
| 12/31/92 |
Distribution
$0.90 |
|
|
|
12.500 |
114 |
|
21,999 |
|
20,874 |
| 9/27/93 |
Rights
Offering |
|
1,469 |
|
13.000 |
113 |
|
|
|
|
| 12/31/93 |
Distribution
$1.15 |
|
|
|
13.000 |
160 |
|
26,603 |
|
25,428 |
| 10/28/94 |
Rights
Offering |
|
1,103 |
|
11.250 |
98 |
|
|
|
|
| 12/19/94 |
Distribution
$1.05 |
|
|
|
11.375 |
191 |
|
27,939 |
|
24,905 |
| 11/3/95 |
Rights
Offering |
|
1,425 |
|
12.500 |
114 |
|
|
|
|
| 12/7/95 |
Distribution
$1.29 |
|
|
|
12.125 |
253 |
|
35,676 |
|
31,243 |
| 12/6/96 |
Distribution
$1.15 |
|
|
|
12.250 |
247 |
|
41,213 |
|
36,335 |
| 1997 |
Annual
distribution total $1.21 |
|
|
|
15.374 |
230 |
|
52,556 |
|
46,814 |
| 1998 |
Annual
distribution total $1.54 |
|
|
|
14.311 |
347 |
|
54,313 |
|
47,506 |
| 1999 |
Annual
distribution total $1.37 |
|
|
|
12.616 |
391 |
|
60,653 |
|
50,239 |
| 2000 |
Annual
distribution total $1.48 |
|
|
|
13.972 |
424 |
|
70,711 |
|
61,648 |
| 2001 |
Annual
distribution total $1.49 |
|
|
|
15.072 |
437 |
|
81,478 |
|
73,994 |
| 2002 |
Annual
distribution total $1.51 |
|
|
|
14.903 |
494 |
|
68,770 |
|
68,927 |
| 1/28/03 |
Rights
Offering |
|
5,600 |
|
10.770 |
520 |
|
|
|
|
| 2003 |
Annual
distribution total $1.30 |
|
|
|
14.582 |
516 |
|
106,216 |
|
107,339 |
| 2004 |
Annual
distribution total $1.55 |
|
|
|
17.604 |
568 |
|
128,955 |
|
139,094 |
| 2005 |
Annual
distribution total $1.61 |
|
|
|
18.739 |
604 |
|
139,808 |
|
148,773 |
| 2006 |
Annual
distribution total $1.78 |
|
|
|
19.696 |
693 |
|
167,063 |
|
179,945 |
| 2007 |
Annual
distribution total $1.85 |
|
|
|
19.687 |
787 |
|
175,469 |
|
165,158 |
| 2008 |
Annual
distribution total $1.723 |
|
|
|
12.307 |
1,294 |
|
95,415 |
|
85,435 |
| 3/11/09 |
Distribution
$0.323 |
|
|
|
6.071 |
537 |
|
137,966 |
|
115,669 |
| 12/2/10 |
Distribution
$0.03 |
|
|
|
13.850 |
23 |
|
179,730 |
|
156,203 |
| 2011 |
Annual
distribution total $0.783 |
|
|
|
13.043 |
656 |
|
161,638 |
|
139,866 |
| 2012 |
Annual
distribution total $0.80 |
|
|
|
13.063 |
714 |
|
186,540 |
|
162,556 |
| 2013 |
Annual
distribution total $2.194 |
|
|
|
16.647 |
1,658 |
|
250,219 |
|
220,474 |
| 2014 |
Annual
distribution total $1.82 |
|
|
|
14.840 |
1,757 |
|
252,175 |
|
222,516 |
| 2015 |
Annual
distribution total $1.24 |
|
|
|
12.725 |
1,565 |
|
231,781 |
|
201,185 |
| 2016 |
Annual
distribution total $1.02 |
|
|
|
12.334 |
1,460 |
|
293,880 |
|
248,425 |
| 2017 |
Annual
distribution total $1.16 |
|
|
|
14.841 |
1,495 |
|
350,840 |
|
324,176 |
| 2018 |
Distribution
through 6/30/18 $0.59 |
|
|
|
15.962 |
748 |
|
|
|
|
| 2018 |
Rights
Offering |
|
31,289 |
|
15.330 |
2,041 |
|
|
|
|
| 2018 |
Distribution
after 6/30/18 $0.67 |
|
|
|
12.706 |
1,168 |
|
329,589 |
|
283,259 |
| 2019 |
Annual
distribution total $1.10 |
|
|
|
14.100 |
1,929 |
|
429,986 |
|
383,045 |
| 2020 |
Annual
distribution total $1.04 |
|
|
|
11.888 |
2,357 |
|
523,949 |
|
456,617 |
| 2021 |
Annual
distribution total $1.67 |
|
|
|
18.124 |
2,690 |
|
628,604 |
|
609,918 |
| 2022 |
Annual
distribution total $1.323 |
|
|
|
14.525 |
2,907 |
|
495,104 |
|
449,355 |
| 2023 |
Annual
distribution total $1.07 |
|
|
|
13.427 |
2,784 |
|
|
|
|
| 12/31/23 |
|
$ |
53,211 |
|
|
36,672 |
$ |
602,154 |
$ |
533,944 |
| 1 | The
purchase price used for annual distribution totals is a weighted average of the distribution
reinvestment prices for the year. |
| 2 | Values
are stated as of December 31 of the year indicated, after reinvestment of distributions,
other than for initial purchase. |
| 3 | Includes
a return of capital. |
| 4 | Includes
Royce Global Value Trust spin-off of $1.40 per share. |
62 | This page is not part of the 2023 Annual Report to Stockholders
Distribution Reinvestment and Cash
Purchase Options
Why
should I reinvest my distributions?
By
reinvesting distributions, a stockholder can maintain an undiluted investment in the Fund. The regular reinvestment of distributions
has a significant impact on stockholder returns. In contrast, the stockholder who takes distributions in cash is penalized when
shares are issued below net asset value to other stockholders.
How
does the reinvestment of distributions from the Royce closed-end funds work?
The
Funds automatically issue shares in payment of distributions unless you indicate otherwise. The shares are generally issued at
the lower of the market price or net asset value on the valuation date.
How
does this apply to registered stockholders?
If
your shares are registered directly with a Fund, your distributions are automatically reinvested unless you have otherwise instructed
the Funds’ transfer agent, Computershare, in writing, in which case you will receive your distribution in cash. A registered
stockholder also may have the option to receive the distribution in the form of a stock certificate.
What
if my shares are held by a brokerage firm or a bank?
If
your shares are held by a brokerage firm, bank, or other intermediary as the stockholder of record, you should contact your brokerage
firm or bank to be certain that it is automatically reinvesting distributions on your behalf. If they are unable to reinvest distributions
on your behalf, you should have your shares registered in your name in order to participate.
What
other features are available for registered stockholders?
The
Distribution Reinvestment and Cash Purchase Plans also allow registered stockholders to make optional cash purchases of shares
of a Fund’s common stock directly through Computershare on a monthly basis, and to deposit certificates representing your
RVT and RMT shares with Computershare for safekeeping. (RGT does not issue shares in certificated form). Plan participants are
subject to a $0.75 service fee for each voluntary cash purchase under the Plans. The Funds’ investment adviser absorbed
all commissions on optional cash purchases under the Plans through December 31, 2023.
How
do the Plans work for registered stockholders?
Computershare
maintains the accounts for registered stockholders in the Plans and sends written confirmation of all transactions in the account.
Shares in the account of each participant will be held by Computershare in non-certificated form in the name of the participant, and
each participant will be able to vote those shares at a stockholder meeting or by proxy. A participant may also send stock certificates
for RVT and RMT held by them to Computershare to be held in non-certificated form. RGT does not issue shares in certificated form.
There is no service fee charged to participants for reinvesting distributions. If a participant elects to sell shares from a Plan
account, Computershare will deduct a $2.50 service fee from the sale transaction. The Funds’ investment adviser absorbed
all commissions on optional sales under the Plans through December 31, 2023. If a nominee is the registered owner of your shares,
the nominee will maintain the accounts on your behalf.
How
can I get more information on the Plans?
You
can call an Investor Services Representative at (800) 221-4268 or you can request a copy of the Plan for your Fund from Computershare. All
correspondence (including notifications) should be directed to: [Name of Fund] Distribution Reinvestment and Cash Purchase Plan,
c/o Computershare, PO Box 43078, Providence, RI 02940-3078, telephone (800) 426-5523 (from 9:00 A.M. to 5:00 P.M.).
This page is not part of the 2023 Annual Report to Stockholders | 63
Directors and Officers
All
Directors and Officers may be reached c/o The Royce Funds, 745 Fifth Avenue, New York, NY 10151
Christopher
D. Clark, Director 1, President
Age:
58 | Number of Funds Overseen: 16 | Tenure: Since 2014
Principal
Occupation(s) During Past Five Years: Chief Executive Officer (since July 2016), President (since July 2014),
Co-Chief Investment Officer (since January 2014), Managing Director of Royce, a Member of the Board of Managers of Royce, having
been employed by Royce since May 2007.
Patricia
W. Chadwick, Director
Age:
75 | Number of Funds Overseen: 16 | Tenure: Since 2009
Non-Royce
Directorships: Director of Voya Mutual Funds
Principal
Occupation(s) During Past 5 Years: Consultant and President, Ravengate Partners LLC (since 2000). Formerly Director, Wisconsin
Energy Corp. (until 2022).
Christopher
C. Grisanti, Director
Age:
62 | Number of Funds Overseen: 16 | Tenure: Since 2017
Non-Royce
Directorships: None
Principal
Occupation(s) During Past Five Years: Chief Equity Strategist and Senior Portfolio Manager, MAI Capital Management LLC (investment
advisory firm) (since May 2020). Formerly Co-Founder and Chief Executive Officer, Grisanti Capital Management LLC (investment advisory
firm) (from 1999 to 2020); Director of Research and Portfolio Manager, Spears Benzak, Salomon & Farrell (from 1994 to 1999);
and Senior Associate, Simpson, Thacher & Bartlett (law firm) (from 1988 to 1994).
Cecile
B. Harper, Director
Age:
60 | Number of Funds Overseen: 16 | Tenure: Since 2020
Non-Royce
Directorships: None
Principal
Occupation(s) During Past Five Years: Chief Financial Officer and Chief Operating Officer, College Foundation at the University
of Virginia (since October 2019). Formerly Board Member, Pyramid Peak Foundation (January 2012 to 2022); Board Member, Regional
One Health Foundation (from June 2013 to September 2019); and Principal, Southeastern Asset Management (from December 1993 to
September 2019).
Arthur
S. Mehlman, Director3
Age:
81 | Number of Funds Overseen: 16 | Tenure: Since 2004
Non-Royce
Directorships: None
Principal
Occupation(s) During Past Five Years: Director, University of Maryland Foundation (non-profits). Formerly
Director/Trustee, registered investment companies constituting the Legg Mason Funds (from 2002 to June 2021); Director, The
League for People with Disabilities, Inc. (from June 2003 to June 2018); Director, Municipal Mortgage & Equity, LLC (from
October 2004 to April 2011); Director, University of Maryland College Park Foundation (non-profit) (from 1998 to 2005);
Director, Maryland Business Roundtable for Education (from July 1984 to June 2002); and Partner, KPMG LLP
(international accounting firm) (from 1972 to 2002)
G.
Peter O’Brien, Director
Age:
78 | Number of Funds Overseen: 71 | Tenure: Since 2001
Non-Royce
Directorships: Director/Trustee of registered investment companies constituting the 55 Legg Mason Funds.
Principal
Occupation(s) During Past Five Years: Trustee Emeritus, Colgate University (since 2005); and Emeritus Board Member, Hill House,
Inc. (since 2019). Formerly Director, TICC Capital Corp. (from 2003-2017); Trustee, Colgate University (from 1996 to 2005); President,
Hill House, Inc. (from 2001 to 2005); Board Member, Hill House, Inc. (from 1999 to 2019); Director, Bridges School (from 2006 to
2018); and Managing Director/ Equity Capital Markets Group, Merrill Lynch & Co. (from 1971 to 1999).
Julia
W. Poston, Director2
Age:
63 | Number of Funds Overseen: 16 | Tenure: Since 2023
Non-Royce
Directorships: Ohio National Fund, Inc. and The James Advantage Funds
Principal
Occupation(s) During Past Five Years: Director, Member of Nominating/Governance Committee, and Chair of Audit Committee, Al.
Neyer Corporation (since 2020); Director, Member of Governance Committee, and Chair of Audit Committee, Master Fluid Solutions
(since 2021); Trustee and Chair of Finance/Audit Committee, Cincinnati Museum Center (non-profit) (since 2015); and Director and
Founder, Cincinnati Women’s Executive Forum (non-profit) (since 2010). Formerly Senior Client Partner (2002-2020) and Assurance
Practice Group Leader for Ohio Valley Region (2014-2019), Ernst & Young, LLP (international accounting and services firm);
and Audit Partner, Arthur Andersen LLP (international accounting and services firm) (1982-2002).
Michael
K. Shields, Director
Age:
64 | Number of Funds Overseen: 16 | Tenure: Since 2015
Non-Royce
Directorships: None
Principal
Occupation(s) During Past Five Years: President and Chief Executive Officer, Piedmont Trust Company (privately-owned North
Carolina trust company) (since February 2012); Chairman, UNC Charlotte Investment Fund Board (since February 2016); and Chairman,
Halftime Carolinas Board (since February 2011). Formerly Owner, Shields Advisors (investment consulting firm) (from April 2010
to June 2012); President and Chief Executive Officer, Eastover Capital Management (2005-2007); President and Chief Executive Officer,
Campbell, Cowperthwait (investment subsidiary of U.S. Trust Corporation) (1997-2002); and equity portfolio manager and co-manager
of Quality Growth Team, Scudder, Stevens and Clark (1992-1997).
Francis
D. Gannon, Vice President
Age:
56 | Tenure: Since 2014
Principal
Occupation(s) During Past Five Years: Co-Chief Investment Officer (since January 2014) and Managing Director of Royce, having
been employed by Royce since September 2006.
Daniel
A. O’Byrne, Vice President
Age:
61 | Tenure: Since 1994
Principal
Occupation(s) During Past Five Years: Principal and Vice President of Royce, having been employed by Royce since October 1986.
Peter
K. Hoglund, Treasurer
Age:
57 | Tenure: Since 2015
Principal
Occupation(s) During Past Five Years: Chief Financial Officer, Chief Administrative Officer, and Managing Director of Royce,
having been employed by Royce since December 2014. Prior to joining Royce, Mr. Hoglund spent more than 20 years with Munder
Capital Management in Birmingham, MI, serving as Managing Director and Chief Financial Officer and overseeing all financial
aspects of the firm. He began his career at Munder as a portfolio manager.
John
E. Denneen, Secretary and Chief Legal Officer
Age:
56 | Tenure: 1996-2001 and Since 2002
Principal
Occupation(s) During Past Five Years: General Counsel, Managing Director, and, since June 2015, a Member of the Board of Managers
of Royce. Chief Legal and Compliance Officer and Secretary of Royce.
John
P. Schwartz, Chief Compliance Officer
Age:
52 | Tenure: Since 2022
Principal
Occupation(s) During Past Five Years: Chief Compliance Officer of The Royce Funds (since May 2022) and Associate General Counsel
and Compliance Officer of Royce (since March 2013).
| 2 | Became
a Director effective as of the close of business on July 12, 2023. |
| 3 | Retired
as Director effective as of the close of business on December 31, 2023. |
Directors
will hold office until their successors have been duly elected and qualified or until their earlier resignation or removal. The
Statement of Additional Information, which contains additional information about the Trust’s directors and officers, is
available and can be obtained without charge at www.royceinvest.com or by calling (800) 221-4268.
64 | This page is not part of the 2023 Annual Report to Stockholders
Notes to Performance and Other
Important Information
The
thoughts expressed in this Review and Report concerning recent market movements and future prospects for small company
stocks are solely the opinion of Royce at December 31, 2023, and, of course, historical market trends are not necessarily indicative
of future market movements. Statements regarding the future prospects for particular securities held in the Funds’ portfolios
and Royce’s investment intentions with respect to those securities reflect Royce’s opinions as of December
31, 2023 and are subject to change at any time without notice. There can be no assurance that securities mentioned in this Review
and Report will be included in any Royce-managed portfolio in the future. Investments in securities of micro-cap, small-cap
and/or mid-cap companies may involve considerably more risk than investments in securities of larger-cap companies. All publicly
released material information is always disclosed by the Funds on the website at www.royceinvest.com.
Sector
weightings are determined using the Global Industry Classification Standard (“GICS”). GICS was developed by, and is
the exclusive property of, Standard & Poor’s Financial Services LLC (“S&P”) and MSCI Inc. (“MSCI”).
GICS is the trademark of S&P and MSCI. “Global Industry Classification Standard (GICS)” and “GICS Direct”
are service marks of S&P and MSCI.
All
indexes referred to are unmanaged and capitalization-weighted. Each index’s returns include net reinvested dividends and/or
interest income. Frank Russell Company (“Russell”) is the source and owner of the trademarks, service marks and copyrights
related to the Russell Indexes. Russell® is a trademark of Frank Russell Company. Neither Russell nor its licensors
accept any liability for any errors or omissions in the Russell Indexes and/or Russell ratings or underlying data and no party
may rely on any Russell Indexes and/or Russell ratings and/ or underlying data contained in this communication. No further distribution
of Russell Data is permitted without Russell’s express written consent. Russell does not promote, sponsor or endorse the
content of this communication. The Russell 2000 Index is an index of domestic small-cap stocks. It measures the performance of
the 2,000 smallest publicly traded U.S. companies in the Russell 3000 Index. The Russell 2000 Value and Growth Indexes consist
of the respective value and growth stocks within the Russell 2000 as determined by Russell Investments. The Russell Microcap Index
includes 1,000 of the smallest securities in the small-cap Russell 2000 Index along with the next smallest eligible securities
as determined by Russell. The Russell 1000 Index is an index of domestic large-cap stocks. It measures the performance of the
1,000 largest publicly traded U.S. companies in the Russell 3000 Index. Source: MSCI. MSCI makes no express or implied warranties
or representations and shall have no liability whatsoever with respect to any MSCI data contained herein. The MSCI data may not
be further redistributed or used as a basis for other indexes or any securities or financial products. This report is not approved,
endorsed, reviewed or produced by MSCI. None of the MSCI data is intended to constitute investment advice or a recommendation
to make (or refrain from making) any kind of investment decision and may not be relied on as such. The MSCI ACWI Small Cap Index
is an unmanaged, capitalization-weighted index of global small-cap stocks. Index returns include net reinvested dividends
and/or interest income. The S&P SmallCap 600 Index is an index of U.S. small-cap stocks selected by Standard & Poor’s
based on market size, liquidity, and industry grouping, among other factors. The S&P 500 Index tracks the stock performance
of 500 of the largest companies listed on stock exchanges in the U.S. The Nasdaq Composite Index is a market capitalization weighted
index of more than 3,700 stocks listed on the Nasdaq stock exchange. The performance of an index does not represent exactly any
particular investment, as you cannot invest directly in an index. Index returns used in this Report were based on information
supplied to Royce by Russell for the Russell market indexes and by MSCI for the MSCI market indexes. Royce has not independently
verified the above described information.
The
Price-Earnings, or P/E, Ratio is calculated by dividing a company’s share price by its trailing 12-month earnings-per-share
(EPS). The Price-to-Book, or P/B, Ratio is calculated by dividing a company’s share price by its book value
per share. Beta is a measure of the volatility or risk of an investment compared to the market as a whole. Alpha describes an
investment strategy’s ability to beat the market. The Morningstar Style Map uses proprietary scores of a stock’s value
and growth characteristics to determine its placement in one of the five categories listed on the horizontal axis. These characteristics
are then compared to those of other stocks within the same market capitalization band. Each is scored from zero to 100 for both
value and growth attributes. The value score is subtracted from the growth score to determine the overall style score. For
the vertical, market cap axis, Morningstar subdivides into size groups. Giant-cap stocks are defined as those that account for
the top 40% of the capitalization of each style zone; large-cap stocks represent the next 30%; mid-cap stocks the next 20%; small-cap
stocks the next 7%; micro-cap stocks the smallest 3%. For the Morningstar Small Blend Category: © 2024 Morningstar. All Rights Reserved.
The information regarding the category in this piece is: (1) is proprietary to Morningstar and/or its content providers;
(2) may not be copied or distributed; and (3) is not warranted to be accurate, complete or timely. Neither Morningstar nor its
content providers are responsible for any damages or losses arising from any use of this information. Cyclical and Defensive are
defined as follows: Cyclical: Communication Services, Consumer Discretionary, Energy, Financials, Industrials, Information Technology,
and Materials. Defensive: Consumer Staples, Health Care, Real Estate, and Utilities. Return on Invested Capital is calculated
by dividing a company’s past 12 months of operating income (earnings before interest and taxes) by its average invested
capital (total equity, less cash and cash equivalents, plus total debt, minority interest, and preferred stock). The Royce Funds
is a service mark of The Royce Funds.
Investment
Objectives
The
investment objective of each Fund is long-term growth of capital.
Investment
Policies
Royce
Global Value Trust, Inc. (“RGT”). Under normal circumstances, RGT will invest at least 80% of its net assets in
equity securities, such as common stock and preferred stock. RGT generally invests a significant portion of its assets U.S. and
non-U.S. small/mid-cap stocks (generally market caps up to $10 billion). Under normal circumstances, at least 40% of RGT’s
net assets will be invested in the equity securities of companies headquartered in at least three countries outside
the United States. From time to time, a substantial portion of RGT’s assets may be invested in companies located in a single
country. Although there are no geographic limits on RGT’s investments, no more than 35% of RGT’s net assets may be
invested in the securities of companies headquartered in “developing countries,” also known as emerging markets.
Generally, developing countries include every country in the world other than the United States, Canada, Japan, Australia, New
Zealand, Hong Kong, Singapore, South Korea, Taiwan, Bermuda, and Western European countries (which include, Austria, Belgium,
Denmark, France, Finland, Germany, Greece, Ireland, Italy, Luxembourg, the Netherlands, Norway, Portugal, Spain, Sweden,
Switzerland and the United Kingdom).
Effective
May 1, 2024, RGT’s name will change from “Royce Global Value Trust, Inc.” to “Royce Global Trust, Inc.”
There will be no changes to RGT’s investment policies or restrictions in connection with such name change.
Royce Micro-Cap Trust, Inc. (“RMT”).
RMT normally invests at least 80% of its net assets in the equity securities of micro-cap companies. Micro-cap companies are
those that have a market
This page is not part of the 2023 Annual Report to Stockholders | 65
Notes
to Performance and Other Important Information (continued)
capitalization
not greater than that of the largest company in the Russell Microcap® Index at the time of its most recent reconstitution.
Royce employs a core approach that combines multiple investment themes and focuses on companies with strong fundamentals and/
or prospects selling at prices that Royce believes do not fully reflect these attributes. RMT may invest up to 25% of its assets
in securities of issuers headquartered outside the United States.
Royce
Value Trust, Inc. (“RVT”). RVT normally invests at least 65% of its assets in the equity securities of small-
and micro-cap companies. Such companies are those that have a market capitalization not greater than that of the largest company
in the Russell 2000® Index at the time of its most recent reconstitution. Royce employs a core approach
that combines multiple investment themes and focuses on companies with high returns on invested capital or those with strong fundamentals
and/or prospects trading at what Royce believes are attractive valuations. A portion of the Fund’s assets is managed using
a systematic multi-factor selection process that is derived from the investment philosophies used by the Fund’s Portfolio
Managers in managing the remainder of the Fund. While this multi-factor process provides guidance, a Portfolio Manager has
discretion for which buys and sells are executed. RVT may invest up to 25% of its assets in securities of issuers headquartered
outside the United States.
Effective
May 1, 2024, RVT’s name will change from “Royce Value Trust, Inc.” to “Royce Small-Cap Trust, Inc.”
Under its current investment policies, RVT normally invests at least 65% of its assets in the equity securities of small- and
micro-cap companies. Such investment policy will be amended as of May 1, 2024 to require RVT to invest, under
normal circumstances, at least 80% of the value of its net assets in equity securities of small-cap companies (i.e., those that
have a market capitalization not greater than that of the largest company in the Russell 2000® Index at the time
of its most recent reconstitution).
Primary
Risks
As
with any closed-end fund that invests in common stocks, each Fund is subject to market risk—the possibility that common
stock prices will decline over short and/or extended periods of time due to overall market, financial, and economic conditions,
trends, or events, governmental or central bank actions or interventions, changes in investor sentiment, armed conflicts, economic
sanctions and countermeasures in response to sanctions, market disruptions caused by trade disputes or other factors, political
developments, major cybersecurity events and acts of terrorism, the global and domestic effects of a pandemic or epidemic, contagion
effects on the finance sector and the overall economy from banking industry instability, and other factors that may or may not be
directly related to the issuer of a security held by a Fund. Economies and financial markets throughout the world are increasingly
interconnected, and economic, financial, or political events in one country or region could have profound impacts on global economies
or markets. The COVID-19 pandemic and its subsequent variants, Russia’s invasion of Ukraine, Middle East conflicts, and banking
industry instability may adversely affect global economies, markets, industries, and individual companies in ways that cannot necessarily
be foreseen. As a result, the value of your investment in a Fund will fluctuate, sometimes sharply and unpredictably, and you could
lose money over short and/or long periods of time.
Investors
wanting to buy or sell shares of a Fund must do so on a stock exchange, as with any publicly traded stock. Shares of closed-end
funds frequently trade at a discount to their net asset value. This is in contrast to open-end mutual funds, which sell and redeem
their shares at net asset value on a continuous basis.
The
prices of equity securities of the smaller companies in which the Funds invest are generally more volatile than those of larger-cap
securities. In addition, because these securities tend to have significantly lower trading volumes than larger-cap securities,
the Funds may have difficulty selling holdings or may only be able to sell holdings at prices substantially lower than what Royce
believes they are worth. Therefore, each Fund may involve considerably more risk of loss and its returns may differ significantly
from funds investing in larger-cap companies or other asset classes. No assurance can be given that there will be net investment
income to distribute and/or that the Funds will achieve their investment goals.
Investment
in foreign securities involves risks that may not be encountered in U.S. investments, including adverse political, social, economic,
or other developments that are unique to a particular region or country. Prices of foreign securities in particular countries
or regions may, at times, move in a different direction and/or be more volatile than those of U.S. securities. Each Fund’s
investments are usually denominated in or tied to the currencies of the countries in which they are primarily traded. Because
the Funds do not intend to hedge their foreign currency exposure, the U.S. dollar value of the Funds’ investments may be
harmed by declines in the value of foreign currencies in relation to the U.S. dollar. This may occur even if the value
of the investment in the currency’s home country has not declined. These risk factors may affect the prices of foreign securities
issued by companies headquartered in developing countries more than those headquartered in developed countries. For example, many
developing countries have in the past experienced high rates of inflation or sharply devalued their currencies against the U.S.
dollar, thereby causing the value of investments in companies located in those countries to decline. Transaction costs are often
higher in developing countries, and there may be delays in settlement procedures. To the extent that a Fund’s investments
in the securities of international companies consists of non-U.S. headquartered companies that trade on a U.S. exchange, some
or all of the above stated risks of investing in international companies may not apply.
Each
Fund may, from time to time, invest a significant portion of its assets in companies from a single sector or a limited number of
sectors. Such an investment approach may involve considerably more risk to investors than one that is more broadly diversified
across economic sectors because it may be more susceptible to corporate, economic, political, regulatory, or market events that
adversely affect the relevant sector(s). As of December 31, 2023, RGT invested a significant portion of its assets in companies
from the Industrials sector. Industrials sector companies can be significantly affected by general economic trends, commodity prices,
legislation, government regulation and spending, import and export controls, worldwide competition, changes in consumer sentiment
and spending, and liability for environmental damage, depletion of resources, and mandated expenditures for safety and pollution
control.
Royce’s
estimate of a company’s current worth may prove to be inaccurate, or this estimate may not be recognized by other investors,
which could lead to portfolio losses or underperformance relative to similar funds and/or a Fund’s benchmark index(es). Securities
in the Funds’ portfolios may not increase as much as the market as a whole and some securities may continue to be undervalued
for long periods of time or may never reach what Royce believes are their full market values. Investments in a Fund are not bank
deposits and are not insured or guaranteed by the Federal Deposit Insurance Corporation or any other government agency.
Environmental,
Social, and Governance (“ESG”) Investment Considerations and Risks
Royce
believes certain material ESG factors have the potential to contribute to a stock’s long-term performance, and therefore Royce
may evaluate potential ESG considerations when assessing a company’s financial condition and profitability. This analysis
allows Royce’s portfolio managers to determine whether a company’s ESG
66 | This page is not part of the 2023 Annual Report to Stockholders
Notes to Performance and Other
Important Information (continued)
profile
poses a material financial risk or creates an opportunity for investment. The Funds’ investments in cash and cash equivalents
and any securities rehypothecation activities will not be assessed for ESG factors. Evaluation of ESG risk is only one component
of Royce’s assessment of potential investments and, as with its consideration of other factors and risks, may not be a determinative
factor in any decision to purchase, sell, or hold a security. In addition, where ESG factors are considered, the weight given
to ESG factors may vary between Funds and across different types of investments, sectors, industries, regions, and issuers; and
ESG factors and weights considered may change over time. Royce may not assess every investment for ESG factors and, when it does,
not every ESG factor may be identified or evaluated. Royce’s assessment of a company’s ESG factors is subjective and
may differ from that of institutional investors, third-party service providers (e.g., ratings providers), and/ or other funds,
and may be dependent on the availability of timely, complete, and accurate ESG data reports from issuers and/ or third-party
research providers, the timeliness, completeness, and accuracy of which is outside of Royce’s control. ESG factors are often
not uniformly measured or defined, which could impact Royce’s ability to evaluate a company. While Royce views certain ESG
factors as having the potential to contribute to a stock’s long-term performance, there is no guarantee that such results
will be achieved.
Forward-Looking
Statements
This
material contains forward-looking statements within the meaning of the Securities Exchange Act of 1934, as amended (the “Exchange
Act”), that involve risks and uncertainties, including, among others, statements as to:
| • | the
Funds’ future operating results |
| • | the
prospects of the Funds’ portfolio companies |
| • | the
impact of investments that the Funds have made or may make |
| • | the
dependence of the Funds’ future success on the general economy and its impact on
the companies and industries in which the Funds invest, and |
| • | the
ability of the Funds’ portfolio companies to achieve their objectives. |
This
Review and Report uses words such as “anticipates,” “believes,” “expects,” “future,”
“intends,” and similar expressions to identify forward-looking statements. Actual results may differ materially from
those projected in the forward-looking statements for any reason.
The
Royce Funds have based the forward-looking statements included in this Review and Report on information available to us
on the date of the report, and we assume no obligation to update any such forward-looking statements. Although The Royce Funds
undertake no obligation to revise or update any forward-looking statements, whether as a result of new information, future events
or otherwise, you are advised to consult any additional disclosures that we may make through future stockholder communications
or reports.
Authorized
Share Transactions
Royce
Global Value Trust, Royce Micro-Cap Trust, and Royce Value Trust may each repurchase up to 5% of the issued and outstanding shares
of its respective common stock during the year ending December 31, 2023. Any such repurchases would take place at then prevailing
prices in the open market or in other transactions. Common stock repurchases would be effected at a price per share that is less
than the share’s then current net asset value.
Royce
Global Value Trust, Royce Micro-Cap Trust, and Royce Value Trust are also authorized to offer their common stockholders an opportunity
to subscribe for additional shares of their common stock through rights offerings at a price per share that may be less than the
share’s then current net asset value. The timing and terms of any such offerings are within each Board’s discretion.
Annual
Certifications
As
required, the Funds have submitted to the New York Stock Exchange (“NYSE”) for the annual certification of the Funds’
Chief Executive Officer that he is not aware of any violation of the NYSE’s listing standards. The Funds also have included
the certification of the Funds’ Chief Executive Officer and Chief Financial Officer required by section 302 of the
Sarbanes-Oxley Act of 2002 as exhibits to the Funds’ form N-CSR for the period ended December 31, 2022, filed with the Securities
and Exchange Commission.
Proxy
Voting
A
copy of the policies and procedures that The Royce Funds use to determine how to vote proxies relating to portfolio securities
and information regarding how each of The Royce Funds voted proxies relating to portfolio securities during the most recent 12-month
period ended June 30 is available, without charge, on The Royce Funds’ website at www.royceinvest.com, by calling (800)
221-4268 (toll-free) and on the website of the Securities and Exchange Commission (“SEC”), at www.sec.gov.
Disclosure
of Portfolio Holdings
The
Funds’ complete portfolio holdings are also available on Exhibit F to Form N-PORT, which filings are made with the SEC within
60 days of the end of the first and third fiscal quarters. The Funds’ Form N-PORT filings are available on the SEC’s
website at http://www.sec.gov.
This page is not part of the 2023 Annual Report to Stockholders | 67
Results of Stockholders Meetings
Royce
Value Trust, Inc.
At
the 2023 Annual Meeting of Stockholders held on September 25, 2023, the Fund’s stockholders elected two Directors, consisting
of:
| |
VOTES
FOR |
VOTES
WITHHELD |
| Christopher
D. Clark |
91,671,340 |
1,734,117 |
| Christopher
C. Grisanti |
91,202,349 |
2,203,109 |
Royce
Micro-Cap Trust, Inc.
At
the 2023 Annual Meeting of Stockholders held on September 25, 2023, the Fund’s stockholders elected two Directors, consisting
of:
| |
VOTES
FOR |
VOTES
WITHHELD |
| Christopher
D. Clark |
37,166,779 |
1,576,094 |
| Christopher
C. Grisanti |
36,848,834 |
1,894,039 |
Royce
Global Value Trust, Inc.
At
the 2023 Annual Meeting of Stockholders held on September 25, 2023, the Fund’s stockholders elected two Directors, consisting
of:
| |
VOTES
FOR |
VOTES
WITHHELD |
| Christopher
D. Clark |
4,934,973 |
382,243 |
| Christopher
C. Grisanti |
4,925,753 |
391,463 |
68 | This page is not part of the 2023 Annual Report to Stockholders


About Royce Investment Partners
Unparalleled Knowledge + Experience
Pioneers in small-cap investing, with 50+ years
of experience, depth of knowledge, and focus.
Independent Thinking
The confidence to go against consensus, the insight
to uncover opportunities others might miss, and the
tenacity to stay the course through market cycles.
Specialized Approaches
U.S., international, and global investment strategies
that pursue approaches with different risk profiles.
Unwavering Commitment
Our team of 17 portfolio managers has significant
personal investments in the strategies they manage.
Contact Us
GENERAL INFORMATION
General Royce Funds information including an
overview of our firm and Funds
(800) 221-4268
COMPUTERSHARE
Transfer Agent and Registrar
Speak with a representative about:
| • | Your account, transactions, and forms |
(800) 426-5523
FINANCIAL ADVISORS AND BROKER-DEALERS
Speak with your regional Royce contact regarding:
| • | Information about our firm, strategies, and Funds |
(800) 337-6923
CE-REP-1223
Item 2. Code(s) of Ethics. As of the end of the period covered by this report, the Registrant had adopted a code of ethics, as defined in Item 2 of Form N-CSR, applicable to its principal executive officer, principal financial officer, principal accounting officer or controller, or persons performing similar functions. A copy of this code of ethics is filed as an exhibit to this Form N-CSR. During the period covered by this report, the Registrant did not: (i) amend any provision of its code of ethics that applies to its principal executive officer, principal financial officer, principal accounting officer or controller, or persons performing similar functions or (ii) grant any waiver, including an implicit waiver, from a provision of such code of ethics to its principal executive officer, principal financial officer, principal accounting officer or controller, or persons performing similar functions.
| Item 3. | Audit Committee Financial Expert. |
| (a)(1) | The Board of Directors of
the Registrant has determined that it has an audit committee financial expert serving
on its audit committee. |
| (a)(2) | Arthur S. Mehlman,1
Patricia W. Chadwick, and Julia W. Poston2
were designated by the Board of Trustees as the Registrant’s Audit
Committee Financial Experts, effective April 15, 2004, April 8, 2010, and July 13, 2023,
respectively. Mr. Mehlman, Ms. Chadwick, and Ms. Poston are “independent”
as defined in Section 2(a)(19) of the Investment Company Act of 1940 (the “1940
Act”). |
| Item 4. | Principal Accountant Fees and Services. |
Year ended December 31,
2023 - $24,113
Year ended December 31, 2022
- $22,748
Year ended December 31,
2023 - $0
Year ended December 31, 2022
- $0
Year ended December 31, 2023 - $10,863 - Preparation
of tax returns
Year ended December 31, 2022
- $10,248 - Preparation of tax returns
Year ended December 31,
2023 - $0
Year ended December 31, 2022
- $0
| (e)(1) | Annual Pre-Approval: On an
annual basis, the Registrant’s independent auditor submits to the Audit Committee
a schedule of proposed audit, audit-related, tax and other non-audit services to be rendered
to the Registrant and/or its investment adviser and its affiliates for the following
year that require pre-approval by the Audit Committee. This schedule provides a description
of each type of service that is expected to require pre-approval and the maximum fees
that can be paid for each such service without further Audit Committee approval. The
Audit Committee then reviews and determines whether to approve the types of scheduled
services and the projected fees associated with them. Any subsequent revision to already
pre-approved services or fees are presented for consideration at the next regularly scheduled
Audit Committee meeting, as needed. |
If subsequent to the annual
pre-approval of services and fees by the Audit Committee, the Registrant and/or its investment adviser and its affiliates determines
that it would like to engage the Registrant’s independent auditor to perform a service not already pre-approved, the request
is to be submitted to the Registrant’s Chief Financial Officer, and if he or she determines that the service fits within
the independence guidelines (i.e., it is not a prohibited service), he or she will then arrange for a discussion of the proposed
service and fee to be included on the agenda for the next regularly scheduled Audit Committee meeting so that pre-approval can
be considered.
1 Retired as Director effective
as of the close of business December 31, 2023.
2 Became a Director effective
as of the close of business on July 12, 2023.
Interim Pre-Approval:
If, in the judgment of the Registrant’s Chief Financial Officer, a proposed engagement needs to commence before the next regularly
scheduled Audit Committee meeting, he or she shall submit a written summary of the proposed engagement to all members of the Audit
Committee, outlining the services, the estimated maximum cost, the category of the services (e.g., audit, audit-related, tax or
other) and the rationale for engaging the Registrant’s independent auditor to perform the services. To the extent the proposed
engagement involves audit, audit-related or tax services, any individual member of the Audit Committee who is an independent Board
member is authorized to pre-approve the engagement. To the extent the proposed engagement involves non-audit services other than
audit-related or tax, only the Chairman of the Audit Committee is authorized to pre-approve the engagement. The Registrant’s
Chief Financial Officer will arrange for this interim review and coordinate with the appropriate member(s) of the Audit Committee.
The Registrant’s independent auditor may not commence the engagement under consideration until the Registrant’s Chief
Financial Officer has informed the auditor in writing that the required pre-approval has been obtained from an individual member
of the Audit Committee who is an independent Board member or the Chairman of the Audit Committee, as applicable. Each member of
the Audit Committee who pre-approves any engagements in between regularly scheduled Audit Committee meetings is to report, for
informational purposes only, any pre-approval decisions to the Audit Committee at its next regularly scheduled meeting.
| (g) | Year ended December 31, 2023 - $10,863 |
Year ended December 31,
2022 - $10,248
| (h) | No such services were rendered
during 2023 or 2022. |
Item 5. Audit Committee of Listed Registrants.
The Registrant has a separately designated standing audit committee established in accordance with Section 3(a)(58)(A) of
the Securities Exchange Act of 1934 (the “Exchange Act”). Patricia W. Chadwick, Christopher C. Grisanti, Cecile B.
Harper, Arthur S. Mehlman, G. Peter O’Brien, and Michael K. Shields are members of the Registrant’s audit committee.
Item 6. Investments.
Item 7. Disclosure of Proxy Voting Policies and Procedures
for Closed-End Management Investment Companies.
Royce & Associates, LP (“Royce”)
has adopted written proxy voting policies and procedures (the “Proxy Voting Procedures”) for itself and client accounts
for which Royce is responsible for voting proxies, including the Registrant. Royce is generally granted proxy voting authority
at the inception of its management of each client account. Proxy voting authority is generally either (i) specifically authorized
in the applicable investment management agreement or other instrument; or (ii) where not specifically authorized, is granted to
Royce where general investment discretion is given to Royce in the applicable investment management agreement. In voting proxies,
Royce is guided by general fiduciary principles. Royce’s goal is to act prudently, solely in the best interest of the beneficial
owners of the accounts it manages. Royce attempts to consider all factors of its vote that could affect the value of the investment
and will vote proxies in the manner it believes will be consistent with efforts to enhance and/or protect stockholder value. When
a client has authorized Royce to vote proxies on its behalf, Royce will generally not accept instructions from the client regarding
how to vote proxies.
Royce’s personnel are responsible
for monitoring receipt of all proxies and seeking to ensure that proxies are received for all securities for which Royce has proxy
voting authority. Royce is not responsible for voting proxies it does not receive. Royce divides proxies into “regularly recurring”
and “non-regularly recurring” matters. Examples of regularly recurring matters include non-contested elections of directors
and non-contested approvals of independent auditors. Royce’s personnel are responsible for developing and maintaining a list
of matters Royce treats as “regularly recurring” and for ensuring that instructions from a Royce Co-Chief Investment
Officer are followed when voting those matters on behalf of Royce clients. Non-regularly recurring matters are all other proxy
matters and are brought to the attention of the relevant portfolio manager(s) for the applicable account(s). After giving consideration
to advisories provided by an independent third-party research firm with respect to such non-regularly recurring matters, the portfolio
manager(s) directs that such matters be voted in a way that he or she believes should better protect or enhance the value of the
investment. Certain Royce portfolio managers may provide instructions that they do not want regularly recurring matters to be voted
in accordance with the standing instructions for their accounts and individual voting instructions on all matters, both regularly
recurring and non-regularly recurring, will be obtained from such portfolio managers.
Notwithstanding the above, all matters
identified by an independent third-party research firm as being “ESG” proposals are brought to the attention of the
portfolio manager(s) for the account(s) involved by Royce personnel. After giving consideration to the recommendation from the
independent third-party research firm, the portfolio manager will direct that such matters be voted in a way he or she believes
appropriately takes into account environmental and social issues alongside traditional financial measures to provide a more comprehensive
view of the value, risk, and return potential of an investment. When Royce portfolio managers cast votes on “ESG” proposals,
they take into account the risk that companies may face significant financial, legal, and reputational risks resulting from poor
environmental and social practices, or negligent oversight of environmental or social issues.
Under certain circumstances, Royce may
also vote against a proposal from the issuer’s board of directors or management. Royce’s portfolio managers decide these issues
on a case-by-case basis. These would include, among others, excessive compensation, unusual management stock options, preferential
voting, and poison pills. Royce’s portfolio managers decide these issues on a case-by-case basis. In addition, a Royce portfolio
manager may, on occasion, decide to abstain from voting a proxy or a specific proxy item when such person concludes that the potential
benefit of voting is outweighed by the cost or when it is not in the client’s best interest to vote. From time to time, it is also
possible that one Royce portfolio manager will decide: (i) to vote shares held in client accounts he or she manages differently
from the vote of another Royce portfolio manager whose client accounts hold the same security or (ii) to abstain from voting on
behalf of client accounts he or she manages when another Royce portfolio manager is casting votes on behalf of other Royce client
accounts.
There may be circumstances where Royce
may not be able to vote proxies in a timely manner, including, but not limited to, (i) when certain securities are out on loan
at the time of a record date; (ii) when administrative or operational constraints impede Royce’s ability to cast a timely
vote, such as late receipt of proxy voting information; and/or (iii) when systems, administrative or processing errors occur (including
errors by Royce or third-party vendors).
To further Royce’s goal to vote proxies
in the best interests of its client, Royce follows specific procedures outlined in the Proxy Voting Procedures to identify, assess
and address material conflicts that may arise between Royce’s interests and those of its clients before voting proxies on behalf
of such clients. In the event such a material conflict of interest is identified, the proxy will be voted by Royce in accordance
with the recommendation given by an independent third-party research firm.
You may obtain a copy of the Proxy Voting
Procedures at www.roycefunds.com or by calling 212-508-4500. Additionally, you can obtain information on how your securities were
voted by calling 212-508-4500.
Item 8. Portfolio Managers of Closed-End Management Investment
Companies.
(a)(1) Portfolio Managers of Closed-End
Management Investment Companies (information as of December 31, 2023).
| Name |
Title |
Length of Service |
Principal Occupation(s) During Past 5 Years |
| Charles
M. Royce |
Portfolio Manager |
Since
October 2013 |
Chairman of the Board of Managers of Royce, Member of the boards of directors/trustees of the Registrant, Royce Micro-Cap Trust, Inc. (“RMT”), Royce Value Trust, Inc. (“RVT”), The Royce Fund, and Royce Capital Fund (collectively, “The Royce Funds”). |
(a)(2) Other Accounts Managed by Portfolio Manager and Potential
Conflicts of Interest (information as of December 31, 2023).
Other Accounts
Name of Portfolio
Manager |
Type of Account |
Number of Accounts
Managed |
Total
Assets
Managed |
Number of Accounts
Managed for which
Advisory Fee is
Performance-Based |
Value of Managed
Accounts for which
Advisory Fee is
Performance
Based |
| Charles M. Royce |
|
|
|
|
|
| |
Registered investment companies |
8 |
$6,881,012,687 |
2 |
$2,384,471,742 |
| |
Private pooled investment vehicles |
5 |
$117,611,661 |
— |
— |
| |
Other accounts* |
13 |
$65,302,029 |
— |
— |
*Other accounts include all other accounts
managed by the Portfolio Manager in either a professional or personal capacity except for personal accounts subject to pre-approval
and reporting requirements under the Registrant’s Rule 17j-1 Code of Ethics.
Conflicts of Interest
The fact that a Portfolio
Manager has day-to-day management responsibility for more than one client account may create actual, potential or only apparent
conflicts of interest. For example, the Portfolio Manager may have an opportunity to purchase securities of limited availability.
In this circumstance, the Portfolio Manager is expected to review each account’s investment guidelines, restrictions, tax considerations,
cash balances, liquidity needs and other factors to determine the suitability of the investment for each account and to ensure
that his or her managed accounts are treated equitably.
The Portfolio Manager
may also decide to purchase or sell the same security for multiple managed accounts at approximately the same time. To address
any conflicts that this situation may create, the Portfolio Manager will generally combine managed account orders (i.e., enter
a “bunched” order) in an effort to obtain best execution or a more favorable commission rate. In addition, if orders
to buy or sell a security for multiple accounts managed by common Portfolio Managers on the same day are executed at different
prices or commission rates, the transactions will generally be allocated by Royce to each of such managed accounts at the weighted
average execution price and commission. In circumstances where a pre-allocated bunched order is not completely filled, each account
will normally receive a pro-rated portion of the securities based upon the account’s level of participation in the order, subject
to Royce’s minimum ticket size requirements. Royce may, under certain circumstances, allocate securities in a manner other
than pro-rata if it determines that the allocation is fair and equitable under the circumstances and does not discriminate against
any account. In addition, on a limited, infrequent basis, and in accordance with written procedures, Royce may change initial allocations
from one Royce client account to another Royce client account prior to the booking of the trade on the day after trade date when:
(i) it is determined that a security is unsuitable or inappropriate for a particular Royce client account in the original allocation;
(ii) there is insufficient cash in a Royce client account to which a security is initially allocated; (iii) there is a client-imposed
restriction on the purchase of the security being allocated; or (iv) the Portfolio Manager has decided to change the initial allocation
for some other reason.
As described below,
there is a revenue-based component of each Portfolio Manager’s Performance-Related Variable Compensation, and the Portfolio Managers
also receive Firm-Related Variable Compensation based on revenues (adjusted for certain imputed expenses) generated by Royce. In
addition, Charles M. Royce receives variable compensation based on Royce’s retained pre-tax profits from operations. As a result,
the Portfolio Manager may receive a greater relative benefit from activities that increase the value to Royce of The Royce Funds
and/or other Royce client accounts, including, but not limited to, increases in sales of Registrant’s shares and assets under
management.
Also, as described
above, the Portfolio Managers generally manage more than one client account, including, among others, registered investment company
accounts, separate accounts and private pooled accounts managed on behalf of institutions (e.g., pension funds, endowments and
foundations) and for high-net-worth individuals. The appearance of a conflict of interest may arise where Royce has an incentive,
such as a performance-based management fee (or any other variation in the level of fees payable by the Registrant or other Royce
client accounts to Royce), which relates to the management of one or more of The Royce Funds or accounts with respect to which
the same Portfolio Manager has day-to-day management responsibilities. Except as described below, no Royce Portfolio Manager’s
compensation is tied to performance fees earned by Royce for the management of any one client account. Although variable and other
compensation derived from Royce revenues or profits is impacted to some extent, the impact is relatively minor given the small
percentage of Royce firm assets under management for which Royce receives performance-measured revenue. Notwithstanding the above,
the Performance-Related Variable Compensation paid to Charles M. Royce, as Portfolio Manager of two registered investment company
accounts (RVT and RMT), is based, in part, on performance-based fee revenues. RVT and RMT pay Royce a fulcrum fee that is adjusted
up or down depending on the performance of the Fund relative to its benchmark index.
Finally, conflicts
of interest may arise when a Portfolio Manager personally buys, holds or sells securities held or to be purchased or sold for the
Registrant or other Royce client account or personally buys, holds or sells the shares of one or more of The Royce Funds. To address
this, Royce has adopted a written Code of Ethics designed to prevent and detect personal trading activities that may interfere
or conflict with client interests (including Registrant’s stockholders’ interests). Royce generally does not permit
its Portfolio Managers to purchase small- or micro-cap securities for their personal investment portfolios.
Royce and The Royce
Funds have adopted certain compliance procedures which are designed to address the above-described types of conflicts. However,
there is no guarantee that such procedures will detect each and every situation in which a conflict arises.
(a)(3) Description of Portfolio Manager
Compensation Structure (information as of December 31, 2023)
Royce
seeks to maintain a compensation program that is competitively positioned to attract and retain high-caliber investment professionals.
All Portfolio Managers receive from Royce a base salary, Portfolio-Related Variable Compensation (generally the largest element
of each Portfolio Manager’s compensation with the exception of Charles M. Royce), Firm-Related Variable Compensation based
primarily on registered investment company and other client account revenues generated by Royce and a benefits package. Portfolio
Manager compensation is reviewed and may be modified from time to time as appropriate to reflect changes in the market, as well
as to adjust the factors used to determine variable compensation. Except as described below, each Portfolio Manager’s compensation
consists of the following elements:
| - | BASE SALARY. Each Portfolio Manager is paid a base salary.
In setting the base salary, Royce seeks to be competitive in light of the particular Portfolio Manager’s experience and
responsibilities. |
| - | PORTFOLIO-RELATED VARIABLE COMPENSATION. Each Portfolio
Manager receives quarterly Portfolio-Related Variable Compensation that is either asset-based, or revenue-based and therefore
in part based on the value of the net assets of the account for which he or she is being compensated, determined with reference
to each of the registered investment company and other client accounts they are managing. The revenue used to determine the quarterly
Portfolio-Related Variable Compensation received by Charles M. Royce that relates to each of RMT and RVT is performance-based
fee revenue. |
Payment
of the Portfolio-Related Variable Compensation may be deferred, and any amounts deferred are forfeitable, if the Portfolio Manager
is terminated by Royce with or without cause or resigns. The amount of the deferred Portfolio-Related Variable Compensation will
appreciate or depreciate during the deferral period, based on the total return performance of one or more Royce-managed registered
investment company accounts selected by the Portfolio Manager at the beginning of the deferral period. The amount deferred will
depend on the Portfolio Manager’s total direct, indirect beneficial and deferred unvested investments in the Royce registered
investment company accounts for which he or she is receiving portfolio management compensation.
| - | FIRM-RELATED VARIABLE COMPENSATION. Portfolio Managers
receive quarterly variable compensation based on Royce’s net revenues. |
| - | BENEFIT PACKAGE. Portfolio Managers also receive benefits
standard for all Royce employees, including health care and other insurance benefits, and participation in Royce’s 401(k)
Plan and Money Purchase Pension Plan. Each Royce employee, including each Portfolio Manager, is also eligible to purchase shares
of Franklin Resources, Inc. at a 15% discount to its closing price on certain dates in accordance with the terms and conditions
of the Franklin Templeton Employee Stock Investment Plan. |
(a)(4) Dollar Range of Equity Securities
in Registrant Beneficially Owned by Portfolio Manager (information as of December 31, 2023).
The following table
shows the dollar range of the Registrant’s shares owned beneficially and of record by the Portfolio Managers, including investments
by his immediate family members sharing the same household and amounts invested through retirement and deferred compensation plans.
| Portfolio
Manager |
Dollar
Range of Registrant’s Shares Beneficially Owned |
| Charles M. Royce (Portfolio Manager) |
Over $1,000,000 |
(b) Not Applicable
Item 9. Purchases of Equity Securities by Closed-End Management
Investment Company and Affiliated Purchasers. Not Applicable
Item 10. Submission of Matters to a Vote of Security Holders.
Not Applicable.
Item 11. Controls and Procedures.
(a) Disclosure Controls and Procedures.
The Principal Executive and Financial Officers concluded that the Registrant’s Disclosure Controls and Procedures are effective
based on their evaluation of the Disclosure Controls and Procedures as of a date within 90 days of the filing date of this report.
(b) Internal Control over Financial Reporting.
There were no significant changes in Registrant’s internal control over financial reporting or in other factors that could significantly
affect this control subsequent to the date of the evaluation, including any corrective actions with regard to significant deficiencies
and material weaknesses during the period covered by this report.
Item 12. Disclosure of Securities Lending
Activities for Closed-End Management Investment Companies. The Fund is party to a revolving credit agreement (the “Credit
Agreement”) with BNP Paribas Prime Brokerage International Limited (“BNPPI”). The Credit Agreement permits, subject
to certain conditions, BNPPI to rehypothecate portfolio securities pledged by the Fund up to the amount of the loan balance outstanding.
The Fund receives a portion of the fees earned by BNPPI in connection with the rehypothecation of portfolio securities. For more
information, see “Borrowings” in the Notes to the Fund’s Financial Statements.
Item 13. Exhibits. Attached hereto.
(a)(1) The Registrant’s code of ethics pursuant to Item 2 of Form N-CSR.
(a)(2) Separate certifications by the Registrant’s Principal Executive Officer and Principal Financial Officer as required by Rule 30a-2(a) under the 1940 Act.
(a)(3) Not Applicable
(b) Separate certifications by the Registrant’s Principal Executive Officer and Principal Financial Officer, pursuant to Section 906 of the Sarbanes-Oxley Act of 2002 and required by Rule 30a-2(b) under the 1940 Act.
[Signature page to follow.]
Pursuant to the requirements of the Exchange
Act and the 1940 Act, the registrant has duly caused this report to be signed on its behalf by the undersigned, thereunto duly
authorized.
ROYCE GLOBAL VALUE TRUST, INC.
| BY: |
/s/Christopher D. Clark |
|
| Christopher D. Clark |
| President |
Date: February 24, 2024
Pursuant to the requirements of the Exchange
Act and the 1940 Act, this report has been signed below by the following persons on behalf of the registrant and in the capacities
and on the dates indicated.
| ROYCE GLOBAL VALUE TRUST, INC. |
|
ROYCE GLOBAL VALUE TRUST,
INC. |
|
| |
|
|
|
|
|
| BY: |
/s/Christopher D. Clark |
|
BY: |
/s/Peter K. Hoglund |
|
| Christopher D. Clark |
|
Peter K. Hoglund |
|
| President |
|
Treasurer |
|
| |
|
|
|
| Date: February 24, 2024 |
|
Date: February 24, 2024 |
|
EXHIBITS
Item 12(a)(1):
| |
September 2003, as revised December 31, 2023 |
CODE OF ETHICS
FOR COVERED OFFICERS OF THE ROYCE FUNDS
The Boards of Directors/Trustees
of The Royce Fund, Royce Capital Fund, Royce Value Trust, Inc., Royce Micro-Cap Trust, Inc., and Royce Global Value Trust, Inc.
(each, a “Fund” and collectively, “The Royce Funds”) have adopted the following Code of Ethics (the “Code”)
applicable to its President, Chief Financial Officer, Manager of Fund Accounting, and any other person deemed to perform similar
functions (“Covered Officers”) of The Royce Funds to ensure the continuing integrity of financial reporting and transactions.
The names of the Covered Officers covered by the Code are listed on Schedule A hereto.
This Code is the sole code
of ethics adopted by the Funds for purposes of Section 406 of the Sarbanes-Oxley Act of 2002. The Funds’ and Royce Investment
Partners (“Royce”), the investment adviser to The Royce Funds, code of ethics under Rule 17j-1 under the Investment
Company Act of 1940 (the “Investment Company Act”) are separate requirements applying to the Covered Officers and others,
and are not part of this Code. In addition to this Code, the Investment Company Act, and the Investment Advisers Act of 1940 (the
“Advisers Act”) and rules promulgated thereunder contain numerous specific provisions designed to protect the Funds
from conflicts of interest and overreaching. Any conduct by Covered Officers required by specific Investment Company Act or Advisers
Act provisions or the rules thereunder is presumed to be in compliance with this Code. Each Covered Officer is accountable for
his or her adherence to this Code. Any violation of this Code by a Covered Officer may result in disciplinary action, including
immediate dismissal.
All Covered Officers must:
| 1. | Engage in and promote honest and ethical conduct, including the ethical handling
of actual or apparent conflicts of interest between personal and professional relationships; |
| 2. | Act responsibly in producing and produce, full, fair, accurate, timely and
understandable disclosure in reports and documents that the Funds file with, or submit to, the Securities and Exchange Commission
(the “SEC”) and in other public communications made by each of the Funds; |
| 3. | Comply with applicable governmental laws, rules and regulations; |
| 4. | Promptly report suspected material violations of this Code, including violations
of securities laws or other laws, rules and regulations applicable to a Fund, to Royce’s General Counsel and the Fund’s
Audit Committee. |
Each Covered Officer must
act with integrity, including being honest and candid while still maintaining the confidentiality of information where required
by law, and place the interests of The Royce Funds before the Covered Officer’s own personal interests.
Each Covered Officer is
required to familiarize himself or herself with the disclosure requirements applicable to each of the Funds and must not knowingly
misrepresent or fail to disclose, or cause others to misrepresent or fail to disclose, material facts about a Fund to others, including
but not limited to officers of and counsel to The Royce Funds, and their respective independent directors, independent auditors
and governmental regulators.
| III. | Avoidance of Conflicts |
The overarching principle of
this Code is that the personal interests of a Covered Officer should not be placed improperly before the interests of The Royce
Funds. As a result, each Covered Officer must: (i) handle any actual or apparent conflict of interest in an ethical manner, (ii)
not use his or her personal influence or personal relationships to influence investment decisions or financial reporting by a Fund
whereby the Covered Officer would benefit personally (directly or indirectly) to the detriment of the Fund; (iii) not cause a Fund
to take action, or fail to take action, for the personal benefit of the Covered Officer rather than the benefit of such Fund; and
(iv) not use for his or
her personal benefit (directly or indirectly) any material non-public knowledge pertaining to a Fund.
Although typically not presenting
an opportunity for improper personal benefit, conflicts arise from, or as a result of, the contractual relationship between The
Royce Funds and Royce, of which the Covered Officers are also officers and/or employees. As a result, this Code recognizes that
the Covered Officers will, in the normal course of their duties (whether formally for a Fund or for Royce, or for both), be involved
in establishing policies and implementing decisions that will have different effects on Royce and the Fund. The participation of
the Covered Officers in such activities is inherent in the contractual relationship between each of The Royce Funds and Royce and
is consistent with the performance by the Covered Officers of their duties as officers and/or employees of The Royce Funds. Thus,
if performed in conformity with the provisions of the Investment Company Act and the Advisers Act, such activities will be deemed
to have been handled ethically.
The following conflict of
interest situations must be disclosed by a Covered Officer to, and pre-approved in writing by, the General Counsel if material.
Examples of these include:
| ● | service as a director on the board of any public company; |
| ● | any ownership interest in, or any consulting or employment relationship
with, any of The Royce Funds’ service providers, other than its investment adviser, principal underwriter, administrator
or any affiliated person thereof; or |
| ● | a direct or indirect financial interest in commissions, transaction charges
or spreads paid by any Fund for effecting portfolio transactions. |
In the event a Covered
Officer has any doubt as to (i) whether a suspected violation of this Code would be considered material, (ii) whether information
relating to a Fund is of a material nature and therefore subject to public disclosure, (iii) whether non-public knowledge pertaining
to a Fund is material in nature, or (iv) whether a particular conflict of interest is material, he or she should seek the advice
of Royce’s General Counsel.
| V. | Compliance and Annual Acknowledgment |
Each Covered Officer is
required: (i) upon receipt of the Code, to sign and submit to Royce’s General Counsel an acknowledgment stating that he or
she has received, read and understands the Code; (ii) annually thereafter to submit a statement to Royce’s General Counsel
confirming that he or she has received, read and understands the Code and has complied with the requirements of the Code; (iii)
not to retaliate against any employee subordinate to the Covered Officer for reports of potential violations that are made in good
faith; and (iv) to notify Royce’s General Counsel, as appropriate, if the Covered Officer observes any irregularities or
violations of this Code.
| VI. | Enforcement of the Code |
The Royce Funds will adhere
to the following procedures when investigating and enforcing this Code: (i) Royce’s General Counsel will take all appropriate
action to investigate any potential violations reported to him or her; (ii) if Royce’s General Counsel determines that a
violation has occurred, he or she will take all appropriate disciplinary or preventive action and inform the Fund’s Board
of Directors/Trustees of his or her decision; (iii) all changes to or waivers of this Code will, to the extent required, be disclosed
on Form N-CSR or otherwise as required by SEC rules; and (iv) any waiver sought by the President of The Royce Funds will be considered
by The Royce Funds’ Audit Committees prior to approval of the waiver.
Except with respect to Schedule
A hereto, which may be updated at any time, this Code may be amended only by the Board of Directors/Trustees of each Fund at a
meeting of such Board duly called for that purpose.
All reports and records prepared
or maintained pursuant to this Code will be considered confidential and will be maintained and protected accordingly. Except as
otherwise required by law or this Code, such matters shall not be disclosed to anyone other than the appropriate Board and its
counsel and Royce and its affiliated persons.
The Code is intended solely
for internal use by The Royce Funds and does not constitute the admission, by or on behalf of any Fund, as to any fact, circumstances
or legal conclusion.
Date: September 17, 2003, as revised
December 31, 2023
SCHEDULE A
Christopher D. Clark
Peter Hoglund
Mary Macchia
Melissa Mendelson
Item 12(a)(2):
CERTIFICATIONS
I, Christopher D. Clark, certify that:
1. I have reviewed this report on Form N-CSR of Royce Global Value Trust, Inc.;
2. Based on my knowledge, this report does
not contain any untrue statement of a material fact or omit to state a material fact necessary to make the statements made, in
light of the circumstances under which such statements were made, not misleading with respect to the period covered by this report;
3. Based on my knowledge, the financial
statements, and other financial information included in this report, fairly present in all material respects the financial condition,
results of operations, changes in net assets, and cash flows (if the financial statements are required to include a statement of
cash flows) of the registrant as of, and for, the periods presented in this report;
4. The registrant’s other certifying officer
and I are responsible for establishing and maintaining disclosure controls and procedures (as defined in Rule 30a-3(c) under the
Investment Company Act of 1940) and internal control over financial reporting (as defined in Rule 30a-3(d) under the Investment
Company Act of 1940) for the registrant and have:
a) designed such disclosure controls and
procedures, or caused such disclosure controls and procedures to be designed under our supervision, to ensure that material information
relating to the registrant, including its consolidated subsidiaries, is made known to us by others within those entities, particularly
during the period in which this report is being prepared;
b) designed such internal control over
financial reporting, or caused such internal control over financial reporting to be designed under our supervision, to provide
reasonable assurance regarding the reliability of financial reporting and the preparation of financial statements for external
purposes in accordance with generally accepted accounting principles;
c) evaluated the effectiveness of the registrant’s
disclosure controls and procedures and presented in this report our conclusions about the effectiveness of the disclosure controls
and procedures, as of a date within 90 days prior to the filing date of this report based on such evaluation; and
d) disclosed in this report any change
in the registrant’s internal control over financial reporting that occurred during the period covered by this report that
has materially affected, or is reasonably likely to materially affect, the registrant’s internal control over financial reporting;
and
5. The registrant’s other certifying officer
and I have disclosed to the registrant’s auditors and the audit committee of the registrant’s board of directors (or persons performing
the equivalent functions):
a) all significant deficiencies and material
weaknesses in the design or operation of internal control over financial reporting which are reasonably likely to adversely affect
the registrant’s ability to record, process, summarize, and report financial information; and
b) any fraud, whether or not material,
that involves management or other employees who have a significant role in the registrant’s internal control over financial reporting.
Date: February 24, 2024
| |
/s/Christopher D. Clark |
|
| |
Christopher D. Clark |
|
| |
President |
|
Item 12(a)(2):
CERTIFICATIONS
I, Peter K. Hoglund, certify that:
1. I have reviewed this report on Form N-CSR of Royce Global Value Trust, Inc.;
2. Based on my knowledge, this report does
not contain any untrue statement of a material fact or omit to state a material fact necessary to make the statements made, in
light of the circumstances under which such statements were made, not misleading with respect to the period covered by this report;
3. Based on my knowledge, the financial
statements, and other financial information included in this report, fairly present in all material respects the financial condition,
results of operations, changes in net assets, and cash flows (if the financial statements are required to include a statement of
cash flows) of the registrant as of, and for, the periods presented in this report;
4. The registrant’s other certifying officer
and I are responsible for establishing and maintaining disclosure controls and procedures (as defined in Rule 30a-3(c) under the
Investment Company Act of 1940) and internal control over financial reporting (as defined in Rule 30a-3(d) under the Investment
Company Act of 1940) for the registrant and have:
a) designed such disclosure controls and
procedures, or caused such disclosure controls and procedures to be designed under our supervision, to ensure that material information
relating to the registrant, including its consolidated subsidiaries, is made known to us by others within those entities, particularly
during the period in which this report is being prepared;
b) designed such internal control over
financial reporting, or caused such internal control over financial reporting to be designed under our supervision, to provide
reasonable assurance regarding the reliability of financial reporting and the preparation of financial statements for external
purposes in accordance with generally accepted accounting principles;
c) evaluated the effectiveness of the registrant’s
disclosure controls and procedures and presented in this report our conclusions about the effectiveness of the disclosure controls
and procedures, as of a date within 90 days prior to the filing date of this report based on such evaluation; and
d) disclosed in this report any change
in the registrant’s internal control over financial reporting that occurred during the period covered by this report that
has materially affected, or is reasonably likely to materially affect, the registrant’s internal control over financial reporting;
and
5. The registrant’s other certifying officer
and I have disclosed to the registrant’s auditors and the audit committee of the registrant’s board of directors (or persons performing
the equivalent functions):
a) all significant deficiencies and material
weaknesses in the design or operation of internal control over financial reporting which are reasonably likely to adversely affect
the registrant’s ability to record, process, summarize, and report financial information; and
b) any fraud, whether or not material,
that involves management or other employees who have a significant role in the registrant’s internal control over financial reporting.
Date: February 24, 2024
| |
/s/Peter K. Hoglund |
|
| |
Peter K. Hoglund |
|
| |
Treasurer |
|
Item 12(b):
CERTIFICATION
PURSUANT TO 18 U.S.C. SECTION 1350,
AS ADOPTED PURSUANT
TO
SECTION 906 OF THE SARBANES-OXLEY ACT
OF 2002
Name of Issuer: ROYCE GLOBAL VALUE TRUST,
INC.
In connection with the Report on Form N-CSR
of the above-named issuer that is accompanied by this certification, the undersigned hereby certifies, to his knowledge, that:
1. The Report fully complies with the requirements
of Section 13(a) or 15 (d) of the Securities Exchange Act of 1934; and
2. The information contained in the Report
fairly presents, in all materials respects, the financial condition and results of operations of the issuer.
Date: February 24, 2024
| |
/s/Christopher D. Clark |
|
| |
Christopher D. Clark |
|
| |
President |
|
Item 12(b):
CERTIFICATION
PURSUANT TO 18 U.S.C. SECTION 1350,
AS ADOPTED PURSUANT
TO
SECTION 906 OF THE SARBANES-OXLEY ACT
OF 2002
Name of Issuer: ROYCE GLOBAL VALUE TRUST,
INC.
In connection with the Report on Form N-CSR
of the above-named issuer that is accompanied by this certification, the undersigned hereby certifies, to his knowledge, that:
1. The Report fully complies with the requirements
of Section 13(a) or 15 (d) of the Securities Exchange Act of 1934; and
2. The information contained in the Report
fairly presents, in all materials respects, the financial condition and results of operations of the issuer.
Date: February 24, 2024
| |
/s/Peter K. Hoglund |
|
| |
Peter K. Hoglund |
|
| |
Treasurer |
|
Royce Global Value (NYSE:RGT)
Historical Stock Chart
Von Mär 2024 bis Apr 2024

Royce Global Value (NYSE:RGT)
Historical Stock Chart
Von Apr 2023 bis Apr 2024
