0001821825
false
0001821825
2023-08-08
2023-08-08
iso4217:USD
xbrli:shares
iso4217:USD
xbrli:shares
UNITED STATES
SECURITIES AND EXCHANGE COMMISSION
Washington, D.C. 20549
FORM 8-K
CURRENT REPORT
Pursuant to Section 13 or 15(d) of the Securities
Exchange Act of 1934
Date of Report
(Date of earliest event reported): August 8, 2023
Organon &
Co.
(Exact name of registrant
as specified in its charter)
| Delaware |
|
001-40235 |
|
46-4838035 |
| (State or other jurisdiction |
|
(Commission |
|
(I.R.S. Employer |
| of incorporation) |
|
File Number) |
|
Identification No.) |
| |
|
|
|
|
30 Hudson Street, Floor 33,
Jersey City, NJ |
|
|
|
07302 |
| (Address of principal executive offices) |
|
|
|
(Zip Code) |
| Registrant’s telephone number, including area code: (551) 430-6900 |
Check the appropriate box below if the Form 8-K filing is intended
to simultaneously satisfy the filing obligation of the registrant under any of the following provisions:
| ¨ | Written communications pursuant to Rule 425 under the Securities
Act (17 CFR 230.425) |
| ¨ | Soliciting material pursuant to Rule 14a-12 under the Exchange
Act (17 CFR 240.14a-12) |
| ¨ | Pre-commencement communications pursuant to Rule 14d-2(b) under
the Exchange Act (17 CFR 240.14d-2(b)) |
| ¨ | Pre-commencement communications pursuant to Rule 13e-4(c) under
the Exchange Act (17 CFR 240.13e-4(c)) |
Securities registered pursuant to Section 12(b) of the Act:
| Title of each class |
|
Trading Symbol(s) |
|
Name of
each exchange on which registered |
| Common Stock, par value $0.01 per share |
|
OGN |
|
NYSE |
Indicate by check mark whether the registrant is an emerging growth
company as defined in Rule 405 of the Securities Act of 1933 (§230.405 of this chapter) or Rule 12b-2 of the Securities Exchange
Act of 1934 (§240.12b-2 of this chapter).
Emerging growth company ¨
If an emerging growth company, indicate by check mark if the registrant
has elected not to use the extended transition period for complying with any new or revised financial accounting standards provided pursuant
to Section 13(a) of the Exchange Act. ¨
| Item 2.02 |
Results of Operations and Financial Condition. |
On August 8, 2023, Organon & Co.
(the “Company”) issued a press release (the “Earnings Release”) regarding its results for the quarter
ended June 30, 2023. The Earnings Release is included as Exhibit 99.1 to this report.
The information contained in this Item 2.02, including
Exhibit 99.1 attached hereto, is considered to be “furnished” and shall not be deemed “filed” for purposes
of Section 18 of the Securities Exchange Act of 1934, as amended (the “Exchange Act”), or otherwise subject to
liability under that Section. The information in this Current Report shall not be incorporated by reference into any filing or other document
pursuant to the Securities Act of 1933, as amended (the “Securities Act”) or the Exchange Act, except as shall be expressly
set forth by specific reference in such filing or document. The release contains forward- looking statements regarding the Company and
includes a cautionary statement identifying important factors that could cause actual results to differ materially from those anticipated.
| Item 7.01 |
Regulation FD Disclosure. |
In
connection with the conference call announced in the Earnings Release, on August 8, 2023, the Company made available the Company
Information Presentation relating to its financial results for the quarter ended June 30, 2023. The Company Information Presentation
may be accessed within the investor relations section of the Company’s website, https://www.organon.com. A copy of the Company
Information Presentation is attached hereto as Exhibit 99.2 and is incorporated herein by reference.
The information in this Item 7.01, including Exhibit 99.2
attached hereto, is considered to be “furnished” and shall not be deemed “filed” for purposes of Section 18
of the Exchange Act or otherwise subject to liability under that Section. The information in this Current Report shall not be incorporated
by reference into any filing or other document pursuant to the Securities Act or the Exchange Act, except as shall be expressly set forth
by specific reference in such filing or document. The Company Information Presentation contains forward-looking statements regarding the
Company and includes a cautionary statement identifying important factors that could cause actual results to differ materially from those
anticipated.
| Item 9.01 |
Financial Statements and Exhibits. |
SIGNATURES
Pursuant to the requirements of
the Securities Exchange Act of 1934, the Registrant has duly caused this report to be signed on its behalf by the undersigned, hereunto
duly authorized.
| |
Organon & Co. |
| |
|
| |
By: |
/s/ Matthew Walsh |
| |
|
Name: |
Matthew Walsh |
| |
|
Title: |
Chief Financial Officer |
Dated: August 8, 2023
Exhibit 99.1

| Media Contacts: |
Karissa Peer |
Investor Contacts: |
Jennifer Halchak |
| |
(614) 314-8094 |
|
(201) 275-2711 |
| |
Kate Vossen |
|
Alex Arzeno |
| |
(732) 675-8448 |
|
(203) 550-3972 |
Organon Reports Results for the Second Quarter
Ended June 30, 2023
| • | Second quarter 2023 revenue of $1,608 million |
| • | Second quarter 2023 diluted earnings per share of $0.95 and non-GAAP Adjusted diluted earnings per share of $1.31 |
| • | Adjusted EBITDA of $530 million |
| • | Board of Directors declares quarterly dividend of $0.28 per share |
| • | Full year 2023 financial guidance ranges updated: |
| ◦ | Revenue range narrowed to $6.25 billion to $6.45 billion, primarily reflecting current foreign currency exchange rates |
| ◦ | Adjusted EBITDA margin range now 31.5%-33.0% to incorporate current visibility on IPR&D (in-process research and development)
and milestones |
Jersey City, N.J., August 8, 2023 – Organon (NYSE: OGN)
today announced its results for the second quarter ended June 30, 2023.
"During the second quarter of 2023, Organon continued to build
on its track record, delivering solid volume growth across all regions and franchises. The Women's Health and Biosimilars franchise revenue
grew 10% and 15% excluding the impact of foreign currency ("ex-FX"), respectively, and Established Brands continued to demonstrate
stability," said Kevin Ali, Organon's CEO. "Further, on July 1st we launched Hadlima™ (adalimumab-bwwd)
in the United States - so far our biggest commercial launch in the U.S. as a standalone company. Hadlima is emerging as one of
a few biosimilars offerings earning commercial success so far. We are encouraged by our early traction and remain confident in our strategy,
the attributes of our product and our collaborator's capabilities to deliver reliable supply."
Second Quarter 2023 Revenue
| in $ millions | |
Q2 2023 | | |
Q2 2022 | | |
VPY | | |
VPY ex-FX | |
| Women’s Health | |
$ | 438 | | |
$ | 408 | | |
| 8 | % | |
| 10 | % |
| Biosimilars | |
| 135 | | |
| 119 | | |
| 14 | % | |
| 15 | % |
| Established Brands | |
| 995 | | |
| 1,018 | | |
| (2 | )% | |
| — | % |
| Other (1) | |
| 40 | | |
| 40 | | |
| (2 | )% | |
| (1 | )% |
| Revenues | |
$ | 1,608 | | |
$ | 1,585 | | |
| 1 | % | |
| 4 | % |
(1) Other includes manufacturing sales to Merck &
Co., Inc., Rahway, NJ, USA and other third parties.
For the second quarter of 2023, total revenue was $1,608 million, an
increase of 1% as-reported and an increase of 4% excluding the impact of foreign currency (ex-FX), compared with the second quarter of
2022.
Women’s Health revenue increased 8% on an as-reported basis,
and increased 10% ex-FX in the second quarter of 2023 compared with the second quarter of 2022 driven primarily by a 12% ex-FX increase
in Nexplanon® (etonogestrel implant), a long-acting reversible contraceptive. The Women's Health franchise also benefited from
17% ex-FX growth in the fertility portfolio during the quarter due to COVID-19 recovery in China
as well as strong demand in the LAMERA region and in the U.S. Growth in the Women's Health franchise was partially offset by a 3% ex-FX
decrease of NuvaRing® (etonogestrel/ethinyl estradiol vaginal ring) which continues to be impacted by generic competition.
Biosimilars revenue increased
14% as-reported and 15% ex-FX in the second quarter of 2023, compared with the second quarter of 2022 primarily driven by Renflexis®
(infliximab-abda) which grew 20% ex-FX due to continued demand and strong volume growth in United States and Canada. Growth in the biosimilars
franchise was partially offset by a 7% ex-FX decline in Ontruzant® (trastuzumab-dttb) primarily related to ongoing competitive
pressures in Europe. On July 1, 2023, the company launched Hadlima, a biosimilar to Humira (adalimumab) (a trademark
of AbbVie Biotechnology Ltd.) in the United States. Organon already markets Hadlima in Canada and Australia.
Established Brands revenue decreased
2% as-reported and was flat ex-FX in the second quarter of 2023, despite the negative impact from Volume Based Procurement (VBP) initiatives
in China and the year over year impact of the company's market action taken in the first quarter of 2023 on select injectable steroids,
Diprospan™ (bethamethasone), and Celestone Chronodose™ (bethamethasone), and Celestone Soluspan™
(bethamethasone). Offsetting factors included an 18% ex-FX year over year increase in Atozet™ (ezetimibe and atorvastatin
calcium) which was driven by increased demand in the EUCAN region, as well as 23% ex-FX growth in Arcoxia™ (etoricoxib)
which was driven by increased volume in the LAMERA region. Year to date, the Established Brands portfolio has grown 1% ex-FX, as 2% volume
growth has offset an approximate 1% decline in price across the portfolio. The company continues to expect the Established Brands franchise
to achieve flat revenue growth for the full year 2023.
Second Quarter 2023 Profitability
| in $ millions, except per share amounts | |
Q2 2023 | | |
Q2 2022 | | |
VPY | |
| Revenues | |
$ | 1,608 | | |
$ | 1,585 | | |
| 1 | % |
| Cost of sales | |
| 640 | | |
| 588 | | |
| 9 | % |
| Gross profit | |
| 968 | | |
| 997 | | |
| (3 | )% |
| Non-GAAP Adjusted gross profit (1) | |
| 1,012 | | |
| 1,047 | | |
| (3 | )% |
| Adjusted EBITDA (1,2) | |
| 530 | | |
| 512 | | |
| 4 | % |
| Net income | |
| 242 | | |
| 234 | | |
| 3 | % |
| Non-GAAP Adjusted net income (1) | |
| 336 | | |
| 319 | | |
| 5 | % |
| Diluted Earnings per Share (EPS) | |
| 0.95 | | |
| 0.92 | | |
| 3 | % |
| Non-GAAP Adjusted diluted EPS (1) | |
| 1.31 | | |
| 1.25 | | |
| 5 | % |
| Acquired in-process research & development (IPR&D) and milestones | |
| — | | |
| 97 | | |
| NM | |
| Per share impact to diluted EPS from acquired IPR&D and milestones | |
| — | | |
| (0.30 | ) | |
| NM | |
| | |
Q2 2023 | | |
Q2 2022 | |
| Gross margin | |
| 60.2 | % | |
| 62.9 | % |
| Non-GAAP Adjusted gross margin (1) | |
| 62.9 | % | |
| 66.1 | % |
| Adjusted EBITDA margin (1,2) | |
| 33.0 | % | |
| 32.3 | % |
| (1) | See Tables 4 and 5 for reconciliations of GAAP to non-GAAP financial measures |
| (2) | Adjusted EBITDA and Adjusted EBITDA margin include $97 million in the second quarter of 2022 related to acquired IPR&D and
milestones, no such expense was incurred in the second quarter of 2023 |
Gross margin was 60.2% as-reported and 62.9% on an adjusted basis in
the second quarter of 2023 compared to 62.9% as-reported and 66.1% on an adjusted basis in the second quarter of 2022. The
year-over-year decline in gross margin is primarily due to product mix as well as employee-related costs and distribution related
costs, which increased as a result of inflationary pressures in 2023.
Adjusted EBITDA margin was 33.0%
in the second quarter of 2023 compared to 32.3%
in the second quarter of 2022. The increase in Adjusted EBITDA margin was primarily a result
of $97 million of IPR&D and milestones in the second quarter of 2022; no such costs were incurred in the second quarter of 2023.
Net income for the second quarter of 2023 was $242 million, or $0.95
per diluted share, compared with $234 million, or $0.92 per diluted share, in the second quarter of 2022. Non-GAAP Adjusted net income
was $336 million, or $1.31 per diluted share, compared with $319 million, or $1.25 per diluted share, in 2022. The year over year increase
in net income was a result of higher Adjusted EBITDA compared with the second quarter of 2022 as well as a tax benefit in the second quarter
of 2023 related to earnings outside of the U.S., partially offset by higher interest expense associated with the company's variable rate
debt.
Capital Allocation
Today, Organon’s Board of Directors declared a quarterly dividend
of $0.28 for each issued and outstanding share of the company's common stock. The dividend
is payable on September 14, 2023, to stockholders of record at the close of business on August 18, 2023.
As of June 30, 2023, cash and cash equivalents were $326 million,
and debt was $8.7 billion.
Full Year Guidance
Organon does not provide GAAP financial measures on a forward-looking
basis because the company cannot predict with reasonable certainty and without unreasonable effort, the ultimate outcome of legal proceedings,
unusual gains and losses, the occurrence of matters creating GAAP tax impacts, and acquisition-related expenses. These items are uncertain,
depend on various factors, and could be material to Organon’s results computed in accordance with GAAP.
The company is updating its full year 2023 guidance ranges previously
provided on May 4, 2023. The range for full year 2023 revenue is narrowed to $6.25 billion to $6.45 billion, which primarily reflects
current foreign currency exchange rates. The range for full year Adjusted EBITDA margin is now 31.5% to 33.0% to incorporate the company's
current visibility of IPR&D and milestone expenses expected to be incurred in 2023. Organon's financial guidance does not assume an
estimate for future IPR&D and milestone payments for business development transactions not yet executed.
Full year 2023 financial guidance is presented below on a non-GAAP
basis.
| |
|
Previous
guidance as of
May 4, 2023 |
|
Current guidance |
| Revenues |
|
$6.150B - $6.450B |
|
$6.250B-$6.450B |
| Adjusted gross margin |
|
Low-mid 60% range |
|
Unchanged |
| SG&A (as % of revenue) |
|
Mid 20% range |
|
Unchanged |
| R&D (as % of revenue) |
|
Upper single-digit |
|
Unchanged |
| Adjusted EBITDA margin |
|
31.0%-33.0% |
|
31.5%-33.0% |
| Interest |
|
~$515 million |
|
~$525 million |
| Depreciation |
|
~$130 million |
|
~$120 million |
| Effective non-GAAP tax rate |
|
19.0% - 21.0% |
|
17.5% - 19.5% |
| Fully diluted weighted average shares outstanding |
|
~257 million |
|
Unchanged |
Webcast Information
Organon will host a conference call at 8:30 a.m. Eastern Time
today to discuss its second quarter 2023 financial results. To listen to the event and view the presentation slides via webcast, join
from the Organon Investor Relations website at https://www.organon.com/investor-relations/events-and-presentations/. A replay of
the webcast will be available approximately two hours after the conclusion of the live event on the company’s website. Institutional
investors and analysts interested in participating in the call must register in advance by clicking on this link:
https://conferencingportals.com/event/jgIqShwa
Following registration, participants will receive a confirmation email
containing details on how to join the conference call, including dial-in information and a unique passcode and registrant ID. Pre-registration
will allow participants to bypass an operator and be placed directly into the call.
About Organon
Organon is a global healthcare company formed to focus on improving
the health of women throughout their lives. Organon offers more than 60 medicines and products in women’s health in addition to
a growing biosimilars business and a large franchise of established medicines across a range of therapeutic areas. Organon’s existing
products produce strong cash flows that support investments in innovation and future growth opportunities in women’s health and
biosimilars. In addition, Organon is pursuing opportunities to collaborate with biopharmaceutical innovators looking to commercialize
their products by leveraging its scale and presence in fast growing international markets.
Organon has a global footprint with significant scale and geographic
reach, world-class commercial capabilities, and approximately 10,000 employees with headquarters located in Jersey City, New Jersey.
For more information, visit http://www.organon.com and
connect with us on LinkedIn, Instagram, Twitter and Facebook.
Cautionary Note Regarding Non-GAAP Financial Measures
This press release contains “non-GAAP financial measures,”
which are financial measures that either exclude or include amounts that are correspondingly not excluded or included in the most directly
comparable measures calculated and presented in accordance with U.S. generally accepted accounting principles (“GAAP”). Specifically,
the company makes use of the non-GAAP financial measures Adjusted EBITDA, Adjusted gross margin, Adjusted gross profit, Adjusted net income,
and Adjusted diluted EPS, which are not recognized terms under GAAP and are presented only as a supplement to the company’s GAAP
financial statements. This press release also provides certain measures that exclude the impact of foreign exchange. We calculate foreign
exchange by converting our current-period local currency financial results using the prior period average currency rates and comparing
these adjusted amounts to our current-period results. The company believes that these non-GAAP financial measures help to enhance an understanding
of the company’s financial performance. However, the presentation of these measures has limitations as an analytical tool and should
not be considered in isolation, or as a substitute for the company’s results as reported under GAAP. Because not all companies use
identical calculations, the presentations of these non-GAAP measures may not be comparable to other similarly titled measures of other
companies. You should refer to Table 4 and Table 5 of this press release for relevant definitions and reconciliations of non-GAAP financial
measures contained herein to the most directly comparable GAAP measures.
In addition, the company’s full-year 2023 guidance measures (other
than revenue) are provided on a non-GAAP basis because the company is unable to reasonably predict certain items contained in the GAAP
measures. Such items include, but are not limited to, acquisition related expenses, restructuring and related expenses, stock-based compensation,
the ultimate outcome of legal proceedings, unusual gains and losses, the occurrence of matters creating GAAP tax impacts and other items
not reflective of the company's ongoing operations.
The company uses non-GAAP financial measures in its operational and
financial decision making, and believes that it is useful to exclude certain items in order to focus on what it regards to be a more meaningful
representation of the underlying operating performance of the business.
Cautionary Note Regarding Forward-Looking Statements
Except for historical information, this press release includes “forward-looking
statements” within the meaning of the safe harbor provisions of the U.S. Private Securities Litigation Reform Act of 1995, including,
but not limited to, statements about management’s expectations about Organon’s future financial performance and prospects.
Forward-looking statements may be identified by words such as “expects,” “intends,” “anticipates,”
“plans,” “believes,” “seeks,” “estimates,” “will” or words of similar meaning.
These statements are based upon the current beliefs and expectations of the company’s management and are subject to significant
risks and uncertainties. If underlying assumptions prove inaccurate or risks or uncertainties materialize, actual results may differ materially
from those set forth in the forward-looking statements.
Risks and uncertainties include, but are not limited to, an inability
to fully execute on our product development and commercialization plans within the United States or internationally; changes in tax laws
or other tax guidance which could adversely affect our cash tax liability, effective tax rates, and results of operations and lead to
greater audit scrutiny; an inability to execute on our business development strategy or realize the benefits of our planned acquisitions;
efficacy, safety, or other quality concerns with respect to marketed products, including market actions such as recalls, withdrawals,
or declining sales; political and social pressures, or regulatory developments, that adversely impact demand for, availability of, or
patient access to contraception or fertility products; general economic factors, including recessionary pressures, interest rate and currency
exchange rate fluctuations; general industry conditions and competition; the impact of the ongoing COVID-19 pandemic and emergence of
variant strains; the impact of pharmaceutical industry regulation and health care legislation in the United States and internationally;
global trends toward health care cost containment; technological advances; new products and patents attained by competitors; challenges
inherent in new product development, including obtaining regulatory approval; the company’s ability to accurately predict its future
financial results and performance; manufacturing difficulties or delays; financial instability of international economies and sovereign
risk; difficulties developing and sustaining relationships with commercial counterparties; dependence on the effectiveness of the company’s
patents and other protections for innovative products; and the exposure to litigation, including patent litigation, and/or regulatory
actions.
The company undertakes no obligation to publicly update any forward-looking
statement, whether as a result of new information, future events or otherwise. Additional factors that could cause results to differ materially
from those described in the forward-looking statements can be found in the company’s filings with the Securities and Exchange Commission
("SEC"), including the company’s Annual Report on Form 10-K for the year ended December 31, 2022, available
at the SEC’s Internet site (www.sec.gov).
TABLE 1
Organon & Co.
Condensed Consolidated Statement of Income
(Unaudited, $ in millions except shares in thousands
and per share amounts)
| | |
Three Months Ended
June 30, | | |
Six Months Ended
June 30, | |
| | |
2023 | | |
2022 | | |
2023 | | |
2022 | |
| Revenues | |
$ | 1,608 | | |
$ | 1,585 | | |
$ | 3,146 | | |
$ | 3,152 | |
| Costs, Expenses and Other | |
| | | |
| | | |
| | | |
| | |
| Cost of sales | |
| 640 | | |
| 588 | | |
| 1,220 | | |
| 1,149 | |
| Selling, general and administrative | |
| 451 | | |
| 423 | | |
| 886 | | |
| 794 | |
| Research and development | |
| 128 | | |
| 106 | | |
| 257 | | |
| 202 | |
| Acquired in-process research and development and milestones | |
| — | | |
| 97 | | |
| 8 | | |
| 97 | |
| Restructuring costs | |
| — | | |
| — | | |
| 4 | | |
| — | |
| Interest expense | |
| 132 | | |
| 98 | | |
| 264 | | |
| 195 | |
| Exchange losses (gains) | |
| 2 | | |
| (21 | ) | |
| 11 | | |
| (25 | ) |
| Other expense, net | |
| 1 | | |
| 7 | | |
| 7 | | |
| 11 | |
| | |
| 1,354 | | |
| 1,298 | | |
| 2,657 | | |
| 2,423 | |
| Income Before Income Taxes | |
| 254 | | |
| 287 | | |
| 489 | | |
| 729 | |
| Taxes on income | |
| 12 | | |
| 53 | | |
| 70 | | |
| 147 | |
| Net Income | |
| 242 | | |
| 234 | | |
| 419 | | |
| 582 | |
| | |
| | | |
| | | |
| | | |
| | |
| Earnings per Share: | |
| | | |
| | | |
| | | |
| | |
| Basic | |
$ | 0.95 | | |
$ | 0.92 | | |
$ | 1.64 | | |
$ | 2.29 | |
| Diluted | |
$ | 0.95 | | |
$ | 0.92 | | |
$ | 1.64 | | |
$ | 2.28 | |
| | |
| | | |
| | | |
| | | |
| | |
| Weighted Average Shares Outstanding: | |
| | | |
| | | |
| | | |
| | |
| Basic | |
| 255,341 | | |
| 254,018 | | |
| 254,869 | | |
| 253,802 | |
| Diluted | |
| 255,953 | | |
| 255,156 | | |
| 256,064 | | |
| 255,105 | |
TABLE 2
Organon & Co.
Sales by top products
(Unaudited, $ in millions)
| |
|
Three
Months Ended June 30, | |
Six
Months Ended June 30, | |
| |
|
2023 | |
2022 | |
2023 | |
2022 | |
| |
|
U.S. | |
Int’l | |
Total | |
U.S. | |
Int’l | |
Total | |
U.S. | |
Int’l | |
Total | |
U.S. | |
Int’l | |
Total | |
| Women’s
Health |
|
| | |
| | |
| | |
| | |
| | |
| | |
| | |
| | |
| | |
| | |
| | |
| | |
| Nexplanon/Implanon
NXT |
|
$ | 159 | |
$ | 56 | |
$ | 214 | |
$ | 134 | |
$ | 61 | |
$ | 195 | |
$ | 272 | |
$ | 107 | |
$ | 380 | |
$ | 250 | |
$ | 116 | |
$ | 366 | |
| Follistim
AQ |
|
| 26 | |
| 44 | |
| 70 | |
| 23 | |
| 35 | |
| 58 | |
| 52 | |
| 73 | |
| 125 | |
| 52 | |
| 66 | |
| 119 | |
| NuvaRing |
|
| 17 | |
| 23 | |
| 40 | |
| 22 | |
| 20 | |
| 42 | |
| 33 | |
| 47 | |
| 80 | |
| 38 | |
| 45 | |
| 83 | |
| Ganirelix
Acetate Injection |
|
| 4 | |
| 29 | |
| 34 | |
| 6 | |
| 25 | |
| 32 | |
| 11 | |
| 53 | |
| 63 | |
| 14 | |
| 47 | |
| 61 | |
| Marvelon/Mercilon |
|
| — | |
| 29 | |
| 29 | |
| — | |
| 31 | |
| 31 | |
| — | |
| 67 | |
| 67 | |
| — | |
| 54 | |
| 54 | |
| Other
Women's Health (1) |
|
| 27 | |
| 25 | |
| 52 | |
| 29 | |
| 22 | |
| 51 | |
| 53 | |
| 52 | |
| 105 | |
| 56 | |
| 47 | |
| 103 | |
| Biosimilars |
|
| | |
| | |
| | |
| | |
| | |
| | |
| | |
| | |
| | |
| | |
| | |
| | |
| Renflexis |
|
| 60 | |
| 11 | |
| 70 | |
| 51 | |
| 8 | |
| 59 | |
| 114 | |
| 18 | |
| 132 | |
| 93 | |
| 12 | |
| 105 | |
| Ontruzant |
|
| 12 | |
| 21 | |
| 33 | |
| 12 | |
| 23 | |
| 35 | |
| 25 | |
| 29 | |
| 54 | |
| 19 | |
| 38 | |
| 57 | |
| Brenzys |
|
| — | |
| 13 | |
| 13 | |
| — | |
| 14 | |
| 14 | |
| — | |
| 32 | |
| 32 | |
| — | |
| 28 | |
| 28 | |
| Aybintio |
|
| — | |
| 12 | |
| 12 | |
| — | |
| 9 | |
| 9 | |
| — | |
| 22 | |
| 22 | |
| — | |
| 19 | |
| 19 | |
| Hadlima |
|
| — | |
| 7 | |
| 7 | |
| — | |
| 2 | |
| 2 | |
| — | |
| 12 | |
| 12 | |
| — | |
| 8 | |
| 8 | |
| Established
Brands |
|
| | |
| | |
| | |
| | |
| | |
| | |
| | |
| | |
| | |
| | |
| | |
| | |
| Cardiovascular |
|
| | |
| | |
| | |
| | |
| | |
| | |
| | |
| | |
| | |
| | |
| | |
| | |
| Zetia |
|
| 2 | |
| 89 | |
| 90 | |
| 2 | |
| 99 | |
| 101 | |
| 4 | |
| 169 | |
| 173 | |
| 5 | |
| 195 | |
| 200 | |
| Vytorin |
|
| 1 | |
| 37 | |
| 38 | |
| 3 | |
| 32 | |
| 35 | |
| 3 | |
| 65 | |
| 67 | |
| 5 | |
| 68 | |
| 73 | |
| Atozet |
|
| — | |
| 143 | |
| 143 | |
| — | |
| 122 | |
| 122 | |
| — | |
| 271 | |
| 271 | |
| — | |
| 240 | |
| 240 | |
| Rosuzet |
|
| — | |
| 17 | |
| 17 | |
| — | |
| 16 | |
| 16 | |
| — | |
| 35 | |
| 35 | |
| — | |
| 38 | |
| 38 | |
| Cozaar/Hyzaar |
|
| 2 | |
| 69 | |
| 71 | |
| 2 | |
| 91 | |
| 92 | |
| 4 | |
| 152 | |
| 156 | |
| 10 | |
| 176 | |
| 186 | |
| Other
Cardiovascular (1) |
|
| 1 | |
| 41 | |
| 41 | |
| 1 | |
| 45 | |
| 46 | |
| 1 | |
| 81 | |
| 82 | |
| 2 | |
| 83 | |
| 85 | |
| Respiratory |
|
| | |
| | |
| | |
| | |
| | |
| | |
| | |
| | |
| | |
| | |
| | |
| | |
| Singulair |
|
| 3 | |
| 77 | |
| 80 | |
| 3 | |
| 89 | |
| 92 | |
| 5 | |
| 194 | |
| 199 | |
| 5 | |
| 216 | |
| 222 | |
| Nasonex |
|
| — | |
| 64 | |
| 64 | |
| — | |
| 58 | |
| 58 | |
| — | |
| 133 | |
| 133 | |
| 9 | |
| 123 | |
| 133 | |
| Dulera |
|
| 38 | |
| 10 | |
| 48 | |
| 36 | |
| 12 | |
| 47 | |
| 76 | |
| 18 | |
| 95 | |
| 67 | |
| 21 | |
| 88 | |
| Clarinex |
|
| 1 | |
| 38 | |
| 39 | |
| 1 | |
| 34 | |
| 35 | |
| 2 | |
| 77 | |
| 79 | |
| 2 | |
| 70 | |
| 73 | |
| Other
Respiratory (1) |
|
| 13 | |
| 6 | |
| 19 | |
| 11 | |
| 11 | |
| 22 | |
| 25 | |
| 12 | |
| 37 | |
| 23 | |
| 22 | |
| 45 | |
| Non-Opioid
Pain, Bone and Dermatology |
|
| | |
| | |
| | |
| | |
| | |
| | |
| | |
| | |
| | |
| | |
| | |
| | |
| Arcoxia |
|
| — | |
| 72 | |
| 72 | |
| — | |
| 61 | |
| 61 | |
| — | |
| 143 | |
| 143 | |
| — | |
| 121 | |
| 121 | |
| Fosamax |
|
| 1 | |
| 44 | |
| 44 | |
| 1 | |
| 39 | |
| 40 | |
| 1 | |
| 81 | |
| 82 | |
| 2 | |
| 79 | |
| 81 | |
| Diprospan |
|
| — | |
| 12 | |
| 12 | |
| — | |
| 31 | |
| 31 | |
| — | |
| 27 | |
| 27 | |
| — | |
| 63 | |
| 63 | |
| Other
Non-Opioid Pain, Bone and Dermatology (1) |
|
| 2 | |
| 67 | |
| 71 | |
| 5 | |
| 71 | |
| 76 | |
| 7 | |
| 127 | |
| 133 | |
| 8 | |
| 137 | |
| 145 | |
| Other |
|
| | |
| | |
| | |
| | |
| | |
| | |
| | |
| | |
| | |
| | |
| | |
| | |
| Proscar |
|
| — | |
| 24 | |
| 25 | |
| — | |
| 26 | |
| 26 | |
| 1 | |
| 51 | |
| 52 | |
| 1 | |
| 50 | |
| 50 | |
| Propecia |
|
| 2 | |
| 35 | |
| 36 | |
| 2 | |
| 33 | |
| 35 | |
| 4 | |
| 66 | |
| 69 | |
| 3 | |
| 63 | |
| 66 | |
| Other
(1) |
|
| 2 | |
| 81 | |
| 84 | |
| 7 | |
| 74 | |
| 82 | |
| 4 | |
| 156 | |
| 162 | |
| 15 | |
| 149 | |
| 164 | |
| Other
(2) |
|
| (2 | ) |
| 41 | |
| 40 | |
| — | |
| 40 | |
| 40 | |
| — | |
| 79 | |
| 79 | |
| 1 | |
| 78 | |
| 76 | |
| Revenues |
|
$ | 371 | |
$ | 1,237 | |
$ | 1,608 | |
$ | 351 | |
$ | 1,234 | |
$ | 1,585 | |
$ | 697 | |
$ | 2,449 | |
$ | 3,146 | |
$ | 680 | |
$ | 2,472 | |
$ | 3,152 | |
Totals
may not foot due to rounding. Trademarks appearing above in italics are trademarks of, or are used under license by, the Organon group
of companies.
| (1) | Includes sales of products not
listed separately. Revenues from MarvelonTM and MercilonTM were previously reported as part of Other Women's Health.
Revenue from an arrangement for the sale of generic etonogestrel/ethinyl estradiol vaginal ring is included in Other Women's Health. |
| (2) | Other includes manufacturing
sales to Merck & Co., Inc., Rahway, NJ, USA and other third parties. |
TABLE 3
Organon & Co.
Sales by geographic area
(Unaudited, $ in millions)
| | |
Three Months Ended
June 30, | | |
Six Months Ended
June 30, | |
| | |
2023 | | |
2022 | | |
2023 | | |
2022 | |
| Europe and Canada | |
$ | 467 | | |
$ | 443 | | |
$ | 867 | | |
$ | 880 | |
| United States | |
| 371 | | |
| 351 | | |
| 697 | | |
| 680 | |
| Asia Pacific and Japan | |
| 261 | | |
| 291 | | |
| 585 | | |
| 604 | |
| China | |
| 234 | | |
| 244 | | |
| 459 | | |
| 480 | |
| Latin America, Middle East, Russia and Africa | |
| 234 | | |
| 216 | | |
| 448 | | |
| 425 | |
| Other (1) | |
| 41 | | |
| 40 | | |
| 90 | | |
| 83 | |
| Revenues | |
$ | 1,608 | | |
$ | 1,585 | | |
$ | 3,146 | | |
$ | 3,152 | |
(1) Other
includes manufacturing sales to Merck & Co., Inc., Rahway, NJ, USA and other third parties.
TABLE 4
Reconciliation of GAAP Reported to Non-GAAP
Adjusted Information
(Unaudited, $ in millions except per share amounts)
| | |
Three Months Ended June 30, 2023 | |
| | |
GAAP | | |
Spin related
Costs(1) | | |
Restructuring | | |
Stock-based
Compensation | | |
Amortization | | |
Other(1) | | |
Non-GAAP
Adjusted | |
| Revenues | |
$ | 1,608 | | |
| | | |
| | | |
| | | |
| | | |
| | | |
$ | 1,608 | |
| Cost of sales | |
| 640 | | |
| (10 | ) | |
| — | | |
| (4 | ) | |
| (30 | ) | |
| — | | |
| 596 | |
| Gross profit | |
| 968 | | |
| | | |
| | | |
| | | |
| | | |
| | | |
| 1,012 | |
| Gross margin | |
| 60.2 | % | |
| | | |
| | | |
| | | |
| | | |
| | | |
| 62.9 | % |
| | |
| | | |
| | | |
| | | |
| | | |
| | | |
| | | |
| | |
| Selling, general and administrative | |
| 451 | | |
| (44 | ) | |
| — | | |
| (17 | ) | |
| — | | |
| — | | |
| 390 | |
| Research and development | |
| 128 | | |
| (3 | ) | |
| — | | |
| (4 | ) | |
| — | | |
| — | | |
| 121 | |
| Acquired in-process research and development and milestones | |
| — | | |
| — | | |
| — | | |
| — | | |
| — | | |
| — | | |
| — | |
| Restructuring costs | |
| — | | |
| — | | |
| — | | |
| — | | |
| — | | |
| — | | |
| — | |
| Interest expense | |
| 132 | | |
| — | | |
| — | | |
| — | | |
| — | | |
| — | | |
| 132 | |
| Exchange losses | |
| 2 | | |
| — | | |
| — | | |
| — | | |
| — | | |
| — | | |
| 2 | |
| Other expense (income), net | |
| 1 | | |
| (4 | ) | |
| — | | |
| — | | |
| — | | |
| — | | |
| (3 | ) |
| | |
| 1,354 | | |
| | | |
| | | |
| | | |
| | | |
| | | |
| 1,238 | |
| Income before income taxes | |
| 254 | | |
| | | |
| | | |
| | | |
| | | |
| | | |
| 370 | |
| Taxes on income | |
| 12 | | |
| 13 | | |
| — | | |
| 4 | | |
| 5 | | |
| — | | |
| 34 | |
| Net income | |
$ | 242 | | |
| | | |
| | | |
| | | |
| | | |
| | | |
$ | 336 | |
| | |
| | | |
| | | |
| | | |
| | | |
| | | |
| | | |
| | |
| Earnings per share - Diluted | |
$ | 0.95 | | |
| | | |
| | | |
| | | |
| | | |
| | | |
$ | 1.31 | |
(1) Represents one-time costs. Spin-related
includes costs from the separation of Merck & Co., Inc., Rahway, NJ, US and Other primarily includes inventory step-up amortization
and legal reserves.
| | |
Three Months Ended June 30, 2022 | |
| | |
GAAP | | |
Spin related
Costs(1) | | |
Restructuring | | |
Stock-based
Compensation | | |
Amortization | | |
Other(1) | | |
Non-GAAP
Adjusted | |
| Revenues | |
$ | 1,585 | | |
| | | |
| | | |
| | | |
| | | |
| | | |
$ | 1,585 | |
| Cost of sales | |
| 588 | | |
| (6 | ) | |
| — | | |
| (3 | ) | |
| (28 | ) | |
| (13 | ) | |
| 538 | |
| Gross profit | |
| 997 | | |
| | | |
| | | |
| | | |
| | | |
| | | |
| 1,047 | |
| Gross margin | |
| 62.9 | % | |
| | | |
| | | |
| | | |
| | | |
| | | |
| 66.1 | % |
| | |
| | | |
| | | |
| | | |
| | | |
| | | |
| | | |
| | |
| Selling, general and administrative | |
| 423 | | |
| (28 | ) | |
| — | | |
| (13 | ) | |
| — | | |
| — | | |
| 382 | |
| Research and development | |
| 106 | | |
| (3 | ) | |
| — | | |
| (3 | ) | |
| — | | |
| — | | |
| 100 | |
| Acquired in-process research and development and | |
| 97 | | |
| — | | |
| — | | |
| — | | |
| — | | |
| — | | |
| 97 | |
| Restructuring costs | |
| — | | |
| — | | |
| — | | |
| — | | |
| — | | |
| — | | |
| — | |
| Interest expense | |
| 98 | | |
| — | | |
| — | | |
| — | | |
| — | | |
| — | | |
| 98 | |
| Exchange gains | |
| (21 | ) | |
| — | | |
| — | | |
| — | | |
| — | | |
| — | | |
| (21 | ) |
| Other expense (income), net | |
| 7 | | |
| (8 | ) | |
| — | | |
| — | | |
| — | | |
| — | | |
| (1 | ) |
| | |
| 1,298 | | |
| | | |
| | | |
| | | |
| | | |
| | | |
| 1,193 | |
| Income before income taxes | |
| 287 | | |
| | | |
| | | |
| | | |
| | | |
| | | |
| 392 | |
| Taxes on income | |
| 53 | | |
| 10 | | |
| — | | |
| 3 | | |
| 4 | | |
| 3 | | |
| 73 | |
| Net income | |
$ | 234 | | |
| | | |
| | | |
| | | |
| | | |
| | | |
$ | 319 | |
| | |
| | | |
| | | |
| | | |
| | | |
| | | |
| | | |
| | |
| Earnings per share - Diluted | |
$ | 0.92 | | |
| | | |
| | | |
| | | |
| | | |
| | | |
$ | 1.25 | |
(1) Represents one-time costs. Spin-related
includes costs from the separation of Merck & Co., Inc., Rahway, NJ, US and Other primarily includes inventory step-up amortization
and legal reserves.
TABLE 4 (Continued)
Reconciliation of GAAP Reported to Non-GAAP
Adjusted Information
(Unaudited, $ in millions except per share amounts)
| | |
Six Months Ended June 30, 2023 | |
| | |
GAAP | | |
Spin related
Costs(1) | | |
Restructuring | | |
Stock-based
Compensation | | |
Amortization | | |
Other(1) | | |
Non-GAAP
Adjusted | |
| Revenues | |
$ | 3,146 | | |
| | | |
| | | |
| | | |
| | | |
| | | |
$ | 3,146 | |
| Cost of sales | |
| 1,220 | | |
| (20 | ) | |
| — | | |
| (8 | ) | |
| (59 | ) | |
| (2 | ) | |
| 1,131 | |
| Gross profit | |
| 1,926 | | |
| | | |
| | | |
| | | |
| | | |
| | | |
| 2,015 | |
| Gross margin | |
| 61.2 | % | |
| | | |
| | | |
| | | |
| | | |
| | | |
| 64.0 | % |
| | |
| | | |
| | | |
| | | |
| | | |
| | | |
| | | |
| | |
| Selling, general and administrative | |
| 886 | | |
| (90 | ) | |
| — | | |
| (32 | ) | |
| — | | |
| (1 | ) | |
| 763 | |
| Research and development | |
| 257 | | |
| (6 | ) | |
| — | | |
| (7 | ) | |
| — | | |
| — | | |
| 244 | |
| Acquired in-process research and development and milestones | |
| 8 | | |
| — | | |
| — | | |
| — | | |
| — | | |
| — | | |
| 8 | |
| Restructuring costs | |
| 4 | | |
| — | | |
| (4 | ) | |
| — | | |
| — | | |
| — | | |
| — | |
| Interest expense | |
| 264 | | |
| — | | |
| — | | |
| — | | |
| — | | |
| — | | |
| 264 | |
| Exchange losses | |
| 11 | | |
| — | | |
| — | | |
| — | | |
| — | | |
| — | | |
| 11 | |
| Other expense (income), net | |
| 7 | | |
| (10 | ) | |
| — | | |
| — | | |
| — | | |
| — | | |
| (3 | ) |
| | |
| 2,657 | | |
| | | |
| | | |
| | | |
| | | |
| | | |
| 2,418 | |
| Income before income taxes | |
| 489 | | |
| | | |
| | | |
| | | |
| | | |
| | | |
| 728 | |
| Taxes on income | |
| 70 | | |
| 26 | | |
| 1 | | |
| 8 | | |
| 11 | | |
| — | | |
| 116 | |
| Net income | |
$ | 419 | | |
| | | |
| | | |
| | | |
| | | |
| | | |
$ | 612 | |
| | |
| | | |
| | | |
| | | |
| | | |
| | | |
| | | |
| | |
| Earnings per share - Diluted | |
$ | 1.64 | | |
| | | |
| | | |
| | | |
| | | |
| | | |
$ | 2.39 | |
(1) Represents one-time costs. Spin-related
includes costs from the separation of Merck & Co., Inc., Rahway, NJ, US and Other primarily includes inventory step-up amortization
and legal reserves.
| | |
Six Months Ended June 30, 2022 | |
| | |
GAAP | | |
Spin related
Costs(1) | | |
Restructuring | | |
Stock-based
Compensation | | |
Amortization | | |
Other(1) | | |
Non-GAAP
Adjusted | |
| Revenues | |
$ | 3,152 | | |
| | | |
| | | |
| | | |
| | | |
| | | |
$ | 3,152 | |
| Cost of sales | |
| 1,149 | | |
| (10 | ) | |
| — | | |
| (6 | ) | |
| (56 | ) | |
| (14 | ) | |
| 1,063 | |
| Gross profit | |
| 2,003 | | |
| | | |
| | | |
| | | |
| | | |
| | | |
| 2,089 | |
| Gross margin | |
| 63.5 | % | |
| | | |
| | | |
| | | |
| | | |
| | | |
| 66.3 | % |
| | |
| | | |
| | | |
| | | |
| | | |
| | | |
| | | |
| | |
| Selling, general and administrative | |
| 794 | | |
| (53 | ) | |
| — | | |
| (23 | ) | |
| — | | |
| — | | |
| 718 | |
| Research and development | |
| 202 | | |
| (6 | ) | |
| — | | |
| (5 | ) | |
| — | | |
| (1 | ) | |
| 190 | |
| Acquired in-process research and development and | |
| 97 | | |
| — | | |
| — | | |
| — | | |
| — | | |
| — | | |
| 97 | |
| Restructuring costs | |
| — | | |
| — | | |
| — | | |
| — | | |
| — | | |
| — | | |
| — | |
| Interest expense | |
| 195 | | |
| — | | |
| — | | |
| — | | |
| — | | |
| — | | |
| 195 | |
| Exchange gains | |
| (25 | ) | |
| — | | |
| — | | |
| — | | |
| — | | |
| — | | |
| (25 | ) |
| Other expense (income), net | |
| 11 | | |
| (14 | ) | |
| — | | |
| — | | |
| — | | |
| — | | |
| (3 | ) |
| | |
| 2,423 | | |
| | | |
| | | |
| | | |
| | | |
| | | |
| 2,235 | |
| Income before income taxes | |
| 729 | | |
| | | |
| | | |
| | | |
| | | |
| | | |
| 917 | |
| Taxes on income | |
| 147 | | |
| 14 | | |
| — | | |
| 5 | | |
| 9 | | |
| 3 | | |
| 178 | |
| Net income | |
$ | 582 | | |
| | | |
| | | |
| | | |
| | | |
| | | |
$ | 739 | |
| | |
| | | |
| | | |
| | | |
| | | |
| | | |
| | | |
| | |
| Earnings per share - Diluted | |
$ | 2.28 | | |
| | | |
| | | |
| | | |
| | | |
| | | |
$ | 2.90 | |
(1) Represents one-time costs. Spin-related
includes costs from the separation of Merck & Co., Inc., Rahway, NJ, US and Other primarily includes inventory step-up amortization
and legal reserves.
TABLE 5
Organon & Co.
Reconciliation of GAAP Income Before Income
Taxes to Adjusted EBITDA
(Unaudited, $ in millions)
| | |
Three Months Ended
June 30, | | |
Six Months Ended
June 30, | |
| | |
2023 | | |
2022 | | |
2023 | | |
2022 | |
| Income before income taxes | |
$ | 254 | | |
$ | 287 | | |
$ | 489 | | |
$ | 729 | |
| Depreciation | |
| 28 | | |
| 22 | | |
| 56 | | |
| 47 | |
| Amortization | |
| 30 | | |
| 28 | | |
| 59 | | |
| 56 | |
| Interest expense | |
| 132 | | |
| 98 | | |
| 264 | | |
| 195 | |
| EBITDA | |
$ | 444 | | |
$ | 435 | | |
$ | 868 | | |
$ | 1,027 | |
| Restructuring costs | |
| — | | |
| — | | |
| 4 | | |
| — | |
| One-time costs (1) | |
| 61 | | |
| 58 | | |
| 129 | | |
| 98 | |
| Stock-based compensation | |
| 25 | | |
| 19 | | |
| 47 | | |
| 34 | |
| Adjusted EBITDA | |
$ | 530 | | |
$ | 512 | | |
$ | 1,048 | | |
$ | 1,159 | |
| Adjusted EBITDA margin | |
| 33.0 | % | |
| 32.3 | % | |
| 33.3 | % | |
| 36.8 | % |
(1) One-time costs primarily include costs
incurred in connection with the spin-off of Organon, inventory step up adjustments and legal reserves.
Exhibit 99.2

Second Quarter 2023 Earnings Organon

Disclaimer statement Cautionary Note Regarding Forward - Looking Statements Except for historical information, this presentation includes “forward - looking statements” within the meaning of the safe harbor provisions of the U.S. Private Securities Litigation Reform Act of 1995, including, but not limited to, statements about management’s expectations about Organon’s future financial performance and prospects. Forward - looking statements may be identified by words such as “expects,” “intends,” “anticipates,” “plans,” “believes,” “seeks,” “estimates,” “will” or words of similar m ean ing. These statements are based upon the current beliefs and expectations of the company’s management and are subject to significant risks and uncertainties. If underlying assumptions pr ove inaccurate or risks or uncertainties materialize, actual results may differ materially from those set forth in the forward - looking statements. Risks and uncertainties include, but are not limited to, an inability to fully execute on our product development and commerc ial ization plans within the United States or internationally; changes in tax laws or other tax guidance which could adversely affect our cash tax liability, effective tax rates, and results of op era tions and lead to greater audit scrutiny; an inability to execute on our business development strategy or realize the benefits of our planned acquisitions; efficacy, safety, or other quality concern s w ith respect to marketed products, including market actions such as recalls, withdrawals, or declining sales; political and social pressures, or regulatory developments, that adversely impac t d emand for, availability of, or patient access to contraception or fertility products; general economic factors, including recessionary pressures, interest rate and currency exchange rate fluc tua tions; general industry conditions and competition; the impact of the ongoing COVID - 19 pandemic and emergence of variant strains; the impact of pharmaceutical industry regulation and health care legislation in the United States and internationally; global trends toward health care cost containment; technological advances; new products and patents attained by competitors; challen ges inherent in new product development, including obtaining regulatory approval; the company’s ability to accurately predict its future financial results and performance; manufacturing dif ficulties or delays; financial instability of international economies and sovereign risk; difficulties developing and sustaining relationships with commercial counterparties; dependence on the ef fec tiveness of the company’s patents and other protections for innovative products; and the exposure to litigation, including patent litigation, and/or regulatory actions. The company undertakes no obligation to publicly update any forward - looking statement, whether as a result of new information, f uture events or otherwise. Additional factors that could cause results to differ materially from those described in the forward - looking statements can be found in the company’s filings with the Securities and Exchange Commission ("SEC"), including the company’s Annual Report on Form 10 - K for the year ended December 31, 2022, available at the SEC’s Internet site (w ww.sec.gov). 2

Disclaimer statement, cont. Cautionary Note Regarding Non - GAAP Financial Measures This presentation and our press release regarding second quarter 2023 earnings contain “non - GAAP financial measures,” which are financial measures that either exclude or include amounts that are correspondingly not excluded or included in the most directly comparable measures calculated and presented i n a ccordance with U.S. generally accepted accounting principles (“GAAP”). Specifically, the company makes use of the non - GAAP financial measures Adjusted EBITDA, Adjusted Net Income , Adjusted gross margin, Adjusted gross profit and Adjusted diluted EPS, which are not recognized terms under GAAP and are presented only as a supplement to the company’s GAAP fin ancial statements. This presentation and our press release regarding second quarter 2023 earnings also provide certain measures that exclude the impact of foreign exchange. We cal culate foreign exchange by converting our current - period local currency financial results using the prior period average currency rates and comparing these adjusted amounts to our cu rre nt - period results. The company believes that these non - GAAP financial measures help to enhance an understanding of the company’s financial performance. However, the presentation of th ese measures has limitations as an analytical tool and should not be considered in isolation, or as a substitute for the company’s results as reported under GAAP. Because not all c omp anies use identical calculations, the presentations of these non - GAAP measures may not be comparable to other similarly titled measures of other companies. You should refer to Table 4 and T able 5 of our press release regarding second quarter 2023 earnings for relevant definitions and reconciliations of non - GAAP financial measures contained herein to the most directly comparable GAAP measures. In addition, the company’s full - year 2023 guidance measures (other than revenue) are provided on a non - GAAP basis because the co mpany is unable to reasonably predict certain items contained in the GAAP measures. Such items include, but are not limited to, acquisition related expenses, restructuring and r ela ted expenses, stock - based compensation, the ultimate outcome of legal proceedings, unusual gains and losses, the occurrence of matters creating GAAP tax impacts and other items n ot reflective of the company's ongoing operations. The company uses non - GAAP financial measures in its operational and financial decision making, and believes that it is useful to exclude certain items in order to focus on what it regards to be a more meaningful representation of the underlying operating performance of the business. See Slides 21 - 26 of this presentation for a reconciliation of non - GAAP measures. 3

Second quarter 2023 highlights 4 • Revenue of $1.6 billion, up 4% ex - FX • Adjusted EBITDA of $530 million • Diluted EPS of $0.95; Adjusted Diluted EPS of $1.31 • Revenue guidance range raised to $6.25 billion to $6.45 billion • Adjusted EBITDA margin guidance range raised to 31.5% - 33.0% See Slides 21 - 26 of this presentation for a reconciliation of non - GAAP measures.

Growth pillars delivering, Established Brands remains durable Women's Health • Growth of 10% ex - FX, driven by 12% growth in Nexplanon • Double - digit growth in Fertility portfolio driven by COVID - recovery in China and volume growth in LAMERA and U.S. • Growth of 15% ex - FX • Strong demand and volume growth for Renflexis in U.S. and Canada • July 1st launch of Hadlima in U.S . • Stable revenue ex - FX despite VBP impact • Expect franchise to achieve flat performance in 2023 5 Established Brands Biosimilars Women's Health

Express Scripts/Ascent Optum/Emisar United Healthcare Prime Therapeutics, Cigna Optum NPF ESI NPF Source: MMIT Data, includes Commercial, Health Exchange, and Managed Medicaid. Last updated July 10, 2023 | NPF = National P ref erred Formulary U.S. access environment is broader than PBM national formularies 6
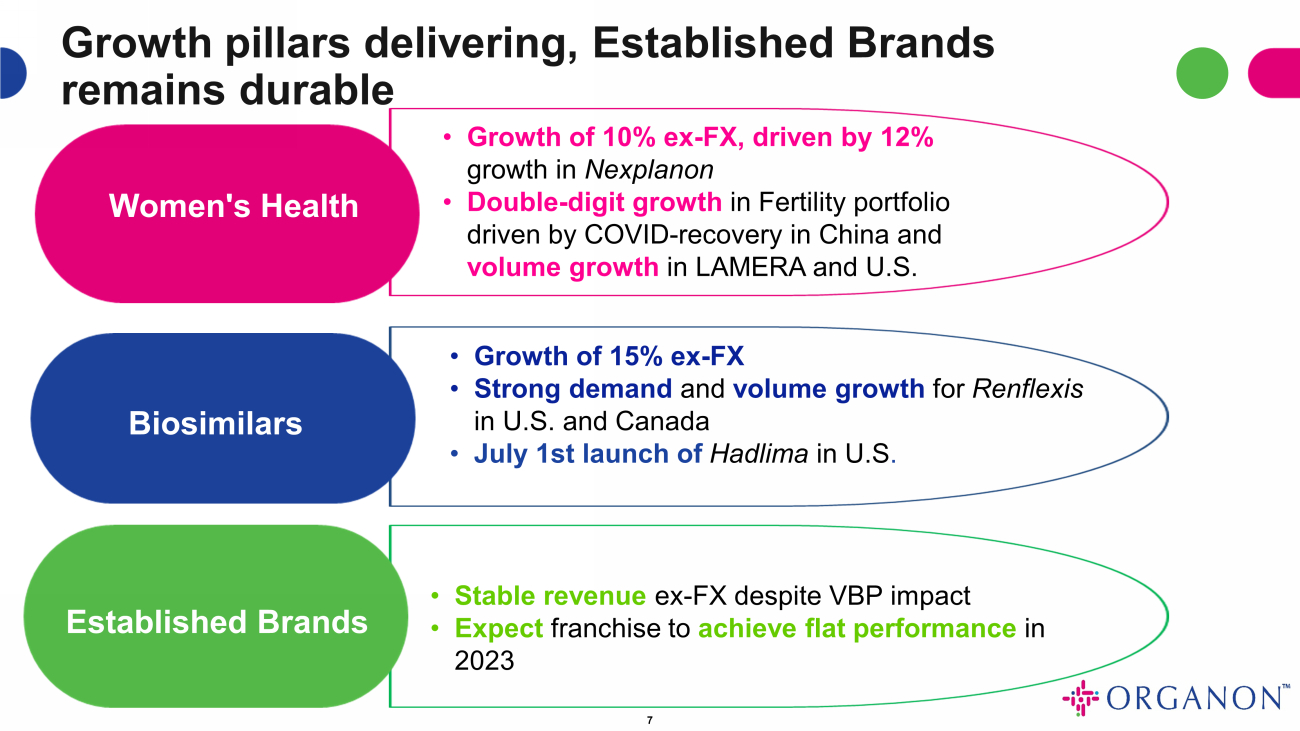
Growth pillars delivering, Established Brands remains durable Women's Health • Growth of 10% ex - FX, driven by 12% growth in Nexplanon • Double - digit growth in Fertility portfolio driven by COVID - recovery in China and volume growth in LAMERA and U.S. • Growth of 15% ex - FX • Strong demand and volume growth for Renflexis in U.S. and Canada • July 1st launch of Hadlima in U.S . • Stable revenue ex - FX despite VBP impact • Expect franchise to achieve flat performance in 2023 7 Established Brands Biosimilars Women's Health

Durability of Established Brands Expanding manufacturing Stemming price erosion Staying power of the brands LCM/ entrepreneurial focus Established Brands 8

+1% reported +4% ex - FX $ mil 9 Volume growth across all three franchises drove sales performance (1) LOE = Loss of Exclusivity (2) VBP = Volume Based Procurement (3) Other includes manufacturing sales to Merck & Co., Inc., Rahway, NJ, USA and other third parties (3) (1) (2) ~0 ~(30) ~115 ~5 ~(40) ~(25) FX ~250 bps headwind to growth in Q2 $1,585 $1,608

China performing well despite VBP; APJ lapping tough comp $ mil Q2 - 23 Q2 - 22 Actual VPY Ex - FX VPY Europe and Canada 467 443 5% 6% United States 371 351 6% 6% Asia Pacific and Japan 261 291 (10)% (5)% China 234 244 (4)% 2% Latin America, Middle East, Russia and Africa 234 216 8% 11% Other (1) 41 40 2% 1% Total Revenues 1,608 1,585 1% 4% 10 ~80% of Q2 sales generated ex - US (1) Other includes manufacturing sales to Merck & Co., Inc., Rahway, NJ, USA and other third parties.

Women’s Health Women’s Health Revenues $ mil Q2 - 23 Q2 - 22 Act VPY Ex - FX VPY 2023 YTD 2022 YTD Act VPY Ex - FX VPY Top Contraception Products Nexplanon ® 214 195 10% 12% 380 366 4% 6% NuvaRing ® 40 42 (5)% (3)% 80 83 (3)% (2)% Marvelon Œ / Mercilon Œ 29 31 (4)% (1)% 67 54 23% 28% Top Fertility Products Follistim ® 70 58 21% 24% 125 119 5% 8% Ganirelix Acetate Injection 34 32 6% 10% 63 61 3% 7% Other Women's Health products 52 51 1% 1% 105 103 2% 3% Total Women's Health 438 408 8% 10% 819 786 4% 6% 11 • Women's Health franchise grew 10% ex - FX • Strong demand in the U.S. for Nexplanon • Fertility growth driven by COVID - 19 recovery in China Totals may not foot due to rounding . Trademarks appearing above in italics are trademarks of, or are used under license by, the Organon group of companies .

Biosimilars Biosimilars Revenues $ mil Q2 - 23 Q2 - 22 Act VPY Ex - FX VPY 2023 YTD 2022 YTD Act VPY Ex - FX VPY Renflexis ® 70 59 19% 20% 132 105 26% 27% Ontruzant ® 33 35 (7)% (7)% 54 57 (7)% (6)% Brenzys Œ 13 14 (6)% 2% 32 28 13% 19% Aybintio Œ 12 9 28% 27% 22 19 17% 19% Hadlima Œ 7 2 258% 285% 12 8 55% 65% Biosimilars 135 119 14% 15% 251 217 16% 18% 12 • Renflexis grew 20% ex - FX, on track for 6 years revenue growth in the U.S. • Strong volume growth for Ontruzant in U.S. offset by competitive pricing environment Totals may not foot due to rounding . Trademarks appearing above in italics are trademarks of, or are used under license by, the Organon group of companies .

Established Brands Established Brands Revenues $ mil Q2 - 23 Q2 - 22 Act VPY Ex - FX VPY 2023 YTD 2022 YTD Act VPY Ex - FX VPY Cardiovascular 401 412 (3)% — % 785 822 (5)% — % Respiratory 250 254 (2)% 2% 542 559 (3)% 1% Non - Opioid Pain, Bone & Derm 200 209 (4)% (2)% 385 410 (6)% (3)% Other 144 143 — % 4% 285 280 2% 7% Total Est. Brands 995 1,018 (2)% — % 1,997 2,072 (4)% 1% 13 • Portfolio achieved flat performance ex - FX despite VBP and impact from market action on injectable steroids • YTD volume growth of 2% offset by 1% price erosion Totals may not foot due to rounding .

P&L reflects continued investment in business $ mil Q2 - 23 Q2 - 22 Actual VPY 2023 YTD 2022 YTD Actual VPY Revenue 1,608 1,585 1 % 3,146 3,152 — % Cost of sales 640 588 9 % 1,220 1,149 6 % Gross profit 968 997 (3) % 1,926 2,003 (4) % Non - GAAP Adjusted Gross profit (1) 1,012 1,047 (3) % 2,015 2,089 (4) % Selling, general and administrative 451 423 7 % 886 794 12 % R&D 128 106 21 % 257 202 27 % Acquired IPR&D and milestones — 97 NM 8 97 NM Total research and development 128 203 (37) % 265 299 (11) % Adjusted EBITDA (2) 530 512 4 % 1,048 1,159 (10) % Diluted Earnings per Share (EPS) (3) 0.95 0.92 4 % 1.64 2.28 (28) % Non - GAAP adjusted diluted EPS (3) 1.31 1.25 5 % 2.39 2.90 (17) % Per share impact to diluted EPS from acquired IPR&D and milestones — (0.30) NM $ — $ (0.30) NM Gross margin 60.2 % 62.9 % 61.2 % 63.5% Non - GAAP Adjusted Gross margin (1) 62.9 % 66.1 % 64.0 % 66.3% Adjusted EBITDA margin (2) 33.0 % 32.3 % 33.3 % 36.8 % 14 (1) See Slide 21 - 24 of this presentation for a reconciliation of Gross Profit to Adjusted Gross Profit. (2) See Slide 25 - 26 of this presentation for a reconciliation of EBITDA and Adjusted EBITDA measures. (3) See Slide 21 - 24 of this presentation for a reconciliation of diluted EPS to non - GAAP adjusted diluted EPS.

15 Bank covenant (*) net leverage ratio ~4.2x; Upward pressure on leverage expected to continue through Q3 2023 Net Debt as of June 30, 2023 $ mil Dec 2021 Dec 2022 Mar 2023 Jun 2023 Cash and cash equivalents 737 706 459 326 Gross Debt (1) 9,134 8,913 8,711 8,730 Net Debt ( 1 ) 8,397 8,207 8,252 8,404 (*) The definition of net debt in the company's credit agreement excludes unamortized fees but includes capitalized lease ob lig ations. Additionally, the LTM EBITDA calculation excludes acquired IPR&D and milestone charges. (1) Debt figures are net of discounts and unamortized fees of $124 million, $105 million, $97 million and $93 million as of D ece mber 31, 2021, December 31, 2022, March 31, 2023 and June 30, 2023 respectively.

16 (1) Free cash flow represents net cash flows provided by operating activities plus capital expenditures, acquired in - process researc h and development, and the effect of exchange rate changes on cash and cash equivalents. On target to generate ~ $1B of free cash flow before one - time charges in 2023 Expect ~75% of FY cash generation in second half, consistent with prior - year period Primarily driven by: Inventory: ~$130M planned builds and higher costs Gross trade account receivables: ~$120M due to timing of Q2 sales Accrual timing: ~$110M

1.2% to +4.5% reported $ mil 17 Continued solid volume growth, partly offset by VBP, LOE and price; limited FX headwinds (1) LOE = Loss of Exclusivity (2) VBP = Volume Based Procurement (3) Other includes manufacturing sales to Merck & Co., Inc., Rahway, NJ, USA and other third parties (3) (1) (2) (50) - (75) (100) - (150) 500 - 600 (25) - (50) 0 - (50) (100) - (125) FX ~0 - 80 bps headwind to growth in 2023 $6,250 - $6,450 $6,174

Full Year 2023 guidance ranges 18 Provided on a Non - GAAP basis, except revenue Guidance provided May 4, 2023 Guidance provided as of August 8, 2023 Revenue $6.150B - $6.450B $6.250B - $6.450B Adjusted gross margin Low - mid 60% range Unchanged SG&A (as % of revenues) Mid 20% range Unchanged R&D (as % of revenues) Upper single - digit Unchanged Adjusted EBITDA margin 31.0% - 33.0% 31.5% - 33.0% Interest expense ~$515 million ~$525 million Depreciation ~$130 million ~$120 million Effective non - GAAP tax rate 19.0% - 21.0% 17.5% - 19.5% Fully diluted weighted avg. shares outstanding ~257 million Unchanged

Q&A

Appendix

Reconciliation of GAAP Reported to Non - GAAP Adjusted Information 21 Three Months Ended June 30, 2023 Unaudited, $ in millions except per share amounts GAAP Spin related Costs (1) Restructuring Stock - based Compensation Amortization Other (1) Non - GAAP Adjusted Revenues $ 1,608 $ 1,608 Cost of sales 640 (10) — (4) (30) — 596 Gross profit 968 1,012 Gross margin 60.2 % 62.9 % Selling, general and administrative 451 (44) — (17) — — 390 Research and development 128 (3) — (4) — — 121 Acquired in - process research and development and milestones — — — — — — — Interest expense 132 — — — — — 132 Exchange losses 2 — — — — — 2 Other expense (income), net 1 (4) — — — — (3) 1,354 1,238 Income before income taxes 254 370 Taxes on income 12 13 — 4 5 — 34 Net income $ 242 $ 336 Earnings per share - Diluted $ 0.95 $ 1.31 ( 1 ) Represents one - time costs . Spin - related includes costs from the separation of Merck & Co . , Inc . , Rahway, NJ, US and Other primarily includes inventory step - up amortization and legal reserves .

Reconciliation of GAAP Reported to Non - GAAP Adjusted Information 22 Three Months Ended June 30, 2022 Unaudited, $ in millions except per share amounts GAAP Spin related Costs (1) Restructuring Stock - based Compensation Amortization Other (1) Non - GAAP Adjusted Revenues $ 1,585 $ 1,585 Cost of sales 588 (6) — (3) (28) (13) 538 Gross profit 997 1,047 Gross margin 62.9 % 66.1 % Selling, general and administrative 423 (28) — (13) — — 382 Research and development 106 (3) — (3) — — 100 Acquired in - process research and development and milestones 97 — — — — — 97 Interest expense 98 — — — — — 98 Exchange gains (21) — — — — — (21) Other expense (income), net 7 (8) — — — — (1) 1,298 1,193 Income before income taxes 287 392 Taxes on income 53 10 — 3 4 3 73 Net income $ 234 $ 319 Earnings per share - Diluted $ 0.92 $ 1.25 ( 1 ) Represents one - time costs . Spin - related includes costs from the separation of Merck & Co . , Inc . , Rahway, NJ, US and Other primarily includes inventory step - up amortization and legal reserves .

Reconciliation of GAAP Reported to Non - GAAP Adjusted Information 23 Six Months Ended June 30, 2023 Unaudited, $ in millions except per share amounts GAAP Spin related Costs (1) Restructuring Stock - based Compensation Amortization Other (1) Non - GAAP Adjusted Revenues $ 3,146 $ 3,146 Cost of sales 1,220 (20) — (8) (59) (2) 1,131 Gross profit 1,926 2,015 Gross margin 61.2 % 64.0 % Selling, general and administrative 886 (90) — (32) — (1) 763 Research and development 257 (6) — (7) — — 244 Acquired in - process research and development and milestones 8 — — — — — 8 Restructuring costs 4 — (4) — — — — Interest expense 264 — — — — — 264 Exchange losses 11 — — — — — 11 Other expense (income), net 7 (10) — — — — (3) 2,657 2,418 Income before income taxes 489 728 Taxes on income 70 26 1 8 11 — 116 Net income $ 419 $ 612 Earnings per share - Diluted $ 1.64 $ 2.39 ( 1 ) Represents one - time costs . Spin - related includes costs from the separation of Merck & Co . , Inc . , Rahway, NJ, US and Other primarily includes inventory step - up amortization and legal reserves .

Reconciliation of GAAP Reported to Non - GAAP Adjusted Information 24 Six Months Ended June 30, 2022 Unaudited, $ in millions except per share amounts GAAP Spin related Costs (1) Restructuring Stock - based Compensation Amortization Other (1) Non - GAAP Adjusted Revenues $ 3,152 $ 3,152 Cost of sales 1,149 (10) — (6) (56) (14) 1,063 Gross profit 2,003 2,089 Gross margin 63.5 % 66.3 % Selling, general and administrative 794 (53) — (23) — — 718 Research and development 202 (6) — (5) — (1) 190 Acquired in - process research and development and milestones 97 — — — — — 97 Interest expense 195 — — — — — 195 Exchange gains (25) — — — — — (25) Other expense (income), net 11 (14) — — — — (3) 2,423 2,235 Income before income taxes 729 917 Taxes on income 147 14 — 5 9 3 178 Net income $ 582 $ 739 Earnings per share - Diluted $ 2.28 $ 2.90 ( 1 ) Represents one - time costs . Spin - related includes costs from the separation of Merck & Co . , Inc . , Rahway, NJ, US and Other primarily includes inventory step - up amortization and legal reserves .

Income before income taxes to Adjusted EBITDA Unaudited, $ in millions Q2 - 2023 Q2 - 2022 Income before income taxes 254 287 Depreciation 28 22 Amortization 30 28 Interest expense 132 98 EBITDA 444 435 Restructuring costs — — One - time costs (1) 61 58 Stock - based compensation 25 19 Adjusted EBITDA 530 512 Adjusted EBITDA margin 33.0 % 32.3 % 25 ( 1 ) One - time costs primarily include costs incurred in connection with the spin - off of Organon, inventory step up adjustments and legal reserves .

Income before income taxes to Adjusted EBITDA Unaudited, $ in millions YTD June 2023 YTD June 2022 Income before income taxes 489 729 Depreciation 56 47 Amortization 59 56 Interest expense 264 195 EBITDA 868 1,027 Restructuring costs 4 — One - time costs (1) 129 98 Stock - based compensation 47 34 Adjusted EBITDA 1,048 1,159 Adjusted EBITDA margin 33.3 % 36.8 % 26 ( 1 ) One - time costs primarily include costs incurred in connection with the spin - off of Organon, inventory step up adjustments and legal reserves .

Franchise performance $ mil Q2 - 2023 Q2 - 2022 Actual VPY Ex - FX VPY 2023 YTD 2022 YTD Actual VPY Ex - FX VPY Women’s Health 438 408 8% 10% 819 786 4% 6% Biosimilars 135 119 14% 15% 251 217 16% 18% Est. Brands 995 1,018 (2)% — % 1,997 2,072 (4)% 1% Other (1) 40 40 (2)% (1)% 79 76 — % — % Total Revenues 1,608 1,585 1% 4% 3,146 3,152 — % 3% (1) Other includes manufacturing sales to Merck & Co., Inc., Rahway, NJ, USA and other third parties 27

Nexplanon LTM view normalizes for tender phasing and buy - in / buy - out in the U.S . $ mil 28 % Product Sales Growth *LTM * LTM: “Last 12 Months” | % Growth expressed at constant currency Pre - spin

Established Brands demonstrating stability $ mil 29 % Product Sales Growth *LTM Pre - spin * LTM: “Last 12 Months” | % Growth expressed at constant currency

Number of products 13 5 49 Women’s Health Biosimilars Established Brands Broad and diverse portfolio 30 TM TM

Reinvesting in the business to create a pipeline of future revenue opportunities 31 Commercialized/soon to be commercialized asset Building a pipeline Licensing Agreement for Xaciato Œ (clindamycin phosphate vaginal gel, 2%) March 2022 Bacterial Vaginosis Gel FDA - approved for BV in females 12 and over, the most common cause of vaginits worldwide estimated to affect approximately 21 million women in the US. (1) Marvelon Œ (desogestrel and ethinyl estradiol) and Mercilon Œ (desogestrel and ethinyl estradiol) February 2022 Contraception Expanding portfolio - recapturing commercial rights to certain currently marketed products in Asia Acquisition of Alydia Health/JADA® System June 2021 Medical Device Postpartum hemorrhage - one of the most common complications of birth, requiring pharmacologic treatment in up to 10% of mothers (2) Claria Medical January 2023 Medical Device Being studied for use during minimally invasive laparoscopic hysterectomy - one of the most commonly performed surgeries for women Cirqle Biomedical July 2022 Contraception Expanding portfolio - preclinical, non - hormonal contraceptive candidate, large, unmet need for non - hormonal contraception Licensing Agreement for biosimilar candidates referencing Perjeta (3) and Prolia (3) /Xgeva (3) through Shanghai Henlius June 2022 Biosimilar Candidates for Osteoporosis and Breast Cancer Exclusive global commercialization rights except for China; including Hong Kong, Macau and Taiwan Licensing Agreement for Ebopiprant July 2021 Pre - term Labor 15 million babies (11.1% of all live births) born pre - term every year (4) Forendo Pharma December 2021 Endometriosis Clinical stage / Phase 2a/2b - chronic condition that affects up to 1 in 10 of reproductive age women / girls globally (5) (1) Centers for Disease Control and Prevention Bacterial Vaginosis CDC Fact Sheet: https://www.cdc.gov/std/bv/stdfact - bacterial - vaginosis (2) Widmer M et al. "Heat - Stable Carbetocin versus Oxytocin to Prevent Hemorrhage after Vaginal Birth." N Engl J Med 2018; 379:743 - 752 (3) Perjeta is a trademark registered in the U.S. in the name of Genentech, Inc.; Prolia and Xgeva are trademarks registered in the U.S. in the name of Amgen Inc (4) WHO Key Facts, 2018: https://www.who.int/news - room/fact - sheets/detail/preterm - birth (5) WHO Key Facts, 2023: .https://www.who.int/news - room/fact - sheets/detail/endometriosis
v3.23.2
| X |
- DefinitionBoolean flag that is true when the XBRL content amends previously-filed or accepted submission.
| Name: |
dei_AmendmentFlag |
| Namespace Prefix: |
dei_ |
| Data Type: |
xbrli:booleanItemType |
| Balance Type: |
na |
| Period Type: |
duration |
|
| X |
- DefinitionFor the EDGAR submission types of Form 8-K: the date of the report, the date of the earliest event reported; for the EDGAR submission types of Form N-1A: the filing date; for all other submission types: the end of the reporting or transition period. The format of the date is YYYY-MM-DD.
| Name: |
dei_DocumentPeriodEndDate |
| Namespace Prefix: |
dei_ |
| Data Type: |
xbrli:dateItemType |
| Balance Type: |
na |
| Period Type: |
duration |
|
| X |
- DefinitionThe type of document being provided (such as 10-K, 10-Q, 485BPOS, etc). The document type is limited to the same value as the supporting SEC submission type, or the word 'Other'.
| Name: |
dei_DocumentType |
| Namespace Prefix: |
dei_ |
| Data Type: |
dei:submissionTypeItemType |
| Balance Type: |
na |
| Period Type: |
duration |
|
| X |
- DefinitionAddress Line 1 such as Attn, Building Name, Street Name
| Name: |
dei_EntityAddressAddressLine1 |
| Namespace Prefix: |
dei_ |
| Data Type: |
xbrli:normalizedStringItemType |
| Balance Type: |
na |
| Period Type: |
duration |
|
| X |
- DefinitionAddress Line 2 such as Street or Suite number
| Name: |
dei_EntityAddressAddressLine2 |
| Namespace Prefix: |
dei_ |
| Data Type: |
xbrli:normalizedStringItemType |
| Balance Type: |
na |
| Period Type: |
duration |
|
| X |
- Definition
+ References
+ Details
| Name: |
dei_EntityAddressCityOrTown |
| Namespace Prefix: |
dei_ |
| Data Type: |
xbrli:normalizedStringItemType |
| Balance Type: |
na |
| Period Type: |
duration |
|
| X |
- DefinitionCode for the postal or zip code
| Name: |
dei_EntityAddressPostalZipCode |
| Namespace Prefix: |
dei_ |
| Data Type: |
xbrli:normalizedStringItemType |
| Balance Type: |
na |
| Period Type: |
duration |
|
| X |
- DefinitionName of the state or province.
| Name: |
dei_EntityAddressStateOrProvince |
| Namespace Prefix: |
dei_ |
| Data Type: |
dei:stateOrProvinceItemType |
| Balance Type: |
na |
| Period Type: |
duration |
|
| X |
- DefinitionA unique 10-digit SEC-issued value to identify entities that have filed disclosures with the SEC. It is commonly abbreviated as CIK. Reference 1: http://www.xbrl.org/2003/role/presentationRef
-Publisher SEC
-Name Exchange Act
-Number 240
-Section 12
-Subsection b-2
| Name: |
dei_EntityCentralIndexKey |
| Namespace Prefix: |
dei_ |
| Data Type: |
dei:centralIndexKeyItemType |
| Balance Type: |
na |
| Period Type: |
duration |
|
| X |
- DefinitionIndicate if registrant meets the emerging growth company criteria. Reference 1: http://www.xbrl.org/2003/role/presentationRef
-Publisher SEC
-Name Exchange Act
-Number 240
-Section 12
-Subsection b-2
| Name: |
dei_EntityEmergingGrowthCompany |
| Namespace Prefix: |
dei_ |
| Data Type: |
xbrli:booleanItemType |
| Balance Type: |
na |
| Period Type: |
duration |
|
| X |
- DefinitionCommission file number. The field allows up to 17 characters. The prefix may contain 1-3 digits, the sequence number may contain 1-8 digits, the optional suffix may contain 1-4 characters, and the fields are separated with a hyphen.
| Name: |
dei_EntityFileNumber |
| Namespace Prefix: |
dei_ |
| Data Type: |
dei:fileNumberItemType |
| Balance Type: |
na |
| Period Type: |
duration |
|
| X |
- DefinitionTwo-character EDGAR code representing the state or country of incorporation.
| Name: |
dei_EntityIncorporationStateCountryCode |
| Namespace Prefix: |
dei_ |
| Data Type: |
dei:edgarStateCountryItemType |
| Balance Type: |
na |
| Period Type: |
duration |
|
| X |
- DefinitionThe exact name of the entity filing the report as specified in its charter, which is required by forms filed with the SEC. Reference 1: http://www.xbrl.org/2003/role/presentationRef
-Publisher SEC
-Name Exchange Act
-Number 240
-Section 12
-Subsection b-2
| Name: |
dei_EntityRegistrantName |
| Namespace Prefix: |
dei_ |
| Data Type: |
xbrli:normalizedStringItemType |
| Balance Type: |
na |
| Period Type: |
duration |
|
| X |
- DefinitionThe Tax Identification Number (TIN), also known as an Employer Identification Number (EIN), is a unique 9-digit value assigned by the IRS. Reference 1: http://www.xbrl.org/2003/role/presentationRef
-Publisher SEC
-Name Exchange Act
-Number 240
-Section 12
-Subsection b-2
| Name: |
dei_EntityTaxIdentificationNumber |
| Namespace Prefix: |
dei_ |
| Data Type: |
dei:employerIdItemType |
| Balance Type: |
na |
| Period Type: |
duration |
|
| X |
- DefinitionLocal phone number for entity.
| Name: |
dei_LocalPhoneNumber |
| Namespace Prefix: |
dei_ |
| Data Type: |
xbrli:normalizedStringItemType |
| Balance Type: |
na |
| Period Type: |
duration |
|
| X |
- DefinitionBoolean flag that is true when the Form 8-K filing is intended to satisfy the filing obligation of the registrant as pre-commencement communications pursuant to Rule 13e-4(c) under the Exchange Act. Reference 1: http://www.xbrl.org/2003/role/presentationRef
-Publisher SEC
-Name Exchange Act
-Number 240
-Section 13e
-Subsection 4c
| Name: |
dei_PreCommencementIssuerTenderOffer |
| Namespace Prefix: |
dei_ |
| Data Type: |
xbrli:booleanItemType |
| Balance Type: |
na |
| Period Type: |
duration |
|
| X |
- DefinitionBoolean flag that is true when the Form 8-K filing is intended to satisfy the filing obligation of the registrant as pre-commencement communications pursuant to Rule 14d-2(b) under the Exchange Act. Reference 1: http://www.xbrl.org/2003/role/presentationRef
-Publisher SEC
-Name Exchange Act
-Number 240
-Section 14d
-Subsection 2b
| Name: |
dei_PreCommencementTenderOffer |
| Namespace Prefix: |
dei_ |
| Data Type: |
xbrli:booleanItemType |
| Balance Type: |
na |
| Period Type: |
duration |
|
| X |
- DefinitionTitle of a 12(b) registered security. Reference 1: http://www.xbrl.org/2003/role/presentationRef
-Publisher SEC
-Name Exchange Act
-Number 240
-Section 12
-Subsection b
| Name: |
dei_Security12bTitle |
| Namespace Prefix: |
dei_ |
| Data Type: |
dei:securityTitleItemType |
| Balance Type: |
na |
| Period Type: |
duration |
|
| X |
- DefinitionName of the Exchange on which a security is registered. Reference 1: http://www.xbrl.org/2003/role/presentationRef
-Publisher SEC
-Name Exchange Act
-Number 240
-Section 12
-Subsection d1-1
| Name: |
dei_SecurityExchangeName |
| Namespace Prefix: |
dei_ |
| Data Type: |
dei:edgarExchangeCodeItemType |
| Balance Type: |
na |
| Period Type: |
duration |
|
| X |
- DefinitionBoolean flag that is true when the Form 8-K filing is intended to satisfy the filing obligation of the registrant as soliciting material pursuant to Rule 14a-12 under the Exchange Act. Reference 1: http://www.xbrl.org/2003/role/presentationRef
-Publisher SEC
-Name Exchange Act
-Section 14a
-Number 240
-Subsection 12
| Name: |
dei_SolicitingMaterial |
| Namespace Prefix: |
dei_ |
| Data Type: |
xbrli:booleanItemType |
| Balance Type: |
na |
| Period Type: |
duration |
|
| X |
- DefinitionTrading symbol of an instrument as listed on an exchange.
| Name: |
dei_TradingSymbol |
| Namespace Prefix: |
dei_ |
| Data Type: |
dei:tradingSymbolItemType |
| Balance Type: |
na |
| Period Type: |
duration |
|
| X |
- DefinitionBoolean flag that is true when the Form 8-K filing is intended to satisfy the filing obligation of the registrant as written communications pursuant to Rule 425 under the Securities Act. Reference 1: http://www.xbrl.org/2003/role/presentationRef
-Publisher SEC
-Name Securities Act
-Number 230
-Section 425
| Name: |
dei_WrittenCommunications |
| Namespace Prefix: |
dei_ |
| Data Type: |
xbrli:booleanItemType |
| Balance Type: |
na |
| Period Type: |
duration |
|
Organon (NYSE:OGN)
Historical Stock Chart
Von Apr 2024 bis Mai 2024

Organon (NYSE:OGN)
Historical Stock Chart
Von Mai 2023 bis Mai 2024
