UNITED STATES
SECURITIES AND
EXCHANGE COMMISSION
Washington, D.C.
20549
FORM 6-K
Report of Foreign
Private Issuer Pursuant to Rule 13a-16 or 15d-16
under the Securities Exchange Act of 1934
For the month of August 2023
Commission File Number 001-11444
| |
| MAGNA INTERNATIONAL INC. |
| (Exact Name of Registrant as specified in its Charter) |
| |
| 337 Magna Drive, Aurora, Ontario, Canada L4G 7K1 |
| (Address of principal executive office) |
Indicate by check mark whether the registrant files or will file annual
reports under cover Form 20-F or Form 40-F.
Form 20-F
☐ Form 40-F
☒
SIGNATURES
Pursuant to the requirements of the Securities Exchange Act of 1934,
the registrant has duly caused this report to be signed on its behalf by the undersigned, thereunto duly authorized.
|
|
MAGNA INTERNATIONAL INC.
(Registrant) |
|
| |
|
|
| Date: August 4, 2023 |
|
|
| |
By: |
/s/ “Bassem Shakeel” |
|
| |
|
Bassem A. Shakeel, |
|
| |
|
Vice-President, Associate General Counsel
and Corporate Secretary |
|
EXHIBITS
Exhibit 99.1
| FINANCIAL REVIEW OF MAGNA INTERNATIONAL INC. |
| (United States dollars in millions, except per share figures) (Unaudited) |
| Prepared in accordance with U.S. GAAP |
| |
|
|
|
|
|
|
|
|
|
|
|
|
|
|
|
|
|
|
|
|
|
| |
|
|
|
|
|
|
2021 |
|
2022 |
|
2023 |
| |
|
|
|
|
Note |
|
1st Q |
2nd Q |
3rd Q |
4th Q |
TOTAL |
|
1st Q |
2nd Q |
3rd Q |
4th Q |
TOTAL |
|
1st Q |
2nd Q |
TOTAL |
| VEHICLE VOLUME STATISTICS (in
millions) |
|
|
|
|
|
|
|
|
|
| North American vehicle volumes (including Mexico) |
|
|
3.752 |
3.213 |
2.921 |
3.219 |
13.105 |
|
3.621 |
3.551 |
3.607 |
3.524 |
14.303 |
|
3.893 |
4.036 |
7.929 |
| European vehicle volumes: |
|
|
|
|
|
|
|
|
|
|
|
|
|
|
|
|
|
| |
Western Europe |
|
|
|
3.046 |
2.444 |
1.785 |
2.393 |
9.668 |
|
2.493 |
2.598 |
2.295 |
2.706 |
10.092 |
|
3.010 |
2.923 |
5.933 |
| |
Eastern Europe |
|
|
|
1.870 |
1.671 |
1.212 |
1.650 |
6.403 |
|
1.509 |
1.411 |
1.310 |
1.494 |
5.724 |
|
1.528 |
1.609 |
3.137 |
| |
|
Total Europe |
|
|
4.916 |
4.115 |
2.997 |
4.043 |
16.071 |
|
4.002 |
4.009 |
3.605 |
4.200 |
15.816 |
|
4.538 |
4.532 |
9.070 |
| |
|
|
|
|
|
|
|
|
|
|
|
|
|
|
|
|
|
|
|
|
|
| Asia volumes |
|
|
|
|
11.548 |
10.391 |
9.670 |
12.251 |
43.860 |
|
11.549 |
10.351 |
12.545 |
12.761 |
47.206 |
|
11.726 |
12.152 |
23.878 |
| |
|
|
|
|
|
|
|
|
|
|
|
|
|
|
|
|
|
|
|
|
|
| China volumes |
|
|
|
|
6.032 |
5.699 |
5.438 |
7.366 |
24.535 |
|
6.367 |
5.488 |
7.232 |
7.266 |
26.353 |
|
5.936 |
6.648 |
12.584 |
| |
|
|
|
|
|
|
|
|
|
|
|
|
|
|
|
|
|
|
|
|
|
| Magna Steyr vehicle assembly volumes |
|
|
0.040 |
0.030 |
0.023 |
0.033 |
0.126 |
|
0.025 |
0.031 |
0.025 |
0.027 |
0.108 |
|
0.034 |
0.027 |
0.061 |
| |
|
|
|
|
|
|
|
|
|
|
|
|
|
|
|
|
|
|
|
|
|
| AVERAGE FOREIGN EXCHANGE RATES |
|
|
|
|
|
|
|
|
|
|
|
|
|
|
|
|
|
| 1 Canadian dollar equals U.S. dollars |
|
|
0.790 |
0.814 |
0.794 |
0.794 |
0.798 |
|
0.790 |
0.783 |
0.765 |
0.737 |
0.769 |
|
0.740 |
0.745 |
0.743 |
| 1 Euro equals U.S. dollars |
|
|
1.205 |
1.206 |
1.178 |
1.144 |
1.183 |
|
1.123 |
1.064 |
1.006 |
1.019 |
1.053 |
|
1.073 |
1.089 |
1.081 |
| 1 Chinese renminbi equals U.S. dollars |
|
|
0.154 |
0.155 |
0.155 |
0.156 |
0.155 |
|
0.158 |
0.151 |
0.146 |
0.140 |
0.149 |
|
0.146 |
0.143 |
0.144 |
| |
|
|
|
|
|
|
|
|
|
|
|
|
|
|
|
|
|
|
|
|
|
| CONSOLIDATED
STATEMENTS OF INCOME (LOSS) |
|
|
|
|
|
|
|
|
|
|
|
|
|
|
|
|
|
| Sales: |
|
|
|
|
|
|
|
|
|
|
|
|
|
|
|
|
|
|
|
|
| |
|
Body Exteriors & Structures |
|
|
4,025 |
3,647 |
3,185 |
3,620 |
14,477 |
|
4,077 |
3,947 |
3,976 |
4,004 |
16,004 |
|
4,439 |
4,540 |
8,979 |
| |
|
Power & Vision |
|
|
3,156 |
2,881 |
2,501 |
2,804 |
11,342 |
|
3,046 |
2,888 |
2,911 |
3,016 |
11,861 |
|
3,323 |
3,462 |
6,785 |
| |
|
Seating Systems |
|
|
1,303 |
1,166 |
1,123 |
1,299 |
4,891 |
|
1,376 |
1,253 |
1,295 |
1,345 |
5,269 |
|
1,486 |
1,603 |
3,089 |
| |
|
Complete Vehicles |
|
|
1,850 |
1,490 |
1,255 |
1,511 |
6,106 |
|
1,275 |
1,403 |
1,213 |
1,330 |
5,221 |
|
1,626 |
1,526 |
3,152 |
| |
|
Corporate & Other |
|
|
(155) |
(150) |
(145) |
(124) |
(574) |
|
(132) |
(129) |
(127) |
(127) |
(515) |
|
(201) |
(149) |
(350) |
| Sales |
|
|
|
|
|
10,179 |
9,034 |
7,919 |
9,110 |
36,242 |
|
9,642 |
9,362 |
9,268 |
9,568 |
37,840 |
|
10,673 |
10,982 |
21,655 |
| |
|
|
|
|
|
|
|
|
|
|
|
|
|
|
|
|
|
|
|
|
|
| Costs and expenses: |
|
|
|
|
|
|
|
|
|
|
|
|
|
|
|
|
|
|
| |
Cost of goods sold |
|
|
8,662 |
7,728 |
6,885 |
7,822 |
31,097 |
|
8,400 |
8,259 |
8,126 |
8,403 |
33,188 |
|
9,416 |
9,544 |
18,960 |
| |
Selling, general and administrative |
|
|
430 |
419 |
454 |
414 |
1,717 |
|
386 |
410 |
387 |
477 |
1,660 |
|
488 |
505 |
993 |
| |
Equity income |
|
|
|
(47) |
(44) |
(34) |
(23) |
(148) |
|
(20) |
(25) |
(27) |
(17) |
(89) |
|
(33) |
(36) |
(69) |
| |
EBITDA |
|
|
1 |
|
1,134 |
931 |
614 |
897 |
3,576 |
|
876 |
718 |
782 |
705 |
3,081 |
|
802 |
969 |
1,771 |
| |
Depreciation and amortization |
|
|
364 |
374 |
385 |
389 |
1,512 |
|
369 |
360 |
341 |
349 |
1,419 |
|
365 |
366 |
731 |
| |
EBIT |
|
|
2 |
|
770 |
557 |
229 |
508 |
2,064 |
|
507 |
358 |
441 |
356 |
1,662 |
|
437 |
603 |
1,040 |
| |
Interest expense, net |
|
|
23 |
11 |
22 |
22 |
78 |
|
26 |
20 |
18 |
17 |
81 |
|
20 |
34 |
54 |
| |
|
|
|
|
|
|
|
|
|
|
|
|
|
|
|
|
|
|
|
|
|
| Operating income |
|
1 |
|
747 |
546 |
207 |
486 |
1,986 |
|
481 |
338 |
423 |
339 |
1,581 |
|
417 |
569 |
986 |
| Other expense (income), net |
1 |
|
(58) |
6 |
180 |
(90) |
38 |
|
61 |
426 |
23 |
193 |
703 |
|
142 |
86 |
228 |
| Income (loss) from operations before income
taxes |
|
|
805 |
540 |
27 |
576 |
1,948 |
|
420 |
(88) |
400 |
146 |
878 |
|
275 |
483 |
758 |
| Income tax expense |
|
|
|
183 |
104 |
10 |
98 |
395 |
|
41 |
57 |
104 |
35 |
237 |
|
58 |
129 |
187 |
| |
|
|
|
|
|
|
|
|
|
|
|
|
|
|
|
|
|
|
|
|
|
| Net income (loss) |
|
|
|
622 |
436 |
17 |
478 |
1,553 |
|
379 |
(145) |
296 |
111 |
641 |
|
217 |
354 |
571 |
| (Income) loss attributable to non-controlling interests |
1 |
|
(7) |
(12) |
(6) |
(14) |
(39) |
|
(15) |
(11) |
(7) |
(16) |
(49) |
|
(8) |
(15) |
(23) |
| Net income (loss) attributable to Magna International Inc. |
|
|
615 |
424 |
11 |
464 |
1,514 |
|
364 |
(156) |
289 |
95 |
592 |
|
209 |
339 |
548 |
| |
|
|
|
|
|
|
|
|
|
|
|
|
|
|
|
|
|
|
|
|
|
| |
|
|
|
|
|
|
|
|
|
|
|
|
|
|
|
|
|
|
|
|
|
| Adjusted net income attributable to Magna International Inc. |
1 |
|
566 |
426 |
170 |
391 |
1,553 |
|
383 |
243 |
308 |
261 |
1,195 |
|
319 |
430 |
749 |
| |
|
|
|
|
|
|
|
|
|
|
|
|
|
|
|
|
|
|
|
|
|
| Diluted earnings (loss) per share: |
|
|
|
|
|
|
|
|
|
|
|
|
|
|
|
|
|
| |
Diluted |
|
|
|
|
$ 2.03 |
$ 1.40 |
$ 0.04 |
$ 1.54 |
$ 5.00 |
|
$ 1.22 |
$ (0.54) |
$ 1.00 |
$ 0.33 |
$ 2.03 |
|
$ 0.73 |
$ 1.18 |
$ 1.91 |
| |
Adjusted Diluted |
|
|
|
$ 1.86 |
$ 1.40 |
$ 0.56 |
$ 1.30 |
$ 5.13 |
|
$ 1.28 |
$ 0.83 |
$ 1.07 |
$ 0.91 |
$ 4.83 |
|
$ 1.11 |
$ 1.50 |
$ 2.61 |
| |
|
|
|
|
|
|
|
|
|
|
|
|
|
|
|
|
|
|
|
|
|
| |
|
|
|
|
|
|
|
|
|
|
|
|
|
|
|
|
|
|
|
|
|
| Weighted average number of Common Shares outstanding |
|
|
|
|
|
|
|
|
|
|
|
|
|
|
|
|
|
| |
during the year (in millions): |
|
|
303.6 |
303.6 |
302.6 |
301.5 |
302.8 |
|
298.1 |
291.1 |
288.5 |
286.3 |
291.2 |
|
286.6 |
286.3 |
286.4 |
| |
|
|
|
|
|
|
|
|
|
|
|
|
|
|
|
|
|
|
|
|
|
| PROFITABILITY RATIOS |
|
|
|
|
|
|
|
|
|
|
|
|
|
|
|
|
|
| |
Selling, general and administrative /Sales |
|
|
4.2% |
4.6% |
5.7% |
4.5% |
4.7% |
|
4.0% |
4.4% |
4.2% |
5.0% |
4.4% |
|
4.6% |
4.6% |
4.6% |
| |
EBITDA /Sales |
|
|
|
11.1% |
10.3% |
7.8% |
9.8% |
9.9% |
|
9.1% |
7.7% |
8.4% |
7.4% |
8.1% |
|
7.5% |
8.8% |
8.2% |
| |
EBIT /Sales |
|
|
|
|
7.6% |
6.2% |
2.9% |
5.6% |
5.7% |
|
5.3% |
3.8% |
4.8% |
3.7% |
4.4% |
|
4.1% |
5.5% |
4.8% |
| |
Operating income /Sales |
|
|
7.3% |
6.0% |
2.6% |
5.3% |
5.5% |
|
5.0% |
3.6% |
4.6% |
3.5% |
4.2% |
|
3.9% |
5.2% |
4.6% |
| |
Effective tax rate |
|
|
|
|
|
|
|
|
|
|
|
|
|
|
|
|
|
| |
|
Reported |
|
|
|
22.7% |
19.3% |
37.0% |
17.0% |
20.3% |
|
9.8% |
-64.8% |
26.0% |
24.0% |
27.0% |
|
21.1% |
26.7% |
24.7% |
| |
|
Excluding Other expense (income), net of taxes |
|
|
23.3% |
19.8% |
15.0% |
16.7% |
19.8% |
|
17.3% |
24.9% |
25.5% |
18.3% |
21.3% |
|
21.6% |
21.8% |
21.7% |
| FINANCIAL REVIEW OF MAGNA INTERNATIONAL INC. |
| CONSOLIDATED BALANCE SHEETS |
| (United States dollars in millions) (Unaudited) |
| |
|
|
|
|
|
|
|
|
|
|
|
|
|
|
|
|
|
|
| |
|
|
|
|
2021 |
|
|
2022 |
|
|
2023 |
| |
|
|
|
|
1st Q |
2nd Q |
3rd Q |
4th Q |
|
|
1st Q |
2nd Q |
3rd Q |
4th Q |
|
|
1st Q |
2nd Q |
| FUNDS EMPLOYED |
|
|
|
|
|
|
|
|
|
|
|
|
|
|
|
|
| Current assets: |
|
|
|
|
|
|
|
|
|
|
|
|
|
|
|
|
| |
Accounts receivable |
|
|
7,176 |
6,531 |
6,082 |
6,307 |
|
|
7,006 |
6,764 |
7,082 |
6,791 |
|
|
7,959 |
8,556 |
| |
Inventories |
|
|
3,645 |
3,999 |
4,150 |
3,969 |
|
|
4,258 |
4,064 |
4,108 |
4,180 |
|
|
4,421 |
4,664 |
| |
Prepaid expenses and other |
|
|
290 |
294 |
247 |
278 |
|
|
310 |
262 |
269 |
320 |
|
|
367 |
455 |
| |
|
|
|
|
11,111 |
10,824 |
10,479 |
10,554 |
|
|
11,574 |
11,090 |
11,459 |
11,291 |
|
|
12,747 |
13,675 |
| Current liabilities: |
|
|
|
|
|
|
|
|
|
|
|
|
|
|
|
|
| |
Accounts payable |
|
|
6,787 |
6,248 |
5,914 |
6,465 |
|
|
6,845 |
6,443 |
6,624 |
6,999 |
|
|
7,731 |
7,984 |
| |
Accrued salaries and wages |
|
|
897 |
912 |
893 |
851 |
|
|
879 |
766 |
810 |
850 |
|
|
822 |
858 |
| |
Other accrued liabilities |
|
|
2,298 |
2,186 |
2,070 |
2,156 |
|
|
2,123 |
2,096 |
1,986 |
2,118 |
|
|
2,526 |
2,637 |
| |
Income taxes payable (receivable) |
|
|
109 |
123 |
125 |
200 |
|
|
190 |
136 |
97 |
93 |
|
|
9 |
(14) |
| |
|
|
|
|
10,091 |
9,469 |
9,002 |
9,672 |
|
|
10,037 |
9,441 |
9,517 |
10,060 |
|
|
11,088 |
11,465 |
| |
|
|
|
|
|
|
|
|
|
|
|
|
|
|
|
|
|
|
| Working capital |
|
|
1,020 |
1,355 |
1,477 |
882 |
|
|
1,537 |
1,649 |
1,942 |
1,231 |
|
|
1,659 |
2,210 |
| |
|
|
|
|
|
|
|
|
|
|
|
|
|
|
|
|
| Investments |
|
|
960 |
1,124 |
1,455 |
1,593 |
|
|
1,487 |
1,375 |
1,323 |
1,429 |
|
|
1,390 |
1,287 |
| Fixed assets, net |
|
|
8,305 |
8,297 |
8,166 |
8,293 |
|
|
8,090 |
7,723 |
7,470 |
8,173 |
|
|
8,304 |
8,646 |
| Goodwill, other assets and intangible assets |
|
|
3,614 |
3,632 |
3,530 |
3,577 |
|
|
3,544 |
3,353 |
3,280 |
3,576 |
|
|
3,640 |
4,733 |
| Operating lease right-of-use assets |
|
|
1,869 |
1,854 |
1,731 |
1,700 |
|
|
1,667 |
1,587 |
1,545 |
1,595 |
|
|
1,638 |
1,667 |
| Funds employed |
|
|
15,768 |
16,262 |
16,359 |
16,045 |
|
|
16,325 |
15,687 |
15,560 |
16,004 |
|
|
16,631 |
18,543 |
| FINANCING |
|
|
|
|
|
|
|
|
|
|
|
|
|
|
|
|
| Straight debt: |
|
|
|
|
|
|
|
|
|
|
|
|
|
|
|
|
| |
Cash and cash equivalents |
|
|
(3,464) |
(3,426) |
(2,748) |
(2,948) |
|
|
(1,996) |
(1,664) |
(1,102) |
(1,234) |
|
|
(2,429) |
(1,281) |
| |
Short-term borrowings |
|
|
- |
- |
- |
- |
|
|
- |
- |
- |
8 |
|
|
4 |
150 |
| |
Long-term debt due within one year |
|
|
137 |
117 |
101 |
455 |
|
|
127 |
105 |
95 |
654 |
|
|
668 |
1,426 |
| |
Long-term debt |
|
|
3,935 |
3,941 |
3,908 |
3,538 |
|
|
3,501 |
3,408 |
3,325 |
2,847 |
|
|
4,500 |
4,159 |
| |
Current portion of operating lease liabilities |
|
|
244 |
278 |
269 |
274 |
|
|
276 |
270 |
266 |
276 |
|
|
285 |
303 |
| |
Operating lease liabilities |
|
|
1,613 |
1,563 |
1,438 |
1,406 |
|
|
1,369 |
1,294 |
1,254 |
1,288 |
|
|
1,318 |
1,345 |
| |
|
|
|
|
2,465 |
2,473 |
2,968 |
2,725 |
|
|
3,277 |
3,413 |
3,838 |
3,839 |
|
|
4,346 |
6,102 |
| Long-term employee benefit liabilities |
|
|
733 |
743 |
716 |
700 |
|
|
686 |
651 |
617 |
548 |
|
|
563 |
579 |
| Other long-term liabilities |
|
|
414 |
482 |
466 |
376 |
|
|
374 |
390 |
397 |
461 |
|
|
451 |
448 |
| Deferred tax liabilities, net |
|
|
104 |
124 |
40 |
19 |
|
|
(51) |
(111) |
(138) |
(179) |
|
|
(218) |
(242) |
| |
|
|
|
|
1,251 |
1,349 |
1,222 |
1,095 |
|
|
1,009 |
930 |
876 |
830 |
|
|
796 |
785 |
| Shareholders' equity |
|
|
12,052 |
12,440 |
12,169 |
12,225 |
|
|
12,039 |
11,344 |
10,846 |
11,335 |
|
|
11,489 |
11,656 |
| |
|
|
|
|
15,768 |
16,262 |
16,359 |
16,045 |
|
|
16,325 |
15,687 |
15,560 |
16,004 |
|
|
16,631 |
18,543 |
| |
|
|
|
|
|
|
|
|
|
|
|
|
|
|
|
|
|
|
| ASSET UTILIZATION RATIOS |
|
|
|
|
|
|
|
|
|
|
|
|
|
|
|
|
| |
Days in accounts receivable |
|
|
63.4 |
65.1 |
69.1 |
62.3 |
|
|
65.4 |
65.0 |
68.8 |
63.9 |
|
|
67.1 |
70.1 |
| |
Days in accounts payable |
|
|
70.5 |
72.8 |
77.3 |
74.4 |
|
|
73.3 |
70.2 |
73.4 |
75.0 |
|
|
73.9 |
75.3 |
| |
Inventory turnover - cost of sales |
|
|
9.5 |
7.7 |
6.6 |
7.9 |
|
|
7.9 |
8.1 |
7.9 |
8.0 |
|
|
8.5 |
8.2 |
| |
Working capital turnover |
|
|
39.9 |
26.7 |
21.4 |
41.3 |
|
|
25.1 |
22.7 |
19.1 |
31.1 |
|
|
25.7 |
19.9 |
| |
Total asset turnover |
|
|
2.6 |
2.2 |
1.9 |
2.3 |
|
|
2.4 |
2.4 |
2.4 |
2.4 |
|
|
2.6 |
2.4 |
| |
|
|
|
|
|
|
|
|
|
|
|
|
|
|
|
|
|
|
| CAPITAL STRUCTURE |
|
|
|
|
|
|
|
|
|
|
|
|
|
|
|
|
| |
Straight debt |
|
|
15.6% |
15.2% |
18.1% |
17.0% |
|
|
20.1% |
21.8% |
24.7% |
24.0% |
|
|
26.1% |
32.9% |
| |
Long-term employee benefit liabilities, other long-term |
|
|
|
|
|
|
|
|
|
|
|
|
|
|
|
|
| |
|
liabilities & deferred tax liabilities, net |
|
|
7.9% |
8.3% |
7.5% |
6.8% |
|
|
6.2% |
5.9% |
5.6% |
5.2% |
|
|
4.8% |
4.2% |
| |
Shareholders' equity |
|
|
76.4% |
76.5% |
74.4% |
76.2% |
|
|
73.7% |
72.3% |
69.7% |
70.8% |
|
|
69.1% |
62.9% |
| |
|
|
|
|
100.0% |
100.0% |
100.0% |
100.0% |
|
|
100.0% |
100.0% |
100.0% |
100.0% |
|
|
100.0% |
100.0% |
| |
|
|
|
|
|
|
|
|
|
|
|
|
|
|
|
|
|
|
| |
Debt to total capitalization |
|
|
33.0% |
32.2% |
32.0% |
31.7% |
|
|
30.5% |
30.9% |
31.3% |
30.9% |
|
|
37.1% |
38.8% |
| |
|
|
|
|
|
|
|
|
|
|
|
|
|
|
|
|
|
|
| ANNUALIZED RETURNS |
|
|
|
|
|
|
|
|
|
|
|
|
|
|
|
|
| |
Return on equity (Net income attributable
to Magna |
|
|
|
|
|
|
|
|
|
|
|
|
|
|
|
|
| |
|
International Inc. / Average shareholders' equity) |
|
|
20.7% |
13.8% |
0.4% |
15.2% |
|
|
12.0% |
-5.3% |
10.4% |
3.4% |
|
|
7.3% |
11.7% |
| |
Adjusted Return on equity (Adjusted
Net income attributable |
|
|
|
|
|
|
|
|
|
|
|
|
|
|
|
|
| |
|
to Magna International Inc. / Average shareholders' equity) |
|
|
19.0% |
13.9% |
5.5% |
12.8% |
|
|
12.6% |
8.3% |
11.1% |
9.4% |
|
|
11.2% |
14.9% |
| |
Return on Invested Capital (Annualized
after-tax operating |
|
|
|
|
|
|
|
|
|
|
|
|
|
|
|
|
| |
|
profits / invested capital) |
|
|
16.3% |
11.1% |
0.9% |
12.2% |
|
|
9.9% |
-3.2% |
7.9% |
3.2% |
|
|
5.7% |
8.7% |
| |
Adjusted Return on Invested Capital (Adjusted
Annualized after-tax |
|
|
|
|
|
|
|
|
|
|
|
|
|
|
|
|
| |
|
operating profits / invested capital) |
|
|
15.1% |
11.2% |
4.8% |
10.4% |
|
|
10.4% |
6.7% |
8.4% |
7.4% |
|
|
8.4% |
10.7% |
| FINANCIAL REVIEW OF MAGNA INTERNATIONAL INC. |
| CONSOLIDATED STATEMENTS OF CASH
FLOWS |
| (United States dollars in millions) (Unaudited) |
| |
|
|
|
|
|
|
|
|
|
|
|
|
|
|
|
|
|
|
|
|
|
| |
|
|
|
|
|
|
2021 |
|
2022 |
|
2023 |
| Cash provided from (used for): |
Note |
|
1st Q |
2nd Q |
3rd Q |
4th Q |
TOTAL |
|
1st Q |
2nd Q |
3rd Q |
4th Q |
TOTAL |
|
1st Q |
2nd Q |
TOTAL |
| |
|
|
|
|
|
|
|
|
|
|
|
|
|
| Operating activities |
|
|
|
|
|
|
|
|
|
|
|
|
|
|
|
|
|
|
| |
Net income (loss) |
|
|
622 |
436 |
17 |
478 |
1,553 |
|
379 |
(145) |
296 |
127 |
657 |
|
217 |
354 |
571 |
| |
Items not involving current cash flows |
(i) |
|
349 |
341 |
515 |
371 |
1,576 |
|
370 |
705 |
295 |
406 |
1,776 |
|
351 |
525 |
876 |
| |
|
|
|
|
(i) |
|
971 |
777 |
532 |
849 |
3,129 |
|
749 |
560 |
591 |
533 |
2,433 |
|
568 |
879 |
1,447 |
| |
Changes in operating assets and liabilities |
(i) |
|
(310) |
(249) |
(132) |
502 |
(189) |
|
(569) |
(139) |
(353) |
723 |
(338) |
|
(341) |
(332) |
(673) |
| Cash provided from operating activities |
|
|
661 |
528 |
400 |
1,351 |
2,940 |
|
180 |
421 |
238 |
1,256 |
2,095 |
|
227 |
547 |
774 |
| |
|
|
|
|
|
|
|
|
|
|
|
|
|
|
|
|
|
|
|
|
|
| Investment activities |
|
|
|
|
|
|
|
|
|
|
|
|
|
|
|
|
|
|
| |
Fixed asset additions |
|
|
(212) |
(277) |
(334) |
(549) |
(1,372) |
|
(238) |
(329) |
(364) |
(750) |
(1,681) |
|
(424) |
(502) |
(926) |
| |
Increase in equity method investment |
|
|
- |
- |
(454) |
(63) |
(517) |
|
- |
- |
- |
- |
- |
|
- |
- |
- |
| |
Increase in investments, other assets and intangible assets |
|
|
(104) |
(93) |
(101) |
(105) |
(403) |
|
(64) |
(80) |
(125) |
(186) |
(455) |
|
(101) |
(96) |
(197) |
| |
Disposal of facilities |
1 (e) |
|
- |
- |
(41) |
- |
(41) |
|
6 |
- |
- |
- |
6 |
|
(25) |
- |
(25) |
| |
Increase in public and private equity investments |
|
|
(3) |
(17) |
(3) |
(45) |
(68) |
|
(2) |
(2) |
(25) |
- |
(29) |
|
- |
(3) |
(3) |
| |
Settlement of long-term receivable from non-consolidated joint
venture |
|
50 |
- |
- |
- |
50 |
|
- |
- |
- |
- |
- |
|
- |
- |
- |
| |
Proceeds from disposition |
|
|
19 |
20 |
10 |
32 |
81 |
|
23 |
40 |
41 |
20 |
124 |
|
19 |
44 |
63 |
| |
Business combinations |
|
|
39 |
(21) |
- |
(31) |
(13) |
|
- |
- |
- |
(3) |
(3) |
|
- |
(1,475) |
(1,475) |
| Cash used for investment activities |
|
|
(211) |
(388) |
(923) |
(761) |
(2,283) |
|
(275) |
(371) |
(473) |
(919) |
(2,038) |
|
(531) |
(2,032) |
(2,563) |
| |
|
|
|
|
|
|
|
|
|
|
|
|
|
|
|
|
|
|
|
|
|
| Financing activities |
|
|
|
|
|
|
|
|
|
|
|
|
|
|
|
|
|
|
| |
Net issues (repayments) of debt |
|
|
(126) |
(33) |
(13) |
5 |
(167) |
|
(328) |
(31) |
(10) |
(22) |
(391) |
|
1,636 |
544 |
2,180 |
| |
Common Shares issued on exercise of stock options |
|
|
83 |
50 |
3 |
10 |
146 |
|
4 |
- |
1 |
3 |
8 |
|
6 |
- |
6 |
| |
Repurchase of Common Shares |
|
|
(162) |
(99) |
(5) |
(251) |
(517) |
|
(383) |
(212) |
(180) |
(5) |
(780) |
|
(9) |
(2) |
(11) |
| |
Tax withholdings on vesting of equity awards |
|
|
(12) |
- |
- |
(1) |
(13) |
|
(14) |
(1) |
- |
- |
(15) |
|
(9) |
(1) |
(10) |
| |
Contributions to subsidiaries by non-controlling interests |
|
|
- |
- |
- |
8 |
8 |
|
- |
5 |
- |
- |
5 |
|
- |
- |
- |
| |
Dividends paid to non-controlling interests |
|
|
- |
(8) |
(2) |
(39) |
(49) |
|
- |
(12) |
(10) |
(24) |
(46) |
|
(7) |
(24) |
(31) |
| |
Dividends paid |
|
|
|
(130) |
(127) |
(130) |
(127) |
(514) |
|
(133) |
(130) |
(125) |
(126) |
(514) |
|
(132) |
(129) |
(261) |
| Cash provided from (used for) financing activities |
|
|
(347) |
(217) |
(147) |
(395) |
(1,106) |
|
(854) |
(381) |
(324) |
(174) |
(1,733) |
|
1,485 |
388 |
1,873 |
| Effect of exchange rate changes on cash, cash equivalents |
|
|
|
|
|
|
|
|
|
|
|
|
|
|
|
|
|
| |
and restricted cash equivalents |
|
|
(13) |
39 |
(8) |
5 |
23 |
|
(3) |
(1) |
(3) |
(31) |
(38) |
|
14 |
(51) |
(37) |
| Net increase (decrease) in cash, cash equivalents |
|
|
|
|
|
|
|
|
|
|
|
|
|
|
|
|
|
| |
and restricted cash equivalents during the period |
|
|
90 |
(38) |
(678) |
200 |
(426) |
|
(952) |
(332) |
(562) |
132 |
(1,714) |
|
1,195 |
(1,148) |
47 |
| Cash, cash equivalents and restricted cash equivalents, |
|
|
|
|
|
|
|
|
|
|
|
|
|
|
|
|
|
| |
beginning of period |
|
|
3,374 |
3,464 |
3,426 |
2,748 |
3,374 |
|
2,948 |
1,996 |
1,664 |
1,102 |
2,948 |
|
1,234 |
2,429 |
1,234 |
| Cash, cash equivalents and restricted cash equivalents, |
|
|
|
|
|
|
|
|
|
|
|
|
|
|
|
|
|
| |
end of period |
|
|
|
3,464 |
3,426 |
2,748 |
2,948 |
2,948 |
|
1,996 |
1,664 |
1,102 |
1,234 |
1,234 |
|
2,429 |
1,281 |
1,281 |
| |
|
|
|
|
|
|
|
|
|
|
|
|
|
|
|
|
|
|
|
|
|
| |
|
|
|
(i) Certain amounts in prior periods have been reclassified to conform with current period presentation. |
| |
|
|
|
|
|
|
|
|
|
|
|
|
|
|
|
|
|
|
|
|
|
| FINANCIAL REVIEW OF MAGNA INTERNATIONAL INC. |
| (United States dollars in millions, except per share figures) (Unaudited) |
| |
|
|
| |
|
This Analyst should be read in conjunction with the audited consolidated financial
statements for the year ended December 31, 2022. |
| |
|
|
|
|
|
|
|
|
|
|
|
|
|
|
|
|
|
|
|
|
|
| Note 1: |
NON-GAAP MEASURES |
|
|
|
|
|
|
|
|
|
|
|
|
|
|
|
|
|
| |
|
The Company presents Operating income,
EBIT (Earnings before interest and taxes) and EBITDA (Earnings before interest, taxes and depreciation and amortization) before Other
expense (income),net. The Company also presents Adjusted Net Income (Net Income before Other expense (income),net, net
of tax and excluding significant income tax valuation allowance adjustments), Adjusted Diluted Earnings per Share, Adjusted EBIT
and Adjusted EBIT as a percentage of sales, Return on Invested Capital and Return on Equity. During the third quarter of 2023, we
will revise our calculation of Adjusted EBIT to exclude the impact of purchase accounting amortization. The Company calculates Adjusted
Debt as total debt adjusted to include pension and lease liabilities and Adjusted EBITDA as earnings before, interest, net, taxes,
depreciation and amortization adjusted to add back interest income, certain pension costs and operating lease expense. The Company
presents these financial figures because such measures are widely used by analysts and investors in evaluating the operating performance
of the Company. However, such measures do not have any standardized meaning under U.S. generally accepted accounting principles
and may not be comparable to the calculation of similar measures by other companies.
Other expense (income), net consists of: |
| |
|
|
|
|
|
|
|
|
|
|
|
|
|
|
|
|
|
|
|
|
|
| |
|
|
|
|
|
|
2021 |
|
2022 |
|
2023 |
| |
|
|
|
|
|
|
1st Q |
2nd Q |
3rd Q |
4th Q |
TOTAL |
|
1st Q |
2nd Q |
3rd Q |
4th Q |
TOTAL |
|
1st Q |
2nd Q |
TOTAL |
| |
|
|
|
|
|
|
|
|
|
|
|
|
|
|
|
|
|
|
|
|
|
| |
|
Restructuring |
[a] |
|
15 |
44 |
12 |
18 |
89 |
|
- |
- |
- |
22 |
22 |
|
118 |
(35) |
83 |
| |
|
Impairments |
|
[b] |
|
- |
- |
12 |
- |
12 |
|
- |
376 |
14 |
12 |
402 |
|
- |
- |
- |
| |
|
Investment revalutations, (gains) losses on sales, and impairments |
[c] |
|
(33) |
(38) |
81 |
(8) |
2 |
|
61 |
50 |
9 |
101 |
221 |
|
24 |
98 |
122 |
| |
|
Veoneer related termination fees and transaction costs |
[d] |
|
- |
- |
- |
(100) |
(100) |
|
- |
- |
- |
- |
- |
|
- |
23 |
23 |
| |
|
Loss on sale of business |
[e] |
|
- |
- |
75 |
- |
75 |
|
- |
- |
- |
58 |
58 |
|
- |
- |
- |
| |
|
Gain on business combinations |
[f] |
|
(40) |
- |
- |
- |
(40) |
|
- |
- |
- |
- |
- |
|
- |
- |
- |
| |
|
|
|
|
|
|
|
|
|
|
|
|
|
|
|
|
|
|
|
- |
|
| |
|
|
|
|
|
|
(58) |
6 |
180 |
(90) |
38 |
|
61 |
426 |
23 |
193 |
703 |
|
142 |
86 |
228 |
| |
[a] |
Restructuring |
|
|
|
|
|
|
|
|
| |
|
Reversal
of restructuring charges: |
|
|
|
|
|
|
|
| |
|
During the second quarter of 2023, the
Company’s Power & Vision segment reversed $39 million of charges due to a change in the restructuring plans related to
a plant closure. |
| |
|
|
| |
|
Other Restructuring: |
|
|
2021 |
|
2022 |
|
2023 |
| |
|
|
|
|
|
|
1st Q |
2nd Q |
3rd Q |
4th Q |
TOTAL |
|
1st Q |
2nd Q |
3rd Q |
4th Q |
TOTAL |
|
1st Q |
2nd Q |
TOTAL |
| |
|
Power & Vision |
|
|
15 |
44 |
4 |
4 |
67 |
|
- |
- |
- |
22 |
22 |
|
105 |
(5) |
100 |
| |
|
Body Exteriors & Structures |
|
|
- |
- |
8 |
- |
8 |
|
- |
- |
- |
- |
- |
|
13 |
9 |
22 |
| |
|
Seating Systems |
|
|
- |
- |
- |
14 |
14 |
|
- |
- |
- |
- |
- |
|
- |
- |
- |
| |
|
|
|
|
|
|
15 |
44 |
12 |
18 |
89 |
|
- |
- |
- |
22 |
22 |
|
118 |
4 |
122 |
| |
[b] |
Impairments |
|
|
|
|
|
|
|
|
|
|
| |
|
Impairments
related to operations in Russia: |
|
|
|
|
|
|
|
| |
|
As a result of the expected lack of future
cashflows and the continuing uncertainties connected with the Russian economy, during the second quarter of 2022, the Company recorded
a $376 million impairment charge related to its investment in Russia. This included net asset impairments of $173 million and a $203
million reserve against the related foreign currency translation losses that were included in accumulated other comprehensive loss.
The net asset impairments consisted of $163 million and $10 million in our Body Exteriors & Structures and our Seating Systems
segments, respectively. |
| |
|
|
| |
|
Other Impairments: |
|
|
2021 |
|
2022 |
|
2023 |
| |
|
|
|
|
|
|
1st Q |
2nd Q |
3rd Q |
4th Q |
TOTAL |
|
1st Q |
2nd Q |
3rd Q |
4th Q |
TOTAL |
|
1st Q |
2nd Q |
TOTAL |
| |
|
Body Exteriors & Structures |
|
|
- |
- |
8 |
- |
8 |
|
- |
- |
10 |
12 |
22 |
|
- |
- |
- |
| |
|
Power & Vision |
|
|
- |
- |
- |
- |
- |
|
- |
- |
4 |
- |
4 |
|
- |
- |
- |
| |
|
Seating Systems |
|
|
- |
- |
4 |
- |
4 |
|
- |
- |
- |
- |
- |
|
- |
- |
- |
| |
|
|
|
|
|
|
- |
- |
12 |
- |
12 |
|
- |
- |
14 |
12 |
26 |
|
- |
- |
- |
| |
[c] |
Investment revalutations, (gains) losses on sales, and impairments |
|
|
|
|
| |
|
The Company revalues its public and private
equity investments and certain public company warrants every quarter. The gains and losses related to this revaluation, as well as
gain and losses on disposition, are recorded in Corporate. In the second quarter of 2023, the Company recorded a non-cash impairment
charge of $85 million on a private equity investment and related long-term receivables within Other assets in its Corporate segment. |
| |
|
|
| |
[d] |
Veoneer related termination fees and transaction costs |
|
|
|
|
| |
|
During 2023, the Company incurred $23
million of transaction costs related to the acquisition of the Veoneer Active Safety Business.
In the fourth quarter of 2021, Veoneer, Inc. (“Veoneer”) terminated its merger agreement with Magna. In connection
with the termination of the merger agreement, Veoneer paid the Company a termination fee which, net of the Company’s associated
transaction costs, amounted to $100 million. |
| |
|
|
| |
[e] |
Loss on sale of business |
|
|
|
|
| |
|
During the fourth quarter of 2022,
the Company entered into an agreement to sell a European Power & Vision operation. Under the terms of the arrangement, the Company
is contractually obligated to provide the buyer with up to $42 million of funding, resulting in a loss of $58 million. During the
first quarter of 2023, the Company completed the sale of this operation which resulted in a net cash outflow of $25 million.
During the third quarter of 2021, the Company sold three Body Exteriors & Structures operations in Germany. Under the terms of
the arrangement, the Company provided the buyer with $41 million of funding, resulting in a loss on disposal of $75 million. |
| |
|
|
| |
[f] |
Gain on business combinations |
|
|
|
|
| |
|
In Seating Systems, during the first
quarter of 2021, the Company recognized a $22 million gain on the on the change in basis of accounting for its previously held equity
method investments. Also during the first quarter of 2021, in Power & Vision, substantially all of the assets of the Company's
European joint venture with Ford Motor Company, Getrag Ford Transmission GmbH, were distributed to either Ford or the Company, which
resulted in the Company recording a gain of $18 million. |
| |
|
The following table reconciles Net income (loss) attributable
to Magna International Inc. to Adjusted net income attributable to Magna International Inc.: |
| |
|
|
|
|
|
|
2021 |
|
2022 |
|
2023 |
| |
|
|
|
|
|
|
1st Q |
2nd Q |
3rd Q |
4th Q |
TOTAL |
|
1st Q |
2nd Q |
3rd Q |
4th Q |
TOTAL |
|
1st Q |
2nd Q |
TOTAL |
| |
|
|
|
|
|
|
|
|
|
|
|
|
|
| |
|
|
|
|
|
|
|
|
|
|
|
|
|
|
|
|
|
|
|
|
|
| |
|
Net income (loss) attributable to Magna International Inc. |
|
|
615 |
424 |
11 |
464 |
1,514 |
|
364 |
(156) |
289 |
95 |
592 |
|
209 |
339 |
548 |
| |
|
|
Exclude: |
|
|
|
|
|
|
|
|
|
|
|
|
|
|
|
|
|
| |
|
|
|
Investment revalutations, (gains) losses on sales, and impairments |
(24) |
(29) |
64 |
(2) |
9 |
|
48 |
38 |
7 |
75 |
168 |
|
18 |
95 |
113 |
| |
|
|
|
Impairments |
|
|
- |
- |
9 |
- |
9 |
|
- |
361 |
12 |
12 |
385 |
|
- |
- |
- |
| |
|
|
|
Restructuring |
|
|
15 |
31 |
11 |
17 |
74 |
|
- |
- |
- |
22 |
22 |
|
92 |
(26) |
66 |
| |
|
|
|
Veoneer related termination fees and transaction costs |
|
|
- |
- |
- |
(75) |
(75) |
|
- |
- |
- |
- |
- |
|
- |
22 |
22 |
| |
|
|
|
Net losses on the sale of business |
|
|
- |
- |
75 |
- |
75 |
|
- |
- |
- |
57 |
57 |
|
- |
- |
- |
| |
|
|
|
Adjustments to Deferred Tax Valuation Allowance |
[i] |
|
- |
- |
- |
(13) |
(13) |
|
(29) |
- |
- |
- |
(29) |
|
- |
- |
- |
| |
|
|
|
Gain on business combinations |
|
|
(40) |
- |
- |
- |
(40) |
|
- |
- |
- |
- |
- |
|
- |
- |
- |
| |
|
|
|
|
|
|
|
|
|
|
|
|
|
|
|
|
|
|
- |
|
- |
| |
|
Adjusted net income attributable to Magna International Inc. |
|
|
566 |
426 |
170 |
391 |
1,553 |
|
383 |
243 |
308 |
261 |
1,195 |
|
319 |
430 |
749 |
| |
|
|
|
|
|
|
|
|
|
|
|
|
|
|
|
|
|
|
|
|
|
| |
|
|
|
|
|
|
|
|
|
|
|
|
|
|
|
|
|
|
|
|
|
| |
|
Diluted earnings (loss) per share |
|
|
$ 2.03 |
$ 1.40 |
$ 0.04 |
$ 1.54 |
$ 5.00 |
|
$ 1.22 |
$ (0.54) |
$ 1.00 |
$ 0.33 |
$ 2.03 |
|
$ 0.73 |
1.18 |
$ 1.91 |
| |
|
|
Exclude: |
|
|
|
|
|
|
|
|
|
|
|
|
|
|
|
|
|
| |
|
|
|
Investment revalutations, (gains) losses on sales, and impairments |
(0.08) |
(0.10) |
0.21 |
(0.01) |
0.03 |
|
0.16 |
0.13 |
0.03 |
0.26 |
1.32 |
|
0.07 |
0.33 |
0.39 |
| |
|
|
|
Impairments |
|
|
- |
- |
0.03 |
- |
0.03 |
|
- |
1.24 |
0.04 |
0.04 |
1.32 |
|
- |
- |
- |
| |
|
|
|
Restructuring and impairments |
|
|
0.05 |
0.10 |
0.03 |
0.06 |
0.24 |
|
- |
- |
- |
0.08 |
0.08 |
|
0.31 |
(0.09) |
0.23 |
| |
|
|
|
Veoneer related termination fees and transaction costs |
|
|
- |
- |
- |
(0.25) |
(0.25) |
|
- |
- |
- |
- |
(0.01) |
|
- |
0.08 |
0.08 |
| |
|
|
|
Net losses on the sale of business |
|
|
- |
- |
0.25 |
- |
0.25 |
|
- |
- |
- |
0.20 |
0.19 |
|
- |
- |
- |
| |
|
|
|
Adjustments to Deferred Tax Valuation Allowance |
[i] |
|
- |
- |
- |
(0.04) |
(0.04) |
|
(0.10) |
- |
- |
- |
(0.10) |
|
- |
- |
- |
| |
|
|
|
Gain on business combinations |
|
|
(0.14) |
- |
- |
- |
(0.13) |
|
- |
- |
- |
- |
- |
|
- |
- |
- |
| |
|
|
|
|
|
|
|
|
|
|
|
|
|
|
|
|
|
|
|
|
|
| |
|
Adjusted diluted earnings per share |
|
|
$ 1.86 |
$ 1.40 |
$ 0.56 |
$ 1.30 |
$ 5.13 |
|
$ 1.28 |
$ 0.83 |
$ 1.07 |
$ 0.91 |
$ 4.83 |
|
$ 1.11 |
$ 1.50 |
$ 2.61 |
| |
|
|
| |
|
[i] Adjustments
to Deferred Tax Valuation Allowance |
| |
|
|
In the fourth quarter of 2021 and first
quarter of 2022, the Company recorded adjustments to the valuation allowance against its deferred tax assets in certain European
countries and North America. The net effect of these adjustments was a reduction in income tax expense of $13 million and $29 million,
respectively. |
| Note 2: |
SEGMENTED INFORMATION |
|
|
|
|
|
|
|
|
|
|
|
|
|
|
|
|
|
| |
|
|
| |
|
|
|
|
|
|
2021 |
|
2022 |
|
2023 |
| |
|
|
|
|
|
|
1st Q |
2nd Q |
3rd Q |
4th Q |
TOTAL |
|
1st Q |
2nd Q |
3rd Q |
4th Q |
TOTAL |
|
1st Q |
2nd Q |
TOTAL |
| |
|
Body Exteriors & Structures |
|
|
|
|
|
|
|
|
|
| |
|
|
Sales |
|
|
4,025 |
3,647 |
3,185 |
3,620 |
14,477 |
|
4,077 |
3,947 |
3,976 |
4,004 |
16,004 |
|
4,439 |
4,540 |
8,979 |
| |
|
|
Adjusted EBIT |
|
|
327 |
227 |
98 |
168 |
820 |
|
229 |
191 |
225 |
198 |
843 |
|
270 |
392 |
662 |
| |
|
|
Adjusted EBIT as a percentage of sales |
|
|
8.1% |
6.2% |
3.1% |
4.6% |
5.7% |
|
5.6% |
4.8% |
5.7% |
4.9% |
5.3% |
|
6.1% |
8.6% |
7.4% |
| |
|
|
|
|
|
|
|
|
|
|
|
|
|
|
|
|
|
|
|
|
|
| |
|
Power & Vision |
|
|
|
|
|
|
|
|
|
|
|
|
|
|
|
|
|
| |
|
|
Sales |
|
|
3,156 |
2,881 |
2,501 |
2,804 |
11,342 |
|
3,046 |
2,888 |
2,911 |
3,016 |
11,861 |
|
3,323 |
3,462 |
6,785 |
| |
|
|
Adjusted EBIT |
|
|
297 |
203 |
67 |
171 |
738 |
|
154 |
91 |
117 |
109 |
471 |
|
84 |
116 |
200 |
| |
|
|
Adjusted EBIT as a percentage of sales |
|
|
9.4% |
7.0% |
2.7% |
6.1% |
6.5% |
|
5.1% |
3.2% |
4.0% |
3.6% |
4.0% |
|
2.5% |
3.4% |
2.9% |
| |
|
|
|
|
|
|
|
|
|
|
|
|
|
|
|
|
|
|
|
|
|
| |
|
Seating Systems |
|
|
|
|
|
|
|
|
|
|
|
|
|
|
|
|
|
| |
|
|
Sales |
|
|
1,303 |
1,166 |
1,123 |
1,299 |
4,891 |
|
1,376 |
1,253 |
1,295 |
1,345 |
5,269 |
|
1,486 |
1,603 |
3,089 |
| |
|
|
Adjusted EBIT |
|
|
55 |
26 |
22 |
49 |
152 |
|
49 |
2 |
35 |
13 |
99 |
|
36 |
66 |
102 |
| |
|
|
Adjusted EBIT as a percentage of sales |
|
|
4.2% |
2.2% |
2.0% |
3.8% |
3.1% |
|
3.6% |
0.2% |
2.7% |
1.0% |
1.9% |
|
2.4% |
4.1% |
3.3% |
| |
|
|
|
|
|
|
|
|
|
|
|
|
|
|
|
|
|
|
|
|
|
| |
|
Complete Vehicles |
|
|
|
|
|
|
|
|
|
|
|
|
|
|
|
|
|
| |
|
|
Sales |
|
|
1,850 |
1,490 |
1,255 |
1,511 |
6,106 |
|
1,275 |
1,403 |
1,213 |
1,330 |
5,221 |
|
1,626 |
1,526 |
3,152 |
| |
|
|
Adjusted EBIT |
|
|
80 |
79 |
30 |
98 |
287 |
|
50 |
63 |
65 |
57 |
235 |
|
52 |
34 |
86 |
| |
|
|
Adjusted EBIT as a percentage of sales |
|
|
4.3% |
5.3% |
2.4% |
6.5% |
4.7% |
|
3.9% |
4.5% |
5.4% |
4.3% |
4.5% |
|
3.2% |
2.2% |
2.7% |
| |
|
|
|
|
|
|
|
|
|
|
|
|
|
|
|
|
|
|
|
|
|
| |
|
Corporate and other |
|
|
|
|
|
|
|
|
|
|
|
|
|
|
|
|
|
| |
|
|
Intercompany eliminations |
|
|
(155) |
(150) |
(145) |
(124) |
(574) |
|
(132) |
(129) |
(127) |
(127) |
(515) |
|
(201) |
(149) |
(350) |
| |
|
|
Adjusted EBIT |
|
|
11 |
22 |
12 |
22 |
67 |
|
25 |
11 |
(1) |
(21) |
14 |
|
(5) |
(5) |
(10) |
| |
|
|
|
|
|
|
|
|
|
|
|
|
|
|
|
|
|
|
|
|
|
| |
|
Total |
|
|
|
|
|
|
|
|
|
|
|
|
|
|
|
|
|
|
|
| |
|
|
Sales |
|
|
10,179 |
9,034 |
7,919 |
9,110 |
36,242 |
|
9,642 |
9,362 |
9,268 |
9,568 |
37,840 |
|
10,673 |
10,982 |
21,655 |
| |
|
|
Adjusted EBIT |
|
|
770 |
557 |
229 |
508 |
2,064 |
|
507 |
358 |
441 |
356 |
1,662 |
|
437 |
603 |
1,040 |
| |
|
|
Adjusted EBIT as a percentage of sales |
|
|
7.6% |
6.2% |
2.9% |
5.6% |
5.7% |
|
5.3% |
3.8% |
4.8% |
3.7% |
4.4% |
|
4.1% |
5.5% |
4.8% |
Page 6 of 6
Exhibit 99.2

Q2 - 2023 Results August 4, 2023

Louis Tonelli Vice President, Investor Relations Q2 - 2023 RESULTS 2

Forward Looking Statements Q2 - 2023 RESULTS 3 Certain statements in this document and related quarterly results conference call constitute "forward - looking information" or "forward - looking statements" (collectively, "forward - looking statements") . Any such forward - looking statements are intended to provide information about management's current expectations and plans and may not be appropriate for other purposes . Forward - looking statements may include financial and other projections, as well as statements regarding our future plans, strategic objectives or economic performance, or the assumptions underlying any of the foregoing, and other statements that are not recitations of historical fact . We use words such as "may", "would", "could", "should", "will", "likely", "expect", "anticipate", "believe", "intend", "plan", "aim", "forecast", "outlook", "project", "estimate", "target" and similar expressions suggesting future outcomes or events to identify forward - looking statements . The following table identifies the material forward - looking statements contained in this document and related quarterly results conference call, together with the material potential risks that we currently believe could cause actual results to differ materially from such forward - looking statements . Readers and listeners should also consider all of the risk factors which follow below the table : Material Potential Risks Related to Applicable Forward - Looking Statement Material Forward - Looking Statement Light vehicle sales levels Production disruptions, including as a result of labour disruptions Supply disruptions Production allocation decisions by OEMs Light Vehicle Production Same risks as for Light Vehicle Production above The impact of elevated interest rates and availability of credit on consumer confidence and in turn vehicle sales and production Potential supply disruptions The impact of the Russian invasion of Ukraine on global economic growth and industry production volumes The impact of rising interest rates and availability of credit on consumer confidence and, in turn, vehicle sales and production The impact of deteriorating vehicle affordability on consumer demand, and in turn vehicle sales and production Concentration of sales with six customers Shifts in market shares among vehicles or vehicle segments Shifts in consumer “take rates” for products we sell Total Sales Segment Sales Same risks as for Total Sales/Segment Sales above Successful execution of critical program launches, including complete vehicle manufacturing of the Fisker Ocean SUV Operational underperformance Production inefficiencies in our operations due to volatile vehicle production allocation decisions by OEMs Higher costs incurred to mitigate the risk of supply disruptions Inflationary pressures Our ability to secure cost recoveries from customers and/or otherwise offset higher input costs Price concessions Commodity cost volatility Scrap steel price volatility Higher labour costs Tax risks Adjusted EBIT Margin Potential Margin Expansion Net Income Attributable to Magna Target Leverage Ratio Same risks as Adjusted EBIT Margin/Potential Margin Expansion/Net Income Attributable to Magna/Target Leverage Ratio above Risks related to conducting business through joint ventures Equity Income Same risks as for Total Sales/Segment Sales and Adjusted EBIT Margin/Potential Margin Expansion/Net Income Attributable to Magna/Target Leverage Ratio above Free Cash Flow The impact of elevated interest rates and availability of credit on consumer confidence and in turn vehicle sales and production Potential supply disruptions The impact of the Russian invasion of Ukraine on global economic growth and industry production volumes The impact of rising interest rates and availability of credit on consumer confidence and, in turn, vehicle sales and production The impact of deteriorating vehicle affordability on consumer demand, and in turn vehicle sales and production Concentration of sales with six customers Shifts in market shares among vehicles or vehicle segments Shifts in consumer “take rates” for products we sell Total Sales Segment Sales

Forward Looking Statements (cont.) Q2 - 2023 RESULTS 4 Forward - looking statements are based on information currently available to us and are based on assumptions and analyses made by us in light of our experience and our perception of historical trends, current conditions and expected future developments, as well as other factors we believe are appropriate in the circumstances . While we believe we have a reasonable basis for making any such forward - looking statements, they are not a guarantee of future performance or outcomes . In addition to the factors in the table above, whether actual results and developments conform to our expectations and predictions is subject to a number of risks, assumptions and uncertainties, many of which are beyond our control, and the effects of which can be difficult to predict, including, without limitation : Climate Change Risks transition risks and physical risks; strategic and other risks related to the transition to electromobility; Acquisition Risks competition for strategic acquisition targets; inherent merger and acquisition risks; acquisition integration risk; Other Business Risks risks related to conducting business through joint ventures; intellectual property risks; risks of conducting business in foreign markets; fluctuations in relative currency values; an increase in pension funding obligations; tax risks; reduced financial flexibility as a result of an economic shock; inability to achieve future investment returns that equal or exceed past returns; changes in credit ratings assigned to us; the unpredictability of, and fluctuation in, the trading price of our Common Shares; a reduction of suspension of our dividend; Legal, Regulatory and Other Risks antitrust risk; legal claims and/or regulatory actions against us; changes in laws and regulations, including those related to vehicle emissions, taxation, or made as a result of the COVID - 19 pandemic. potential restrictions on free trade; trade disputes/tariffs; and environmental compliance costs. Supply Chain Risks semiconductor chip supply disruptions and price increases, and the impact on customer production volumes and on the efficiency of our operations; supply disruptions and applicable costs related to supply disruption mitigation initiatives; regional energy shortages/disruptions and pricing; a deterioration of the financial condition of our supply base; Manufacturing/Operational Risks product and new facility launch risks; operational underperformance; restructuring costs; impairment charges; labour disruptions; skilled labour attraction/retention; leadership expertise and succession; IT Security/Cybersecurity Risk IT/Cybersecurity breach; product Cybersecurity breach; Pricing Risks pricing risks between time of quote and start of production; price concessions; commodity price volatility; declines in scrap steel/aluminum prices; Warranty / Recall Risks costs related to repair or replacement of defective products, including due to a recall; warranty or recall costs that exceed warranty provision or insurance coverage limits; product liability claims; Macroeconomic, Geopolitical and Other Risks impact of the Russian invasion of Ukraine; inflationary pressures; interest rate levels; risks related to COVID - 19; Risks Related to the Automotive Industry economic cyclicality; regional production volume declines; deteriorating vehicle affordability; potential consumer hesitancy with respect to Electric Vehicles (“EVs”); intense competition; Strategic Risks alignment of our product mix with the “Car of the Future”; our ability to consistently develop and commercialize innovative products or processes; our investments in mobility and technology companies; our changing business risk profile as a result of increased investment in electrification and autonomous/assisted driving, including: higher R&D and engineering costs, and challenges in quoting for profitable returns on products for which we may not have significant quoting experience; Customer - Related Risks concentration of sales with six customers; inability to significantly grow our business with Asian customers; emergence of potentially disruptive EV OEMs, including risks related to limited revenues/operating history of new OEM entrants; Evolving counterparty risk profile; dependence on outsourcing; OEM consolidation and cooperation; shifts in market shares among vehicles or vehicle segments; shifts in consumer "take rates" for products we sell; quarterly sales fluctuations; potential loss of any material purchase orders; potential OEM production - related disruptions; In evaluating forward - looking statements or forward - looking information, we caution readers and listeners not to place undue rel iance on any forward - looking statement. Additionally, readers and listeners should specifically consider the various factors which could cause actual events or results to differ materially from those indicated by such forward - looking statements, includi ng the risks, assumptions and uncertainties above which are: discussed under the “Industry Trends and Risks” heading of our Management’s Discussion and Analysis; and set out in our revised Annual Information Form filed with securities commissions in Canada, our annual report on Form 40 - F / 40 - F/A filed with the United States Securities and Exchange commission, and subsequent filings. Readers and listeners should also consider discussion of our risk mitigation activities with respect to certain risk factors, wh ich can be also found in our Annual Information Form.

Q2 - 2023 RESULTS 5 Reminders All amounts are in U.S. Dollars Today's discussion excludes the impact of other expense (income), net ("Unusual Items") "Organic", in the context of sales movements, means "excluding the impact of foreign exchange, acquisitions and divestitures"

Swamy Kotagiri Chief Executive Officer Q2 - 2023 RESULTS 6

Key Takeaways Q2 - 2023 RESULTS 7 Successfully completed acquisition of Veoneer Active Safety – Positions Magna as a global leader in Active Safety Q2 organic sales outperformed weighted industry production by 3% – 5% outgrowth excluding Complete Vehicles Strong Q2 operating performance – YoY: Adjusted EBIT margin up 170 bps, Adjusted EPS up 81% Raised 2023 outlook for sales, Adjusted EBIT margin, Adjusted net income Continued Progress in Go Forward Strategy

Operating Environment Q2 - 2023 RESULTS 8 • Experiencing incremental improvements – Reduced supply constraints, higher and less volatile OEM vehicle production – Resilient auto sales • Interlocking challenges impacting entire industry – Continuing elevated inflation, higher interest rates, macroeconomic uncertainty • Upcoming North American OEM - labour negotiations in 2H • Focus on containing costs and expanding margins – Driving operational improvements – Obtaining customer recoveries – Flawless launches

Operational Excellence Focus 9 Driving Margin Expansion Consolidation and restructuring of management, SG&A and engineering functions Short and Mid - Term Acceleration of manufacturing plant restructuring and consolidation Repricing on underperforming programs Long - Term Accretive automation and productivity improvements, prioritize most impactful plants Reduce direct cost through component price reductions, freight optimization, tier 2 inflation management Accelerate smart manufacturing activities to drive performance Q2 - 2023 RESULTS European BES facility on track with '23/'24 improvement expectations

Completed Acquisition of Veoneer Active Safety Q2 - 2023 RESULTS 10 • Transaction closed on June 1 st • Broadens and complements our Active Safety portfolio • Business on - track with our expectations • Executing smooth integration and delivering synergies underway

Q2 - 2023 RESULTS 11 • Awarded battery enclosure on Ford’s second - gen electric pick - up truck • Adding new capacity in Tennessee • Further strengthening our position in battery enclosures Executing In Megatrend Product Areas • Announced long - term supply agreement • Magna to integrate SiC technology into future eDrive systems • Enables Magna’s delivery of better cooling performance, faster acceleration and charging rates • Industry - first award with Modular Decoupling Unit for BEVs • First - to - market bolt - on stand - alone solution • Launching on multiple vehicles with German - based premium OEM • Contributes to increasing electric driving range by up to 9%

Q2 - 2023 RESULTS 12 • Awarded truck frame and seats on Ford’s second - gen electric pick - up truck • Preceded by awards for outside mirrors and exteriors on same platform • Represents second seating program award for pick - up trucks in North America Winning Business Across Portfolio • Awarded new fascia business from Europe - based global OEM • Magna to supply OEM’s North American assembly plant from existing Exteriors facility • The first of multiple programs is expected to launch in 2026 • Awarded replacement vehicle assembly business on Mercedes - Benz G - Class • Continues a 40+ year history as exclusive producer • New program to launch in 2024

Pat McCann Executive Vice President & Chief Financial Officer Q2 - 2023 RESULTS 13

Q2 2023 Performance Highlights Q2 - 2023 RESULTS 14 Consolidated Sales $11.0B Weighted GoM 1 of 3% (5% excl. Complete Vehicles) +17% Adjusted Diluted EPS $1.50 +81% Free Cash Flow 2 - $7M 1 Weighted Growth over Market (GoM) compares organic sales growth (%) to vehicle production change (%) after applying Magna geo gra phic sales weighting, excluding Complete Vehicles, to regional production 2 Free Cash Flow is Cash from Operating Activities plus proceeds from normal course dispositions of fixed and other assets minu s c apital spending minus investment in other assets Other highlights Paid out $129M in dividends GoM 1 in BE&S, P&V and Seating Raised 2023 Outlook Adjusted EBIT 5.5% +170 bps +140 bps vs Q1, 2023 $603M +68%

Q2 2023 Financial Results Q2 - 2023 RESULTS 15 Weighted GoM 1 3% (5% excl. Complete Vehicles) Consolidated Sales ($Millions) +17% 2 Q2 2023 PRODUCTION +15% Global +14% North America +13% Europe +21% China +14% Magna Weighted 1 Weighted Growth over Market (GoM) compares organic sales growth (%) to vehicle production change (%) after applying Magna geo gra phic sales weighting, excluding Complete Vehicles, to regional production 2 Includes customer price increases to recover certain higher production input costs and contractual customer price givebacks

Q2 2023 Financial Results Q2 - 2023 RESULTS 16 • Volumes, Performance & Other – Strong earnings on higher sales – Losses in our Russian facilities in Q2 2022 (+) – Acquisitions, net of divestitures ( - ) • Operational – Productivity and efficiency improvements – Higher tooling contribution – Higher program - related engineering – Higher launch costs • Higher equity income – Largely earnings on higher unconsolidated sales • Higher net input costs (inflation) – Lower scrap steel/aluminum sales – Higher labour costs – Lower costs for energy, commodities and freight • Non - recurring – Lower amortization on pubco securities ( - ) – Higher net favourable commercial items $603 $358 Adjusted EBIT & Margin ($Millions)
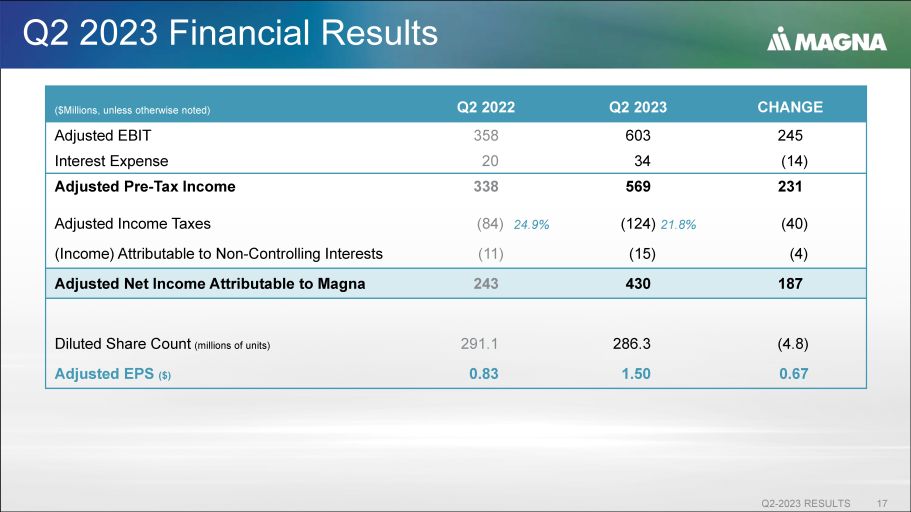
Q2 2023 Financial Results Q2 - 2023 RESULTS 17 CHANGE Q2 2023 Q2 2022 ($Millions, unless otherwise noted) 245 603 358 Adjusted EBIT (14) 34 20 Interest Expense 231 569 338 Adjusted Pre - Tax Income (40) (124) (84) Adjusted Income Taxes (4) (15) (11) (Income) Attributable to Non - Controlling Interests 187 430 243 Adjusted Net Income Attributable to Magna (4.8) 286.3 291.1 Diluted Share Count (millions of units) 0.67 1.50 0.83 Adjusted EPS ($) 24.9% 21.8%

Q2 2023 Cash Flow and Investment Activities Q2 - 2023 RESULTS 18 Free Cash Flow 1 ($Millions) OTHER SOURCES (USES) OF CASH 544 (31) Net Issues (Repayment) of Debt (1,475) - Purchase of Subsidiaries (3) (2) Public and Private Equity Investments (2) (212) Repurchase of Common Shares (129) (130) Dividends Q2 2023 Q2 2022 ($Millions, unless otherwise noted) 879 560 Cash from Operations Before Changes in Operating Assets & Liabilities (332) (139) Changes in Operating Assets & Liabilities 547 421 Cash from Operations (502) (329) Fixed Asset Additions (96) (80) Increase in Investments, Other Assets and Intangible Assets 44 40 Proceeds from Dispositions (554) (369) Investment Activities (7) 52 FREE CASH FLOW 1 52 (7) 0.0 0.0 0.0 0.0 0.1 0.1 0.1 0.1 0.1 0.1 0.1 -20 0 20 40 60 80 100 Q2'22 Q2'23 1 Free Cash Flow (FCF) is Cash from Operating Activities plus proceeds from normal course dispositions of fixed and other asset s m inus capital spending minus investment in other assets

Continued Financial Strength Q2 - 2023 RESULTS 19 LEVERAGE RATIO (LTM, 30JUN23) ($M illions) 7,531 Adjusted Debt 3,441 Adjusted EBITDA 2.19 Adjusted Debt / Adjusted EBITDA TOTAL LIQUIDITY (30JUN23) ($M illions) 1,281 Cash 3,350 Available Term & Operating Lines of Credit 4,631 Total Liquidity Investment - grade ratings from Moody’s, S&P, DBRS 1 Excluding ~$400 million in excess cash held to pay down Euro notes coming due 2.08 Adjusted Debt / Adjusted EBITDA (excl. excess cash) 1 • Leverage ratio tracking better than previous expectations • Ratio expected to decline by end of 2023, further decline through 2024

Updated 2023 Outlook – Key Assumptions Q2 - 2023 RESULTS 20 AUGUST 2023 MAY 2023 2022 Light Vehicle Production (millions of units) 15.2 15.0 14.3 • North America 17.0 16.3 15.8 • Europe 26.2 26.2 26.4 • China Foreign Exchange Rates 0.746 0.748 0.769 • 1 CDN dollar equals USD 1.096 1.086 1.053 • 1 EURO equals USD 0.142 0.145 0.149 • 1 RMB equals USD Changed from previous Outlook

Updated 2023 Outlook Q2 - 2023 RESULTS 21 Raised Outlook AUG. 2023 VEONEER ACTIVE SAFETY ALL OTHER MAY 2023 2022 ($Billions, unless otherwise noted) 41.9 – 43.5 1.0 0.7 40.2 – 41.8 37.8 Total Sales 4.8% – 5.2% (0.2%) 0.3% 4.7% - 5.1% 4.4% Adjusted EBIT Margin % 1,2 110M – 140M 15M 95M – 125M 89M Equity Income ~150M ~150M 81M Interest Expense ~21% ~21% 21.3% Income Tax Rate 3 1.4 - 1.6 0.1 1.3 – 1.5 1.2 Adj. Net Income Attributable to Magna 4 ~2.5 0.1 ~2.4 1.7 Capital Spending 0.1 – 0.3 0.1 – 0.3 0.083 Free Cash Flow 5 1 Adjusted EBIT Margin is the ratio of Adjusted EBIT to Total Sales 2 Magna's Adjusted EBIT to exclude the amortization of acquired intangibles, beginning in Q3, 2023 3 Income Tax Rate has been calculated using Adjusted EBIT and is based on current tax legislation 4 Net Income Attributable to Magna represents Net Income excluding Other expense (income), net 5 Free Cash Flow (FCF) is Cash from Operating Activities plus proceeds from normal course dispositions of fixed and other asset s m inus capital spending minus investment in other assets Changed from previous Outlook

In Summary Q2 - 2023 RESULTS 22 Strong Q2 operating performance Continued progress on Go Forward Strategy through recent activities Raised outlook for 2023 Further sales growth over market

Appendix – Q2 2023 Results Q2 - 2023 RESULTS 23

Q2 2023 Reconciliation of Reported Results Q2 - 2023 RESULTS 24 Excl. Other Expense, Net Other Expense, Net Reported Excluding Other Expense (Income), Net $Millions, except for share figures $ 569 $ 86 $ 483 Income Before Income Taxes 5.2% 4.4% % of Sales $ 124 $ (5) $ 129 Income Tax Expense 21.8% 26.7% % of Pretax $ (15) $ - $ (15) Income Attributable to Non - Controlling Interests $ 248 $ (91) $ 339 Net Income Attributable to Magna $ 1.50 $ 0.32 $ 1.18 Earnings Per Share

Q2 2022 Reconciliation of Reported Results Q2 - 2023 RESULTS 25 Excl. Other Expense, Net Other Expense, Net Reported Excluding Other Expense (Income), Net $Millions, except for share figures $ 338 $ 426 $ (88) Income (Loss) Before Income Taxes 3.6% (0.9%) % of Sales $ 84 $ 27 $ 57 Income Tax Expense 24.9% (64.8%) % of Pretax $ (11) $ - $ (11) Income Attributable to Non - Controlling Interests $ 243 $ 399 $ (156) Net Income (Loss) Attributable to Magna $ 0.83 $ 1.37 $ (0.54) Earnings (Loss) Per Share
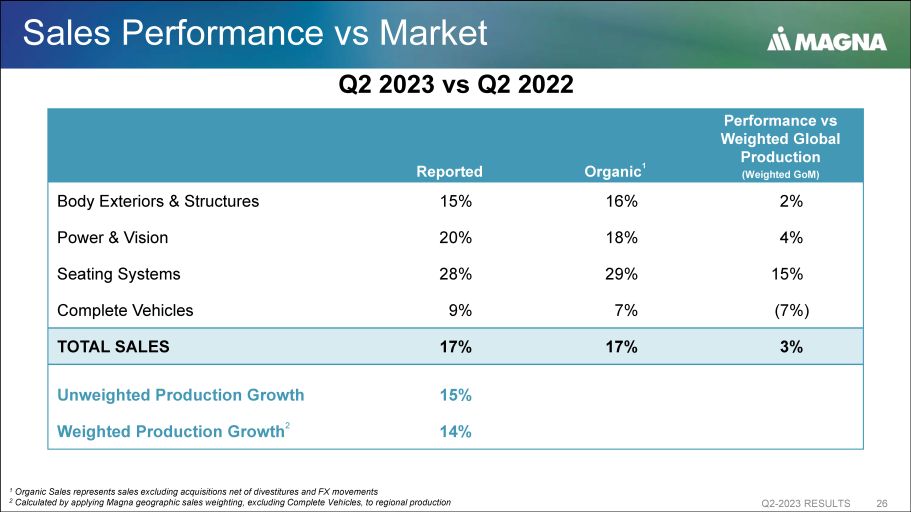
Sales Performance vs Market Q2 - 2023 RESULTS 26 Performance vs Weighted Global Production (Weighted GoM) Organic 1 Reported 2% 16% 15% Body Exteriors & Structures 4% 18% 20% Power & Vision 15% 29% 28% Seating Systems (7%) 7% 9% Complete Vehicles 3% 17% 17% TOTAL SALES 15% Unweighted Production Growth 14% Weighted Production Growth 2 1 Organic Sales represents sales excluding acquisitions net of divestitures and FX movements 2 Calculated by applying Magna geographic sales weighting, excluding Complete Vehicles, to regional production Q2 2023 vs Q2 2022
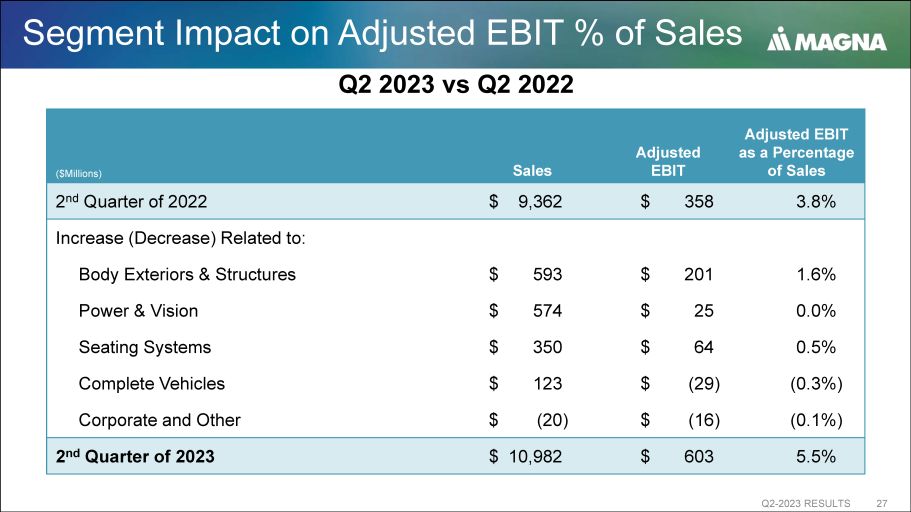
Segment Impact on Adjusted EBIT % of Sales Q2 - 2023 RESULTS 27 Adjusted EBIT as a Percentage of Sales Adjusted EBIT Sales ($Millions) 3.8% $ 358 $ 9,362 2 nd Quarter of 2022 Increase (Decrease) Related to: 1.6% $ 201 $ 593 Body Exteriors & Structures 0.0% $ 25 $ 574 Power & Vision 0.5% $ 64 $ 350 Seating Systems (0.3%) $ (29) $ 123 Complete Vehicles (0.1%) $ (16) $ (20) Corporate and Other 5.5% $ 603 $ 10,982 2 nd Quarter of 2023 Q2 2023 vs Q2 2022

Geographic Sales Q2 - 2023 RESULTS 28 Q2 2022 Q2 2023 Asia ASIA PRODUCTION 17% China Production 21% $4.6B $5.4B $0.0B $1.0B $2.0B $3.0B $4.0B $5.0B $6.0B $3.8B $4.4B $0.0B $0.5B $1.0B $1.5B $2.0B $2.5B $3.0B $3.5B $4.0B $4.5B $5.0B $947M $1,250M $000M $200M $400M $600M $800M $1000M $1200M $1400M $122M $137M $0M $20M $40M $60M $80M $100M $120M $140M $160M North America PRODUCTION 14% Europe PRODUCTION 13% S.A. PRODUCTION 12% Rest of World Q2 2023 vs Q2 2022

2023 Segment Adjusted EBIT Margin Q2 - 2023 RESULTS 29 Body Exteriors & Structures 2022 May 2023 Outlook August 2023 Outlook 5.3% 6.4 - 6.9% 6.9 - 7.4% 1.9% 2.9 - 3.4% 3.2 - 3.7% 4.0% 4.8 - 5.3% 4.1 - 4.6% 4.5% 1.4 - 1.9% 1.6 - 2.1% Seating Power & Vision Complete Vehicles

Capital Allocation Principles Q2 - 2023 RESULTS 30 Disciplined, Profitable Approach to Growth Remains a Foundational Principle Q2 2023 • Preserve liquidity and high investment grade credit ratings Maintain Strong Balance Sheet 2.19x LTM 30JUN23 - Adj. debt / Adj. EBITDA ratio between 1.0 - 1.5x • Maintain flexibility to invest for growth $ 502M $ 96M $ 1,475M Fixed asset additions Other investments Acq . of Veoneer Active Safety • Organic and inorganic opportunities Invest for Growth • Innovation $ 129M • Continued dividend growth over time Return Capital to Shareholders • Repurchase shares with excess liquidity

Q2 - 2023 RESULTS 31
Exhibit 99.3

REFINITIV STREETEVENTS EDITED TRANSCRIPT MG.TO - Q2 2023 Magna International Inc Earnings Call EVENT DATE/TIME: AUGUST 04, 2023 / 12:00PM GMT REFINITIV STREETEVENTS | www.refinitiv.com | Contact Us ©2023 Refinitiv. All rights reserved. Republication or redistribution of Refinitiv content, including by framing or similar means, is prohibited without the prior written consent of Refinitiv. 'Refinitiv' and the Refinitiv logo are registered trademarks of Refinitiv and its affiliated companies.

AUGUST 04, 2023 / 12:00PM, MG.TO - Q2 2023 Magna International Inc Earnings Call CORPORATE PARTICIPANTS Louis Tonelli Magna International Inc. - VP of IR Patrick W. D. McCann Magna International Inc. - Executive VP & CFO Seetarama Swamy Kotagiri Magna International Inc. - CEO & Director CONFERENCE CALL PARTICIPANTS Brian Morrison TD Securities Equity Research - Research Analyst Colin M. Langan Wells Fargo Securities, LLC, Research Division - Senior Equity Analyst Dan Meir Levy Barclays Bank PLC, Research Division - Senior Analyst Gautam Narayan RBC Capital Markets, Research Division - Assistant VP James Albert Picariello BNP Paribas Exane, Research Division - Research Analyst John Joseph Murphy BofA Securities, Research Division - MD and Lead United States Auto Analyst Mark Trevor Delaney Goldman Sachs Group, Inc., Research Division - Equity Analyst Tamy Chen BMO Capital Markets Equity Research - Cannabis Analyst PRESENTATION Operator Greetings, and welcome to the Q 2 2023 Results Conference Call . (Operator Instructions) As a reminder, this conference is being recorded, Friday, August 4 , 2023 . I would now like to turn the conference over to Louis Tonelli, Vice President, Investor Relations. Please go ahead. Louis Tonelli - Magna International Inc . - VP of IR Thanks, Rita . Hello, everyone, and welcome to our conference call covering our second quarter 2023 . Joining me today are Swamy Kotagiri and Pat McCann . Yesterday, our Board of Directors met and approved our financial results for the second quarter of ' 23 as well as our ' 23 outlook -- our updated ' 23 outlook . We issued a press release this morning outlining our results . You'll find the press release, today's conference call webcast, the slide presentation to go along with the call and our updated quarterly financial review all in the Investor Relations section of our website at magna . com . Before we get started, just as a reminder, the discussion today may contain forward - looking information or forward - looking statements within the meaning of applicable securities legislation . Such statements involve certain risks, assumptions and uncertainties, which may cause the company's actual or future results and performance to be materially different from those expressed or implied in these statements . Please refer to today's press release for a complete description of our safe harbor disclaimer . Please also refer to our reminder slide included in the presentation that relates to our commentary today . And with that, I'll pass it over to Swamy . Seetarama Swamy Kotagiri - Magna International Inc. - CEO & Director Thank you, Louis . Good morning, everyone . I appreciate you joining our call today, and I'm happy to kick off today's call with an update on our progress . And following a financial update from Pat, I look forward to answering your questions . 2 REFINITIV STREETEVENTS | www.refinitiv.com | Contact Us ©2023 Refinitiv. All rights reserved. Republication or redistribution of Refinitiv content, including by framing or similar means, is prohibited without the prior written consent of Refinitiv. 'Refinitiv' and the Refinitiv logo are registered trademarks of Refinitiv and its affiliated companies.
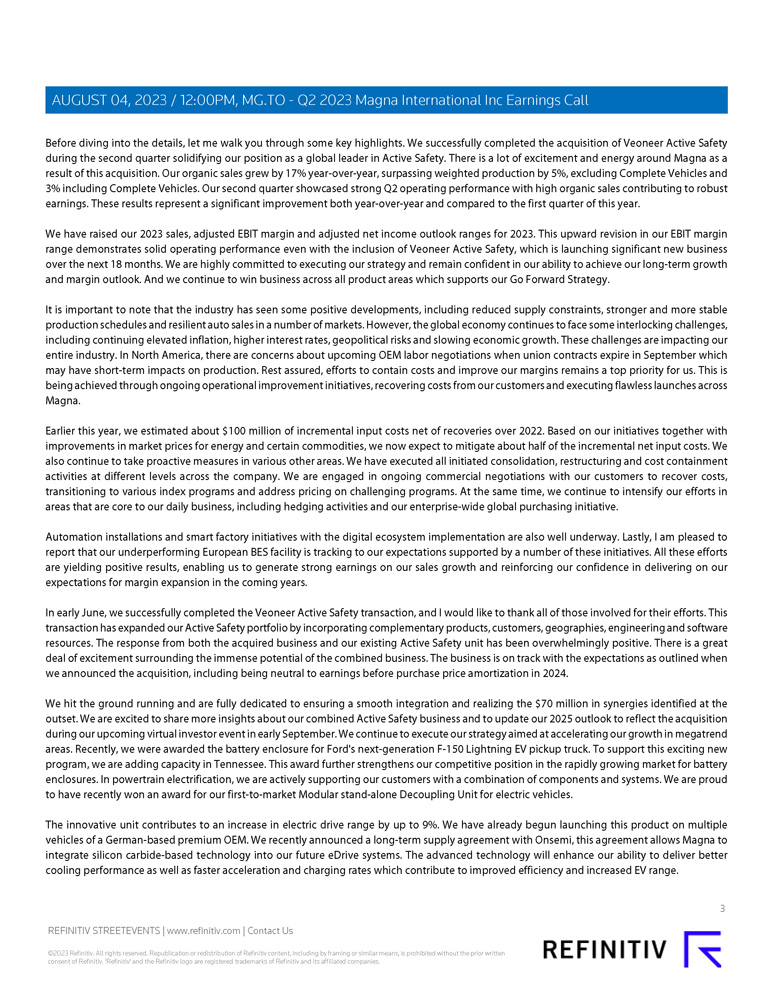
Before diving into the details, let me walk you through some key highlights . We successfully completed the acquisition of Veoneer Active Safety during the second quarter solidifying our position as a global leader in Active Safety . There is a lot of excitement and energy around Magna as a result of this acquisition . Our organic sales grew by 17 % year - over - year, surpassing weighted production by 5 % , excluding Complete Vehicles and 3 % including Complete Vehicles . Our second quarter showcased strong Q 2 operating performance with high organic sales contributing to robust earnings . These results represent a significant improvement both year - over - year and compared to the first quarter of this year . We have raised our 2023 sales, adjusted EBIT margin and adjusted net income outlook ranges for 2023 . This upward revision in our EBIT margin range demonstrates solid operating performance even with the inclusion of Veoneer Active Safety, which is launching significant new business over the next 18 months . We are highly committed to executing our strategy and remain confident in our ability to achieve our long - term growth and margin outlook . And we continue to win business across all product areas which supports our Go Forward Strategy . It is important to note that the industry has seen some positive developments, including reduced supply constraints, stronger and more stable production schedules and resilient auto sales in a number of markets . However, the global economy continues to face some interlocking challenges, including continuing elevated inflation, higher interest rates, geopolitical risks and slowing economic growth . These challenges are impacting our entire industry . In North America, there are concerns about upcoming OEM labor negotiations when union contracts expire in September which may have short - term impacts on production . Rest assured, efforts to contain costs and improve our margins remains a top priority for us . This is being achieved through ongoing operational improvement initiatives, recovering costs from our customers and executing flawless launches across Magna . Earlier this year, we estimated about $ 100 million of incremental input costs net of recoveries over 2022 . Based on our initiatives together with improvements in market prices for energy and certain commodities, we now expect to mitigate about half of the incremental net input costs . We also continue to take proactive measures in various other areas . We have executed all initiated consolidation, restructuring and cost containment activities at different levels across the company . We are engaged in ongoing commercial negotiations with our customers to recover costs, transitioning to various index programs and address pricing on challenging programs . At the same time, we continue to intensify our efforts in areas that are core to our daily business, including hedging activities and our enterprise - wide global purchasing initiative . Automation installations and smart factory initiatives with the digital ecosystem implementation are also well underway . Lastly, I am pleased to report that our underperforming European BES facility is tracking to our expectations supported by a number of these initiatives . All these efforts are yielding positive results, enabling us to generate strong earnings on our sales growth and reinforcing our confidence in delivering on our expectations for margin expansion in the coming years . In early June, we successfully completed the Veoneer Active Safety transaction, and I would like to thank all of those involved for their efforts . This transaction has expanded our Active Safety portfolio by incorporating complementary products, customers, geographies, engineering and software resources . The response from both the acquired business and our existing Active Safety unit has been overwhelmingly positive . There is a great deal of excitement surrounding the immense potential of the combined business . The business is on track with the expectations as outlined when we announced the acquisition, including being neutral to earnings before purchase price amortization in 2024 . We hit the ground running and are fully dedicated to ensuring a smooth integration and realizing the $ 70 million in synergies identified at the outset . We are excited to share more insights about our combined Active Safety business and to update our 2025 outlook to reflect the acquisition during our upcomin g virtual investor event in early September . We continue to execute our strategy aimed at accelerating our growth in megatrend areas . Recently, we were awarded the battery enclosure for Ford's next - generation F - 150 Lightning EV pickup truck . To support this exciting new program, we are adding capacity in Tennessee . This award further strengthens our competitive position in the rapidly growing market for battery enclosures . In powertrain electrification, we are actively supporting our customers with a combination of components and systems . We are proud to have recently won an award for our first - to - market Modular stand - alone Decoupling Unit for electric vehicles . The innovative unit contributes to an increase in electric drive range by up to 9 % . We have already begun launching this product on multiple vehicles of a German - based premium OEM . We recently announced a long - term supply agreement with Onsemi, this agreement allows Magna to integrate silicon carbide - based technology into our future eDrive systems . The advanced technology will enhance our ability to deliver better cooling performance as well as faster acceleration and charging rates which contribute to improved efficiency and increased EV range . AUGUST 04, 2023 / 12:00PM, MG.TO - Q2 2023 Magna International Inc Earnings Call 3 REFINITIV STREETEVENTS | www.refinitiv.com | Contact Us ©2023 Refinitiv. All rights reserved. Republication or redistribution of Refinitiv content, including by framing or similar means, is prohibited without the prior written consent of Refinitiv. 'Refinitiv' and the Refinitiv logo are registered trademarks of Refinitiv and its affiliated companies.

These activities highlight our commitment to driving innovation and positioning ourselves as a leader in the rapidly evolving field of electric mobility . Our success in winning business across all product lines continues to drive growth . In addition to securing the contract for the battery enclosure, we were pleased to announce that we have also recently been awarded the frame and seats for the next - generation F - 150 Lightning . The seating award represents yet another seat complete program for pickup trucks in North America following our previous seat award for GM's pickup trucks to be produced at We were also recently awarded the replacement vehicle assembly business for the iconic Mercedes - Benz G - Class . This award allows us to maintain our 40 - plus year history as the exclusive producer of this off - road vehicle . We produced over 45 , 000 G - Class vehicles in our Graz, Austria facility in 2022 , bringing our lifetime total to over 0 . 5 million . The next - generation G - Class is expected to launch in 2024 and continue to run towards the end of the decade . And we were awarded significant new fascia business on multiple programs from a Europe - based global OEM . We will supply the OEM's assembly plant in North America from an existing exteriors facility beginning in 2026 . With that, I'll pass the call over to Pat . Patrick W . D . McCann - Magna International Inc . - Executive VP & CFO Thanks, Swamy, and good morning, everyone . As Swamy indicated, we delivered strong second quarter earnings and free cash flow, both above our expectations . Now comparing the second quarter of 2023 to 2022 , consolidated sales were $ 11 billion, up 17 % compared to a 15 % increase in global light vehicle production . EBIT was $ 603 million, and EBIT margin increased 170 basis points to 5 . 5 % . It was also up 140 basis points from the first quarter of 2023 . Adjusted EPS came in at $ 1 . 50 up 81 % year - over - year . And free cash flow used in the quarter was $ 7 million compared to $ 52 million generated in the second quarter of 2022 , in part reflecting our higher capital spend to support record program awards in 2022 . During the quarter, we paid dividends of $ 129 million and in addition to raising our sales outlook, we increased our adjusted EBIT margin and earnings outlook . Let me take you through some of the details . North American, European and Chinese light vehicle production were up 14 % , 13 % and 21 % , respectively, netting to a 15 % increase in global production . Our consolidated sales were $ 11 billion, up 17 % over the second quarter of 2022 . On an organic basis, our sales also increased 17 % year - over - year, or a 3 % growth over market or 5 % growth over market, excluding Complete Vehicles . The sales increase was primarily due to higher global vehicle production and Complete Vehicle assembly sales, the launch of new programs, price increases to recover certain higher input costs and the acquisition of Veoneer Active Safety on June 1 , net of divestitures . These are partially offset by the impact of foreign currency translation and contractual customer price givebacks . Adjusted EBIT was $ 603 million, and adjusted EBIT margin was 5 . 5 % compared to 3 . 8 % in Q 2 2022 . Our focus on operational excellence and performance on cost initiatives helped drive strong earnings on higher sales . This was partially offset by the impact of the acquisition of Veoneer Active Safety . Adjusted EBIT margin was also possibly impacted by about 25 basis points of net operational items, including productivity and efficiency improvements at certain facilities and higher tooling contribution, partially offset by higher program - related engineering spending and launch costs and higher equity income, which benefited margins by about 10 basis points . EBIT margin was negatively impacted by higher net input costs, primarily lower scrap prices and higher labor costs, partially offset by lower cost for energy, commodities and freight which combined to about 45 basis points and nonrecurring items, which subtracted about 5 basis points . Interest expense increased primarily reflecting the senior notes issued in the first quarter, increased borrowings and higher interest rates, partially offset by higher interest income . Our adjusted effective income tax rate came in at 21 . 8 % , largely in line with our 2023 expectations but lower than Q 2 of last year . And adjusted net income attributable to Magna was $ 430 million, up 77 % over the second quarter of 2022 , reflecting the higher EBIT and lower tax rate, partially offset by higher interest expense and minority interest . Adjusted diluted EPS was $ 1 . 50 , up 81 % compared to Q 2 of last year . The increase is the result of higher net income and fewer shares outstanding . The reduced number of shares outstanding primarily reflects the impact of share repurchases during and subsequent to the second quarter of 2022 . Turning to a review of our cash flows and investment activities . In the second quarter of 2023 , we generated $ 879 million in cash from operations before changes in working capital . We invested $ 332 million in working capital, primarily reflecting the higher sales in the second quarter of 2023 . The investment activities in the quarter included $ 502 million for fixed assets and $ 96 million for investments, other assets and intangibles . The AUGUST 04, 2023 / 12:00PM, MG.TO - Q2 2023 Magna International Inc Earnings Call 4 REFINITIV STREETEVENTS | www.refinitiv.com | Contact Us ©2023 Refinitiv. All rights reserved. Republication or redistribution of Refinitiv content, including by framing or similar means, is prohibited without the prior written consent of Refinitiv. 'Refinitiv' and the Refinitiv logo are registered trademarks of Refinitiv and its affiliated companies.

$ 502 million CapEx is higher than the $ 329 million in Q 2 of last year to support our record program awards in 2022 . Overall, we used free cash flow of $ 7 million in Q 2 , better than we had anticipated . We also acquired Veoneer Active Safety for $ 1 . 48 billion and paid $ 129 million in dividends in the quarter . Our balance sheet continues to be strong with major credit rating agencies recently reaffirming our ratings . At the end of the second quarter, we had over $ 4 . 6 billion in liquidity, including about $ 1 . 3 billion in cash . Currently, our adjusted debt to adjusted EBITDA ratio is 2 . 19 x . Excluding approximately $ 400 million in cash, we are holding to pay down our euro debt set to mature later this year, our ratio would be 2 . 08 . These ratios are tracking better than our previous expectations as a result of our improved operating results . We anticipate a reduction in our leverage ratio by the end of this year and a further decline through 2024 . Next, I will cover our updated outlook which incorporates slightly higher - than - expected vehicle production in both North America and Europe, mainly as a result of better production in Q 2 . Our assumption for production in China is unchanged from our previous outlook . We also assume exchange rates and our outlook will approximate current rates . We now expect a slightly stronger euro and slightly lower Canadian dollar and RMB for 2023 relative to our previous outlook . We have increased our expected sales range, largely reflecting the acquisition of Veoneer Active Safety, higher North American and European production in Q 2 as well as the higher euro . As a result of our strong performance so far in 2023 and expectations for continued operational execution, partially offset by higher cost to launch new programs, we have also increased our adjusted EBIT margin range . This is despite the short - term 20 basis point impact from the Veoneer Active Safety acquisition . We are increasing our equity income range, mainly reflecting lower spend and expected commercial items . As a result of increasing the ranges for our sales and adjusted EBIT margin, we are also raising our range for adjusted net income attributable to Magna . Our capital spending outlook has increased to reflect the Veoneer acquisition in line with our previous expectations . Our interest expense and tax rate are unchanged from our previous outlook . In addition, free cash flow expectations are unchanged, even after incorporating Veoneer Active Safety for the last 7 months of 2023 . Note that beginning in Q 3 , Magna's adjusted EBIT will exclude the amortization of acquired intangibles, the most significant of which is associated with the Veoneer Active Safety acquisition . In summary, we are pleased with our strong operating performance in the second quarter . Once again, we outgrew our end markets by 3 % on a consolidated basis and 5 % excluding Complete Vehicles . We continue to win new business across our portfolio, supporting our Go Forward Strategy and largely as a result of our continued strong execution, we are raising our earnings outlook for the year . Thanks for your attention . We'd be happy to answer your questions . QUESTIONS AND ANSWERS Operator (Operator Instructions) Our first question comes from the line of John Murphy with Bank of America . John Joseph Murphy - BofA Securities, Research Division - MD and Lead United States Auto Analyst Just a first question, as you look at what went on in the quarter, obviously, volumes were up big time on a year - over - year basis, but there was also stabilization in schedules, right? So you knew what you were doing and how to plan for it . Just wondering, which do you think was -- I mean, obviously, the rise in volume is important . But how important was the stabilization in schedules? And how should we think about that going forward in the business? Seetarama Swamy Kotagiri - Magna International Inc . - CEO & Director For sure, both of them, but I think if they have to prioritize, if you look at all the initiatives that we've been talking about play a bigger role in getting the flow - through that we would expect . But definitely, the stabilization of production schedules is what helps those efforts in a big way, right, to AUGUST 04, 2023 / 12:00PM, MG.TO - Q2 2023 Magna International Inc Earnings Call 5 REFINITIV STREETEVENTS | www.refinitiv.com | Contact Us ©2023 Refinitiv. All rights reserved. Republication or redistribution of Refinitiv content, including by framing or similar means, is prohibited without the prior written consent of Refinitiv. 'Refinitiv' and the Refinitiv logo are registered trademarks of Refinitiv and its affiliated companies.

get to the bottom line and get the intended effect of all the activities that we are going through, the big variable would be the stable production . Obviously, the higher volumes help, but the important thing is once you get the higher volumes, can I get the flow through the way we expect, right? So definitely helped both of them this time . John Joseph Murphy - BofA Securities, Research Division - MD and Lead United States Auto Analyst Okay . And then just a second question on the battery and enclosure business for the F - 150 Lightning, the fact that you're getting the frame as well seats as well as good, but I mean the frame and the battery enclosure seemed like they might be interrelated Swamy . How interrelated was that sort of bidding process? How much part of the structure of that truck is that battery enclosure business? And does that set you up well for future wins on other trucks, but maybe other unibody -- that's not unibody but on unibody structures as well . Seetarama Swamy Kotagiri - Magna International Inc . - CEO & Director John, I'll answer the question from a Magna perspective, and we talked about highly integrated systems and the value that Magna brings when we look at not individual component, but more how you bring things together, and I think this plays a role . I won't comment specifically on the architecture of this vehicle because I don't think it will be right for me at this point . But that expertise of knowing the frame, knowing the body enclosures and the whole vehicle definitely comes into play . And as we look forward, we see, in some cases, like you talked about, a framed vehicle with a separate enclosure today, but as you go to the next generation, there is definitely a thought process of how we can get the synergies for structural performance for safety and efficiency and so on . So us being in the program now on actually multiple truck programs, I think, definitely gives us a -- I think, a big advantage in not only addressing what's needed today, but taking this product line and evolving into the future . John Joseph Murphy - BofA Securities, Research Division - MD and Lead United States Auto Analyst And then if I could sneak just one last one in . Commercial discussions with your automaker customers seem to be a little bit more amicable and conciliatory than they have been in the past . Is that a correct interpretation and has something changed here where they're partnering a lot more on sort of cost sharing, particularly as costs are inflating or is it more just more of the same and you guys are just doing a better job with these discussions? Seetarama Swamy Kotagiri - Magna International Inc . - CEO & Director It's a difficult one, John, but I definitely -- I think we had a gritty 6 months is how I would put it . The reactions and the interactions are somewhat mixed . But I can tell you we are laser - focused on it . It's just not a person, but teams and cross - functional across finance and sales and commercial and operations . The entire organization is around this topic . I cannot -- I think -- I won't be explained -- able to explain in few sentences the effort that goes into this . But I would say there is a openness to have the discussion in different forums, like I said, some are a little bit tougher than the other . But it is -- I mean we cannot afford not to do this . It's a must for us, right? And I think the conversations are tough, but I would say they're fair . Operator Our next question comes from the line of Tamy Chen with BMO Capital Markets . Tamy Chen - BMO Capital Markets Equity Research - Cannabis Analyst First, I wanted to talk about Veoneer . So I saw you've given the impact it had on your guidance . Could you just talk a little bit more about how you expect that to trend through the year? And you're expecting it to break even before the incremental amortization next year . Could you just remind us the steps or the path for the business to get to that next year? AUGUST 04, 2023 / 12:00PM, MG.TO - Q2 2023 Magna International Inc Earnings Call 6 REFINITIV STREETEVENTS | www.refinitiv.com | Contact Us ©2023 Refinitiv. All rights reserved. Republication or redistribution of Refinitiv content, including by framing or similar means, is prohibited without the prior written consent of Refinitiv. 'Refinitiv' and the Refinitiv logo are registered trademarks of Refinitiv and its affiliated companies.

Seetarama Swamy Kotagiri - Magna International Inc . - CEO & Director I'll give you a few key points and, Pat, you can jump in . As we said, we closed the transaction, happy to say that we hit the ground running on the integration efforts . And I think I could summarize by saying that we are comfortable with what we talked about when we did the acquisition announcement . So some of the facts that we talked about at that time, 2023 sales, about $ 1 billion, and we said it would have a 20 basis points impact on consolidated EBIT margin . CapEx was roughly around $ 100 million, EBITDA positive in 2023 . We expect $ 70 million in synergies by 2025 . I think we are tracking very well, and there could be tailwinds going forward . EBIT neutral in 2024 ex PPA . And a little bit more color on 2025 impact, we should be able to do that in our virtual Investor Day update that's coming up, Tamy, in September . Tamy Chen - BMO Capital Markets Equity Research - Cannabis Analyst Okay . Can you talk specifically though about next year of the business going to EBIT neutral from now being a drag? Can you just remind us of some of the steps to get there? Patrick W . D . McCann - Magna International Inc . - Executive VP & CFO So congratulations on your new role . When you think about the Veoneer business, it's quite similar to our existing electronics business, and they're experiencing rapid growth . So really, the driver of what's happening is a combination of 2 things . One is there -- a lot of their launch costs are being incurred this year, and they're going to continue through next year . But what's happening is -- as that business launches, it's driving a lot of contribution margin that's going to benefit as the volumes ramp . To be honest with you, that's really the inflection point we're seeing in their business, and it's similar to what we're seeing in our business . And that's what's going to drive the dollar growth and the margin improvement . Tamy Chen - BMO Capital Markets Equity Research - Cannabis Analyst Got it . Okay . And then my other question is -- it's quite a strong performance in your Cosma business . I don't think we've seen the 8 % or above EBIT margin really since early 2021 . I know you called out through the call all the positive factors that have happened this quarter . But could you just specifically on the Cosma business talk a bit about what really drove quite a strong performance . It was strong sequentially as well . Can you also talk a little bit about within that business, there have been that underperforming plants . Just -- you touched on it a bit earlier in your comments, but a little bit more detail on that . Are you largely through that headwind as well? Seetarama Swamy Kotagiri - Magna International Inc . - CEO & Director Yes . Tamy, from a Cosma perspective, like you said, we have seen those type of numbers before and as we discussed the production stability, having the volumes coming back up, taking back up and all the initiatives are a combination . It's really good execution on higher sales is one and kind of operational improvement in a couple of facilities . You touched on the BES facility that we had issues with . And it's tracking the predominant factor, as I discussed previously, was the efficiency hit that we were having and therefore, had to outsource capacity . So I'm happy to say now that we improved our efficiency, so the capacity opens up and we are able to bring back work which obviously helps . And that's -- I would say it's on track and continuing to make progress as we had discussed towards the end of 2024 and one other thing would be comparing to 2022 Q 2 , it would be Russia which are not there . And some of it is also commercial resolutions in the quarter including retro from that goes back into the previous part of the year . But also, I want to mention that there is some benefit going forward in a run rate perspective . So I would say those are the combination of things that led to the expected strong performance in -- just in BES but specifically in Cosma . Louis Tonelli - Magna International Inc . - VP of IR And Tamy, you mentioned Cosma, but yes, it's all of -- the biggest chunk of that is Cosma, but we have our Exteriors business in there as well . AUGUST 04, 2023 / 12:00PM, MG.TO - Q2 2023 Magna International Inc Earnings Call 7 REFINITIV STREETEVENTS | www.refinitiv.com | Contact Us ©2023 Refinitiv. All rights reserved. Republication or redistribution of Refinitiv content, including by framing or similar means, is prohibited without the prior written consent of Refinitiv. 'Refinitiv' and the Refinitiv logo are registered trademarks of Refinitiv and its affiliated companies.

Patrick W . D . McCann - Magna International Inc . - Executive VP & CFO And there were some commercial items . Tamy, when you think about where we're pushing forward recoveries, we're pushing for commercial recoveries as well . And when we talk commercial, it's cancellation claims, low volume claims . So some of that benefit did come through in the quarter and part of it was retro as Swamy mentioned . Operator Our next question comes from the line of [Chris McNally] with Evercore . Unidentified Analyst Just wanted to follow up on the last set of questions on Body . If we look at the implied second half versus sort of Q 2 where you put up the impressive margins, was there any particular sort of price that was taken in Q 2 that was retroactive? Some of the suppliers are talking about -- looking at sort of first half margins, for example, for divisions because of the timing of some of these price recoveries . And then as a follow through, how do we think about pros and cons, headwinds, tailwinds for Body in the second half? Patrick W . D . McCann - Magna International Inc . - Executive VP & CFO Chris, I guess, afternoon to you . I think you -- you're absolutely correct . When you think about these commercial items and the inflation recoveries, a portion of them -- as these are being negotiated throughout the year, a portion by default becomes retro . So there are some retro recoveries in the second quarter related to Q 1 and a little bit from 2022 , but it's primarily a Q 1 issue as we push forward . So it's fair to say that our margin in our BES segment is going to peak in Q 2 and normalize to those guidance ranged in the second half of the year . I don't want to -- like there is a commercial portion, but the real drive here is volumes and execution on that volume increase . That is -- that's really what's driving the performance improvement . Louis Tonelli - Magna International Inc . - VP of IR And keep -- keep in mind, H 2 versus H 1 , we do see volumes down, just some of that's just regular seasonality, but volumes and sales will be expected to be down . Unidentified Analyst No, and that makes sense . I mean one of the things we're in the analyst community, we're dealing with the suppliers are being appropriately conservative, but basically by your implied production, you have second half down versus first half, which the forecasters have slightly up . So that makes sense . If we stick on margin Seating, it looks like it's starting to turn a corner and Seating has been this sort of persistent low margin, you had some of the BMW business that came on that had different margin characteristics . Are we turning a volume -- turning a corner? And does the European volumes that are turning actually start to really help here, which has been a drag for several years? Seetarama Swamy Kotagiri - Magna International Inc . - CEO & Director I think we talked about the mix issue that we've had in Seating, right? That was disproportionately impacting us . And as the volumes are coming back and the mix is becoming more normalized than lopsided, we are starting to see those effects come through but I also have to give a lot of credit to the Seating team on how they are being part of this overall initiative that we are looking at and starting to see the impact of that whether it's some of the digitization efforts, some of just block and tackle type things that we're going through . And we also talked about some of the wins AUGUST 04, 2023 / 12:00PM, MG.TO - Q2 2023 Magna International Inc Earnings Call 8 REFINITIV STREETEVENTS | www.refinitiv.com | Contact Us ©2023 Refinitiv. All rights reserved. Republication or redistribution of Refinitiv content, including by framing or similar means, is prohibited without the prior written consent of Refinitiv. 'Refinitiv' and the Refinitiv logo are registered trademarks of Refinitiv and its affiliated companies.

in the truck segment in North America and some actual discussions on existing nonperforming programs . It's a combination of all of this that we are seeing the effect just not today, but I think we are very optimistic about what we could see in the coming years in Seating . Unidentified Analyst Okay . Great . And I'll hold back on the ADAS and the radar questions, look forward to the events in September . Operator Our next question comes from the line of Mark Delaney with Goldman Sachs . Mark Trevor Delaney - Goldman Sachs Group, Inc . , Research Division - Equity Analyst I believe last year, Magna's megatrend revenue was about $ 1 billion . And I think you guided it to approximately double this year and then to reach about $ 4 billion in 2025 , excluding Veoneer Active Safety . Given some of the volatility that's been happening with some of the EV plants from certain OEMs, I'm curious if you could give us an update about how you're tracking in those megatrend areas relative to the prior targets . Seetarama Swamy Kotagiri - Magna International Inc . - CEO & Director I would say, to answer your question, looking at what we know today, obviously, in terms of take rates and so on and so forth, we are tracking to what we had talked about . And you mentioned the numbers, it's roughly about $ 4 billion in 2025 , right . But as you said, it's very early days of electrification, I think we all know that it's a secular trend for sure, and it's here to stay . But the real trick is in predicting the trajectory . That's something that we all have to wait and see . And we are taking all the tools in the toolbox to look at how can we have that flexibility? And how can we pivot, how can we look at different programs and so on and so forth . But overall, whether it's electrification or ADAS, I think we are tracking to the numbers that we talked about . Mark Trevor Delaney - Goldman Sachs Group, Inc . , Research Division - Equity Analyst That's helpful . And then in terms of the margin improvement opportunities . You talked a little bit around commercial negotiations already . Slide 9 , though, mentions repricing underperforming programs as one of the margin opportunities . So I was wanting to understand that dynamic specifically, if possible, and to have a better sense of how broad based these underperforming programs are? I mean is it isolated to a few? Or is that a wider initiative? And any color you can share on your progress? And how luckily you think it is that you'll be able to restructure some of those programs? Seetarama Swamy Kotagiri - Magna International Inc . - CEO & Director Mark, I wouldn't call it wider . It's actually a very -- call it a granular look, which is a normal process . It's very targeted, very granular, very deliberate . We are looking at programs as they come towards the end of a program, right? End of production cycle . There are some ways, there is a replacement coming through . There is some extensions that come through . We look at all of these opportunities and sometimes it's change of scope on the project . We are looking at everything out there to see how do we effectively reprice, get the economics to where they really need to which meets our financial hurdles . And I can definitely say we have had success in some of these cases and some are still an ongoing discussion . Operator Our next question comes from the line of Tom Narayan with RBC . AUGUST 04, 2023 / 12:00PM, MG.TO - Q2 2023 Magna International Inc Earnings Call 9 REFINITIV STREETEVENTS | www.refinitiv.com | Contact Us ©2023 Refinitiv. All rights reserved. Republication or redistribution of Refinitiv content, including by framing or similar means, is prohibited without the prior written consent of Refinitiv. 'Refinitiv' and the Refinitiv logo are registered trademarks of Refinitiv and its affiliated companies.

Gautam Narayan - RBC Capital Markets, Research Division - Assistant VP The first one is could you remind us what your -- I guess your D 3 U . S . exposure is? Just asking, just you may help us understand maybe how we should think about potential strike implications? Louis Tonelli - Magna International Inc . - VP of IR Yes . I think I'm going to say we're probably 75 % in North America, we're about 75 % of our business in that area . So [you disclosed] that I haven't got that handy, but it's in that range of the North American business . Gautam Narayan - RBC Capital Markets, Research Division - Assistant VP And any breakout of the 3 OEMs or ... Louis Tonelli - Magna International Inc . - VP of IR I [can] get that for you, Tom . I don't have it at my fingertips . Gautam Narayan - RBC Capital Markets, Research Division - Assistant VP And then the other one is we've been hearing about some BEV slowdown chatter, specifically with legacy North American OEMs . It's coming up in a lot of the supplier calls . Just curious if you're seeing this -- if this is impacting kind of your EV business kind of more near term, or if you're seeing anything there? Seetarama Swamy Kotagiri - Magna International Inc . - CEO & Director Yes, Tom . This is Swamy . I think if you look at it, I mean, really, the EV business is just a -- call it, early days . It's just launching and it's just taking -- if you look at the numbers, right, we are like, what, 2 million or so in vehicles . So it's more about how you position yourself on the right programs and looking at each of this, how we go about and what type of thinking you have in processing these programs . I think that's the important part . I don't know if you go back 2 or 3 years, we talked with a different tone . And today, it's with a different tone . I think we need to take a more calm approach . And as I said, I believe and we believe at Magna that it's a trend here to stay . We have to figure out how to manage the transition, and that's where our focus is . Gautam Narayan - RBC Capital Markets, Research Division - Assistant VP Okay . And then lastly, if I look at the 2 segments, I think we're pretty interesting in Q 2 , BE&S very strong . And then P&V maybe a little bit lighter than maybe some folks expected, but then you've raised sales forecast for both . I know things can be kind of lumpy for quarter - to - quarter, just curious about Q 2 sustainability in these 2 segments in H 2 . Clearly, you're expecting an improvement in P&V and how should we think about these 2 segments, Q 2 versus H 2 ? Seetarama Swamy Kotagiri - Magna International Inc . - CEO & Director Yes . I think we touched on some of the factors that contributed to the strong BES contribution, right . And we kind of see that going forward . There is no reason for us to think any different given there is no other major disruption or some industry - wide thing, we are starting to see, like I said, the efforts on all the initiatives that we have in place and stability in production and increasing volumes . The P&V, as you mentioned, really, the net AUGUST 04, 2023 / 12:00PM, MG.TO - Q2 2023 Magna International Inc Earnings Call 10 REFINITIV STREETEVENTS | www.refinitiv.com | Contact Us ©2023 Refinitiv. All rights reserved. Republication or redistribution of Refinitiv content, including by framing or similar means, is prohibited without the prior written consent of Refinitiv. 'Refinitiv' and the Refinitiv logo are registered trademarks of Refinitiv and its affiliated companies.

input costs were a headwind year - over - year in the first half . The acquisition of Veoneer Active Safety negatively impacted the Q 2 and we talked about a few things in the first quarter, which was a warranty item, there was a net negative commercial item in Q 2 and some higher engineering costs that were associated with the launch of the program . So operationally, it's good, all of this, call it, one - timers were lapped in the first half of the year . So we see going forward, if you exclude those things, a better run rate . Louis Tonelli - Magna International Inc . - VP of IR Yes . If you kind of -- excluding those items, the pull - through is actually quite good in P&V in the quarter . Operator Our next question comes from the line of Colin Langan with Wells Fargo . Colin M . Langan - Wells Fargo Securities, LLC, Research Division - Senior Equity Analyst Just at a high level, if I look at the guidance, first half to second half, you have sales down to [ $ 600 ] and that's with Veoneer, which I assume that means it's over $ 1 billion in the first half, second half, but EBIT up . So what are the major puts and takes that get that up? And I assume also that the guidance doesn't include any sort of factor for UAW [from that] . Patrick W . D . McCann - Magna International Inc . - Executive VP & CFO So H 1 versus H 2 , I think was your question, just the Magna consolidated variance . So the second part of your question was, you're correct, we haven't modeled in or factored in a UAW disruption, if any . When you think about -- I think Swamy has touched on a lot of the points, but big picture, when you take a step back and look at our H 1 versus H 2 , there's a couple of factors . The -- we expect -- on the recoveries, we expect those to be more back half versus first half . And that's what we've projected from the beginning of the year, and that's what we're continuing to see . So that's number one . Number two, there were some discrete items that happened in the first half of the year that aren't expected to recover . Swamy touched on the warranty issue that we had in Q 1 . There was a few commercial settlements that have happened that positively impacted us that we're in the second quarter that were retro back into Q 1 , a portion back into Q 2 . And then as we move forward, we're still seeing stabilization of the production schedules, which is benefiting us . But I think, again, I just want to reinforce, when you come in with a lot of these operational improvements that we talk about is they take time to gain traction . So you implement a strategy and then you start permutating them across the various divisions and you gain acceleration as you go through . So for example, Swamy touched on our ability to make improvements in our underperforming division in Germany . That's what we're seeing . So those are sequential improvements that we're seeing from H 1 into H 2 . And then obviously, the acquisition of Veoneer comes in the second half of the year with the -- about $ 1 billion of sales coming in, which does strike a margin as we pointed out by about 20 basis points, which goes the other way . Colin M . Langan - Wells Fargo Securities, LLC, Research Division - Senior Equity Analyst Got it . And any color on the change in adjusted EBIT now excluding amortization? How big of a factor will that be? And then I wasn't really sure, I think you didn't include it as an adjustment in Q 1 , Q 2 but for the rest of the year, it will be adjustments . So does Q 1 , Q 2 eventually get restated to exclude amortization 2 ? And will that be driving some of the comparisons we're looking at? AUGUST 04, 2023 / 12:00PM, MG.TO - Q2 2023 Magna International Inc Earnings Call 11 REFINITIV STREETEVENTS | www.refinitiv.com | Contact Us ©2023 Refinitiv. All rights reserved. Republication or redistribution of Refinitiv content, including by framing or similar means, is prohibited without the prior written consent of Refinitiv. 'Refinitiv' and the Refinitiv logo are registered trademarks of Refinitiv and its affiliated companies.

Louis Tonelli - Magna International Inc . - VP of IR Yes, we're still working through the impacts and take a little bit of time to refine that calculation . But our estimate on an annual basis is about $ 60 million, so about $ 30 million in the back half of the year . Patrick W . D . McCann - Magna International Inc . - Executive VP & CFO And Colin, that's preliminary . That's part of the reason we're excluding it as well at this point . But just the basis for why we've done it, so you're correct . We -- on a go - forward basis, we're going to exclude it and what we're excluding specifically is acquired purchased intangibles, so the amortization of such amounts . So it's not regular increments . And the reason we're doing it is effectively, we're trying to improve how we manage our businesses . So we have an existing electronics business, roughly the same size as the acquired entity, and we want to manage -- evaluate them, their performance and their execution on an apples - to - apples basis . So that's why we've made the decision to exclude it . The other factor was -- from an investor's perspective, when we're thinking -- if I was sitting in your seat is I want to be able to evaluate how Magna's electronics business is performing versus our peers . And we did an analysis just to make sure we're consistent with our peer group in that regard . Colin M. Langan - Wells Fargo Securities, LLC, Research Division - Senior Equity Analyst And just one quick follow up. The $60 million estimate, is that just Veoneer? And - - because I think there's about the 10 - K said there'd be around $90 million of amortization just going into the year. So does that also get pulled out, so I'm comparing apples to apples? Patrick W. D. McCann - Magna International Inc. - Executive VP & CFO So you're talking -- we're talking specifically amortization of acquired intangibles . I don't know what the [ 90 ] you're referring to is, there's other -- if you're referring back to the cash flow statement, there's other amounts in that 90 , but approximately $ 60 million is Veoneer . Colin M. Langan - Wells Fargo Securities, LLC, Research Division - Senior Equity Analyst Okay. So that will be the full year charge going forward, $60 million will be pulled out as a special item, kind of... Patrick W. D. McCann - Magna International Inc. - Executive VP & CFO Approximately Operator Our next question comes from the line of Dan Levy with Barclays. Dan Meir Levy - Barclays Bank PLC, Research Division - Senior Analyst First, I wanted to go back to the theme of first half to second half and specifically wanted to focus on Complete Vehicles where I think your guidance is implying the business to be almost breakeven, just very slightly positive . It's a significant deceleration versus the first half . And maybe you can just talk about some of the puts and takes on what's happening in Complete Vehicles in the second half -- does this change the way we should think about the out - year forecast for Complete Vehicles? AUGUST 04, 2023 / 12:00PM, MG.TO - Q2 2023 Magna International Inc Earnings Call 12 REFINITIV STREETEVENTS | www.refinitiv.com | Contact Us ©2023 Refinitiv. All rights reserved. Republication or redistribution of Refinitiv content, including by framing or similar means, is prohibited without the prior written consent of Refinitiv. 'Refinitiv' and the Refinitiv logo are registered trademarks of Refinitiv and its affiliated companies.

Patrick W . D . McCann - Magna International Inc . - Executive VP & CFO It's -- I'm pausing here to answer . When you think about our Complete Vehicles business, you really have to consider a bunch of factors . One is what products are in that facility at that point in time . So in the first half of the year, we were still producing the BMW 5 Series, and that's rolled off . And now we're going into the middle of launching the Fisker program . But what you see more broadly when you think about a European business like Steyr, there is quite a difference in profitability between the first half and the second half of the year, just more broadly . I don't -- we haven't changed our expectations for -- I keep saying Steyr, but our Complete Vehicles business for the full year, we had a few -- we had some positive engineering outcomes in the first half of the year but those were factored in and we get into the second half, we're still pushing towards that, that was margin expectations . So long answer, but I don't see anything unusual in the second half of the year is that we should be reflecting just its launch and put as planned downtime . Louis Tonelli - Magna International Inc . - VP of IR I mean, we started the year 1 % to 2 % , we're at 1 . 6 % to 2 . 1 % . So all in, we're actually increasing our outlook in Complete Vehicles . Dan Meir Levy - Barclays Bank PLC, Research Division - Senior Analyst Right . And I know that generally, we shouldn't look at the quarter, there is seasonality and whatnot . But -- is that second half, I think you talked about it, is that's specifically being dragged by launch of new programs? Or is there something just timing of input costs? Unidentified Company Representative No, it's [former] debt . So if you think about what happened, it's primarily the launch, the planned downtime that you have through the summer and then you have another downtime through the December period . Louis Tonelli - Magna International Inc . - VP of IR And we've expected to have throughout the year . Patrick W . D . McCann - Magna International Inc . - Executive VP & CFO Which is every single year . Dan Meir Levy - Barclays Bank PLC, Research Division - Senior Analyst Okay . All right . So that's not something we should extrapolate going forward? Patrick W . D . McCann - Magna International Inc . - Executive VP & CFO No, absolutely . Dan Meir Levy - Barclays Bank PLC, Research Division - Senior Analyst Okay . Okay . Great . And second, Swamy, just a question on your vertical integration efforts in EVs . Historically, in EV setting aside LG, you were mostly focused on the drive unit and you outsource motors and inverters . Can you just talk about the supply agreement with Onsemi? Is this a foray into making your own inverters? Or is this just a partnership to get inverters from a third party? AUGUST 04, 2023 / 12:00PM, MG.TO - Q2 2023 Magna International Inc Earnings Call 13 REFINITIV STREETEVENTS | www.refinitiv.com | Contact Us ©2023 Refinitiv. All rights reserved. Republication or redistribution of Refinitiv content, including by framing or similar means, is prohibited without the prior written consent of Refinitiv. 'Refinitiv' and the Refinitiv logo are registered trademarks of Refinitiv and its affiliated companies.

Seetarama Swamy Kotagiri - Magna International Inc . - CEO & Director Yes . I think, Dan, we talked about it a little bit over time, right? In terms of the building blocks and what are some of the key pieces to get to the full eDrive system . Even before the LG JV that you mentioned, we made inverters, and we had the capacity to do that between Magna Powertrain and Magna Electronics growth . So we're just taking one step forward when we talk about Onsemi . It's just looking at whether it is silicon carbide organ or something, just the overall power electronics strategy, how and what should we be doing . So it is just part of that overall strategy . So we always had the ability to do inverters . Now we're just doing it collectively in our LG JV, so this is just further vertical integration to bring value adding to the system . . Operator Our next question comes from the line of James Picariello with BNP Paribas . James Albert Picariello - BNP Paribas Exane, Research Division - Research Analyst Just to clarify more of a housekeeping item on the intangibles amortization . Can you just quantify for legacy Magna, what the intangibles amortization amount was for last year, just to have some bearing as to -- I mean, I know it's immaterial, but what was that number? Patrick W . D . McCann - Magna International Inc . - Executive VP & CFO We'll have to get back to you, James, because it is immaterial . It wouldn't be a big number . If you think -- fundamentally, we haven't done an acquisition of a technology company . So we haven't experienced a situation where you have such a significant amount of acquired technology intangibles and that's really what's driving the $ 60 million Louis was referring to . But we can get back to you with the exact number, but it's not material . James Albert Picariello - BNP Paribas Exane, Research Division - Research Analyst Understood . And then just on Veoneer, it looks like the guide shows $ 1 billion in revenue and based on the 20 basis points margin dilution impact, about $ 30 million to $ 35 million operating loss for the 7 months . If we annualize that, right, for Veoneer, we'd be looking at $ 1 . 7 billion in revenue and approximate $ 60 million operating loss . Just curious if you could kind of bless the thinking on the annualized run rate for Veoneer here? Seetarama Swamy Kotagiri - Magna International Inc . - CEO & Director Yes . I think maybe there's 2 things to consider . Pat, you can add to it . I think when we bring all of this stuff together, there are synergies in terms of how you look at platforms, how we look at coordinated efforts on some core projects, some purchasing initiatives . So I think it's better maybe in my opinion, to look at run rates going forward from the combined entities rather than look at each one separately . And hopefully, we'll be able to give some color when we talk in September, but all of this will be included when we come back as we're doing all bottoms up the business planning process and will be included when we come out and talk in 2024 . Louis Tonelli - Magna International Inc . - VP of IR Sorry, James . Does -- I keep in mind what we said earlier about neutral in 2024 , right? So that tells us something about the run rate relative to the back half of the year -- neutral . AUGUST 04, 2023 / 12:00PM, MG.TO - Q2 2023 Magna International Inc Earnings Call 14 REFINITIV STREETEVENTS | www.refinitiv.com | Contact Us ©2023 Refinitiv. All rights reserved. Republication or redistribution of Refinitiv content, including by framing or similar means, is prohibited without the prior written consent of Refinitiv. 'Refinitiv' and the Refinitiv logo are registered trademarks of Refinitiv and its affiliated companies.

James Albert Picariello - BNP Paribas Exane, Research Division - Research Analyst And in the second quarter, just a quick one. Was there any retroactive material recovery tied to the first quarter in the second quarter numbers, particularly in the Body Exteriors & Structures segment? Patrick W. D. McCann - Magna International Inc. - Executive VP & CFO Yes. So I think we talked about this earlier, so I'm not going to repeat everything, but the short answer is yes. James Albert Picariello - BNP Paribas Exane, Research Division - Research Analyst Okay. You just can't quantify it. Patrick W. D. McCann - Magna International Inc. - Executive VP & CFO No. . Operator Our next question comes from the line of Brian Morrison with TD Securities. Brian Morrison - TD Securities Equity Research - Research Analyst I have a housekeeping question as well. So Pat or Swamy. In prepared comments on net inflationary costs, you said something in the tune of incremental $100 million for 2023 and you'd recover half of that, can you just clarify what the net exposure is now? I know you started the year at $680 million. You made progress in Q1, you did an update on scrap and energy, but start with the $680 and update what's baked into your new guidance and maybe break down what is labor and what's commodity, please? I think labor was about $200 million of your previous forecast. Seetarama Swamy Kotagiri - Magna International Inc . - CEO & Director So I think the $ 680 million, let me break it down was the $ 530 million coming from 2022 , incremental $ 100 million plus the $ 50 million scrap . That's how we came to the $ 680 . So what we are looking at the movement in some of the commodities, energy and all the other initiatives that you were working through, we said that $ 100 million is now $ 50 million and the scrap, which was $ 50 million is now $ 25 million . Yes, I don't know if we can get into the details of how much is labor and how much is the breakdown, it gets combined in terms of all the efforts that I talked about . So it's very difficult to exactly quantify how much and where . We can say that labor is the sticky part and we continue to look at optimizing that going forward, not just from a restructuring today perspective, but as we are launching this business into ' 24 and ' 25 , how do we manage it? We have to have so much hiring . So the question is, how do you level or normalize what we have now and look at optimizing the hiring, but at the same time, protect the programs and the launches . So it's a little bit of a complex set of variables that we're going through . I don't know, Pat, if you want to add any color to that . Brian Morrison - TD Securities Equity Research - Research Analyst That's helpful . So I just wanted this 30 basis points of margin improvement, ex Veoneer . How much of that is related to inflationary impact? It looks like it could be about 10 of the basis points . Is that correct? AUGUST 04, 2023 / 12:00PM, MG.TO - Q2 2023 Magna International Inc Earnings Call 15 REFINITIV STREETEVENTS | www.refinitiv.com | Contact Us ©2023 Refinitiv. All rights reserved. Republication or redistribution of Refinitiv content, including by framing or similar means, is prohibited without the prior written consent of Refinitiv. 'Refinitiv' and the Refinitiv logo are registered trademarks of Refinitiv and its affiliated companies.

Patrick W . D . McCann - Magna International Inc . - Executive VP & CFO Yes . It's probably 10 to 13 basis points, Brian . Brian Morrison - TD Securities Equity Research - Research Analyst Okay . And then last -- I was keeping question on that underperforming BES facility, where you're making great progress . I think you said you were going to -- you're tracking to about half of the 35 basis points . I think it was $ 140 million drag last year . How much of that do you expect to recover this year? Is it still tracking half and then eliminated in 2024 ? Unidentified Company Representative That's correct . Operator If there are no further questions, I will now turn the call back to Swamy Kotagiri for closing remarks . Seetarama Swamy Kotagiri - Magna International Inc . - CEO & Director Thank you, everyone, for listening in today . As you heard from us, we are happy with the continued progress in the second quarter, but we are already looking ahead to keep our focus into the remaining part of the year and launching not just ' 23 , but ' 24 and ' 25 and keep the progress going . We look forward to providing an update on the progress of our strategy during our investor event next month . Hoping to see you all there . Have a great day . Thank you . Operator Thank you . That does conclude the conference call for today . We thank you for your participation and ask that you please disconnect your lines . DISCLAIMER Refinitiv reserves the right to make changes to documents, content, or other information on this web site without obligation to notify any person of such changes . In the conference calls upon which Event Transcripts are based, companies may make projections or other forward - looking statements regarding a variety of items . Such forward - looking statements are based upon current expectations and involve risks and uncertainties . Actual results may differ materially from those stated in any forward - looking statement based on a number of important factors and risks, which are more specifically identified in the companies' most recent SEC filings . Although the companies may indicate and believe that the assumptions underlying the forward - looking statements are reasonable, any of the assumptions could prove inaccurate or incorrect and, therefore, there can be no assurance that the results contemplated in the forward - looking statements will be realized . THE INFORMATION CONTAINED IN EVENT TRANSCRIPTS IS A TEXTUAL REPRESENTATION OF THE APPLICABLE COMPANY'S CONFERENCE CALL AND WHILE EFFORTS ARE MADE TO PROVIDE AN ACCURATE TRANSCRIPTION, THERE MAY BE MATERIAL ERRORS, OMISSIONS, OR INACCURACIES IN THE REPORTING OF THE SUBSTANCE OF THE CONFERENCE CALLS . IN NO WAY DOES REFINITIV OR THE APPLICABLE COMPANY ASSUME ANY RESPONSIBILITY FOR ANY INVESTMENT OR OTHER DECISIONS MADE BASED UPON THE INFORMATION PROVIDED ON THIS WEB SITE OR IN ANY EVENT TRANSCRIPT . USERS ARE ADVISED TO REVIEW THE APPLICABLE COMPANY'S CONFERENCE CALL ITSELF AND THE APPLICABLE COMPANY'S SEC FILINGS BEFORE MAKING ANY INVESTMENT OR OTHER DECISIONS . © 2023 , Refinitiv . All Rights Reserved . AUGUST 04, 2023 / 12:00PM, MG.TO - Q2 2023 Magna International Inc Earnings Call 16 REFINITIV STREETEVENTS | www.refinitiv.com | Contact Us ©2023 Refinitiv. All rights reserved. Republication or redistribution of Refinitiv content, including by framing or similar means, is prohibited without the prior written consent of Refinitiv. 'Refinitiv' and the Refinitiv logo are registered trademarks of Refinitiv and its affiliated companies.
Magna (NYSE:MGA)
Historical Stock Chart
Von Apr 2024 bis Mai 2024

Magna (NYSE:MGA)
Historical Stock Chart
Von Mai 2023 bis Mai 2024
