Stellar Soars 6% In Last 30 Days – Can XLM Keep On Shining This Week?
12 Oktober 2022 - 1:58PM
NEWSBTC
Since the beginning of this month, Stellar (XLM) has increased by
6%, continuing its remarkable monthly performance. Coingecko
reports a 4-day performance for XLM of 5.3%, while charts show an
impressive 31.50% rise over the previous 30 days. This price change
is even more unexpected when considered in light of this. Santiment
recently took to Twitter to reveal a rather unsettling image for
the cryptocurrency community. “There has been quite a lot of
#bloodinthestreets. Unless your portfolio mainly consists of $BNB,
$XLM, $QNT, $MKR, $HT, or other scarce positive #altcoins the past
30 days, you’re down. This reflects in the shrinking group of
individuals still interested in #cryptocurrency,” Santiment
tweeted. 📉 There has been quite a lot of #bloodinthestreets. Unless
your portfolio mainly consists of $BNB, $XLM, $QNT, $MKR, $HT, or
other scarce positive #altcoins the past 30 days, you’re down. This
reflects in the shrinking group of individuals still interested in
#cryptocurrency. pic.twitter.com/4t0GQXj9oG — Santiment
(@santimentfeed) October 10, 2022 The question of whether or not
XLM can sustain its recent gains is intriguing. In spite of this, a
rise of this magnitude is usually followed by a severe reversal as
investors’ fears replace their excitement. Related Reading: Huobi
Token Spikes Nearly 30% In Last 24 Hours As HT Seen Rising On
Revival Plans Stellar: What The Indicators Suggest There are a
number of signs to keep an eye on. And by “indicators,”
it means the CMF, momentum, and bull-bear power. These
metrics reveal the direction of the market, and the recent price
surge has not yet altered investor opinion about the token. Chart:
TradingView The money flow index of Chaikin is still heavily
bearish, although bulls are testing a breach towards the positive
top half. According to the bull-bear power indicator, bears have
lost considerable impetus. This is related to the price increase
during the past month. The momentum indicator revealed a modest
increase in bullish momentum followed by a slight decline. We may
infer that buying enthusiasm for the cryptocurrency is currently
high, but purchasers should be warned that a drop may occur in the
coming days or weeks. Slowing Down The Decline The current rise is
supported by the $0.0996 support line, which has halted the crypto
market decline from May to June. This has served as the base from
which the bulls have leveraged the current rally. Currently, the
market is still being supported by the bulls. As evidenced by
the persisting pullbacks in XLM’s price, the current price action
indicates that the correction phase is still in its infancy and
that bulls continue to rule the market. As of the time of writing,
the token is trading in the green and may rise again following
earlier pullbacks and a minor price decline. Related Reading: Why
SHIB Price Lost Its Bullish Energy After Shiba Eternity Games’
Release XLM market cap at $2.9 billion on the daily chart |
Featured image from Steemit, Source: TradingView.com
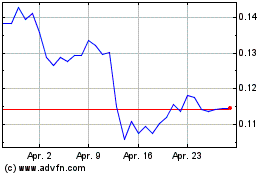
Stellar Lumens (COIN:XLMUSD)
Historical Stock Chart
Von Mär 2025 bis Apr 2025

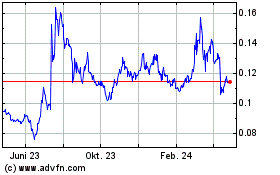
Stellar Lumens (COIN:XLMUSD)
Historical Stock Chart
Von Apr 2024 bis Apr 2025


