Cardano Might See A Massive Pump Around November 18 – Analyst Exposes 2020 Similarities
29 Oktober 2024 - 7:00PM
NEWSBTC
The crypto market is heating up, with Bitcoin on the brink of
all-time highs and anticipating a major breakout across assets.
Cardano (ADA) is also at a critical juncture, showing striking
similarities to its price action in 2020—a year that saw ADA
skyrocket by over 4,000% in under 12 months. Related Reading:
If Dogecoin Breaks Above Key Resistance ‘We Could See A 25% Rally’
– Top Analyst Renowned analyst Ali Martinez recently shared a
technical analysis comparing ADA’s current market structure to
November 2020. According to Martinez, ADA’s recent consolidation
around key levels could set the stage for a significant upward
surge, particularly following the upcoming U.S. election.
Martinez’s analysis highlights Cardano’s pattern of explosive
growth after periods of accumulation and points to the potential
for a strong rally if Bitcoin breaks new highs. Investors are now
closely watching ADA’s price movement, eager to see if it can
replicate its historic bull run. As the market prepares for a
possible shift, Cardano’s performance in the coming weeks could
offer insight into broader altcoin momentum in this cycle. The next
moves could be decisive, making ADA one to watch in the rapidly
evolving crypto landscape. Cardano Following 2020 Bullish
Pattern Cardano has captured the attention of analysts and
investors who see its current consolidation as a possible signal of
accumulation, hinting at a strong move up ahead. Well-known analyst
Ali Martinez recently shared a technical analysis on X, comparing
Cardano’s current price behavior and its pattern in 2020—a year in
which ADA experienced an extraordinary 4,000% surge.
According to Martinez, Cardano’s price action is displaying a
similar setup, suggesting the possibility of a breakout around
November 18, roughly two weeks after the U.S. elections. This
timeline aligns with historical patterns, where ADA consolidates
before explosive upward moves. Martinez’s analysis points to a
long-term bullish target of $6.30, representing a potential 2,000%
increase from current levels. He anticipates that if it
materializes, this rally could lead to a market top for Cardano
around September 2025. This prediction is based on ADA’s cyclical
price trends, where significant rallies have historically followed
periods of low volatility and accumulation, driven by market
sentiment and broader crypto adoption. Related Reading: GOAT
Outpaces PEPE Growing To $900M Market Cap In 2 Weeks – Details Many
investors are now watching ADA closely, as such a rally would not
only be significant for Cardano but could signal a broader bullish
momentum across altcoins. Cardano’s current price level has
attracted a mix of institutional and retail investors seeking
opportunities before what could be a substantial move. With
both on-chain data and technical indicators supporting a bullish
outlook, ADA’s upcoming price action may set the tone for the
altcoin market in the coming months. If history repeats, Cardano
could be primed for one of its most powerful surges, attracting new
interest and capital into the ecosystem. ADA Technical Levels
Cardano is trading at $0.346 after experiencing a clear rejection
from the 4-hour 200 exponential moving average (EMA) at $0.351.
This key level has been pivotal, as a break above it and holding it
as support would signal a potential shift toward a short-term
uptrend. For bulls aiming to regain control over ADA’s price
action, establishing a firm foothold above the 200 EMA is
essential, as it would likely attract buying interest and
strengthen upward momentum. Additionally, the $0.37 supply zone
presents another significant hurdle for ADA, as bulls have
struggled to reclaim this level since early October. This
resistance zone has repeatedly capped price action, indicating that
substantial buying pressure is necessary to break through and
sustain gains beyond this mark. A bullish trend could gain traction
if ADA breaches the 200 EMA and the $0.37 supply zone. Related
Reading: Bitcoin Short Positions Face Serious Risk Above $68,500 –
Details However, if these levels remain unclaimed, ADA’s price is
likely to continue consolidating sideways in the near term. Such a
pattern would allow the market to stabilize and potentially attract
fresh demand before attempting another breakout, though it may
delay any significant upward movement for ADA. Featured image from
Dall-E, chart from TradingView
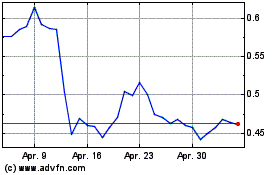
Cardano (COIN:ADAUSD)
Historical Stock Chart
Von Dez 2024 bis Jan 2025

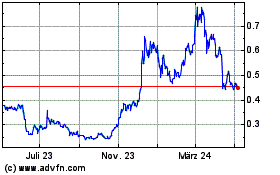
Cardano (COIN:ADAUSD)
Historical Stock Chart
Von Jan 2024 bis Jan 2025
