2Q24 Net Income at AR$17.1 billion with ROAE at
10.4%
6M24 Net Income reached AR$72.2 billion and
ROAE 22.1%
Grupo Supervielle S.A. (NYSE: SUPV; BYMA: SUPV),
(“Supervielle” or the “Company”) a universal financial services
group headquartered in Argentina with a nationwide presence, today
reported results for the three and sixth-month period ended June
30, 2024.
Starting 1Q20, the Company began reporting results applying
Hyperinflation Accounting, in accordance with IFRS rule IAS 29
(“IAS 29”) as established by the Central Bank.
Management Commentary
Commenting on second quarter 2024 results, Patricio
Supervielle, Grupo Supervielle’s Chairman & CEO, noted: “We
reported a solid performance in 2Q24. Our total loan portfolio
expanded an impressive 36% sequentially and 13% year-on-year in
real terms resulting in ROAE of 10% for the quarter and 22% for the
first half as credit demand picks up. Noteworthy, NIM was at a high
of 36% amidst the policy rate decline that significantly reduced
our funding costs and drove a decrease in asset yields. Equally
contributing to the good performance was the growth in fee income
across our banking, asset management, and online broker operations.
Furthermore, a sequential decline in expenses, indicative of our
enhanced operational efficiencies and the impact of lower inflation
rates, also contributed to our good results.
Supervielle deployed an early mover strategy that resulted in
significant share of market and loan volume growth. This strategic
move resulted in a 30 basis points (bps) market share gain
in loans in the quarter and 70 bps year-to-date.
Notably, we gained market share across all key products, including
corporate loans, personal loans, credit cards, and car loans, where
we have become the second-largest bank in auto loan origination.
Also encouraging is the good performance of our recently launched
mortgage product. Additionally, we reported a sequential increase
in the market share of US dollar-denominated deposits, while
total deposits remained relatively stable.
Asset quality remains strong, with the NPL ratio
declining further to a historic low of 0.8% in the quarter
benefiting from loan growth and stable risk. Cost of Risk declined
to 3.8% with our sustained focus on the middle-market, corporate,
payroll, and asset-backed loans as we navigate this economic
slowdown.
We are committed to attracting new clients and increasing market
share among SMEs and Corporates. We closed the quarter with
higher balances of low-cost deposits among corporate clients,
leading to increased transactional volumes as we move to become
their primary bank. Additionally, we strive to provide the best
customer experience and consistently look to solve customer pain
points. To that end, we are pleased to report continuously
improving NPS across all segments as we introduce new products and
features that enhance customers’ digital journey.
Our Digital Retail client base expanded to 65% of
total Retail customers, with 56% of transactions completed through
our App, up from 51% in the prior quarter and just 42% a year ago.
This reflects our continued effort to enhance the customer
experience while lowering the cost to serve.
Adoption at IOL, the leading online retail brokerage
platform in the country continues to resonate with customers,
with the number of active clients exceeding 500,000, further
solidifying our leading position. All key metrics posted a robust
performance, with transactions and assets under management doubling
year-on-year. Notably, assets under management increased 23% in
real terms sequentially, achieving the US$1 billion milestone while
maintaining a good level of transaction activity.
Looking ahead, the government’s focus on controlling
inflation and maintaining a fiscal surplus, as well as ongoing
deregulation across multiple sectors, is expected to boost economic
activity in various industries, underscored by the recent approval
of President Milei’s flagship reform bill “Ley Bases”. Continuing
on this path is essential for sustainable growth for both the
country and our company.
At Supervielle, we have a clear purpose: to serve the specific
needs of our target clients with top service and the best
technology. To do so, we are deploying a nimble operating model,
aligning our portfolio strategy with evolving economic indicators
while safeguarding asset quality and leveraging operational
efficiencies. We are confident that our strategic initiatives,
combined with our exposure to high-potential export-oriented
industries, including mining, agribusiness, and oil and gas,
position us well to drive significant growth for Supervielle as the
economy recovers. This is further supported by a strong CET1 ratio
above 21% concluded Mr. Supervielle.
Second quarter 2024 Highlights
PROFITABILITY
Attributable Net Income of AR$17.1 billion in 2Q24,
compared to net gains of AR$23.3 billion in 2Q23 and AR$55.1
billion in 1Q24. Net Income was AR$72.2 billion in 1H24, compared
to AR$25.8 billion in the same period of 2023.
ROAE of 10.4% in 2Q24 compared to 17.6% in 2Q23 and 33.8%
in 1Q24. This was achieved despite a sharp decline in the monetary
policy rate, which led to lower funding costs and reduced asset
yields impacting net financial income. The sequential increase in
fee income together with the decline in personnel &
administrative expenses also contributed to this result. 1H24 ROAE
reached 22.1% compared to 9.9% in 1H23. This performance was
supported by increased net financial income, improvements in
structural cost efficiencies, and a reduction in provisions.
ROAA was 2.3% in 2Q24 compared to 2.7% in 2Q23 and 7.4%
in 1Q24. 1H24 ROAA was 4.8% compared to 1.4% in 1H23.
Profit before income tax of AR$30.9 billion in 2Q24
compared to AR$33.5 billion in 2Q23 and AR$85.8 billion in 1Q24.
Profit before income tax reached AR$116.7 billion in 1H24 compared
to AR$41.3 billion in 1H23.
Net Financial Income reached AR$203.3 billion in 2Q24,
reflecting a 13.0% YoY increase but a 42.7% QoQ decline. The QoQ
performance is attributed to the declines in inflation and yields
on AR$ government securities and loans, in an environment of lower
interest rates. Average loan balances increased by 26.5% but could
not offset the impact of the decline in interest rates. This was
partially offset by a sharp decrease in the cost of funds,
benefiting from both lower market rates and decreased volumes of
interest-bearing liabilities. During 2Q24, following the new
monetary policy implemented by the government, which led to a
gradual transition from Central Bank remunerated instruments to
Government securities, average balances of Central Bank securities
decreased by 56.8%, while yields on these instruments declined from
95.7% to 59.2% following monetary policy rates. Additionally, the
yield of government securities declined from the levels registered
in 1Q24 when yields on higher volumes of inflation-linked
government securities captured the peak inflation rates of December
2023 and January 2024. Adjusted Net Financial Income (calculated as
Net Financial Income + Result from exposure to inflation) was
AR$144.3 billion in 2Q24, decreasing 5.1% YoY and 36.9% QoQ.
1H24 Net Financial Income of AR$ 557.9 billion, up 69.3% from
AR$ 329.5 billion in 1H23. Adjusted Net Financial Income was
AR$373.0 billion in 1H24, up 34.5% YoY.
Net Interest Margin (NIM) of 36.3% in a context of a
lower policy rate that significantly reduced the funding costs and
drove a decrease in asset yields. This compares to NIM of 26.6% in
2Q23 and 61.9% in 1Q24.
The total NPL ratio was 0.8% in 2Q24, improving by 170
and 30 basis points from 2.5% in 2Q23 and 1.1% in 1Q24,
respectively.
Loan loss provisions (LLPs) totaled AR$11.7 billion in
2Q24, decreasing 11.3% YoY but increasing 23.6% QoQ.
The Coverage Ratio increased to 302.9% as of June 30,
2024, from 147.9% as of June 30, 2023, and 263.7% as of March 31,
2024.
Efficiency ratio was 50.9% in 2Q24, improving from 62.5%
in 2Q23 and increasing from 34.0% in 1Q24. 1H24 Efficiency ratio
was 40.5% compared to 66.7% in 1H23.
Loans to Deposits Ratio was 59.5% as of June 30, 2024,
compared to 37.0% as of June 30, 2023, and 43.6% as of March 31,
2024. The AR$ loans to AR$ deposits ratio was 62.6% as of June 30,
2024, compared to 38.1% as of June 30, 2023, and 47.0% as of March
31, 2024.
Total Deposits amounted to AR$2,096.4 billion and
increased 160.1% YoY and 18.1% QoQ in nominal terms.
Total deposits from the private sector amounted to AR$
1,978.4 billion, increasing 177.6% YoY and 17.5% QoQ in nominal
terms compared to industry growth of 168.9% YoY and 22.2% QoQ.
In real terms, total deposits decreased 30.0% YoY and 0.4%
QoQ. Total private sector deposits decreased 0.9% QoQ and 25.3% YoY
in real terms. Foreign currency deposits (measured in US$)
amounted to US$ 375.6 million, increasing 45.3% YoY and 22.9% QoQ,
while industry FX deposits increased 15.8% YoY and 5.6% QoQ.
Total Assets increased 9.5% QoQ but declined 13.0% YoY,
to AR$ 3,340.0 billion as of June 30, 2024. Average AR$ Assets
decreased 1.5% QoQ and 17.0% YoY. The diversification of the asset
portfolio, with a gradual shift towards a larger share of
private-sector loans and a reduction in the Company’s investment
portfolio, is expected to continue throughout the remainder of
2024.
Loans expanded 318.6% YoY and 61.1% QoQ in nominal terms
to AR$1,248.2 billion. In real terms, gross loans increased 12.7%
YoY and 35.9% QoQ gaining 30 bps in market share in the quarter
(based on monthly daily average system loan balances), and 70 bps
year-to-date.
Common Equity Tier 1 Ratio (CET1) as of June 30, 2024,
was 21.3% increasing 570 bps YoY and decreasing 340 bps when
compared to the reported CET1 as of March 31, 2024. CET1 QoQ
performance reflects the expansion in Risk weighted assets
following the loan portfolio growth, the AR$19.6 billion dividend
payment made in April and the partial execution of the share
buyback program for up to AR$8 billion. These were partially offset
by the Company’s organic capital creation in 2Q24 together with
inflation adjustment of capital.
View source
version on businesswire.com: https://www.businesswire.com/news/home/20240814547334/en/
IR Grupo Supervielle
ir-gruposupervielle@gruposupervielle.com.ar
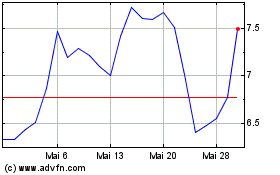
Grupo Supervielle (NYSE:SUPV)
Historical Stock Chart
Von Dez 2024 bis Jan 2025

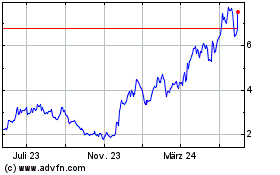
Grupo Supervielle (NYSE:SUPV)
Historical Stock Chart
Von Jan 2024 bis Jan 2025
