0001475841false00014758412024-02-122024-02-12

UNITED STATES
SECURITIES AND EXCHANGE COMMISSION
Washington, D.C. 20549

FORM 8-K

CURRENT REPORT
Pursuant to Section 13 OR 15(d) of The Securities Exchange Act of 1934

Date of Report (Date of earliest event reported): February 12, 2024

NATIONAL BANK HOLDINGS CORPORATION
(Exact name of registrant as specified in its charter)

Delaware

001-35654

27-0563799

(State or other jurisdiction
of incorporation)

(Commission
File Number)

(IRS Employer
Identification No.)

7800 East Orchard Road, Suite 300, Greenwood Village, Colorado 80111
(Address of principal executive offices) (Zip Code)

303-892-8715
(Registrant’s telephone, including area code)

Not Applicable
(Former name or former address, if changed since last report.)

Check the appropriate box below if the Form 8-K filing is intended to simultaneously satisfy the filing obligation of the registrant under any of the following provisions (see General Instruction A.2. below):

Written Communications pursuant to Rule 425 under the Securities Act (17 CFR 230.425)

Soliciting material pursuant to Rule 14a-12 under the Exchange Act (17 CFR 240.14a-12)

Pre-commencement communications pursuant to Rule 14d-2(b) under the Exchange Act (17 CFR 240.14d-2(b))

Pre-commencement communications pursuant to Rule 13e-4(c) under the Exchange Act (17 CFR 240.13e-4(c))

Securities registered pursuant to Section 12(b) of the Act:

Title of each class:


Trading Symbol


Name of each exchange on which registered:

Class A Common Stock

NBHC

NYSE

Indicate by check mark whether the registrant is an emerging growth company as defined in Rule 405 of the Securities Act of 1933(§230.405 of this chapter) or Rule 12b-2 of the Securities Exchange Act of 1934 (§240.12b-2 of this chapter).

Emerging growth company

If an emerging growth company, indicate by check mark if the registrant has elected not to use the extended transition period for complying with any new or revised financial accounting standards provided pursuant to Section 13(a) of the Exchange Act.

Item 7.01. Regulation FD Disclosure.

Representatives from National Bank Holdings Corporation (“NBHC”) intend to use the materials filed herewith in one or more meetings with investors and analysts from time to time. NBHC also intends to make the materials available on its website (http://www.nationalbankholdings.com). NBHC is furnishing the slides as Exhibit 99.1 to this Current Report on Form 8-K.

The information contained in this Item 7.01 and the exhibit referenced herein are being “furnished” and shall not be deemed “filed” for purposes of Section 18 of the Exchange Act of 1934, nor shall they be deemed incorporated by reference in any filing under the Securities Act of 1933 or the Exchange Act of 1934.

Cautionary Statements Regarding Forward-Looking Information

This Current Report on Form 8-K and the exhibit filed herewith contain forward-looking statements. Any statements about NBHC’s expectations, beliefs, plans, predictions, forecasts, objectives, assumptions or future events or performance are not historical facts and may be forward-looking. These statements are only predictions and involve estimates, known and unknown risks, assumptions and uncertainties. NBHC’s actual results could differ materially from those expressed in or contemplated by such forward-looking statements as a result of a variety of factors, some of which are more fully described in the exhibit hereto and in NBHC’s filings with the Securities and Exchange Commission. You are cautioned not to place undue reliance on such statements. Any forward-looking statement speaks only as of the date on which it is made, and NBHC undertakes no obligation to update any forward-looking statement to reflect events or circumstances after the date on which the statement is made or to reflect the occurrence of unanticipated events or circumstances, except as required by applicable law.

Item 9.01. Financial Statements and Exhibits.

(d) Exhibits

Exhibit No.


Description of Exhibit

99.1

National Bank Holdings Corporation Investor Presentation

104

Cover Page Interactive Data File – The cover page XBRL tags are embedded within the inline XBRL document.

SIGNATURE

Pursuant to the requirements of the Securities Exchange Act of 1934, the registrant has duly caused this report to be signed on its behalf by the undersigned hereunto duly authorized.

National Bank Holdings Corporation

By:  

/s/ Angela N. Petrucci

Name: Angela N. Petrucci

Title: Chief Administrative Officer & General Counsel

Date: February 12, 2024

Exhibit 99.1

GRAPHIC

Investor Presentation Q4 – 2023

GRAPHIC

Forward-Looking Statements This presentation contains “forward-looking statements” within the meaning of the Private Securities Litigation Reform Act of 1995. Forward-looking statements contain words such as “anticipate,” “believe,” “can,” “would,” “should,” “could,” “may,” “predict,” “seek,” “potential,” “will,” “estimate,” “target,” “plan,” “project,” “continuing,” “ongoing,” “expect,” “intend” or similar expressions that relate to the Company’s strategy, plans or intentions. Forward-looking statements involve certain important risks, uncertainties and other factors, any of which could cause actual results to differ materially from those in such statements. Such factors include, without limitation, the “Risk Factors” referenced in our most recent Form 10-K filed with the Securities and Exchange Commission (SEC), other risks and uncertainties listed from time to time in our reports and documents filed with the SEC, and the following factors: difficulties in integrating the NBHC, Community Bancorporation, Bancshares of Jackson Hole Incorporated, or Cambr Solutions, LLC businesses or fully realizing cost savings and other benefits; business disruption following the mergers; ability to execute our business strategy (including our digital strategy); business and economic conditions; effects of any potential government shutdowns; economic, market, operational, liquidity, credit and interest rate risks associated with the Company’s business; effects of any changes in trade, monetary and fiscal policies and laws; changes imposed by regulatory agencies to increase capital standards; effects of inflation, as well as, interest rate, securities market and monetary supply fluctuations; changes in the economy or supply-demand imbalances affecting local real estate values; changes in consumer spending, borrowings and savings habits; with respect to our mortgage business, the inability to negotiate fees with investors for the purchase of our loans or our obligation to indemnify purchasers or repurchase related loans; the Company’s ability to identify potential candidates for, consummate, integrate and realize operating efficiencies from, acquisitions, consolidations and other expansion opportunities; the Company's ability to realize anticipated benefits from enhancements or updates to its core operating systems from time to time without significant change in client service or risk to the Company's control environment; the Company's dependence on information technology and telecommunications systems of third-party service providers and the risk of systems failures, interruptions or breaches of security; the Company’s ability to achieve organic loan and deposit growth and the composition of such growth; changes in sources and uses of funds; increased competition in the financial services industry; the effect of changes in accounting policies and practices; the share price of the Company’s stock; the Company's ability to realize deferred tax assets or the need for a valuation allowance; the effects of tax legislation, including the potential of future increases to prevailing tax rules, or challenges to our positions; continued consolidation in the financial services industry; ability to maintain or increase market share and control expenses; costs and effects of changes in laws and regulations and of other legal and regulatory developments; technological changes; the timely development and acceptance of new products and services, including in the digital technology space our digital solution 2UniFi; the Company’s continued ability to attract, hire and maintain qualified personnel; ability to implement and/or improve operational management and other internal risk controls and processes and reporting system and procedures; regulatory limitations on dividends from our bank subsidiaries; changes in estimates of future credit reserve requirements based upon the periodic review thereof under relevant regulatory and accounting requirements; widespread natural and other disasters, pandemics, dislocations, political instability, acts of war or terrorist activities, cyberattacks or international hostilities; a cybersecurity incident, data breach or a failure of a key information technology system; impact of reputational risk; and success at managing the risks involved in the foregoing items. The Company can give no assurance that any goal or plan or expectation set forth in forward-looking statements can be achieved and readers are cautioned not to place undue reliance on such statements. The forward-looking statements are made as of the date of this press release, and the Company does not intend, and assumes no obligation, to update any forward-looking statement to reflect events or circumstances after the date on which the statement is made or to reflect the occurrence of unanticipated events or circumstances, except as required by applicable law. Further Information: This presentation should be read together with “Management’s Discussion and Analysis of Financial Condition and Results of Operations” and the consolidated financial statements and the related notes thereto included in our Form 10-K and quarterly reports 2

GRAPHIC

About Non-GAAP Financial Measures Certain of the financial measures and ratios we present, including “tangible assets,” “return on average tangible assets,” “tangible common equity,” “return on average tangible common equity,” “tangible common book value per share,” “tangible common equity to tangible assets,” “adjusted non-interest expense,” “efficiency ratio adjusted for other intangible asset amortization and acquisition-related expenses,” “adjusted net income,” “adjusted earnings per share – diluted,” “net income adjusted for the impact of other intangible asset amortization expense and acquisition-related expenses, after tax,” “adjusted return on average tangible assets,” “adjusted return on average tangible common equity,” “pre-provision net revenue,” “pre-provision net revenue adjusted for acquisition-related expenses,” and “fully taxable equivalent” metrics, are supplemental measures that are not required by, nor presented in accordance with, U.S. generally accepted accounting principles (GAAP). We refer to these financial measures and ratios as “non-GAAP financial measures.” We consider the use of select non-GAAP financial measures and ratios to be useful for financial and operational decision making and useful in evaluating period-to-period comparisons. We believe that these non-GAAP financial measures provide meaningful supplemental information regarding our performance by excluding certain expenditures or assets that we believe are not indicative of our primary business operating results or by presenting certain metrics on a fully taxable equivalent basis. We believe that management and investors benefit from referring to these non-GAAP financial measures in assessing our performance and when planning, forecasting, analyzing and comparing past, present and future periods. These non-GAAP financial measures should not be considered a substitute for financial information presented in accordance with GAAP and you should not rely on non-GAAP financial measures alone as measures of our performance. The non-GAAP financial measures we present may differ from non-GAAP financial measures used by our peers or other companies. We compensate for these limitations by providing the equivalent GAAP measures whenever we present the non-GAAP financial measures and by including a reconciliation of the impact of the components adjusted for in the non-GAAP financial measure so that both measures and the individual components may be considered when analyzing our performance. A reconciliation of non-GAAP financial measures to the comparable GAAP financial measures is included in the appendix. 3

GRAPHIC

Table of Contents Financial Performance 08 Credit 14 Balance Sheet 19 Management Team 24 Corporate Governance Overview 27 Appendix 34

GRAPHIC

(1)As of December 31, 2023. Includes one banking center shared by NBH Bank and BOJH Trust. (2)Represents a non-GAAP financial measure. See Appendix for a reconciliation of these measures. (3)Excluding other intangible asset amortization Attractive Markets Company Highlights Headquarters Denver, CO Banking Centers(1) 94 Listing NYSE: NBHC 37 banking centers ‒Front Range contributed 95% of Colorado’s population growth between 2010 and 2020 (1) ‒#3 Best Economy in the U.S. (U.S. News 2023) ‒#4 on America's Top States for Business (CNBC 2022) 14 banking centers across Utah, New Mexico, and Idaho 2 commercial banking locations in Texas ‒Utah: #1 in Top Housing Markets Ranking (Realtor.com 2021) ‒Utah: #1 Best Economy in the U.S. (U.S. News 2023) ‒Utah: #8 on America's Top States for Business (CNBC 2022) ‒Texas: #8 Best Economy in the U.S. (U.S. News 2023) 32 banking centers ‒Overland Park, KS - central hub for the #1 county in Kansas by household income and projected population growth(2) ‒Overland Park, KS #7 on “2023 Top 100 Best Places to Live” (Livability 2023) ‒Kansas City, MO #7 on Zillow’s hottest housing markets for 2023 (Zillow 2023) ‒Kansas City, MO #10 Best City for Startups (Kansas City Business Journal 2022) (1)Colorado State Demography Office – “Colorado’s 2020 Population & Economic Overview” (2)Ranking based on aggregate population growth for 2019-2024 (3)Includes one banking center shared by NBH Bank and BOJH Trust Balance Sheet 2023 Total Assets (mm) $9,951 Total Loans (mm) $7,699 Total Deposits (mm) $8,190 Key Ratios 2023 Common Equity Tier 1 11.89% Tier 1 Leverage 9.74% ROATA(2) 1.57% ROATCE(2) 18.23% Net Interest Margin FTE(2) 4.08% ACL / Loans 1.27% Efficiency Ratio FTE(2)(3) 54.31% 9 banking centers(3) ‒Wyoming: #1 in State Business Tax Climate Index (Tax Foundation 2023) ‒Wyoming: #1 Tax Friendly state for middle income families (Kiplinger 2022) 5

GRAPHIC

Recent Recognition Strong Balance  Sheet Robust Profitability Positioned in  Attractive Markets  Premium Valuation #4 and #9 Boulder, CO and Colorado Springs, CO Market Presence in Top 10 Best Places to Live(1) #4 Colorado Market Share (Among Local Banks)(2) #6 Kansas City, MO-KS MSA Market Share (Among Local Banks)(2) Consistently Regarded as a  Top Tier Bank #93  Best Small Regional Banks #9 #92 on Fortune’s Fastest Growing Companies list & #93 in total value creation (Fortune 2021) 2023 Most Impactful 7a Lender in Colorado(3) 2023 Largest 504 Lender in Utah(4) Sources: S&P Global Market Intelligence (1)U.S. News, published 5/23/2023 (2)Deposit data as of 6/30/2023. Figures include banks headquartered in respective state (3)US Small Business Administration Colorado District Office (4)US Small Business Administration Utah District Office 6

GRAPHIC

(20%) (10%) 0% 10% 20% 30% 40% Baseline NBH Outperformance
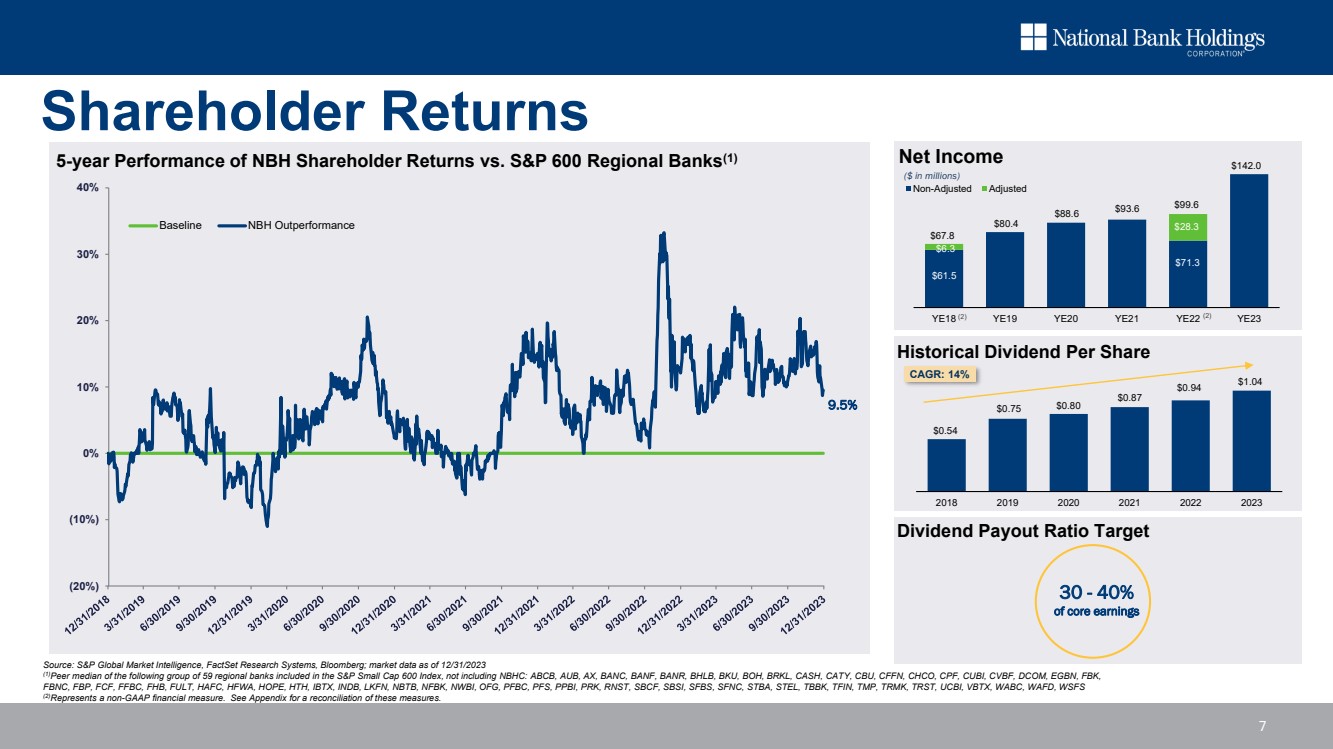
 $0.54 $0.75 $0.80 $0.87 $0.94 $1.04 2018 2019 2020 2021 2022 2023 Shareholder Returns Source: S&P Global Market Intelligence, FactSet Research Systems, Bloomberg; market data as of 12/31/2023 (1)Peer median of the following group of 59 regional banks included in the S&P Small Cap 600 Index, not including NBHC: ABCB, AUB, AX, BANC, BANF, BANR, BHLB, BKU, BOH, BRKL, CASH, CATY, CBU, CFFN, CHCO, CPF, CUBI, CVBF, DCOM, EGBN, FBK, FBNC, FBP, FCF, FFBC, FHB, FULT, HAFC, HFWA, HOPE, HTH, IBTX, INDB, LKFN, NBTB, NFBK, NWBI, OFG, PFBC, PFS, PPBI, PRK, RNST, SBCF, SBSI, SFBS, SFNC, STBA, STEL, TBBK, TFIN, TMP, TRMK, TRST, UCBI, VBTX, WABC, WAFD, WSFS (2)Represents a non-GAAP financial measure. See Appendix for a reconciliation of these measures. 5-year Performance of NBH Shareholder Returns vs. S&P 600 Regional Banks(1) Historical Dividend Per Share Dividend Payout Ratio Target 30 - 40% of core earnings CAGR: 14% 9.5% $80.4 $28.3 $142.0 YE18 YE19 YE20 YE21 YE22 YE23 Net Income Non-Adjusted Adjusted ($ in millions) $88.6 $93.6 $61.5 $67.8 (2) $6.3 $71.3 $99.6 (2) 7

GRAPHIC

Financial Performance

GRAPHIC

Deposits Approximately 67% FDIC insured deposits Capital Ratios 11.9% Common Equity Tier 1 Ratio Q4 2023 Financial Highlights (1)Represents a non-GAAP financial measure. See Appendix for a reconciliation of these measures. (2)Excluding other intangible asset amortization  YTD net income increased 42.7% to $142.0 million, or $3.72 per diluted share, over the prior year, adjusting for acquisition-related expenses in 2022  The fully taxable equivalent net interest margin was 3.95%. Total deposit beta to date in the current rate cycle is 34%  Strong capital with tangible common equity to tangible assets ratio of 8.96% and tier 1 leverage ratio of 9.74%  Grew tangible book value 10.4% over prior year  Cash/investment securities portfolio with an average duration of 4.1 years  Total loans increased $220.3 million or 11.7% annualized to $7.7 billion, over 3Q23  Generated quarterly loan fundings totaling $460.4 million with a weighted average new loan origination rate of 8.6%  Maintained excellent credit quality with two basis points of annualized quarterly net charge-offs Expense 56.0% efficiency ratio FTE(1)(2) ACL / Loans 1.27% Loan Growth Loans outstanding of $7.7 billion Net Income $33.1 million 3.95% Net interest margin FTE(1) 9

GRAPHIC

Profitable Steady Growth $80.4 $28.3 $142.0 YE17 YE18 YE19 YE20 YE21 YE22 YE23 Net Income Non-Adjusted Adjusted $2.55 $3.01 $0.87 $3.72 YE17 YE18 YE19 YE20 YE21 YE22 YE23 EPS (Fully Diluted) Non-Adjusted Adjusted ($ in millions) 0.38% 1.15% 1.42% 1.44% 1.37% 0.95% 1.57% 0.82% 1.26% 1.32% YE17 YE18 YE19 YE20 YE21 YE22 YE23 ROATA(1) Non-Adjusted Adjusted 71.4% 69.4% 61.6% 60.9% 63.4% 62.2% 56.0% 67.2% 68.6% 61.1% 60.6% 63.0% 57.1% 54.3% YE17 YE18 YE19 YE20 YE21 YE22 YE23 Efficiency Ratio FTE(1) Non-Adjusted Excluding other intangible asset amortization $54.7 $83.4 $112.9 $132.1 $110.8 $143.5 $190.0 YE17 YE18 YE19 YE20 YE21 YE22 YE23 Pre-Provision Net Revenue FTE(1) ($ in millions) $88.6 $2.85 3.61% 11.60% 13.07% 13.27% 12.87% 9.91% 18.23% 7.75% 12.76% 13.75% YE17 YE18 YE19 YE20 YE21 YE22 YE23 ROATCE(1) Non-Adjusted Adjusted $93.6 $20.4 $14.6 $35.0 $61.5 $67.8 (1) (1) $1.26 $0.73 $2.16 $0.53 $1.95 $0.21 (1) (1) (1) (1) (1)Represents a non-GAAP financial measure. See Appendix for a reconciliation of these measures. (1) (1) (1) (1) $6.3 $3.05 $2.18 (1) $71.3 $99.6 (1) $128.4 $15.1 (1) 10

GRAPHIC

Growth Trends $4.8 $5.7 $5.9 $6.7 $7.2 $9.6 $9.9 YE17 YE18 YE19 YE20 YE21 YE22 YE23 Total Assets $3.2 $4.1 $4.4 $4.2 $7.2 $7.7 $0.2 YE17 YE18 YE19 YE20 YE21 YE22 YE23 Total Loans Non-PPP Loans PPP Loans $482.0 $577.4 $651.4 $707.3 $728.8 $776.0 $860.3 YE17 YE18 YE19 YE20 YE21 YE22 YE23 ($ in billions) ($ in billions) ($ in millions) Tangible Common Equity(3) (1) Includes $2.3 billion of total assets added through the Rock Canyon Bank and Bank of Jackson Hole acquisitions in 2022. (2)Includes $1.7 billion of loans added through the Rock Canyon Bank and Bank of Jackson Hole acquisitions in 2022. (3)Represents a non-GAAP financial measure. See Appendix for a reconciliation of these measures. $4.4 $4.5 (2) (1) 11

GRAPHIC

Trust and Wealth Partners  Trust and Wealth Management solution tailored to high net worth individuals  Scalable Private Wealth team provides a broad range of financial and retirement planning solutions, creating an opportunity to further leverage the platform to new and existing NBH clients  Established relationships with strong investment and research partners drives ability to cross-sell  Fee income drives revenue diversification and attractive recurring earnings 325+ High Net Worth Clients $860mm+ AUM 12

GRAPHIC

Regulatory Capital TIER 1 LEVERAGE 9.7% COMMON EQUITY TIER 1 RISK-BASED 11.9% TIER 1 RISK-BASED 11.9% TOTAL RISK-BASED 13.8% TANGIBLE COMMON EQUITY TO TANGIBLE ASSETS(1) 9.0% Capital Ratios – 4Q23 (1)Represents a non-GAAP financial measure. See Appendix for a reconciliation of these measures.  $387 million in excess capital over 7.0% common equity tier 1 risk-based regulatory requirement  Double-leverage ratio of 93.9%  Holding company cash reserves of $78 million 13

GRAPHIC

Credit

GRAPHIC

Uniquely Diversified $7.7 Billion Loan Portfolio Concentrations  Self-imposed concentration limits ensure a granular and diverse loan portfolio and protect against downside risk to any particular industry or real estate sector  Individual industry sectors are limited to no more than 15% of total loan commitments, with the majority being 10% or less  Non owner-occupied CRE is 170% of risk-based capital and no specific property type exceeds 6%  New commercial loans originated YTD: - Average funding of $1.4 million - Weighted average commitment, including unused, of $1.8 million  Residential loans originated YTD: - Average funding of $321 thousand - Average FICO of 770 - Average LTV of 72%  Top 25 originated relationships as of December 2023: - Average funded balance of $21 million - Average commitment of $31 million Granular and Well-Diversified Loan Portfolio 3% 4% Consumer 18% Non Owner-Occupied CRE 24% C&I and Owner Occupied CRE 58% 15 10% 6% 5% 4% 3% 3% 3% 2% 2% 2% 1% 1% 1% 1% 14% 6% 4% 4% 3% 2% 1% 4% 16% 1% 1%

GRAPHIC

Granular CRE Portfolio Hotel & Lodging 25% Multifamily 17% CML Const. 17% Retail 8% Warehouse & Ind. 7% All Other 8% CML A & D 4% Office 5% Nursing Home 4% 1-4 Family Const. 5%  Office: - Average LTV of 48.5% - 1.3% of total loans  Retail: - Average LTV of 59.1% - 2.0% of total loans  Multi-Family: - Average LTV of 50.5% - 4.1% of total loans Non-Owner Occupied CRE Non-Owner Occupied CRE Portfolio Characteristics 16

GRAPHIC

Strong Credit Quality History YE20 YE21 YE22 YE23 Loan charge-offs 0.34% 0.16% 0.17% 0.34% 0.15% 0.09% 0.06% 0.03% 0.11% 0.15% 0.05% 0.0… YE20* YE21* YE22 YE23 Non-performing loans Acquired non-performing loans OREO Non-performing Loans Non-performing Asset Composition Net Charge-Offs(1) Total Classified Loans 0.60%* (1)As a % of average total loans $20 $11 $17 $28 0.47% / 0.49%* 0.24% 0.23% 0.37% YE20 YE21 YE22 YE23 Non-performing loans Non-performing loans as a % of total loans 0.06% * Excludes PPP loans 0.40%* * Excludes PPP loans. Non-performing assets to total loans and OREO totaled 0.58% and 0.39% for YE20 and YE21, respectively 0.28% 0.03% ($ in millions) 0.03% 0.42% $50 $29 $23 $52 1.2% 0.7% 0.6% 0.7% YE20 YE21 YE22 YE23 Classified loans % of total loans $17 $40 Acquired loans $16 $68 0.02% 17

GRAPHIC

Credit Loss Protection $98.0 Total Loan Loss Coverage Including Loan Marks 1.63%(1) ACL/Total Loans 1.27% Loan Marks/Total Loans 0.36%(1) $27.3 $125.3 All dollars in millions (1)Represents a non-GAAP financial measure ACL 12/31/2023 Loan Marks 12/31/2023 TOTAL 12/31/2023 18

GRAPHIC

Balance Sheet

GRAPHIC

 Portfolio built on a relationship-banking strategy, with emphasis on depository and treasury management relationships  Self-imposed concentration limits; majority of industry sectors limited to 10% or less of total loan commitments  Industries requiring in-depth knowledge are managed by specialty banking teams, with dedicated specialist underwriters  New loan fundings over the trailing twelve months totaled a $1.5 billion, led by commercial loan fundings of $0.9 billion  Generated quarterly loan fundings totaling $460.4 million with a weighted average new loan origination rate of 8.6% FY17 FY18 FY19 FY20 FY21 FY22 FY23 (1)Excludes loans held-for-sale $0.9 $1.2 $1.2 $1.2 $1.5 Owner Occupied AG 19% Non-Owner Occupied CRE 24% Resi Mortgage Other Consumer 17% <1% C & I 40% Loan Composition ($7.7 Billion) Quarterly Loan Fundings ($ in millions) Total Loan Fundings(1) ($ in billions) Solid Loan Growth $497.3 $393.9 $362.3 $324.1 $460.4 4Q22 1Q23 2Q23 3Q23 4Q23 $2.0 TTM: Trailing Twelve Months $1.5 20

GRAPHIC

6.2% 10.0% 0.2% 83.6% Cash U.S. Treasury Other U.S. Agency Mortgage/Sponsored Debt High Quality Liquidity Portfolio: $1.2 Billion  Liquidity portfolio duration of 4.1 years  Portfolio used exclusively as an on-balance sheet source of liquidity:  34% unencumbered  57% pledged directly to client deposits or repo  9% pledged to Fed discount window  No credit risk exists given 99.8% of investment portfolio is U.S. agency/sponsored agency and U.S. Treasury backed $1.2 Billion Liquidity Portfolio(1) (1)Represents market value as of December 31, 2023, regardless of AFS/HTM designation. Excludes investments made under equity accounting method. 21

GRAPHIC

Granular Deposit Base  No exposure to venture capital or crypto deposits  Average total deposits increased $47.0 million, or 2.3% annualized, to $8.1 billion during 4Q23  Average total deposits increased $1.3 billion, or 18.7%, to $8.0 billion during 2023  The mix of transaction deposits to total deposits was 88.0%  Total deposit beta to date in the current rate cycle is 34% Low Cost Deposits ($ in billions) $4.2 $5.1 $5.9 $7.0 $1.0 $0.9 $0.8 $1.0 YE20 YE21 YE22 YE23 Average Transaction Deposits Average Time Deposits 47% 50% 51% 47% 36% 37% 37% 41% 14% 11% 9% 8% 3% 2% 3% 4% $5.7 $6.2 0% 50% 100% YE20 YE21 YE22 YE23 Demand & NOW Savings & MM CDs < $250k CDs >= $250k Total 83% Non-Time 87% Non-Time 88% Non-Time 88% Non-Time 0.25% 0.25% 4.50% 5.50% 0.27% 0.12% 0.26% 0.45% 1.26% 0.23% 0.33% 1.37% FY20 FY21 FY22 FY23 Fed Funds rate Cost of transaction deposits Cost of deposits Low Cost Transaction Deposits $7.9 Growing Low Cost Transaction Accounts Deposit Composition $8.2 22

GRAPHIC

Relationship Focused Deposit Base: $8.2 Billion  Approximately 67% FDIC insured  Granular deposit base: - Average deposit balance on full relationship basis just $50 thousand - Average deposit per account $27 thousand  Approximately $0.6 billion of deposits collateralized  No concentrations to any industry, sector or geography  No venture capital or crypto deposits 3% Deposit Composition4% Time Deposits 12% Savings & Money Market Deposits 41% Non-interest bearing DDA 29% Interest bearing DDA Transaction 18% Accounts 47% 23

GRAPHIC

Management Team

GRAPHIC

Experienced Management Team Nicole Van Denabeele EVP, Chief Accounting Officer and President, Bank Midwest • 20+ years of financial services experience • Controller at Polsinelli, PC • Senior Vice President, Assistant Controller at UMB Financial Corporation • Started career in public accounting at Deloitte, LLP Christopher Randall EVP, Commercial, Specialty and Business Banking • 25+ years of banking experience • Previously Senior Managing Director, Specialty Banking since 2013 • Director and Founder of CoBiz Structured Finance • Executive of Marquette Financial Companies Ruth Stevenson EVP, Chief Client Executive, Deposit Operations Executive and Regional President • 45+ years of financial services experience • Served in a number of roles with Peoples Bank over an 18-year period • Worked in a variety of roles, including President of a community bank, Director of Retail, Director of a mortgage division and Operations Manager for a Brendan Zahl mortgage division EVP, Personal, Private and Residential Banking • 20+ years of banking experience • Retail, Commercial Deposit and Lending Management at Peoples National Bank; served as Peoples National Bank CEO from 2012-2017 • Progressive leadership growth during 10-year tenure at FirstBank Tim Laney Chairman, President & CEO (42 years in banking) • Head of Business Services at Regions Financial, where he also led the transformation of wholesale lines of business • Senior management roles in small business, commercial banking, private banking, corporate marketing and change management and Management Operating Committee member at Bank of America; also served as President, Bank of America, Florida Richard Newfield Chief Risk Management Officer (39 years in banking) • Head of Business Services Credit at Regions Financial • Senior roles in risk management, credit, commercial banking, global bank debt and corporate marketing at Bank of America Aldis Birkans Chief Financial Officer (25 years in financial industry) • Senior Vice President, Treasurer at NBHC • Vice President, Assistant Treasurer at M&I Bank • Senior Vice President, Corporate and Investment Bank Treasury at Citigroup Angela Petrucci Chief Administrative Officer & General Counsel (22 years in legal and banking) • Senior Vice President, General Counsel at NBH Bank • In House Counsel at Accenture and an associate at Chapman and Cutler LLP • Started career as a commercial banker at First Chicago Bank (now JP Morgan Chase) Valerie Kramer EVP, Chief Digital Officer • 20+ years of financial services experience • Served in multiple Treasury Management and Client Solution roles with NBH Bank, including Treasury Management Director, over a 13-year period 25

GRAPHIC

Management & Directors Beneficial Ownership (as of 12/31/23) 26 (1) Includes unvested restricted shares for which the director or officer has voting power and shares issuable upon the exercise of options as well as indirect ownership. Does not include unvested performance stock units. (2) Calculated in accordance with Item 403 of Regulation S-K, and based on 37,784,851 shares of Class A common stock outstanding and entitled to vote and 240,584 shares of unvested restricted stock entitled to vote. NBHC MANAGEMENT & DIRECTORS BENEFICIAL OWNERSHIP(1) PERCENT OF CLASS(2) G. Timothy Laney 507,739 1.33% Aldis Birkans 81,646 0.21% Richard U. Newfield, Jr. 188,216 0.49% Angela Petrucci 24,115 0.06% Ralph W. Clermont 89,162 0.23% Robert E. Dean 32,020 0.08% Alka Gupta 6,885 0.02% Fred J. Joseph 21,329 0.06% Patrick Sobers 36,582 0.10% Micho F. Spring 38,256 0.10% Art Zeile 17,378 0.05% All current NBHC management and directors as a group (14 persons) 1,173,525 3.06%

GRAPHIC

Corporate Governance

GRAPHIC

Best Practices In Governance and Compensation NBHC’s corporate governance policies and executive compensation practices support our business and align with best practices 28 Corporate Governance  Lead Independent Director with robust role and responsibilities  Majority independent Board  No short-selling, hedging, or pledging of NBHC shares (applies to all NBHC and NBH Bank insiders)  Annual election of Board members and say-on-pay vote  Fully independent Audit & Risk, Compensation, and Nominating & Governance Committees  Annual Director and Committee evaluation process  Board-adopted Code of Conduct that applies to all directors, officers, and employees  Published Corporate Governance Guidelines Executive Compensation  Provide the majority of compensation in the form of variable, performance-based elements  Ensure a strong link between financial and operational goals, shareholder value creation, and executive compensation  Conduct shareholder engagement on compensation- and governance-related issues, and respond to shareholder feedback as appropriate  Enforce stock ownership guidelines for executives (5x base salary for CEO and 4/2x base salary for other NEOs) and non-employee directors (5x annual Board cash retainer)  Provide for a clawback of incentive compensation in the event of a material restatement of financial or operating results  Impose a double-trigger change-in-control requirement before vesting of outstanding, unvested equity awards is accelerated  Use an independent compensation consultant  Conduct annual risk assessment of compensation program  Annual say-on-pay vote

GRAPHIC

Fred J. Joseph  Financial services regulator for 30 years as the Banking and Securities Commissioner for the State of Colorado  Member of the Investor Issues Committee for FINRA A N I Compensation Independent Governance & Nominating Committee Chair Audit & Risk Appointed within the last five years G. Timothy Laney  President, CEO and Chairman  Former Sr Executive VP & Head of Business Services at Regions Financial  24-year tenure at Bank of America, and a member of Bank of America’s Management Operating Committee C N * I Robust Lead Director Responsibilities  Mr. Clermont presides at all Board meetings where the Chairman is not present and at all executive sessions of independent Directors  Acts as liaison between Chairman and independent Directors  Reviews and approves Board meeting agendas and information presented to Board  Engages with major shareholders as needed  As the independent Lead Director, Mr. Clermont is an ex officio member of all Board committees with full voting rights NBHC Board of Directors A Art Zeile  Current CEO of DHI Group  Extensive experience in software, telecommunications, internet, datacenter and security technologies, with a particular focus on cybersecurity  Began career as an Officer in the U.S. Air Force Patrick Sobers  30+ years of financial services experience  10 years with NBH Bank (Former EVP, Head of Business and Consumer Banking)  Member of NBH Bank’s board of directors since 2017  Several leadership positions at Bank of America, including Southeast Region’s Consumer Banking Executive Ralph W. Clermont  Lead Independent Director  Former Managing Partner of KPMG, St. Louis office  39+ years of banking and audit experience A* C N I Robert E. Dean  Former Senior Managing Director of Ernst & Young Corporate Finance  Practiced corporate, banking and securities law with Gibson, Dunn & Crutcher A C N * I A C I Micho F. Spring  Former chair of Global Corporate Practice at Weber Shandwick  Formerly CEO of Boston Telecommunications Company  Served four years as Deputy Mayor of Boston Alka Gupta A A N I  Fortune 500 executive and tech entrepreneur with deep experience in digital transformation  Currently a Venture Partner at Fin Venture Capital  Co-Founder of and former President at GlobaliD, Inc. C I * 29

GRAPHIC

NBHC Board Represents a Diverse Range of Qualifications and Skills 5 4 8 7 6 8 3 3 3 2 CEO or President of Private or Public Company Other Public Board Experience Financial or Audit Background Financial Services Industry Marketing or Sales Background Community or Governmental Service Legal or Regulatory Experience IT, Cyber, or Fintech Background Racial or Ethnic Diversity Gender Diversity Experience or Expertise Number of Directors Experienced leaders capable of overseeing execution and challenging management Critical industry knowledge and involvement in local communities Critical to overseeing management’s execution of strategy Diversity 30

GRAPHIC

Board’s Role in Oversight of Risk The Board is actively engaged in NBHC’s risk management. 31 Robust Risk Oversight at Board Level Risk Board Oversight Actions Cybersecurity Evolving nature and complexity of the threats from organized cybercriminals and hackers NBHC Audit and Risk Committee is responsible for oversight of the Company’s operational (including cybersecurity) and reputational risks Employs detection and response mechanisms designed to contain and mitigate security incidents Human Capital/Diversity Stagnant, poorly diversified boards are not only concerning to shareholders, but are also viewed unfavorably by proxy advisers such as ISS and Glass Lewis NBHC Nominating and Governance Committee considers diversity in its assessment of potential nominees to the Board In 2021, the NBHC Board appointed two new diverse candidates to the Board. In addition, the Bank Board is also diverse in terms of experience, race and gender Market/Credit Risk NBH’s business is highly susceptible to credit risk and market fluctuations in the value of real estate and other collateral NBHC Audit and Risk Committee is responsible for the oversight of the Company’s market, credit and liquidity risk Implements strict credit concentration limits by industry and real estate type, requires credit decisions to be made independent of bankers and line management, regularly reviews detailed credit reporting, including risk mitigation trends, and oversees credit stress testing twice a year. Adopts and oversees comprehensive liquidity and market risk policies Compensation Misalignment between the compensation program and business strategy can result in substantial risk for the Company and its shareholders NBHC Compensation Committee oversees compensation risk to identify any practices that present unacceptable risk to NBH Conducts annual risk assessment of compensation program

GRAPHIC

Executive Compensation Program NBH’s executive compensation practices align management incentives with long-term shareholder interests Components of Executive Compensation (2022) 2022 Compensation Breakdown Additional Compensation Features Compensation Metrics Tied to Long-Term Strategy CEO Other NEOs At Risk At Risk: 74% At Risk: 65% (1) Corporate measures apply to compensation of CEO, CFO, CRMO, and CAO; as a bank business line EVP, NEO Randall’s Annual Cash Incentive Award is based on the following measures: Core Net Income (5.0%), Asset Quality (5.0%), ERM & ESG (5.0%), Line of Business Specific Metrics (70%) and Qualitative (15%). Long Term Incentive Award 33% Annual Cash Incentive Award 41% Base Salary 26% Long-Term Incentive Award 31% Annual Cash Incentive Reward 34% Base Salary 35% 32 Component Metrics Base Salary (Cash)  Reviewed annually Annual Cash Incentive Award (At-Risk Cash)  2022 Corporate Measures(1):  Core Net Income (40%)  Asset Quality (30%)  Enterprise Risk Management (15%)  Qualitative (15%) Long-Term Incentive Award (PSUs, Options & Restricted Stock)  3-year Cumulative Adjusted EPS  3-year Relative TSR Link to Strategy  Among other things, attract and retain executives capable of driving achievement of the Company’s strategic objectives  Ensure the goals and interests of management are aligned with those of our shareholders, clients, and communities we serve  Balance compensation to reward both short-term results and the strategic decisions and actions necessary to run a sustainable business and create long-term value  Motivate executives to deliver a high level of performance and achieve strategic goals within clear and acceptable risk parameters  Attract and retain highly qualified executives through a balance of cash and equity compensation  Financial metrics and relative targets established are a reflection of what Compensation Committee deems important to align the NEO’s performance with the achievement of the Company’s strategic goals and key long-term financial targets  Evaluate executive compensation and Company performance relative to peers  Stock Ownership Guidelines:  CEO: 5x base salary  NEOs: CFO (4x base salary), CRMO and CAO (2x base salary)  Clawback policy for NEOs  Usage of an independent compensation consultant (F.W. Cook)  Frequent outreach to shareholders  Greater emphasis on “at risk” pay since 2014

GRAPHIC

Environmental, Social and Governance (ESG) Matters NBH’s long-standing commitment to ESG in all of its business activities 33 Environmental  Committed to using environmentally friendly office products and materials and optimizing our office and banking center space.  Continued investment in our mobile and digital platforms, resulting in a reduction in paper and fuel emissions.  Providing financing for green and sustainable businesses and actively exploring opportunities to invest in these industries. Community Engagement & Support  Support a number of causes with a focus on helping people find work, affordable housing, and become financially empowered.  Grant associates eight paid hours each year to donate their time to non-profit organizations.  Completed our 8th annual Do More Charity Challenge®, bringing our total contribution to over $1.7 million to nonprofits in the communities we serve.  Purchased loans from Habitat for Humanity in Fort Collins, Colorado to enable them to continue building much needed affordable housing. Human Capital  We believe that our Company’s long-term success is deeply tied to having a dedicated and engaged workforce and a commitment to the communities we serve.  We strive for all of our associates to feel safe and empowered at work. To that end, we maintain a whistleblower hotline that allows associates and others to anonymously voice concerns.  We invest in the professional development and long-term financial stability of our workforce by offering tuition reimbursement and the opportunity to participate in our 401(k) plan, which includes contribution matches from the Company. Additionally, we offer a stock purchase plan (ESPP) to our associates to purchase shares in our Company at a 10% discount. Equity, Diversity and Inclusion  Our Equity, Diversity and Inclusion efforts are driven by an Equity, Diversity and Inclusion Committee comprised of a multi-disciplinary group of associates throughout NBH Bank with the support of the executive management team.  As of December 31, 2023, 63% of the Company’s workforce is female and 54% of the Company’s managerial roles are held by women.  In 2023, we hired 371 associates, and 62% of those new associates were female and 35% were minorities.

GRAPHIC

Appendix

GRAPHIC

Reconciliation of Non-GAAP Measures ($ in millions, except per share) (2) Represents non-recurring acquisition expense related to the Bank of Jackson Hole and Rock Canyon Bank acquisitions in the current year, and the Peoples acquisition in 2018 and 2017 (3) Represents a special $1,000 bonus payment to 491 associates made in connection with the Tax Cuts and Jobs Act enacted in 2017 35

GRAPHIC

Reconciliation of Non-GAAP Measures (cont’d) ($ in millions, except per share) 36

GRAPHIC

Reconciliation of Non-GAAP Measures (cont’d) ($ in millions, except per share) 37

GRAPHIC

Thank you.

v3.24.0.1
Document and Entity Information
Feb. 12, 2024
Cover [Abstract]  
Document Type 8-K
Document Period End Date Feb. 12, 2024
Entity Registrant Name NATIONAL BANK HOLDINGS CORP
Entity Incorporation, State or Country Code DE
Entity File Number 001-35654
Entity Tax Identification Number 27-0563799
Entity Address, Address Line One 7800 East Orchard Road
Entity Address, Adress Line Two Suite 300
Entity Address, City or Town Greenwood Village
Entity Address, State or Province CO
Entity Address, Postal Zip Code 80111
City Area Code 303
Local Phone Number 892-8715
Written Communications false
Soliciting Material false
Pre-commencement Tender Offer false
Pre-commencement Issuer Tender Offer false
Title of 12(b) Security Class A Common Stock
Trading Symbol NBHC
Security Exchange Name NYSE
Entity Emerging Growth Company false
Entity Central Index Key 0001475841
Amendment Flag false

National Bank (NYSE:NBHC)
Historical Stock Chart
Von Mär 2024 bis Apr 2024 Click Here for more National Bank Charts.
National Bank (NYSE:NBHC)
Historical Stock Chart
Von Apr 2023 bis Apr 2024 Click Here for more National Bank Charts.