Form NPORT-P - Monthly Portfolio Investments Report on Form N-PORT (Public)
28 November 2023 - 8:31PM
Edgar (US Regulatory)
Nuveen
Core
Equity
Alpha
Fund
Portfolio
of
Investments
September
30,
2023
(Unaudited)
Shares
Description
(a)
Value
LONG-TERM
INVESTMENTS
-
99.4%
X
–
COMMON
STOCKS
-
98
.4
%
X
196,936,131
Automobiles
&
Components
-
1.2%
9,310
(b)
Tesla
Inc
$
2,329,548
Total
Automobiles
&
Components
2,329,548
Banks
-
1.8%
4,005
Bank
of
America
Corp
109,657
35,490
Citigroup
Inc
1,459,704
9,240
JPMorgan
Chase
&
Co
1,339,985
82,410
(b)
NU
Holdings
Ltd/Cayman
Islands,
Class
A
597,472
Total
Banks
3,506,818
Capital
Goods
-
6.5%
8,590
AGCO
Corp
1,016,025
29,770
Flowserve
Corp
1,183,953
6,200
General
Dynamics
Corp
1,370,014
9,220
Honeywell
International
Inc
1,703,303
22,300
Johnson
Controls
International
plc
1,186,583
3,740
Lockheed
Martin
Corp
1,529,510
3,220
Northrop
Grumman
Corp
1,417,412
13,650
Oshkosh
Corp
1,302,619
10,610
Raytheon
Technologies
Corp
763,602
42,090
Vertiv
Holdings
Co
1,565,748
Total
Capital
Goods
13,038,769
Commercial
&
Professional
Services
-
2.1%
7,250
Automatic
Data
Processing
Inc
1,744,205
10,040
Jacobs
Solutions
Inc
1,370,460
30,460
Rollins
Inc
1,137,072
Total
Commercial
&
Professional
Services
4,251,737
Consumer
Discretionary
Distribution
&
Retail
-
7.7%
15,620
Advance
Auto
Parts
Inc
873,627
57,570
(b)
Amazon.com
Inc
7,318,298
58,300
(b)
Coupang
Inc
991,100
10,240
Home
Depot
Inc/The
3,094,118
12,010
Ross
Stores
Inc
1,356,530
20,110
TJX
Cos
Inc/The
1,787,377
Total
Consumer
Discretionary
Distribution
&
Retail
15,421,050
Consumer
Durables
&
Apparel
-
1.4%
9,520
NIKE
Inc,
Class
B
910,302
35,270
Tapestry
Inc
1,014,012
131,030
(b)
Under
Armour
Inc,
Class
A
897,556
Total
Consumer
Durables
&
Apparel
2,821,870
Consumer
Services
-
3.0%
26,380
H&R
Block
Inc
1,135,923
23,390
Las
Vegas
Sands
Corp
1,072,197
682
(b)
LIBERTY
MEDIA
CORP-LIBERTY-A,
Class
A
21,769
8,090
McDonald's
Corp
2,131,230
17,280
Starbucks
Corp
1,577,146
Total
Consumer
Services
5,938,265
Nuveen
Core
Equity
Alpha
Fund
(continued)
Portfolio
of
Investments
September
30,
2023
(Unaudited)
Shares
Description
(a)
Value
Consumer
Staples
Distribution
&
Retail
-
2.8%
29,050
Albertsons
Cos
Inc,
Class
A
$
660,888
540
Costco
Wholesale
Corp
305,078
17,980
Sysco
Corp
1,187,579
3,040
Target
Corp
336,133
24,450
(b)
US
Foods
Holding
Corp
970,665
13,829
Walmart
Inc
2,211,672
Total
Consumer
Staples
Distribution
&
Retail
5,672,015
Energy
-
4.8%
42,020
Baker
Hughes
Co
1,484,147
6,489
Chevron
Corp
1,094,175
540
ConocoPhillips
64,692
24,470
Devon
Energy
Corp
1,167,219
12,100
Exxon
Mobil
Corp
1,422,718
29,940
Halliburton
Co
1,212,570
25,080
HF
Sinclair
Corp
1,427,804
11,980
Valero
Energy
Corp
1,697,686
Total
Energy
9,571,011
Equity
Real
Estate
Investment
Trusts
(REITs)
-
1.3%
1,860
American
Tower
Corp
305,877
5,040
Cousins
Properties
Inc
102,665
8,350
Digital
Realty
Trust
Inc
1,010,517
2,330
Host
Hotels
&
Resorts
Inc
37,443
26,470
Ventas
Inc
1,115,181
Total
Equity
Real
Estate
Investment
Trusts
(REITs)
2,571,683
Financial
Services
-
7.0%
15,150
Bank
of
New
York
Mellon
Corp/The
646,148
14,420
(b)
Berkshire
Hathaway
Inc,
Class
B
5,051,326
22,270
(b)
Block
Inc
985,670
23,430
Fidelity
National
Information
Services
Inc
1,294,976
12,040
(b)
Fiserv
Inc
1,360,039
12,310
Global
Payments
Inc
1,420,451
2,011
Mastercard
Inc,
Class
A
796,175
22,380
Nasdaq
Inc
1,087,444
1,570
(b)
PayPal
Holdings
Inc
91,782
27,630
(b)
Robinhood
Markets
Inc,
Class
A
271,050
4,540
Visa
Inc,
Class
A
1,044,245
Total
Financial
Services
14,049,306
Food,
Beverage
&
Tobacco
-
2.7%
15,420
Archer-Daniels-Midland
Co
1,162,976
20,870
Coca-Cola
Co/The
1,168,303
15,710
PepsiCo
Inc
2,661,902
3,760
Philip
Morris
International
Inc
348,101
Total
Food,
Beverage
&
Tobacco
5,341,282
Health
Care
Equipment
&
Services
-
7.6%
28,100
(b)
Boston
Scientific
Corp
1,483,680
19,390
(b)
Centene
Corp
1,335,583
5,910
Cigna
Group/The
1,690,674
6,300
CVS
Health
Corp
439,866
3,780
Elevance
Health
Inc
1,645,888
11,750
(b)
Globus
Medical
Inc,
Class
A
583,388
3,890
HCA
Healthcare
Inc
956,862
15,440
(b)
Hologic
Inc
1,071,536
1,150
Humana
Inc
559,498
530
(b)
Insulet
Corp
84,530
20,390
Medtronic
PLC
1,597,760
Shares
Description
(a)
Value
Health
Care
Equipment
&
Services
(continued)
33,980
Premier
Inc,
Class
A
$
730,570
5,330
ResMed
Inc
788,147
44,900
(b)
Teladoc
Health
Inc
834,691
2,970
UnitedHealth
Group
Inc
1,497,444
Total
Health
Care
Equipment
&
Services
15,300,117
Household
&
Personal
Products
-
2.5%
20,690
Colgate-Palmolive
Co
1,471,266
9,090
Kimberly-Clark
Corp
1,098,526
16,860
Procter
&
Gamble
Co/The
2,459,200
Total
Household
&
Personal
Products
5,028,992
Insurance
-
1.4%
10,600
Cincinnati
Financial
Corp
1,084,274
8,870
Marsh
&
McLennan
Cos
Inc
1,687,961
Total
Insurance
2,772,235
Materials
-
1.2%
5,030
Air
Products
and
Chemicals
Inc
1,425,502
3,760
Sherwin-Williams
Co/The
958,988
Total
Materials
2,384,490
Media
&
Entertainment
-
7.5%
34,610
(b)
Alphabet
Inc,
Class
A
4,529,065
36,710
(b),(c)
Alphabet
Inc,
Class
C
4,840,213
33,960
Comcast
Corp,
Class
A
1,505,786
11,960
(b)
Meta
Platforms
Inc
3,590,512
1,360
(b)
Spotify
Technology
SA
210,310
3,590
(b)
Walt
Disney
Co/The
290,970
Total
Media
&
Entertainment
14,966,856
Pharmaceuticals,
Biotechnology
&
Life
Sciences
-
8.5%
17,060
AbbVie
Inc
2,542,964
29,490
Bristol-Myers
Squibb
Co
1,711,600
2,070
Eli
Lilly
&
Co
1,111,859
21,459
Johnson
&
Johnson
3,342,239
23,891
Merck
&
Co
Inc
2,459,578
1,080
(b)
Mettler-Toledo
International
Inc
1,196,716
9,800
(b)
Neurocrine
Biosciences
Inc
1,102,500
60,350
Pfizer
Inc
2,001,809
21,750
Royalty
Pharma
PLC
590,295
1,833
Thermo
Fisher
Scientific
Inc
927,810
Total
Pharmaceuticals,
Biotechnology
&
Life
Sciences
16,987,370
Semiconductors
&
Semiconductor
Equipment
-
5.2%
17,840
(b)
Allegro
MicroSystems
Inc
569,810
480
Broadcom
Inc
398,678
16,280
Intel
Corp
578,754
13,480
(b)
Lattice
Semiconductor
Corp
1,158,336
16,640
NVIDIA
Corp
7,238,234
4,390
QUALCOMM
Inc
487,553
Total
Semiconductors
&
Semiconductor
Equipment
10,431,365
Software
&
Services
-
11.8%
5,540
(b)
Adobe
Inc
2,824,846
5,400
(b)
Atlassian
Corp
Ltd,
Class
A
1,088,154
8,240
(b)
Cadence
Design
Systems
Inc
1,930,632
3,950
(b)
DocuSign
Inc
165,900
44,535
Microsoft
Corp
14,061,926
Nuveen
Core
Equity
Alpha
Fund
(continued)
Portfolio
of
Investments
September
30,
2023
(Unaudited)
Shares
Description
(a)
Value
Software
&
Services
(continued)
11,421
(b)
Salesforce
Inc
$
2,315,951
1,000
(b)
Synopsys
Inc
458,970
19,110
(b)
Teradata
Corp
860,332
Total
Software
&
Services
23,706,711
Technology
Hardware
&
Equipment
-
8.8%
89,818
(c)
Apple
Inc
15,377,740
42,190
Cisco
Systems
Inc
2,268,134
Total
Technology
Hardware
&
Equipment
17,645,874
Telecommunication
Services
-
0.6%
9,170
(b)
T-Mobile
US
Inc
1,284,259
Total
Telecommunication
Services
1,284,259
Utilities
-
1.0%
440
Alliant
Energy
Corp
21,318
12,920
Evergy
Inc
655,044
18,200
Sempra
1,238,146
Total
Utilities
1,914,508
Total
Common
Stocks
(cost
$170,965,135)
196,936,131
Shares
Description
(a)
Value
X
–
EXCHANGE-TRADED
FUNDS
-
1
.0
%
X
1,932,435
4,500
iShares
Core
S&P
500
ETF
$
1,932,435
Total
Exchange-Traded
Funds
(cost
$1,981,175)
1,932,435
Type
Description
Number
of
Contracts
Notional
Amount
(d)
Exercise
Price
Expiration
Date
Value
OPTIONS
PURCHASED
-
0
.0
%
X
–
Put
Consumer
Discretionary
Select
Sector
SPDR
Fund
20
$
300,000
$
150
10/20/23
$
1,800
Call
General
Mills
Inc
5
37,500
75
10/20/23
37
Total
Options
Purchased
(cost
$4,092)
25
$
337,500
1,837
Total
Long-Term
Investments
(cost
$172,950,402)
198,870,403
Principal
Amount
(000)
Description
(a)
Coupon
Maturity
Value
SHORT-TERM
INVESTMENTS
-
3.2%
–
REPURCHASE
AGREEMENTS
-
3
.2
%
X
6,459,975
$
6,460
Repurchase
Agreement
with
Fixed
Income
Clearing
Corporation,
dated
09/29/23,
repurchase
price
$6,460,837,
collateralized
by
$9,160,600,
U.S.
Treasury
Bond,
2.875%,
due
05/15/52,
value
$6,589,191
1.520%
10/02/23
$
6,459,975
Total
Repurchase
Agreements
(cost
$6,459,975)
6,459,975
Total
Short-Term
Investments
(cost
$6,459,975)
6,459,975
Total
Investments
(cost
$
179,410,377
)
-
102
.6
%
205,330,378
Other
Assets
&
Liabilities,
Net
- (2.6)%
(
5,200,799
)
Net
Assets
Applicable
to
Common
Shares
-
100%
$
200,129,579
Investments
in
Derivatives
Part
F
of
Form
N-PORT
was
prepared
in
accordance
with
U.S.
generally
accepted
accounting
principles
(“U.S.
GAAP”)
and
in
conformity
with
the
applicable
rules
and
regulations
of
the
U.S.
Securities
and
Exchange
Commission
(“SEC”)
related
to
interim
filings.
Part
F
of
Form
N-PORT
does
not
include
all
information
and
footnotes
required
by
U.S.
GAAP
for
complete
financial
statements.
Certain
footnote
disclosures
normally
included
in
financial
statements
prepared
in
accordance
with
U.S.
GAAP
have
been
condensed
or
omitted
from
this
report
pursuant
to
the
rules
of
the
SEC.
For
a
full
set
of
the
Fund’s
notes
to
financial
statements,
please
refer
to
the
Fund’s
most
recently
filed
annual
or
semi-annual
report.
Fair
Value
Measurements
The
Fund’s
investments
in
securities
are
recorded
at
their
estimated
fair
value
utilizing
valuation
methods
approved
by
the
Board
of
Directors/
Trustees.
Fair
value
is
defined
as
the
price
that
would
be
received
upon
selling
an
investment
or
transferring
a
liability
in
an
orderly
transaction
to
an
independent
buyer
in
the
principal
or
most
advantageous
market
for
the
investment.
U.S.
GAAP
establishes
the
three-tier
hierarchy
which
is
used
to
maximize
the
use
of
observable
market
data
and
minimize
the
use
of
unobservable
inputs
and
to
establish
classification
of
fair
value
measurements
for
disclosure
purposes.
Observable
inputs
reflect
the
assumptions
market
participants
would
use
in
pricing
the
asset
or
liability.
Observable
inputs
are
based
on
market
data
obtained
from
sources
independent
of
the
reporting
entity.
Unobservable
inputs
reflect
management’s
assumptions
about
the
assumptions
market
participants
would
use
in
pricing
the
asset
or
liability.
Unobservable
inputs
are
based
on
the
best
information
available
in
the
circumstances.
The
following
is
a
summary
of
the
three-tiered
hierarchy
of
valuation
input
levels.
Level
1
–
Inputs
are
unadjusted
and
prices
are
determined
using
quoted
prices
in
active
markets
for
identical
securities.
Level
2
–
Prices
are
determined
using
other
significant
observable
inputs
(including
quoted
prices
for
similar
securities,
interest
rates,
credit
spreads,
etc.).
Level
3
–
Prices
are
determined
using
significant
unobservable
inputs
(including
management’s
assumptions
in
determining
the
fair
value
of
investments).
The
following
table
summarizes
the
market
value
of
the
Fund's
investments
as
of
the
end
of
the
reporting
period,
based
on
the
inputs
used
to
value
them:
Options
Written
Type
Description
Number
of
Contracts
Notional
Amount
(d)
Exercise
Price
Expiration
Date
Value
Call
S&P
500
Index
(20)
$
(
9,200,000
)
$
4,600
10/20/23
$
(
800
)
Call
S&P
500
Index
(20)
(
9,150,000
)
4,575
11/17/23
(
17,900
)
Call
S&P
500
Index
(35)
(
16,100,000
)
4,600
11/17/23
(
22,750
)
Total
Options
Written
(premiums
received
$104,654)
(75)
$(34,450,000)
$(41,450)
Level
1
Level
2
Level
3
Total
Long-Term
Investments:
Common
Stocks
$
196,936,131
$
–
$
–
$
196,936,131
Exchange-Traded
Funds
1,932,435
–
–
1,932,435
Options
Purchased
1,800
37
–
1,837
Short-Term
Investments:
Repurchase
Agreements
–
6,459,975
–
6,459,975
Investments
in
Derivatives:
Options
Written
(41,450)
–
–
(41,450)
Total
$
198,828,916
$
6,460,012
$
–
$
205,288,928
For
Fund
portfolio
compliance
purposes,
the
Fund’s
industry
classifications
refer
to
any
one
or
more
of
the
industry
sub-classifications
used
by
one
or
more
widely
recognized
market
indexes
or
ratings
group
indexes,
and/or
as
defined
by
Fund
management.
This
definition
may
not
apply
for
purposes
of
this
report,
which
may
combine
industry
sub-classifications
into
sectors
for
reporting
ease.
(a)
All
percentages
shown
in
the
Portfolio
of
Investments
are
based
on
net
assets
applicable
to
common
shares
unless
otherwise
noted.
(b)
Non-income
producing;
issuer
has
not
declared
an
ex-dividend
date
within
the
past
twelve
months.
(c)
Investment,
or
portion
of
investment,
has
been
pledged
to
collateralize
the
net
payment
obligations
for
investments
in
derivatives.
(d)
For
disclosure
purposes,
Notional
Amount
is
calculated
by
multiplying
the
Number
of
Contracts
by
the
Exercise
Price
by
100.
ETF
Exchange-Traded
Fund
REIT
Real
Estate
Investment
Trust
S&P
Standard
&
Poor's
SPDR
Standard
&
Poor's
Depositary
Receipt
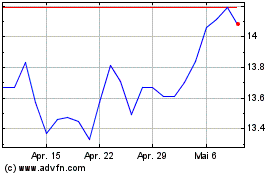
Nuveen Core Equity Alpha (NYSE:JCE)
Historical Stock Chart
Von Apr 2024 bis Mai 2024

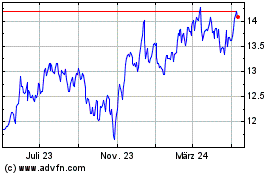
Nuveen Core Equity Alpha (NYSE:JCE)
Historical Stock Chart
Von Mai 2023 bis Mai 2024
