0001630805
false
0001630805
2023-08-08
2023-08-08
0001630805
us-gaap:CommonStockMember
2023-08-08
2023-08-08
0001630805
BW:SeniorNotes8.125PercentageDue2026Member
2023-08-08
2023-08-08
0001630805
BW:SeniorNotes6.50PercentageDue2026Member
2023-08-08
2023-08-08
0001630805
BW:SeriesA7.75PercentageCumulativePerpetualPreferredStockMember
2023-08-08
2023-08-08
iso4217:USD
xbrli:shares
iso4217:USD
xbrli:shares
UNITED STATES
SECURITIES AND EXCHANGE COMMISSION
Washington, D.C. 20549
FORM 8-K
CURRENT REPORT
Pursuant to Section 13 or 15 (d)
of the Securities Exchange Act of 1934
Date of Report (Date of earliest event reported):
August 8, 2023
| BABCOCK & WILCOX ENTERPRISES, INC. |
| (Exact name of registrant as specified in its charter) |
| Delaware |
|
001-36876 |
|
47-2783641 |
(State or other jurisdiction of
incorporation) |
|
(Commission File Number) |
|
(IRS Employer Identification No.) |
1200 East Market Street
Suite 650
Akron, Ohio |
|
44305 |
| (Address of Principal Executive Offices) |
|
(Zip Code) |
Registrant’s Telephone Number, including
Area Code: (330) 753-4511
Check the appropriate box below if the Form 8-K
filing is intended to simultaneously satisfy the filing obligation of the registrant under any of the following provisions:
| ¨ |
Written communications pursuant to Rule 425 under the Securities Act (17 CFR 230.425) |
| ¨ |
Soliciting material pursuant to Rule 14a-12 under the Exchange Act (17 CFR 240.14a-12) |
| ¨ |
Pre-commencement communications pursuant to Rule 14d-2(b) under the Exchange Act (17 CFR 240.14d-2(b)) |
| ¨ |
Pre-commencement communications pursuant to Rule 13e-4(c) under the Exchange Act (17 CFR 240.13e-4(c)) |
Securities registered pursuant to Section 12(b) of the Act:
| Title
of Each Class |
Trading
Symbol |
Name
of Each Exchange on which Registered |
| Common stock, $0.01 par value per share |
BW |
New York Stock Exchange |
| 8.125% Senior Notes due 2026 |
BWSN |
New York Stock Exchange |
| 6.50% Senior Notes due 2026 |
BWNB |
New York Stock Exchange |
| 7.75% Series A Cumulative Perpetual Preferred Stock |
BW PRA |
New York Stock Exchange |
Indicate by check mark whether the registrant
is an emerging growth company as defined in Rule 405 of the Securities Act of 1933 (17 CFR §230.405) or Rule 12b-2 of the Securities
Exchange Act of 1934 (17 CFR §240.12b-2).
Emerging growth company ¨
If an emerging growth company, indicate by check
mark if the registrant has elected not to use the extended transition period for complying with any new or revised financial accounting
standards provided pursuant to Section 13(a) of the Exchange Act. ¨
Item 2.02 Results of Operations and Financial Condition
On August 8, 2023, the Company issued a press
release announcing our financial results for the quarter ended June 30, 2023. A copy of the press release is attached as Exhibit 99.1,
and the information contained in Exhibit 99.1 is incorporated herein by reference.
The information furnished pursuant to this Item
2.02, including Exhibit 99.1, shall not be deemed to be “filed” for the purposes of Section 18 of the Securities
Exchange Act of 1934, as amended (the “Exchange Act”), or otherwise subject to the liabilities of that section, nor shall
such information be deemed incorporated by reference in any filing under the Securities Act of 1933, as amended (the “Securities
Act”), or the Exchange Act, except as shall be expressly set forth by specific reference in such filing.
Item
7.01 Regulation FD Disclosure
On August 8, 2023, the Company posted an
investor presentation on the investor relations section of its website at babcock.com. A copy of the presentation is attached as Exhibit 99.2,
and the information contained in Exhibit 99.2 is incorporated herein by reference.
The information furnished pursuant to this Item
7.01, including Exhibit 99.2, shall not be deemed “filed” for purposes of Section 18 of the Exchange Act or incorporated
by reference in any filing under the Securities Act or the Exchange Act, except as shall be expressly set forth by specific reference
in such filing.
Item 9.01 Financial Statements and Exhibits
(d) Exhibits
Signatures
Pursuant to the requirements of the Securities
Exchange Act of 1934, the registrant has duly caused this report to be signed on its behalf by the undersigned thereunto duly authorized.
| |
BABCOCK & WILCOX ENTERPRISES, INC. |
| |
|
| August 8, 2023 |
By: |
/s/ Louis Salamone |
| |
|
Louis Salamone |
| |
|
Executive Vice President, Chief Financial Officer and Chief Accounting Officer
(Principal Accounting Officer and Duly Authorized Representative) |
Exhibit
99.1

Babcock & Wilcox Enterprises Reports Second
Quarter 2023 Results
| • | Company exceeded its Revenue and EBITDA expectations for the
second quarter of 2023 |
| • | EBITDA growth strong despite significant investments in new
renewable energy technologies |
| • | BrightLoopTM hydrogen generation technology positioned
for initial commercial operations commencing in the second half of 2024 with a potential
of up to $1 billion in bookings by 2028 |
| • | Including BrightLoop, Pipeline expanded to over $9 billion
in identified global project opportunities, from $8 billion previously |
Q2 2023 Highlights and Outlook:
| – | Revenues of $305.2 million, a 38%
improvement compared to the second quarter of 2022 |
| – | Net loss of $5.0 million, compared to a net loss of $3.0 million
($10.4 million loss when excluding a noncash pension benefit of $7.4 million) in the second
quarter of 2022 |
| – | Loss per share of $0.10, compared to a loss per share of $0.07
($0.11 loss per share when excluding a noncash pension benefit of $7.4 million) in the second
quarter of 2022 |
| – | Consolidated adjusted EBITDA of $21.9 million, an improvement
compared to $15.9 million in the second quarter of 2022 when excluding a non-recurring $7.0
million gain on sale of an asset |
| – | Ending backlog of $566.5 million;
projecting backlog growth to a range of $850.0 million to $1.0 billion by year-end 2023 |
| – | Reiterates Full Year 2023 Adjusted
EBITDA target of $100.0 million to $120.0 million |
(AKRON, Ohio – August 8, 2023) –
Babcock & Wilcox Enterprises, Inc. ("B&W" or the "Company") (NYSE: BW) announced results for the second quarter
of 2023.
"Our strong second quarter results were highlighted by consolidated
revenue and adjusted EBITDA that exceeded Company expectations and an underlying improvement in revenue, adjusted EBITDA and net loss
on a year-over-year basis. This reflects the continued progress against our strategic growth initiatives and positions us to achieve
our full-year adjusted EBITDA targets,” said Kenneth Young, B&W’s Chairman and Chief Executive Officer. “We are
making significant investments in renewable energy technologies to support future growth. We continue to convert our global pipeline
into project opportunities and demonstrated another quarter of top-line improvement on a year-over-year and sequential basis. Our growth
remains broad based as we posted a second consecutive quarter of double-digit revenue expansion on a year-over-year basis across all
segments, highlighted by our Thermal and Renewable segments increasing 36% and 31% respectively."
“As we look forward to the remainder of the year, our outlook
for new booking opportunities remains robust. We expect our backlog will experience significant growth, projected to range between $850.0
million to $1.0 billion through specific opportunities across all segments,” Young added. “Interest across our ClimateBrightTM
decarbonization platform continues to develop as highlighted in the recent contract award from NorthStar Clean Energy, which is
the first phase of a large-scale project to use our SolveBrightTM carbon dioxide capture process to convert a coal-fired power
plant to biomass fuel. We are also excited about the continued progress to commercialize our BrightLoop hydrogen generation technology
and pleased to report several key developments associated with the previously announced projects in Louisiana and Wyoming. To accelerate
and ensure successful execution of our initial commercial projects, we have announced a dedicated BrightLoop organization, led by our
Chief Strategy and Technology Officer Brandy Johnson. For our upcoming small- and medium-scale projects, we’ve outlined projected
development plans with a timeline for initial hydrogen production starting in late 2024. We look forward to continuing to expand our
BrightLoop commercial activities in the years ahead, with targeted bookings of approximately $1.0 billion by 2028, which represents less
than 1% of the estimated global market for hydrogen production.”
“The traction we’ve experienced in customer adoption for
our clean energy solutions follows the global demand we recognize for decarbonization technologies during this clean energy transition
period. In addition, we continue to play a vital role in supporting global energy security and efficiency through our Thermal segment
as we see continued global expansion, gas conversions, and strong parts and services opportunities.”
Q2 2023 Financial Summary
Consolidated revenues in the second quarter of 2023 were $305.2 million,
a 38% improvement compared to the second quarter of 2022, primarily attributable to higher volumes in our Renewable segment due to B&W
Renewable Service and our Solar-based business, higher overall volume in our Environmental segment and increasing Thermal segment volume
due to a higher level of construction and parts activity. Net loss in the second quarter of 2023 was $5.0 million, compared to a net
loss of $3.0 million in the second quarter of 2022, which, when adjusted for pension gains in the second quarter of 2022, represents
a significant improvement in net income. Loss per share in the second quarter of 2023 was $0.10 compared to a loss per share of $0.07
in the second quarter of 2022. GAAP operating income in the second quarter of 2023 was $7.0 million compared to operating income
of $3.7 million in the second quarter of 2022. Adjusted EBITDA was $21.9 million compared to $22.9 million in the second
quarter of 2022, which, when adjusted for a one-time sale of an asset in the second quarter of 2022, represents significant improvement
in adjusted EBITDA from $15.9 million to $21.9 million. Bookings in the second quarter of 2023 were $191 million. Ending backlog was
$567 million, which is a 6% decrease compared to backlog at the end of the second quarter of 2022. All amounts referred to in this release
are on a continuing operations basis, unless otherwise noted. Reconciliations of net income, the most directly comparable GAAP measure,
to adjusted EBITDA for the Company's segments, are provided in the exhibits to this release.
Babcock & Wilcox Renewable segment revenues
were $98.9 million for the second quarter of 2023, an increase of 31% compared to $75.2 million in the second quarter of
2022. The increase in revenue is primarily due to higher volume associated with our Renewable
Service and Solar businesses. Adjusted EBITDA in the second quarter of 2023 was $0.5 million compared to
$4.2 million when excluding a non-recurring $7.0 million gain from the sale related to development rights of a future solar
project in the second quarter of 2022.

Babcock & Wilcox Environmental segment revenues
were $48.7 million in the second quarter of 2023, an increase of 54% compared to $31.6 million in the second quarter of 2022.
The increase is primarily driven by higher overall volume of dry cooling technology projects across the Environmental segment. Adjusted
EBITDA in the second quarter of 2023 was $3.4 million, compared to $0.6 million in the second quarter of 2022, primarily driven
by higher revenue volume described above.
Babcock & Wilcox Thermal segment revenues were $158.0 million
in the second quarter of 2023, an increase of 36% compared to $116.3 million in the second quarter of 2022. The revenue increase
is attributable to a higher level of volume in our construction projects and package boiler businesses. Adjusted EBITDA in the second
quarter of 2023 was $24.4 million, an increase of 49% compared to $16.4 million in the second quarter of 2022, primarily driven
by higher revenue volume described above as well as project performance.
Liquidity and Balance Sheet
At June 30, 2023, the Company had total
debt of $358.2 million and a cash, cash equivalents and restricted cash balance of $83.9 million.
Impacts of Market Conditions
The Company has experienced and may continue
to experience, supply chain disruptions driven by the lingering impacts of the pandemic in certain areas that the Company operates, as
well as the ongoing war in Ukraine. The Company has also observed significant delays and disruptions of its service and material providers
and negative impacts to pricing of certain products. These delays and disruptions have had, and could continue to have, an adverse impact
on the Company’s ability to meet customers’ demands and schedules. The Company is continuing to actively monitor the impact
of these market conditions on current and future periods and actively manage costs and our liquidity position to provide additional flexibility
while still supplying its customers and their specific needs. The duration and scope of these conditions cannot be predicted, and therefore,
any anticipated negative financial impact to the Company’s operating results cannot be reasonably estimated.
Earnings Call Information
B&W plans to host a conference call and webcast on Tuesday, August 8,
2023 at 5 p.m. ET to discuss the Company’s second quarter 2023 results. The listen-only audio of the conference call will be broadcast
live via the Internet on B&W’s Investor Relations site. The dial-in number for participants in the U.S. is (833) 470-1428;
the dial-in number for participants in Canada is (833) 950-0062; the dial-in number for participants in all other locations is (929)
526-1599. The conference ID for all participants is 961977. A replay of this conference call will remain accessible in the investor relations
section of the Company’s website for a limited time.
Non-GAAP Financial Measures
The Company uses non-GAAP financial measures
internally to evaluate its performance and in making financial and operational decisions. When viewed in conjunction with GAAP results
and the accompanying reconciliation, the Company believes that its presentation of these measures provides investors with greater transparency
and a greater understanding of factors affecting its financial condition and results of operations than GAAP measures alone. The presentation
of non-GAAP financial measures should not be considered in isolation or as a substitute for the Company’s related financial results
prepared in accordance with GAAP.
Adjusted EBITDA on a consolidated basis is a
non-GAAP metric defined as the sum of the adjusted EBITDA for each of the segments, further adjusted for corporate allocations and research
and development costs. At a segment level, the adjusted EBITDA presented is consistent with the way the Company's chief operating decision
maker reviews the results of operations and makes strategic decisions about the business and is calculated as earnings before interest
expense, tax, depreciation and amortization adjusted for items such as gains or losses arising from the sale of non-income producing
assets, net pension benefits, restructuring costs, impairments, gains and losses on debt extinguishment, costs related to financial consulting,
research and development costs and other costs that may not be directly controllable by segment management and are not allocated to the
segment. The Company presents consolidated Adjusted EBITDA because it believes it is useful to investors to help facilitate comparisons
of the ongoing, operating performance before corporate overhead and other expenses not attributable to the operating performance of the
Company's revenue generating segments. This release also presents certain targets for the Company's Adjusted EBITDA in the future; these
targets are not intended as guidance regarding how the Company believes the business will perform. The Company is unable to reconcile
these targets to their GAAP counterparts without unreasonable effort and expense. Prior period results have been revised to conform with
the revised definition and present separate reconciling items in our reconciliation, including business transition costs.
Bookings and Backlog
Bookings and backlog are our measure of remaining
performance obligations under our sales contracts. It is possible that our methodology for determining bookings and backlog may not be
comparable to methods used by other companies.
We generally include expected revenue from contracts
in our backlog when we receive written confirmation from our customers authorizing the performance of work and committing the customers
to payment for work performed. Backlog may not be indicative of future operating results, and contracts in our backlog may be canceled,
modified or otherwise altered by customers. Backlog can vary significantly from period to period, particularly when large new build projects
or operations and maintenance contracts are booked because they may be fulfilled over multiple years. Because we operate globally, our
backlog is also affected by changes in foreign currencies each period. We do not include orders of our unconsolidated joint ventures
in backlog. The Company is in the process of exiting its only remaining fixed fee Operational and Maintenance Contract in our Renewable
segment. A similar contract was exited as of December 31, 2022. The company believes it is useful to exclude the impact of this contract
on our operating results as well as our backlog in order to highlight the performance of the business.
Bookings represent changes to the backlog. Bookings
include additions from booking new business, subtractions from customer cancellations or modifications, changes in estimates of liquidated
damages that affect selling price and revaluation of backlog denominated in foreign currency. We believe comparing bookings on a quarterly
basis or for periods less than one year is less meaningful than for longer periods, and that shorter-term changes in bookings may not
necessarily indicate a material trend.
Forward-Looking Statements
This press release contains forward-looking statements
within the meaning of the Private Securities Litigation Reform Act of 1995. All statements other than statements of historical or current
fact included in this release are forward-looking statements. You should not place undue reliance on these statements. Forward-looking
statements include words such as “expect,” “intend,” “plan,” “likely,” “seek,”
“believe,” “project,” “forecast,” “target,” “goal,” “potential,”
“estimate,” “may,” “might,” “will,” “would,” “should,” “could,”
“can,” “have,” “due,” “anticipate,” “assume,” “contemplate,”
“continue” and other words and terms of similar meaning in connection with any discussion of the timing or nature of future
operational performance or other events.
These forward-looking statements are based on
management’s current expectations and involve a number of risks and uncertainties, including, among other things, the impact of
global macroeconomic conditions, including inflation and volatility in the capital markets; our ability to integrate acquired businesses
and the impact of those acquired businesses on our cash flows, results of operations and financial condition, including our recent acquisitions
of Babcock & Wilcox Solar Energy, Inc. ("Babcock & Wilcox Solar", "B&W Solar"), formerly known as Fosler
Construction Company Inc. and/or Fosler, Babcock & Wilcox Renewable Service A/S, formerly known as VODA A/S ("VODA"), Fossil
Power Systems, Inc, Optimus Industries, LLC and certain assets of Hamon Research-Cottrell, Inc; our recognition of any asset impairments
as a result of any decline in the value of our assets or our efforts to dispose of any assets in the future; our ability to obtain and
maintain sufficient financing to provide liquidity to meet our business objectives, surety bonds, letters of credit and similar financing;
our ability to comply with the requirements of, and to service the indebtedness under, our debt facility agreements; our ability to pay
dividends on our 7.75% Series A Cumulative Perpetual Preferred Stock; our ability to make interest payments on our 8.125% senior notes
due 2026 and our 6.50% notes due 2026; the highly competitive nature of our businesses and our ability to win work, including identified
project opportunities in our pipeline; general economic and business conditions, including changes in interest rates and currency exchange
rates; cancellations of and adjustments to backlog and the resulting impact from using backlog as an indicator of future earnings; our
ability to perform contracts on time and on budget, in accordance with the schedules and terms established by the applicable contracts
with customers; failure by third-party subcontractors, partners or suppliers to perform their obligations on time and as specified; delays
initiated by our customers; our ability to successfully resolve claims by vendors for goods and services provided and claims by customers
for items under warranty; our ability to realize anticipated savings and operational benefits from our restructuring plans, and other
cost savings initiatives; our ability to successfully address productivity and schedule issues in our B&W Renewable, B&W Environmental
and B&W Thermal segments; our ability to successfully partner with third parties to win and execute contracts within our B&W
Environmental, B&W Renewable and B&W Thermal segments; changes in our effective tax rate and tax positions, including any limitation
on our ability to use our net operating loss carryforwards and other tax assets; our ability to successfully manage research and development
projects and costs, including our efforts to successfully develop and commercialize new technologies and products; the operating risks
normally incident to our lines of business, including professional liability, product liability, warranty and other claims against us;
difficulties we may encounter in obtaining regulatory or other necessary permits or approvals; changes in actuarial assumptions and market
fluctuations that affect our net pension liabilities and income; our ability to successfully compete with current and future competitors;
our ability to negotiate and maintain good relationships with labor unions; changes in pension and medical expenses associated with our
retirement benefit programs; social, political, competitive and economic situations in foreign countries where we do business or seek
new business; the impact of the ongoing conflict in Ukraine; the impact of pandemic or other similar global health crises, and the other
factors specified and set forth under "Risk Factors" in our periodic reports filed with the Securities and Exchange Commission,
including our most recent annual report on Form 10-K filed on March 16, 2023.
These forward-looking statements are made based
upon detailed assumptions and reflect management’s current expectations and beliefs. While we believe that these assumptions underlying
the forward-looking statements are reasonable, we caution that it is very difficult to predict the impact of known factors, and it is
impossible for us to anticipate all factors that could affect actual results.
The forward-looking statements included herein
are made only as of the date hereof. We undertake no obligation to publicly update or revise any forward-looking statement as a result
of new information, future events, or otherwise, except as required by law.
About B&W Enterprises, Inc.
Headquartered in Akron, Ohio, Babcock &
Wilcox Enterprises, Inc. is a leader in energy and environmental products and services for power and industrial markets worldwide. Follow
us on LinkedIn and learn more at babcock.com.
#
# #
| Investor
Contact: |
Media
Contact: |
| Lou
Salamone, CFO |
Ryan
Cornell |
| Babcock
& Wilcox Enterprises, Inc. |
Public
Relations |
| 704.625.4944
| investors@babcock.com |
Babcock
& Wilcox Enterprises, Inc. |
| |
330.860.1345
| rscornell@babcock.com |
Exhibit 1
Babcock & Wilcox Enterprises, Inc.
Condensed Consolidated Statements of Operations(1)
(In millions, except per share amounts)
| | |
Three Months Ended June 30, | | |
Six Months Ended June 30, | |
| | |
2023 | | |
2022 | | |
2023 | | |
2022 | |
| Revenues | |
$ | 305.2 | | |
$ | 221.0 | | |
$ | 562.4 | | |
$ | 425.1 | |
| Costs and expenses: | |
| | | |
| | | |
| | | |
| | |
| Cost of operations | |
| 244.2 | | |
| 173.3 | | |
| 448.0 | | |
| 336.4 | |
| Selling, general and administrative expenses | |
| 52.1 | | |
| 45.0 | | |
| 104.0 | | |
| 88.0 | |
| Advisory fees and settlement costs | |
| 0.6 | | |
| 5.1 | | |
| (1.9 | ) | |
| 9.1 | |
| Restructuring activities | |
| 1.0 | | |
| (0.1 | ) | |
| 1.4 | | |
| 0.0 | |
| Research and development costs | |
| 0.9 | | |
| 1.1 | | |
| 2.2 | | |
| 1.9 | |
| Loss on asset disposals, net | |
| (0.6 | ) | |
| (7.1 | ) | |
| 0.3 | | |
| (7.1 | ) |
| Total costs and expenses | |
| 298.2 | | |
| 217.4 | | |
| 554.1 | | |
| 428.2 | |
| Operating income (loss) | |
| 7.0 | | |
| 3.7 | | |
| 8.3 | | |
| (3.1 | ) |
| Other (expense) income: | |
| | | |
| | | |
| | | |
| | |
| Interest expense | |
| (11.2 | ) | |
| (10.7 | ) | |
| (23.8 | ) | |
| (21.9 | ) |
| Interest income | |
| 0.5 | | |
| 0.1 | | |
| 0.6 | | |
| 0.2 | |
| Benefit plans, net | |
| (0.1 | ) | |
| 7.4 | | |
| (0.2 | ) | |
| 14.9 | |
| Foreign exchange | |
| 1.2 | | |
| (4.3 | ) | |
| 0.7 | | |
| (1.2 | ) |
| Other expense - net | |
| (0.4 | ) | |
| (0.6 | ) | |
| (0.7 | ) | |
| (0.6 | ) |
| Total other expense | |
| (10.1 | ) | |
| (8.0 | ) | |
| (23.5 | ) | |
| (8.7 | ) |
| Loss before income tax expense | |
| (3.2 | ) | |
| (4.3 | ) | |
| (15.1 | ) | |
| (11.8 | ) |
| Income tax expense (benefit) | |
| 1.9 | | |
| (1.4 | ) | |
| 2.4 | | |
| (0.1 | ) |
| Net loss | |
| (5.0 | ) | |
| (3.0 | ) | |
| (17.5 | ) | |
| (11.7 | ) |
| Net (income) loss attributable to non-controlling interest | |
| (0.1 | ) | |
| 0.4 | | |
| (0.1 | ) | |
| 0.8 | |
| Net loss attributable to stockholders | |
| (5.1 | ) | |
| (2.6 | ) | |
| (17.6 | ) | |
| (10.8 | ) |
| Less: Dividend on Series A preferred stock | |
| 3.7 | | |
| 3.7 | | |
| 7.4 | | |
| 7.4 | |
| Net loss attributable to stockholders of common stock | |
$ | (8.8 | ) | |
$ | (6.3 | ) | |
$ | (25.0 | ) | |
$ | (18.3 | ) |
| | |
| | | |
| | | |
| | | |
| | |
| Basic loss per share | |
$ | (0.10 | ) | |
$ | (0.07 | ) | |
$ | (0.28 | ) | |
$ | (0.21 | ) |
| Diluted loss per share | |
$ | (0.10 | ) | |
$ | (0.07 | ) | |
$ | (0.28 | ) | |
$ | (0.21 | ) |
| | |
| | | |
| | | |
| | | |
| | |
| Shares used in the computation of loss per share: | |
| | | |
| | | |
| | | |
| | |
| Basic | |
| 88.8 | | |
| 88.0 | | |
| 88.8 | | |
| 88.0 | |
| Diluted | |
| 88.8 | | |
| 88.0 | | |
| 88.8 | | |
| 88.0 | |
(1) Figures may not be clerically accurate due to rounding
Exhibit 2
Babcock & Wilcox Enterprises, Inc.
Condensed Consolidated Balance Sheets(1)
| (In millions, except per share amount) |
|
June 30, 2023 |
|
|
December 31, 2022 |
|
| Cash and cash equivalents |
|
$ |
55.0 |
|
|
$ |
76.7 |
|
| Current restricted cash and cash equivalents |
|
|
18.3 |
|
|
|
15.3 |
|
| Accounts receivable – trade, net |
|
|
176.3 |
|
|
|
162.5 |
|
| Accounts receivable – other |
|
|
47.8 |
|
|
|
38.5 |
|
| Contracts in progress |
|
|
175.5 |
|
|
|
134.9 |
|
| Inventories, net |
|
|
118.6 |
|
|
|
102.6 |
|
| Other current assets |
|
|
26.6 |
|
|
|
27.0 |
|
| Total current assets |
|
|
618.2 |
|
|
|
557.6 |
|
| Net property, plant and equipment, and finance lease |
|
|
83.6 |
|
|
|
86.4 |
|
| Goodwill |
|
|
158.2 |
|
|
|
157.0 |
|
| Intangible assets, net |
|
|
56.8 |
|
|
|
60.3 |
|
| Right-of-use assets |
|
|
28.1 |
|
|
|
29.4 |
|
| Long-term restricted cash |
|
|
10.5 |
|
|
|
21.4 |
|
| Other assets |
|
|
31.5 |
|
|
|
30.6 |
|
| Total assets |
|
$ |
986.9 |
|
|
$ |
942.7 |
|
| |
| Accounts payable |
|
$ |
180.4 |
|
|
$ |
139.2 |
|
| Accrued employee benefits |
|
|
12.8 |
|
|
|
12.5 |
|
| Advance billings on contracts |
|
|
140.4 |
|
|
|
133.4 |
|
| Accrued warranty expense |
|
|
10.3 |
|
|
|
9.6 |
|
| Financing lease liabilities |
|
|
1.3 |
|
|
|
1.2 |
|
| Operating lease liabilities |
|
|
3.8 |
|
|
|
3.6 |
|
| Other accrued liabilities |
|
|
72.3 |
|
|
|
68.2 |
|
| Loans payable |
|
|
4.4 |
|
|
|
4.3 |
|
| Total current liabilities |
|
|
425.6 |
|
|
|
372.0 |
|
| Senior notes |
|
|
336.6 |
|
|
|
335.5 |
|
| Loans payable, net of current portion |
|
|
17.2 |
|
|
|
13.2 |
|
| Pension and other postretirement benefit liabilities |
|
|
135.1 |
|
|
|
136.2 |
|
| Finance lease liabilities, net of current portion |
|
|
26.9 |
|
|
|
27.5 |
|
| Operating lease liabilities, net of current portion |
|
|
25.7 |
|
|
|
26.6 |
|
| Deferred tax liability |
|
|
10.4 |
|
|
|
10.1 |
|
| Other non-current liabilities |
|
|
22.5 |
|
|
|
23.8 |
|
| Total liabilities |
|
|
999.9 |
|
|
|
944.7 |
|
| Commitments and contingencies |
|
|
|
|
|
|
|
|
| Stockholders' deficit: |
|
|
|
|
|
|
|
|
| Preferred stock, par value $0.01 per share, authorized shares of 20,000; issued and outstanding shares of 7,669 at both June 30, 2023 and December 31, 2022 |
|
|
0.1 |
|
|
|
0.1 |
|
| Common stock, par value $0.01 per share, authorized shares of 500,000; issued and outstanding shares of 88,828 and 88,700 at June 30, 2023 and December 31, 2022, respectively |
|
|
5.1 |
|
|
|
5.1 |
|
| Capital in excess of par value |
|
|
1,543.2 |
|
|
|
1,537.6 |
|
| Treasury stock at cost, 1,880 and 1,868 shares at June 30, 2023 and December 31, 2022, respectively |
|
|
(113.8 |
) |
|
|
(113.8 |
) |
| Accumulated deficit |
|
|
(1,383.9 |
) |
|
|
(1,358.9 |
) |
| Accumulated other comprehensive loss |
|
|
(64.2 |
) |
|
|
(72.8 |
) |
| Stockholders' deficit attributable to shareholders |
|
|
(13.5 |
) |
|
|
(2.6 |
) |
| Non-controlling interest |
|
|
0.5 |
|
|
|
0.5 |
|
| Total stockholders' deficit |
|
|
(13.0 |
) |
|
|
(2.1 |
) |
| Total liabilities and stockholders' deficit |
|
$ |
986.9 |
|
|
$ |
942.7 |
|
(1) Figures may not be clerically
accurate due to rounding.
Exhibit 3
Babcock & Wilcox Enterprises, Inc.
Condensed Consolidated Statements of Cash Flows(1)
| (In millions) | |
Six Months Ended June 30, | |
| | |
2023 | | |
2022 | |
| Cash flows from operating activities: | |
| | | |
| | |
| Net loss | |
$ | (17.5 | ) | |
$ | (11.7 | ) |
| Adjustments to reconcile net loss to net cash used in operating activities: | |
| | | |
| | |
| Depreciation and amortization of long-lived assets | |
| 11.3 | | |
| 11.9 | |
| Amortization of deferred financing costs and debt discount | |
| 2.8 | | |
| 2.3 | |
| Amortization of guaranty fee | |
| 0.5 | | |
| 0.4 | |
| Non-cash operating lease expense | |
| 3.3 | | |
| 3.9 | |
| Gain on sale of business | |
| — | | |
| (7.0 | ) |
| Loss on asset disposals | |
| 0.3 | | |
| — | |
| Benefit from deferred income taxes | |
| (1.7 | ) | |
| (3.1 | ) |
| Prior service cost amortization for pension and postretirement plans | |
| 0.4 | | |
| 0.4 | |
| Stock-based compensation | |
| 5.6 | | |
| 3.1 | |
| Foreign exchange | |
| (0.7 | ) | |
| 1.2 | |
| Changes in operating assets and liabilities: | |
| | | |
| | |
| Accounts receivable - trade, net and other | |
| (10.5 | ) | |
| (13.8 | ) |
| Contracts in progress | |
| (40.8 | ) | |
| (31.3 | ) |
| Advance billings on contracts | |
| 6.4 | | |
| 24.6 | |
| Inventories, net | |
| (15.7 | ) | |
| (13.7 | ) |
| Income taxes | |
| (4.3 | ) | |
| (2.0 | ) |
| Accounts payable | |
| 40.5 | | |
| 23.7 | |
| Accrued and other current liabilities | |
| 5.2 | | |
| (17.9 | ) |
| Accrued contract loss | |
| (3.2 | ) | |
| 1.5 | |
| Pension liabilities, accrued postretirement benefits and employee benefits | |
| (4.7 | ) | |
| (17.5 | ) |
| Other, net | |
| 0.6 | | |
| (18.6 | ) |
| Net cash used in operating activities: | |
| (22.3 | ) | |
| (63.6 | ) |
| | |
| | | |
| | |
| Cash flows from investing activities: | |
| | | |
| | |
| Purchase of property, plant and equipment | |
| (5.6 | ) | |
| (2.7 | ) |
| Acquisition of business, net of cash acquired | |
| — | | |
| (64.9 | ) |
| Purchases of available-for-sale securities | |
| (3.9 | ) | |
| (3.2 | ) |
| Sales and maturities of available-for-sale securities | |
| 5.4 | | |
| 5.0 | |
| Other, net | |
| — | | |
| 0.2 | |
| Net cash used in investing activities | |
| (4.2 | ) | |
| (65.6 | ) |
| | |
| | | |
| | |
| Cash flows from financing activities: | |
| | | |
| | |
| Issuance of senior notes | |
| — | | |
| 2.4 | |
| Borrowings on loan payable | |
| 16.2 | | |
| 1.3 | |
| Repayments on loan payable | |
| (12.0 | ) | |
| (13.4 | ) |
| Finance lease payments | |
| (0.6 | ) | |
| — | |
| Payment of preferred stock dividends | |
| (7.4 | ) | |
| (7.4 | ) |
| Shares of common stock returned to treasury stock | |
| (0.1 | ) | |
| (0.2 | ) |
| Other, net | |
| (0.3 | ) | |
| 1.6 | |
| Net cash used in financing activities | |
| (4.2 | ) | |
| (15.6 | ) |
| Effects of exchange rate changes on cash | |
| 1.1 | | |
| (1.7 | ) |
| Net decrease in cash, cash equivalents and restricted cash | |
| (29.6 | ) | |
| (146.5 | ) |
| Cash, cash equivalents and restricted cash at beginning of period | |
| 113.5 | | |
| 226.7 | |
| Cash, cash equivalents and restricted cash at end of period | |
$ | 83.9 | | |
$ | 80.2 | |
(1) Figures may not be clerically accurate due to rounding.
Exhibit 4
Babcock & Wilcox Enterprises, Inc.
Segment Information(1)
(In millions)
| SEGMENT RESULTS | |
Three Months Ended June 30, | | |
Six Months Ended June 30, | |
| | |
2023 | | |
2022 | | |
2023 | | |
2022 | |
| REVENUES: | |
| | |
| | |
| | |
| |
| Babcock & Wilcox Renewable | |
$ | 98.9 | | |
$ | 75.2 | | |
$ | 199.0 | | |
$ | 143.2 | |
| Babcock & Wilcox Environmental | |
| 48.7 | | |
| 31.6 | | |
| 88.1 | | |
| 66.6 | |
| Babcock & Wilcox Thermal | |
| 158.0 | | |
| 116.3 | | |
| 277.2 | | |
| 218.5 | |
| Other | |
| (0.4 | ) | |
| (2.1 | ) | |
| (1.9 | ) | |
| (3.2 | ) |
| | |
$ | 305.2 | | |
$ | 221.0 | | |
$ | 562.4 | | |
$ | 425.1 | |
| | |
| | | |
| | | |
| | | |
| | |
| ADJUSTED EBITDA: | |
| | | |
| | | |
| | | |
| | |
| Babcock & Wilcox Renewable | |
$ | 0.5 | | |
$ | 11.2 | | |
$ | 5.4 | | |
$ | 13.5 | |
| Babcock & Wilcox Environmental | |
| 3.4 | | |
| 0.6 | | |
| 5.3 | | |
| 2.0 | |
| Babcock & Wilcox Thermal | |
| 24.4 | | |
| 16.4 | | |
| 38.1 | | |
| 30.5 | |
| Corporate | |
| (5.5 | ) | |
| (4.2 | ) | |
| (10.6 | ) | |
| (8.6 | ) |
| Research and development costs | |
| (0.9 | ) | |
| (1.0 | ) | |
| (2.2 | ) | |
| (1.6 | ) |
| | |
$ | 21.9 | | |
$ | 22.9 | | |
$ | 36.1 | | |
$ | 35.8 | |
| | |
| | | |
| | | |
| | | |
| | |
| AMORTIZATION EXPENSE: | |
| | | |
| | | |
| | | |
| | |
| Babcock & Wilcox Renewable | |
$ | 1.3 | | |
$ | 0.8 | | |
$ | 1.9 | | |
$ | 2.9 | |
| Babcock & Wilcox Environmental | |
| 0.8 | | |
| 0.7 | | |
| 1.5 | | |
| 1.4 | |
| Babcock & Wilcox Thermal | |
| 1.2 | | |
| 1.6 | | |
| 2.3 | | |
| 2.8 | |
| | |
$ | 3.2 | | |
$ | 3.1 | | |
$ | 5.7 | | |
$ | 7.1 | |
| | |
| | | |
| | | |
| | | |
| | |
| DEPRECIATION EXPENSE: | |
| | | |
| | | |
| | | |
| | |
| Babcock & Wilcox Renewable | |
$ | 0.7 | | |
$ | 0.5 | | |
$ | 1.7 | | |
$ | 1.1 | |
| Babcock & Wilcox Environmental | |
| 0.2 | | |
| 0.2 | | |
| 0.4 | | |
| 0.4 | |
| Babcock & Wilcox Thermal | |
| 1.8 | | |
| 1.9 | | |
| 3.7 | | |
| 3.3 | |
| | |
$ | 2.7 | | |
$ | 2.6 | | |
$ | 5.8 | | |
$ | 4.8 | |
| | |
As of June 30, | |
| | |
2023 | | |
2022 | |
| BACKLOG: | |
| | | |
| | |
| Babcock & Wilcox Renewable (2) | |
$ | 216 | | |
$ | 282 | |
| Babcock & Wilcox Environmental | |
| 162 | | |
| 127 | |
| Babcock & Wilcox Thermal | |
| 191 | | |
| 193 | |
| Other/Eliminations | |
| (3 | ) | |
| (1 | ) |
| | |
$ | 567 | | |
$ | 601 | |
| (1) | Figures may not be clerically accurate due to rounding. |
| (2) | B&W Renewable backlog has been adjusted downward $53 million
and $129.7 million at June 30, 2023 and June 30, 2022 respectively to remove O&M
contracts that are recognized as disposed. |
Exhibit 5
Babcock & Wilcox Enterprises, Inc.
Reconciliation of Adjusted EBITDA
(In millions)
| | |
Three Months Ended June 30, | | |
Six Months Ended June 30, | |
| | |
2023 | | |
2022 | | |
2023 | | |
2022 | |
| Net loss | |
$ | (5.0 | ) | |
$ | (3.0 | ) | |
$ | (17.5 | ) | |
$ | (11.7 | ) |
| Interest expense | |
| 12.5 | | |
| 12.1 | | |
| 26.9 | | |
| 24.4 | |
| Income tax expense | |
| 1.9 | | |
| (1.4 | ) | |
| 2.4 | | |
| (0.1 | ) |
| Depreciation & amortization | |
| 6.0 | | |
| 5.7 | | |
| 11.3 | | |
| 11.9 | |
| EBITDA | |
| 15.3 | | |
| 13.5 | | |
| 23.1 | | |
| 24.5 | |
| | |
| | | |
| | | |
| | | |
| | |
| Benefit plans, net | |
| 0.1 | | |
| (7.4 | ) | |
| 0.2 | | |
| (14.9 | ) |
| Loss on sales, net | |
| (0.6 | ) | |
| (0.1 | ) | |
| 0.3 | | |
| (0.1 | ) |
| Stock compensation | |
| 2.3 | | |
| 0.5 | | |
| 5.5 | | |
| 1.8 | |
| Restructuring activities and business services transition costs | |
| 1.0 | | |
| 1.8 | | |
| 2.0 | | |
| 4.4 | |
| Settlement and related legal costs | |
| — | | |
| 3.9 | | |
| (3.0 | ) | |
| 6.4 | |
| Advisory fees for settlement costs and liquidity planning | |
| — | | |
| 0.9 | | |
| 0.5 | | |
| 1.9 | |
| Acquisition pursuit and related costs | |
| 0.1 | | |
| 1.4 | | |
| 0.2 | | |
| 2.2 | |
| Product development (1) | |
| 1.0 | | |
| 1.0 | | |
| 2.4 | | |
| 1.8 | |
| Foreign exchange | |
| (1.2 | ) | |
| 4.3 | | |
| (0.7 | ) | |
| 1.2 | |
| Financial advisory services | |
| — | | |
| 0.4 | | |
| — | | |
| 0.7 | |
| Contract disposal (2) | |
| 2.7 | | |
| 2.3 | | |
| 4.1 | | |
| 3.2 | |
| Contract step-up purchase price adjustment | |
| — | | |
| — | | |
| — | | |
| 1.7 | |
| Other - net | |
| 1.0 | | |
| 0.7 | | |
| 1.3 | | |
| 0.8 | |
| Adjusted EBITDA(3) | |
$ | 21.9 | | |
$ | 22.9 | | |
$ | 36.1 | | |
$ | 35.8 | |
| (1) | Costs associated with development of commercially viable products
that are ready to go to market. |
| (2) | Impacts of the disposal of our O&M contracts has been adjusted
in the prior period to ensure uniform presentation with the current period |
| (3) | Figures may not be clerically
accurate due to rounding. |
Exhibit 99.2

| © 2023 Babcock & Wilcox Enterprises, Inc. All rights reserved.
AUGUST 8, 2023
COMPANY OVERVIEW |
| © 2023 Babcock & Wilcox Enterprises, Inc. All rights reserved. BABCOCK & WILCOX ENTERPRISES, INC. 2
SAFE HARBOR STATEMENT
B&W Enterprises cautions that this presentation contains forward-looking statements within the meaning of federal securities laws. All statements other than statements of historical or current fact included in this
presentation are forward-looking statements, including, without limitation, statements relating to the company's business outlook and expected financial performance, including adjusted EBITDA and sales targets,
expectations regarding future growth, expansion and profitability, outlook and expectations regarding B&W’s BrightLoop™ technologies, as well as statements about B&W’s future pipeline of new projects and business
within its Renewable, Environmental and Thermal operating segments and their impact on future shareholder value. These forward-looking statements are based on management’s current expectations and involve a
number of risks and uncertainties, including, among other things, the impact of global macroeconomic conditions, including inflation and volatility in the capital markets; the impact of the ongoing conflict in Ukraine; our
ability to integrate acquired businesses and the impact of those acquired businesses on our cash flows, results of operations and financial condition, including our recent acquisitions of Babcock & Wilcox Solar Energy, Inc.
("Babcock & Wilcox Solar"), formerly known as Fosler Construction Company Inc. and/or Fosler, Babcock & Wilcox Renewable Service A/S, formerly known as VODA A/S ("VODA"), Fossil Power Systems, Inc. ("FPS"),
Optimus Industries, LLC ("Optimus") and certain assets of Hamon Holdings Corporation ("Hamon"); our recognition of any asset impairments as a result of any decline in the value of our assets or our efforts to dispose of
any assets in the future; our ability to obtain and maintain sufficient financing to provide liquidity to meet our business objectives, surety bonds, letters of credit and similar financing; our ability to comply with the
requirements of, and to service the indebtedness under, our debt facility agreements; our ability to pay dividends on our 7.75% Series A Cumulative Perpetual Preferred Stock; our ability to make interest payments on our
8.125% senior notes due 2026 and our 6.50% notes due 2026; the highly competitive nature of our businesses and our ability to win work, including identified project opportunities in our pipeline; general economic and
business conditions, including changes in interest rates and currency exchange rates; cancellations of and adjustments to backlog and the resulting impact from using backlog as an indicator of future earnings; our ability to
perform contracts on time and on budget, in accordance with the schedules and terms established by the applicable contracts with customers; failure by third-party subcontractors, partners or suppliers to perform their
obligations on time and as specified; delays initiated by our customers; our ability to successfully resolve claims by vendors for goods and services provided and claims by customers for items under warranty; our ability to
realize anticipated savings and operational benefits from our restructuring plans, and other cost-savings initiatives; our ability to successfully address productivity and schedule issues in our B&W Renewable, B&W
Environmental and B&W Thermal segments; our ability to successfully partner with third parties to win and execute contracts within our B&W Environmental, B&W Renewable and B&W Thermal segments; changes in our
effective tax rate and tax positions, including any limitation on our ability to use our net operating loss carryforwards and other tax assets; our ability to successfully manage research and development projects and costs,
including our efforts to successfully develop and commercialize new technologies and products; the operating risks normally incident to our lines of business, including professional liability, product liability, warranty and
other claims against us; difficulties we may encounter in obtaining regulatory or other necessary permits or approvals; changes in actuarial assumptions and market fluctuations that affect our net pension liabilities and
income; our ability to successfully compete with current and future competitors; our ability to negotiate and maintain good relationships with labor unions; changes in pension and medical expenses associated with our
retirement benefit programs; social, political, competitive and economic situations in foreign countries where we do business or seek new business; the impact of the ongoing conflict in Ukraine, the impact of the pandemic
or other similar global health crises, and the other factors specified and set forth under "Risk Factors" in our periodic reports filed with the Securities and Exchange Commission, including, without limitation, the risks
described in the Company's Annual Report on Form 10-K for the year ended December 31, 2022 under the caption "Risk Factors" and "Management's Discussion and Analysis of Financial Condition and Results of
Operations" (as applicable). These factors should be considered carefully, and B&W Enterprises cautions you not to place undue reliance on these forward-looking statements, which speak only as of the date of this
presentation, and undertakes no obligation to update or revise any forward-looking statement, except to the extent required by applicable law.
Non-GAAP Financial Measures
Adjusted EBITDA on a consolidated basis is a non-GAAP metric defined as the sum of the adjusted EBITDA for each of the segments, further adjusted for corporate allocations and research and development costs. At a
segment level, adjusted EBITDA presented is consistent with the way our chief operating decision maker reviews the results of operations and makes strategic decisions about the business and is calculated as earnings
before interest expense, tax, depreciation and amortization adjusted for items such as gains or losses arising from the sale of non-income producing assets, net pension benefits, restructuring costs, impairments, gains and
losses on debt extinguishment, costs related to financial consulting, research and development costs and other costs that may not be directly controllable by segment management and are not allocated to the segment. We
present consolidated Adjusted EBITDA because we believe it is useful to investors to help facilitate comparisons of our ongoing, operating performance before corporate overhead and other expenses not attributable to the
operating performance of our revenue generating segments. In this presentation, we also present certain targets for our adjusted EBITDA in the future; these targets are not intended as guidance regarding how we believe
the business will perform. We are unable to reconcile these targets to their GAAP counterparts without unreasonable effort and expense due to the aspirational nature of these targets. |

| © 2023 Babcock & Wilcox Enterprises, Inc. All rights reserved. BABCOCK & WILCOX ENTERPRISES, INC. 3
WE’RE A GLOBAL ENERGY LEADER
CREATING A BRIGHTER FUTURE
OUR PROVEN, BEST-IN-CLASS POWER
PRODUCTION
TECHNOLOGIES
SUPPORT THE
CREATION OF A
NET-ZERO FUTURE.
• From our first patent for a more efficient boiler to more than 17,000 patents since, we
continue to drive innovation and change
• Today, we are a globally recognized technology leader and innovator at the forefront of
the energy transition
• Helping utility and industrial customers with the technical challenges of moving from
current to future energy sources
• Delivering systems, parts and field services to help utility and industrial plants operate
more effectively and efficiently
• Our waste- and biomass-to-energy, carbon capture, hydrogen production and
environmental technologies support the reduction of greenhouse gases, including CO2
and methane, in an environmentally friendly way
Ensuring energy security for customers and the world
Making net-zero ambitions a reality today
Providing high quality and innovative technologies since 1867 |
| © 2023 Babcock & Wilcox Enterprises, Inc. All rights reserved. BABCOCK & WILCOX ENTERPRISES, INC. 4
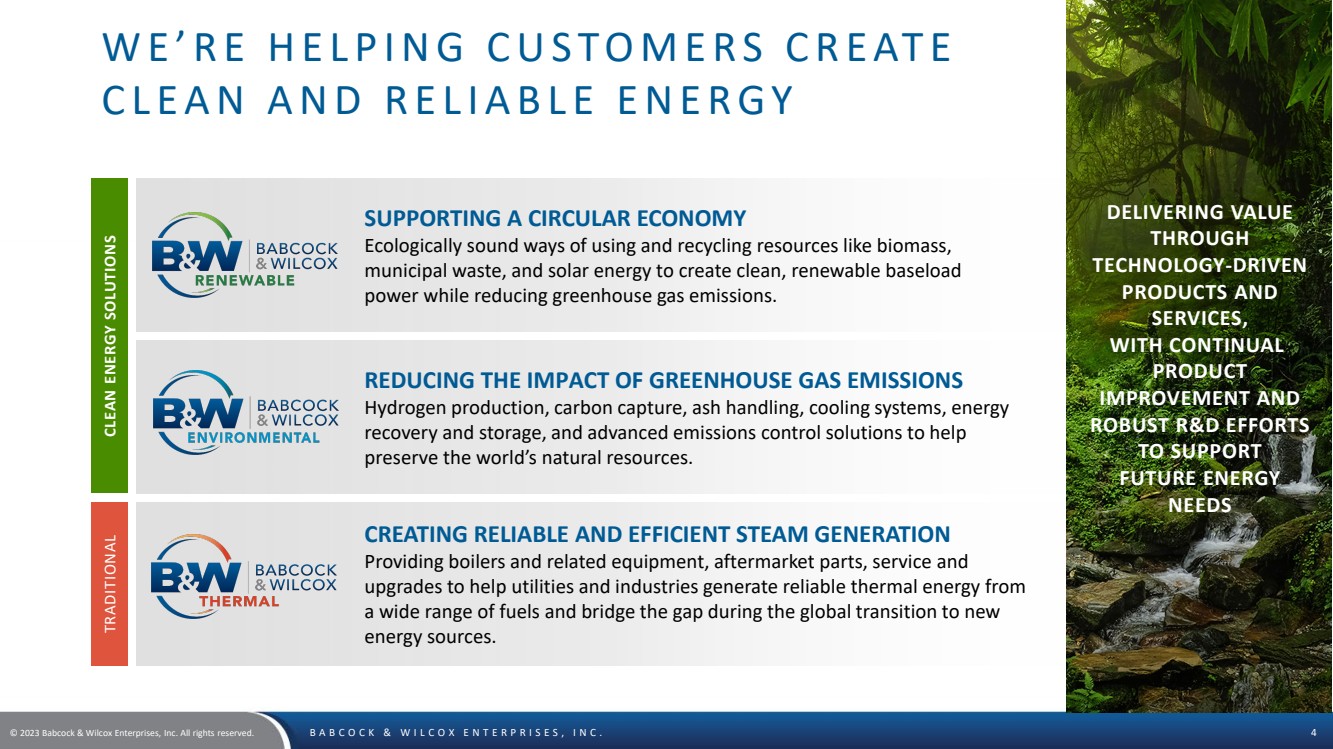
WE’RE HELPING CUSTOMERS CREATE
CLEAN AND RELIABLE ENERGY
SUPPORTING A CIRCULAR ECONOMY
Ecologically sound ways of using and recycling resources like biomass,
municipal waste, and solar energy to create clean, renewable baseload
power while reducing greenhouse gas emissions.
REDUCING THE IMPACT OF GREENHOUSE GAS EMISSIONS
Hydrogen production, carbon capture, ash handling, cooling systems, energy
recovery and storage, and advanced emissions control solutions to help
preserve the world’s natural resources.
CREATING RELIABLE AND EFFICIENT STEAM GENERATION
Providing boilers and related equipment, aftermarket parts, service and
upgrades to help utilities and industries generate reliable thermal energy from
a wide range of fuels and bridge the gap during the global transition to new
energy sources.
CLEAN ENERGY SOLUTIONS TRADITIONAL
DELIVERING VALUE
THROUGH
TECHNOLOGY-DRIVEN
PRODUCTS AND
SERVICES,
WITH CONTINUAL
PRODUCT
IMPROVEMENT AND
ROBUST R&D EFFORTS
TO SUPPORT
FUTURE ENERGY
NEEDS |
| © 2023 Babcock & Wilcox Enterprises, Inc. All rights reserved. BABCOCK & WILCOX ENTERPRISES, INC. 5
THE FOUNDATION OF OUR COMPANY
Our Vision:
Advancing energy and environmental solutions that bring power
and progress to our world.
Our Mission:
B&W delivers environmentally conscious, technology-driven solutions and services
to energy and industrial customers worldwide – safely, ethically and as promised.
Our Core Values:
Safety • Integrity • Quality • Respect • Agility |
| © 2023 Babcock & Wilcox Enterprises, Inc. All rights reserved. BABCOCK & WILCOX ENTERPRISES, INC. 6
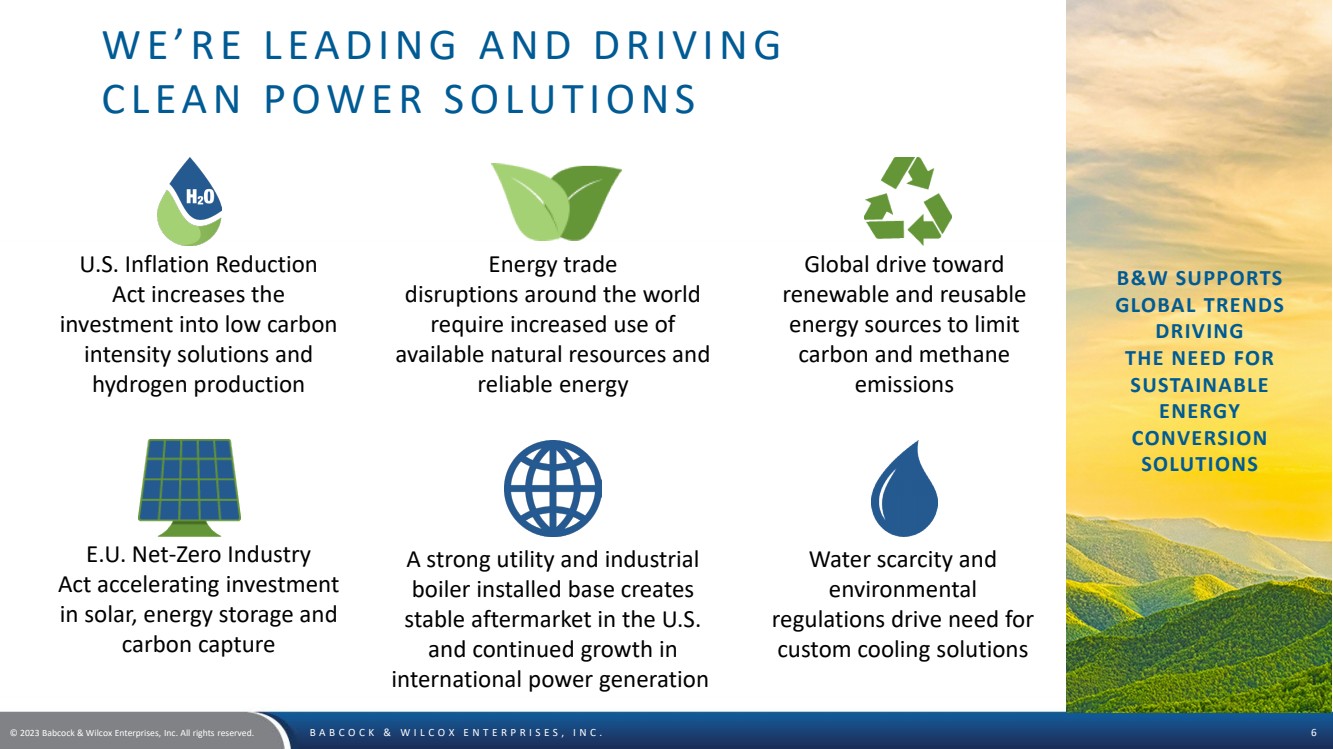
WE’RE LEADING AND DRIVING
CLEAN POWER SOLUTIONS
B&W SUPPORTS
GLOBAL TRENDS
DRIVING
THE NEED FOR
SUSTAINABLE
ENERGY
CONVERSION
SOLUTIONS
U.S. Inflation Reduction
Act increases the
investment into low carbon
intensity solutions and
hydrogen production
Energy trade
disruptions around the world
require increased use of
available natural resources and
reliable energy
Global drive toward
renewable and reusable
energy sources to limit
carbon and methane
emissions
E.U. Net-Zero Industry
Act accelerating investment
in solar, energy storage and
carbon capture
A strong utility and industrial
boiler installed base creates
stable aftermarket in the U.S.
and continued growth in
international power generation
Water scarcity and
environmental
regulations drive need for
custom cooling solutions |

| © 2023 Babcock & Wilcox Enterprises, Inc. All rights reserved. BABCOCK & WILCOX ENTERPRISES, INC. 7
WE’RE DRIVING GROWTH,
INNOVATION AND EXPANSION
CORE GROWTH
STRATEGIES
FOCUSED ON
DRIVING
INNOVATIVE
ENVIRONMENTAL,
RENEWABLE AND
ENERGY TRANSITION
TECHNOLOGIES,
GROWING
AFTERMARKET SALES
BY LEVERAGING THE
INSTALLED BASE,
AND EXPANDING
INTERNATIONALLY IN
KEY REGIONS
OPPORTUNITY
Meet the global need for carbon
reduction and greenhouse gas
reduction with patented renewable
waste-to-energy, biomass, hydrogen
production, solar and carbon-capture
solutions
INNOVATION
Provide best-in-class environmental
technologies across a broad array of
markets to meet growing environmental
regulations and climate goals
GROWTH
Leverage tailwinds created by
government tax incentives and global
climate investment strategies to drive
sales of innovative energy transition
technologies and services
EXPANSION
Utilize experienced sales, service and
business development teams in key
international regions to serve the
growing renewable, environmental and
thermal markets |

| © 2023 Babcock & Wilcox Enterprises, Inc. All rights reserved. BABCOCK & WILCOX ENTERPRISES, INC. 8
WE'RE LEVERAGING A VAST INSTALLED
BASE AND PROVEN TECHNOLOGIES
More than 500 waste-to-energy and biomass-to-energy units at 300+ facilities globally
(consuming over 61 million tonnes of waste per year) and a leader in plant availability
Serving utility, waste management, municipality and investment firm customers
Installed more than 200 MW of utility- and community-scale solar projects in North America
Large worldwide installed base of wet and dry scrubbers for SOx reduction, particulate control
equipment, NOx reduction technologies, and mercury control systems to meet environmental
regulations
Flue gas pre-treatment technologies for use with CO2 capture
Nearly 2,000 wet, dry and hybrid cooling system units (10,000+ cells) installed globally
More than 300 operating utility and industrial boiler units in the U.S. and nearly 200 operating
utility and industrial boiler units across 40 countries around the world
More than 5,000 industrial water-tube package boilers and other waste heat recovery products
installed in a variety of facilities
Average approximately 500,000 Boilermakers’ construction manhours per year over last five years
A VAST GLOBAL INSTALLATION OF B&W’S CORE TECHNOLOGIES AT UTILITY AND
INDUSTRIAL PLANTS CREATE LARGE GROWTH OPPORTUNITIES FOR PARTS, SERVICES
AND RETROFITS |
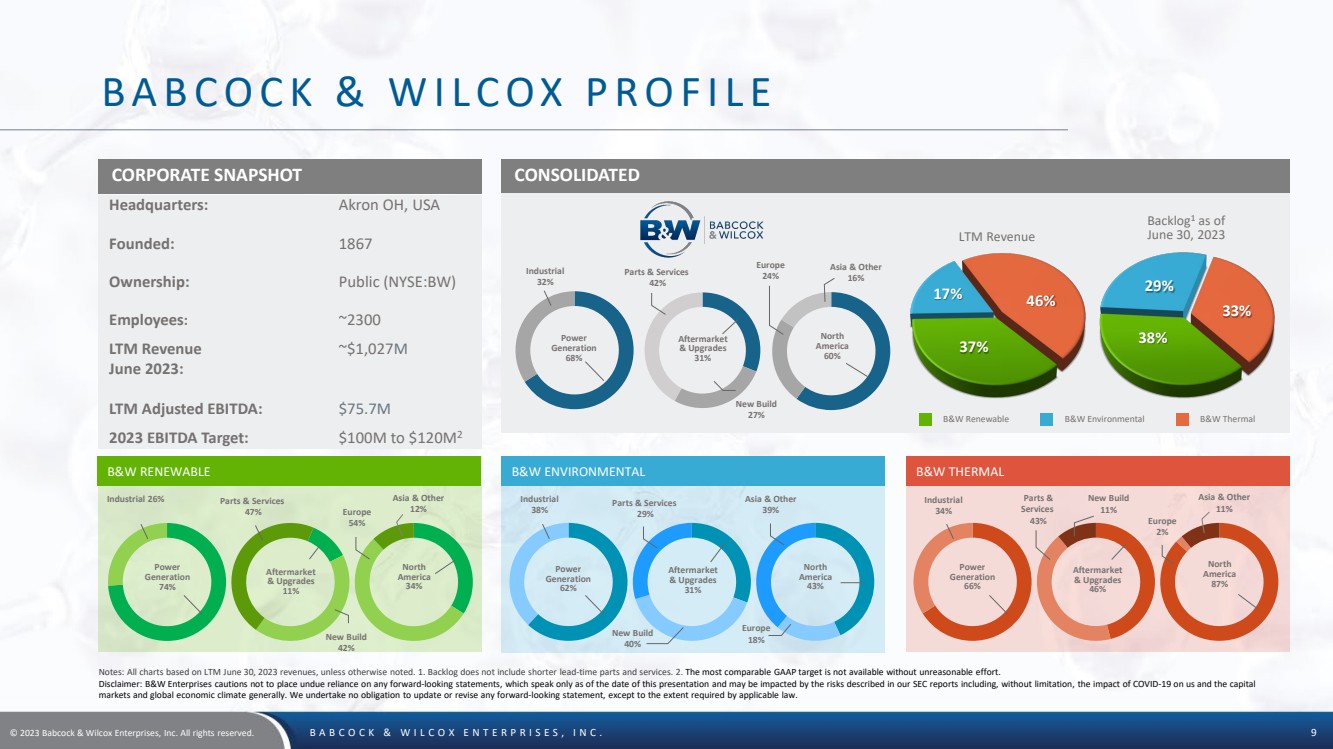
| © 2023 Babcock & Wilcox Enterprises, Inc. All rights reserved. BABCOCK & WILCOX ENTERPRISES, INC. 9
CORPORATE SNAPSHOT
BABCOCK & WILCOX PROFILE
Notes: All charts based on LTM June 30, 2023 revenues, unless otherwise noted. 1. Backlog does not include shorter lead-time parts and services. 2. The most comparable GAAP target is not available without unreasonable effort.
Disclaimer: B&W Enterprises cautions not to place undue reliance on any forward-looking statements, which speak only as of the date of this presentation and may be impacted by the risks described in our SEC reports including, without limitation, the impact of COVID-19 on us and the capital
markets and global economic climate generally. We undertake no obligation to update or revise any forward-looking statement, except to the extent required by applicable law.
Headquarters: Akron OH, USA
Founded: 1867
Ownership: Public (NYSE:BW)
Employees: ~2300
LTM Revenue
June 2023:
LTM Adjusted EBITDA:
~$1,027M
$75.7M
2023 EBITDA Target: $100M to $120M2
B&W RENEWABLE
Power
Generation
74%
Industrial 26%
Aftermarket
& Upgrades
11%
Parts & Services
47%
North
America
34%
Europe
54%
Asia & Other
12%
New Build
42%
B&W THERMAL
Industrial
34%
Power
Generation
66%
Aftermarket
& Upgrades
46%
Parts &
Services
43%
North
America
87%
Europe
2%
Asia & Other
11%
New Build
11%
B&W ENVIRONMENTAL
Industrial
38%
Power Generation
62%
Aftermarket
& Upgrades
31%
Parts & Services
29%
North
America
43%
Europe
18%
New Build
40%
Asia & Other
39%
CONSOLIDATED
37%
17% 46%
38%
29%
33%
Industrial
32%
Power Generation
68%
Aftermarket
& Upgrades
31%
Parts & Services
42%
New Build
27%
North
America
60%
Europe
24%
Asia & Other
16%
Backlog1 as of
June 30, 2023
B&W Renewable
LTM Revenue
B&W Environmental B&W Thermal |

| © 2023 Babcock & Wilcox Enterprises, Inc. All rights reserved. BABCOCK & WILCOX ENTERPRISES, INC. 1 0
60-70%
10-15%
15-25%
PIPELINE REVENUE
SPLIT 2023-2025
A SOLID PIPELINE OF
GLOBAL OPPORTUNITIES
Manufacturing
Service Facilities
Construction
Sales/Support
Future Sales/Support
Sales Reps
Future Sales Reps
Future Service Facilities
Americas APAC Europe ME/A
$1,808
$1,261 $1,555
$768
$ MILLIONS
B&W RENEWABLE
Americas APAC Europe ME/A
$1,051
$195
$1,101
$121
$ MILLIONS
B&W ENVIRONMENTAL
Americas APAC Europe ME/A
$695
$161 $17
$297
$ MILLIONS
B&W THERMAL
3-YEAR PIPELINE
Total pipeline more than
$9 billion over the next
3 years excluding parts
and services
Disclaimer: B&W Enterprises cautions not to place undue reliance on any forward-looking statements, which speak only as of the date of this presentation and may be
impacted by the risks described in our SEC reports including, without limitation, the impact of COVID-19 on us and the capital markets and global economic climate
generally. We undertake no obligation to update or revise any forward-looking statement, except to the extent required by applicable law.
2023-2025
Addressable Market
Europe More than $8B
2023-2025
Addressable Market
Americas
Solar: More than $5B
Other: More than $8B
2023-2025
Addressable Market
Asia-Pacific
More than $8B
A WIDE FOOTPRINT AND ONGOING EXPANSION POSITIONS
B&W TO LEVERAGE MARKET TRENDS AROUND THE WORLD
2023-2025
Addressable Market
Middle East & Africa
More than $4B
Total
$5.4B
Total
$2.5B
Total
$1.2B |

| © 2023 Babcock & Wilcox Enterprises, Inc. All rights reserved. BABCOCK & WILCOX ENTERPRISES, INC. 1 1
GLOBAL ANNUAL CAPITAL INVESTMENT IN
CARBON CAPTURE AND HYDROGEN IS GROWING
Trillions USD (2019)
0
1
2
3
4
5
2016-20 2030 2040 2050
By technology area
Technology area
Other
Fossil fuels
CCUS
Hydrogen
Electricity system
Electrification
Efficiency
Other renewables
Bioenergy
ANNUAL AVERAGE CAPITAL INVESTMENT IN THE NET-ZERO EMISSIONS (NZE) SCENARIO
Source: IEA
$224B
$150B
$158B
$390B
$240B
$428B |
| © 2023 Babcock & Wilcox Enterprises, Inc. All rights reserved. BABCOCK & WILCOX ENTERPRISES, INC. 1 2
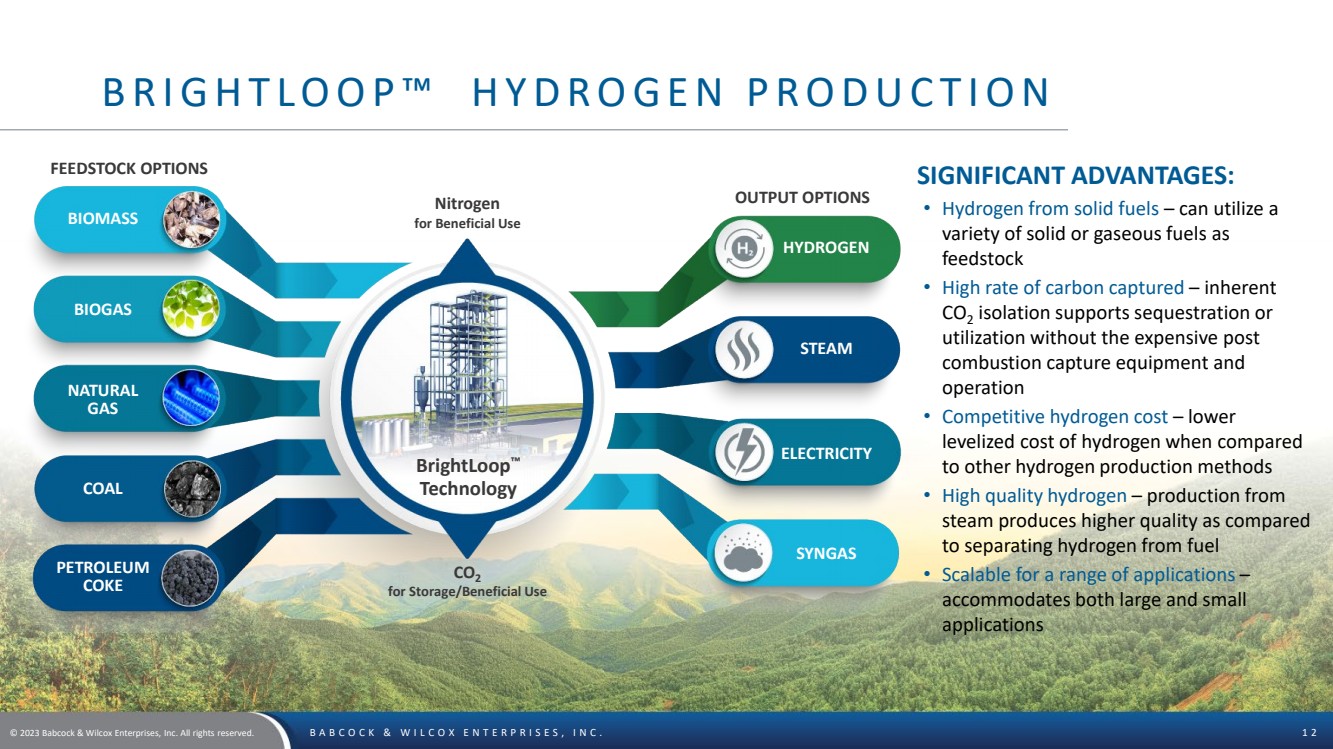
BRIGHTLOOP ™ HYDROGEN PRODUCTION
SIGNIFICANT ADVANTAGES:
• Hydrogen from solid fuels – can utilize a
variety of solid or gaseous fuels as
feedstock
• High rate of carbon captured – inherent
CO2 isolation supports sequestration or
utilization without the expensive post
combustion capture equipment and
operation
• Competitive hydrogen cost – lower
levelized cost of hydrogen when compared
to other hydrogen production methods
• High quality hydrogen – production from
steam produces higher quality as compared
to separating hydrogen from fuel
• Scalable for a range of applications –
accommodates both large and small
applications
BIOMASS
FEEDSTOCK OPTIONS
OUTPUT OPTIONS Nitrogen
for Beneficial Use
BIOGAS
COAL
NATURAL
GAS
STEAM
SYNGAS
HYDROGEN
ELECTRICITY
PETROLEUM
COKE
CO2
for Storage/Beneficial Use
BrightLoop™
Technology |
| © 2023 Babcock & Wilcox Enterprises, Inc. All rights reserved. BABCOCK & WILCOX ENTERPRISES, INC. 1 3
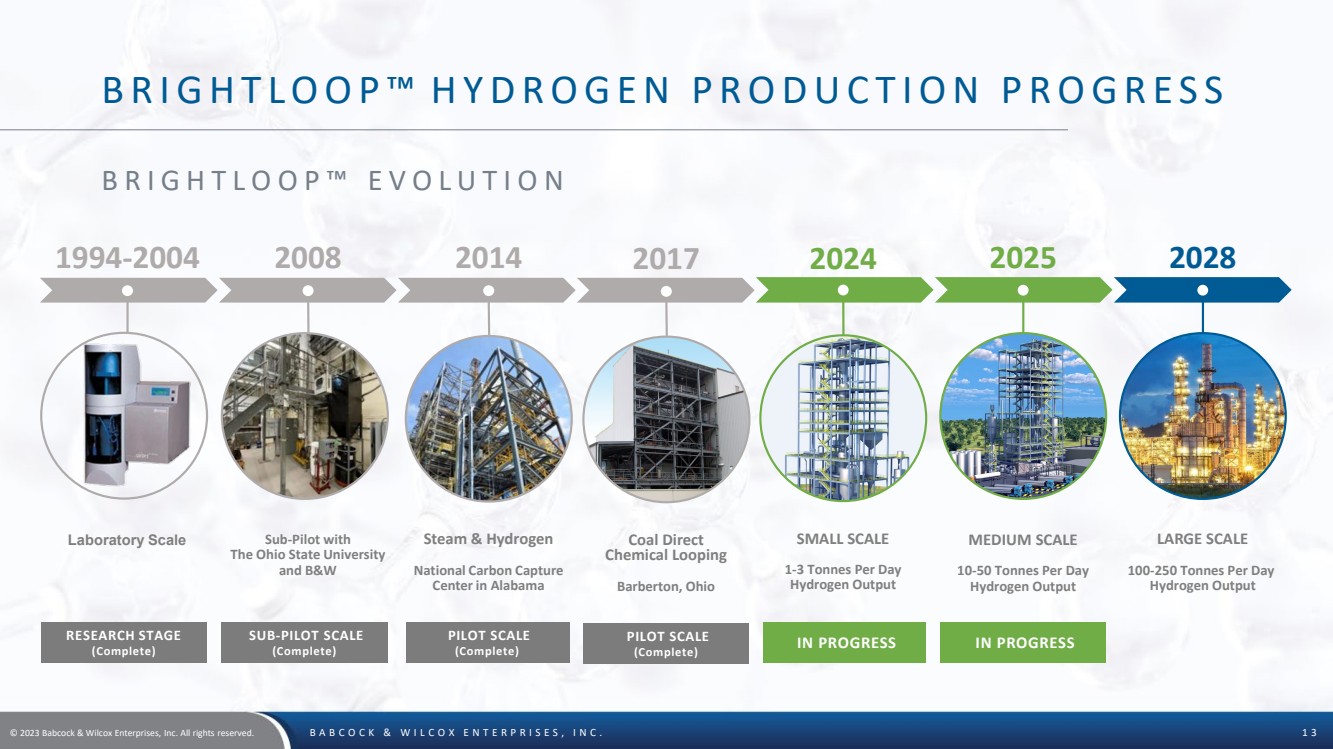
BRIGHTLOOP ™ HYDROGEN PRODUCTION PROGRESS
BRIGHTLOOP™ EVOLUTION
Sub-Pilot with
The Ohio State University
and B&W
MEDIUM SCALE
10-50 Tonnes Per Day
Hydrogen Output
LARGE SCALE
100-250 Tonnes Per Day
Hydrogen Output
SUB-PILOT SCALE
(Complete)
2008 2025 2028
IN PROGRESS
Laboratory Scale
RESEARCH STAGE
(Complete)
1994-2004
PILOT SCALE
(Complete)
Steam & Hydrogen
National Carbon Capture
Center in Alabama
2014
SMALL SCALE
1-3 Tonnes Per Day
Hydrogen Output
IN PROGRESS
2024
PILOT SCALE
(Complete)
Coal Direct
Chemical Looping
Barberton, Ohio
2017 |
| © 2023 Babcock & Wilcox Enterprises, Inc. All rights reserved. BABCOCK & WILCOX ENTERPRISES, INC. 1 4
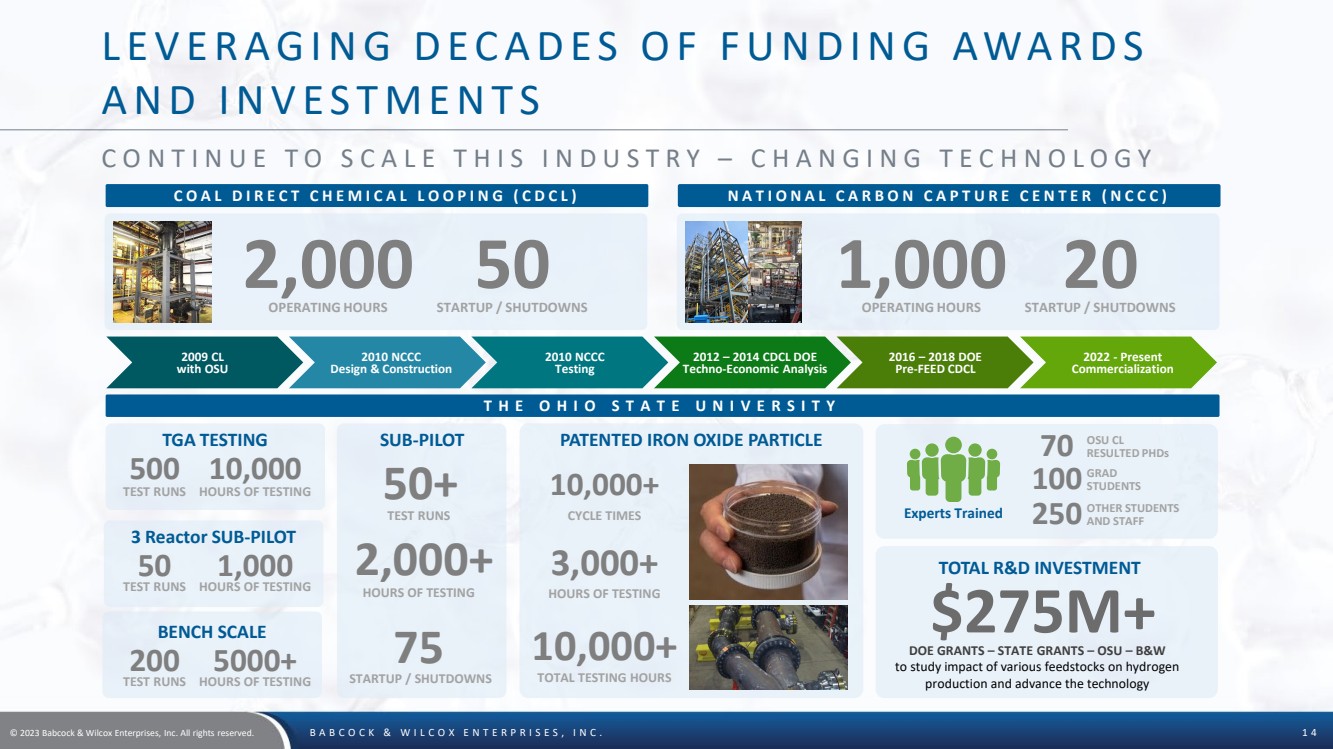
LEVERAGING DECADES OF FUNDING AWARDS
AND INVESTMENTS
CONTINUE TO SCALE THIS INDUSTRY – CHANGING TECHNOLOGY
COAL DIRECT CHEMICAL LOOPING (CDCL) NATIONAL CARBON CAPTURE CENTER (NCCC)
THE OHIO STATE UNIVERSITY
OPERATING HOURS
2,000
STARTUP / SHUTDOWNS
50
OPERATING HOURS
1,000
STARTUP / SHUTDOWNS
20
$275M+
TGA TESTING PATENTED IRON OXIDE PARTICLE
TEST RUNS HOURS OF TESTING
500 10,000
BENCH SCALE
TEST RUNS HOURS OF TESTING
200 5000+
3 Reactor SUB-PILOT
TEST RUNS HOURS OF TESTING
50 1,000
SUB-PILOT
TEST RUNS
50+
HOURS OF TESTING
2,000+
STARTUP / SHUTDOWNS
75
TOTAL R&D INVESTMENT
CYCLE TIMES
10,000+
HOURS OF TESTING
3,000+
TOTAL TESTING HOURS
10,000+ DOE GRANTS – STATE GRANTS – OSU – B&W
to study impact of various feedstocks on hydrogen
production and advance the technology
OSU CL
RESULTED PHDs
GRAD
STUDENTS
70
100
OTHER STUDENTS 250 AND STAFF Experts Trained
2016 – 2018 DOE
Pre-FEED CDCL
2009 CL
with OSU
2010 NCCC
Testing
2012 – 2014 CDCL DOE
Techno-Economic Analysis
2010 NCCC
Design & Construction
2022 - Present
Commercialization |

| © 2023 Babcock & Wilcox Enterprises, Inc. All rights reserved. BABCOCK & WILCOX ENTERPRISES, INC. 1 5
UNLOCKING FUTURE REVENUE POTENTIAL OF
BRIGHTLOOP AND POSITION BASED ON MARKET
WITH SIGNIFICANT GROWTH OF HYDROGEN PROJECTED
Achieving only 1%
market share of a
$130-220B market
3-5 Large Unit Projects
2-4 Medium Unit Projects
3-8 Small Unit Projects annual revenues at
25%+ Gross Margin
B&W Project Timeline:
• 2024 – Producing hydrogen from the first small unit
• 2025 – Producing hydrogen from the first medium unit
• 2030 – Booking multiple units of each size per year
~$1 Billion
Target Market Share Assumed Mix of Projects 2030 Approximate Revenue
*Market Data from IEA Net Zero by 2050 A Roadmap
for the Global Energy Sector
B&W currently has 8 projects in pipeline which alone total over $1Billion |
| © 2023 Babcock & Wilcox Enterprises, Inc. All rights reserved. BABCOCK & WILCOX ENTERPRISES, INC. 1 6
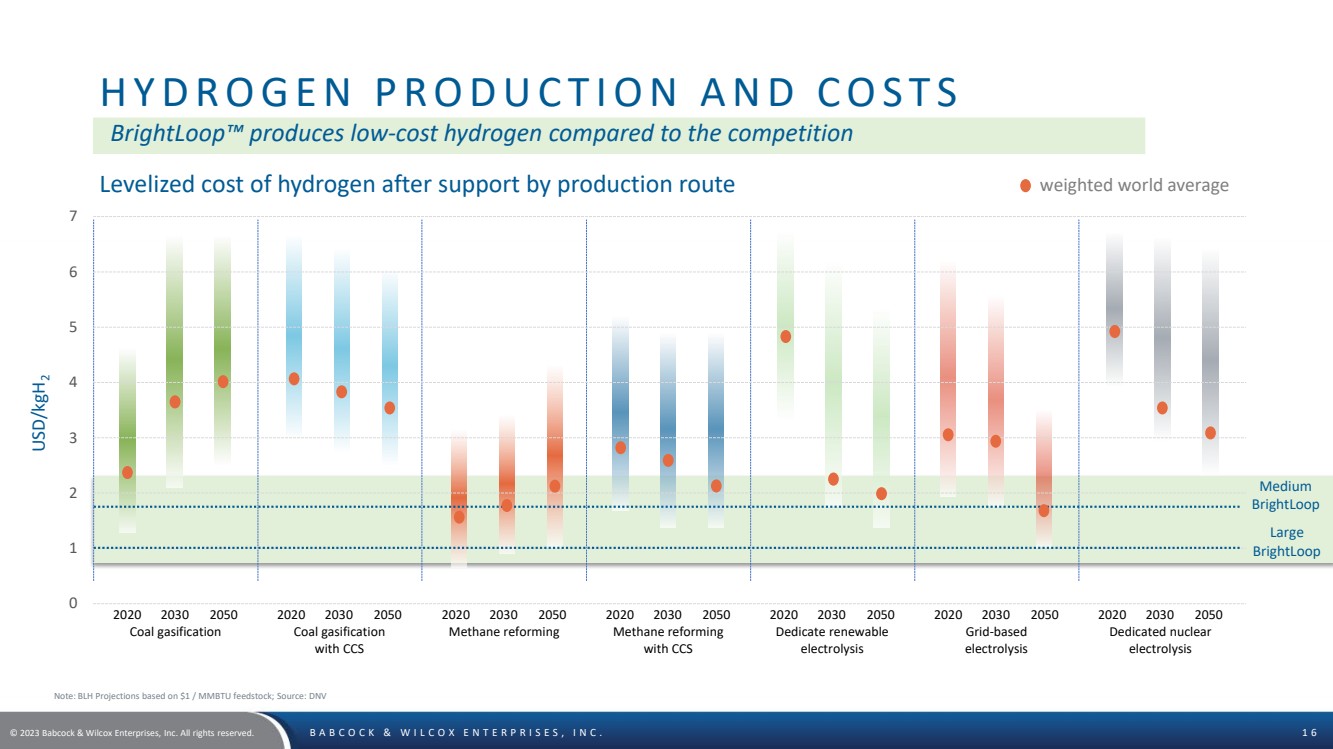
HYDROGEN PRODUCTION AND COSTS
Note: BLH Projections based on $1 / MMBTU feedstock; Source: DNV
2020 2030 2050
Coal gasification
2020 2030 2050
Coal gasification
with CCS
2020 2030 2050
Methane reforming
2020 2030 2050
Methane reforming
with CCS
2020 2030 2050
Dedicate renewable
electrolysis
2020 2030 2050
Grid-based
electrolysis
2020 2030 2050
Dedicated nuclear
electrolysis
weighted world average
0
1
2
3
4
5
6
7
Levelized cost of hydrogen after support by production route
USD/kgH2
Medium
BrightLoop
Large
BrightLoop
BrightLoop™ produces low-cost hydrogen compared to the competition |
| © 2023 Babcock & Wilcox Enterprises, Inc. All rights reserved. BABCOCK & WILCOX ENTERPRISES, INC. 1 7
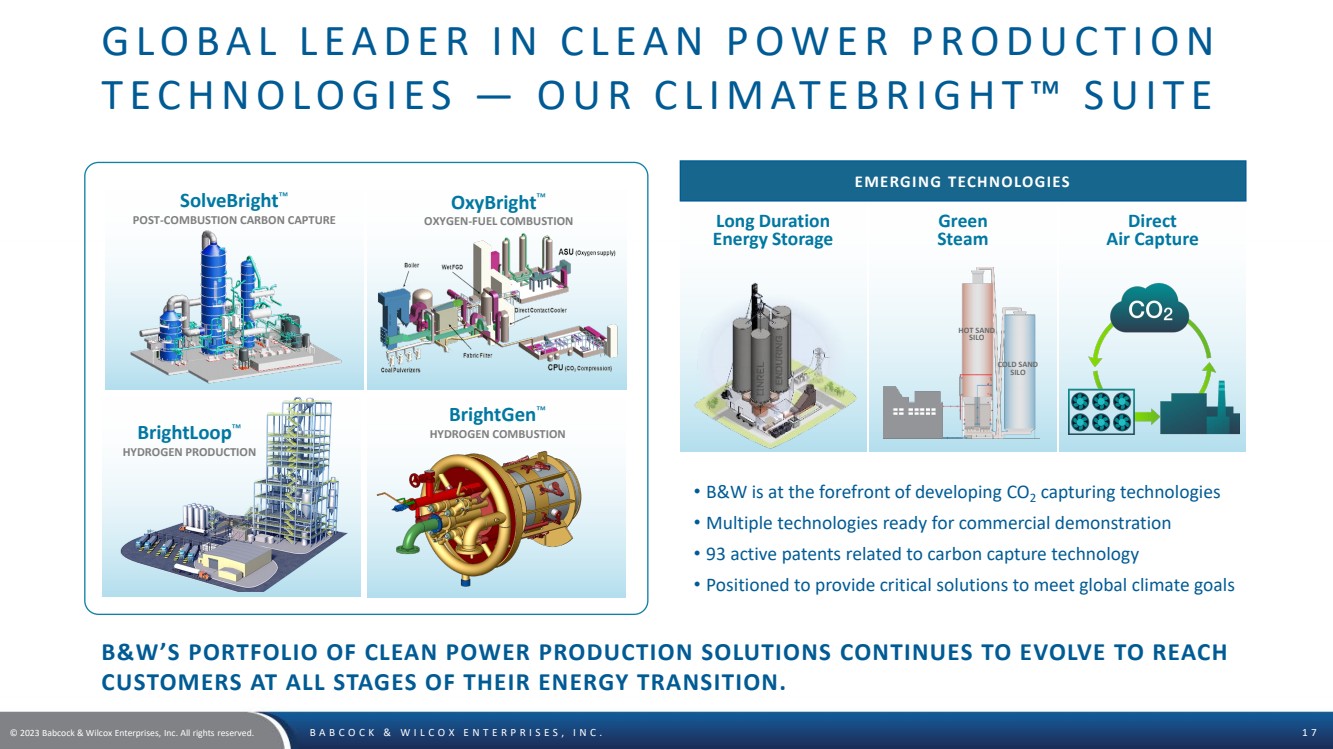
GLOBAL LEADER IN CLEAN POWER PRODUCTION
TECHNOLOGIES — OUR CLIMATEBRIGHT ™ SUITE
• B&W is at the forefront of developing CO2 capturing technologies
• Multiple technologies ready for commercial demonstration
• 93 active patents related to carbon capture technology
• Positioned to provide critical solutions to meet global climate goals
BrightLoop™
HYDROGEN PRODUCTION
OxyBright™
OXYGEN-FUEL COMBUSTION
SolveBright™
POST-COMBUSTION CARBON CAPTURE
BrightGen™
HYDROGEN COMBUSTION
Long Duration
Energy Storage
Green
Steam
Direct
Air Capture
HOT SAND SILO
COLD SAND SILO
EMERGING TECHNOLOGIES
B&W’S PORTFOLIO OF CLEAN POWER PRODUCTION SOLUTIONS CONTINUES TO EVOLVE TO REACH
CUSTOMERS AT ALL STAGES OF THEIR ENERGY TRANSITION. |

| © 2023 Babcock & Wilcox Enterprises, Inc. All rights reserved. BABCOCK & WILCOX ENTERPRISES, INC. 1 8
INFLATION REDUCTION ACT
FOR CLIMATEBRIGHT ™
Clean Hydrogen Production Tax Credit (PTC): 45V
• New 10-year incentive for clean hydrogen production with four tiers and a
maximum of 4 kilograms of CO2 equivalent per kilogram of hydrogen
• Green hydrogen awards: $3/kg
Carbon Capture and Sequestration Tax Credit: 45Q
• Increases the tax credits, lowers the threshold to be applicable, and adds direct air
capture making carbon capture affordable
• CO2 increases to $85/ton and DAC increases to $180/ton; 12-year term
Clean Electricity Investment Tax Credit (ITC): 48C
• New, tech-neutral ITC replaces Energy ITC after 2024, emissions-based and flexible
between clean technologies
• Renewable energy offsets CapEx at 30%, with potential for multiple 10-20% bonuses
Clean energy wins
with the Inflation
Reduction Act,
propelling hydrogen
production and
carbon reduction
markets forward,
creating further
opportunities for
ClimateBright
solutions |
| © 2023 Babcock & Wilcox Enterprises, Inc. All rights reserved. BABCOCK & WILCOX ENTERPRISES, INC. 1 9
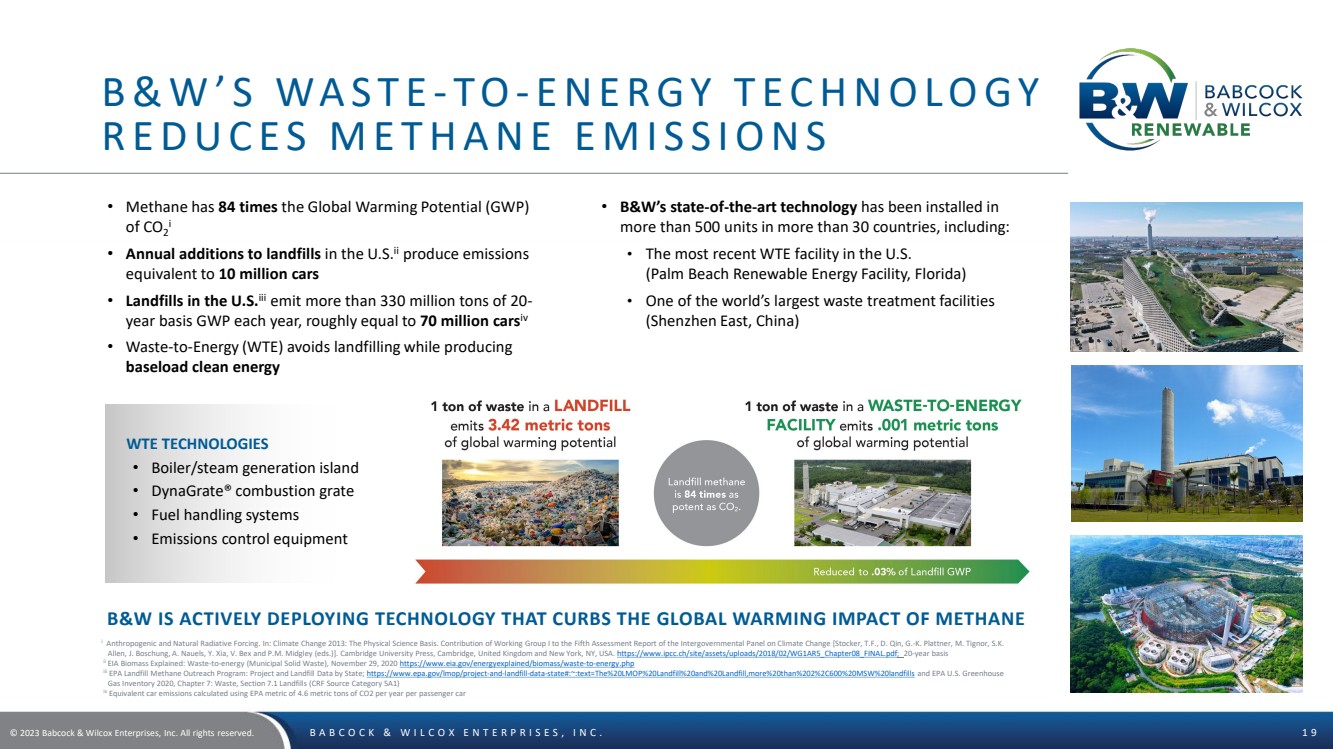
B&W’S WASTE - TO- ENERGY TECHNOLOGY
REDUCES METHANE EMISSIONS
• Methane has 84 times the Global Warming Potential (GWP)
of CO2
i
• Annual additions to landfills in the U.S.ii produce emissions
equivalent to 10 million cars
• Landfills in the U.S.iii emit more than 330 million tons of 20-
year basis GWP each year, roughly equal to 70 million carsiv
• Waste-to-Energy (WTE) avoids landfilling while producing
baseload clean energy
WTE TECHNOLOGIES
• Boiler/steam generation island
• DynaGrate® combustion grate
• Fuel handling systems
• Emissions control equipment
• B&W’s state-of-the-art technology has been installed in
more than 500 units in more than 30 countries, including:
• The most recent WTE facility in the U.S.
(Palm Beach Renewable Energy Facility, Florida)
• One of the world’s largest waste treatment facilities
(Shenzhen East, China)
i Anthropogenic and Natural Radiative Forcing. In: Climate Change 2013: The Physical Science Basis. Contribution of Working Group I to the Fifth Assessment Report of the Intergovernmental Panel on Climate Change [Stocker, T.F., D. Qin, G.-K. Plattner, M. Tignor, S.K.
Allen, J. Boschung, A. Nauels, Y. Xia, V. Bex and P.M. Midgley (eds.)]. Cambridge University Press, Cambridge, United Kingdom and New York, NY, USA. https://www.ipcc.ch/site/assets/uploads/2018/02/WG1AR5_Chapter08_FINAL.pdf; 20-year basis ii EIA Biomass Explained: Waste-to-energy (Municipal Solid Waste), November 29, 2020 https://www.eia.gov/energyexplained/biomass/waste-to-energy.php iii EPA Landfill Methane Outreach Program: Project and Landfill Data by State; https://www.epa.gov/lmop/project-and-landfill-data-state#:~:text=The%20LMOP%20Landfill%20and%20Landfill,more%20than%202%2C600%20MSW%20landfills and EPA U.S. Greenhouse
Gas Inventory 2020, Chapter 7: Waste, Section 7.1 Landfills (CRF Source Category 5A1)
iv Equivalent car emissions calculated using EPA metric of 4.6 metric tons of CO2 per year per passenger car
B&W IS ACTIVELY DEPLOYING TECHNOLOGY THAT CURBS THE GLOBAL WARMING IMPACT OF METHANE |

| © 2023 Babcock & Wilcox Enterprises, Inc. All rights reserved. BABCOCK & WILCOX ENTERPRISES, INC. 2 0
GLOBAL LEADER IN COMPREHENSIVE
WASTE - TO- ENERGY SOLUTIONS
FIELD
SERVICES
COMPONENT &
SYSTEM UPGRADES CONTROL SYSTEMS REPLACEMENT &
SPARE PARTS
RENEWABLE
SERVICES
DynaGrate® combustion grate
DynaDischarger® ash removal
Water-cooled wear zones and Inconel® corrosion protection
VoluMix® system for
improved combustion
Fabric filter baghouse
Wet scrubber with ADIOX®
including energy recovery
On-line boiler washing system Selective non-catalytic
reduction (SNCR) NOx control
DynaFeeder® waste fuel
feeder system
Energy storage systems
Carbon capture solutions
Dry cooling systems |

| © 2023 Babcock & Wilcox Enterprises, Inc. All rights reserved. BABCOCK & WILCOX ENTERPRISES, INC. 2 1
BIOENERGY WITH CARBON CAPTURE
AND SEQUESTRATION ( BECCS )
OxyBright with B&W’s biomass-fired BFB
boiler produces carbon negative electricity
with a -2,500gCO2e/kWh carbon intensity
OxyBright with B&W’s WtE solution
could produce carbon negative
electricity with a -1,000 gCO2e/kWh
carbon intensity
Our negative carbon intensity (-2500
gCO2e/kWh) is nearly seven times more
negative than the US grid is positive
(+373 gCO2e/kWh) |

| © 2023 Babcock & Wilcox Enterprises, Inc. All rights reserved. BABCOCK & WILCOX ENTERPRISES, INC. 2 2
FINANCIAL INFORMATION |
| © 2023 Babcock & Wilcox Enterprises, Inc. All rights reserved. BABCOCK & WILCOX ENTERPRISES, INC. 2 3
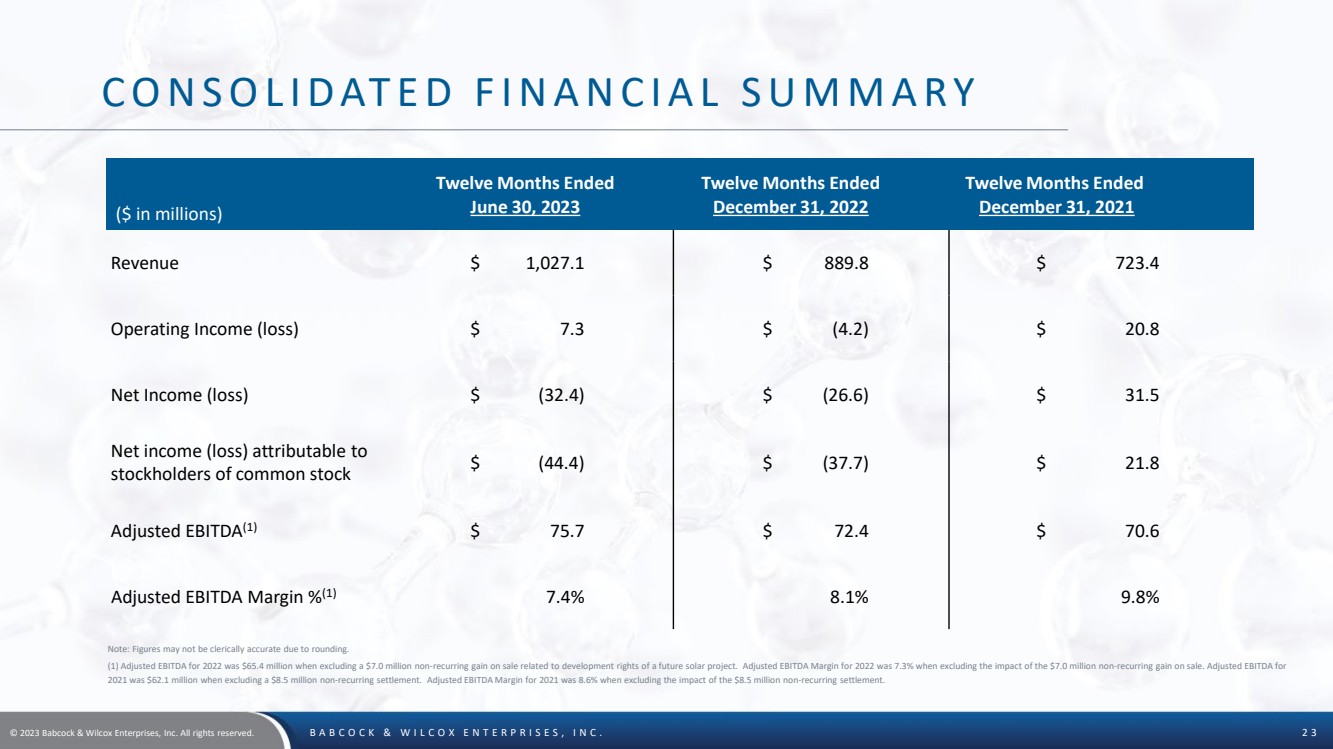
CONSOLIDATED FINANCIAL SUMMARY
($ in millions)
Twelve Months Ended
June 30, 2023
Twelve Months Ended
December 31, 2022
Twelve Months Ended
December 31, 2021
Revenue $ 1,027.1 $ 889.8 $ 723.4
Operating Income (loss) $ 7.3 $ (4.2) $ 20.8
Net Income (loss) $ (32.4) $ (26.6) $ 31.5
Net income (loss) attributable to
stockholders of common stock $ (44.4) $ (37.7) $ 21.8
Adjusted EBITDA(1) $ 75.7 $ 72.4 $ 70.6
Adjusted EBITDA Margin %(1) 7.4% 8.1% 9.8%
Note: Figures may not be clerically accurate due to rounding.
(1) Adjusted EBITDA for 2022 was $65.4 million when excluding a $7.0 million non-recurring gain on sale related to development rights of a future solar project. Adjusted EBITDA Margin for 2022 was 7.3% when excluding the impact of the $7.0 million non-recurring gain on sale. Adjusted EBITDA for
2021 was $62.1 million when excluding a $8.5 million non-recurring settlement. Adjusted EBITDA Margin for 2021 was 8.6% when excluding the impact of the $8.5 million non-recurring settlement. |
| © 2023 Babcock & Wilcox Enterprises, Inc. All rights reserved. BABCOCK & WILCOX ENTERPRISES, INC. 2 4
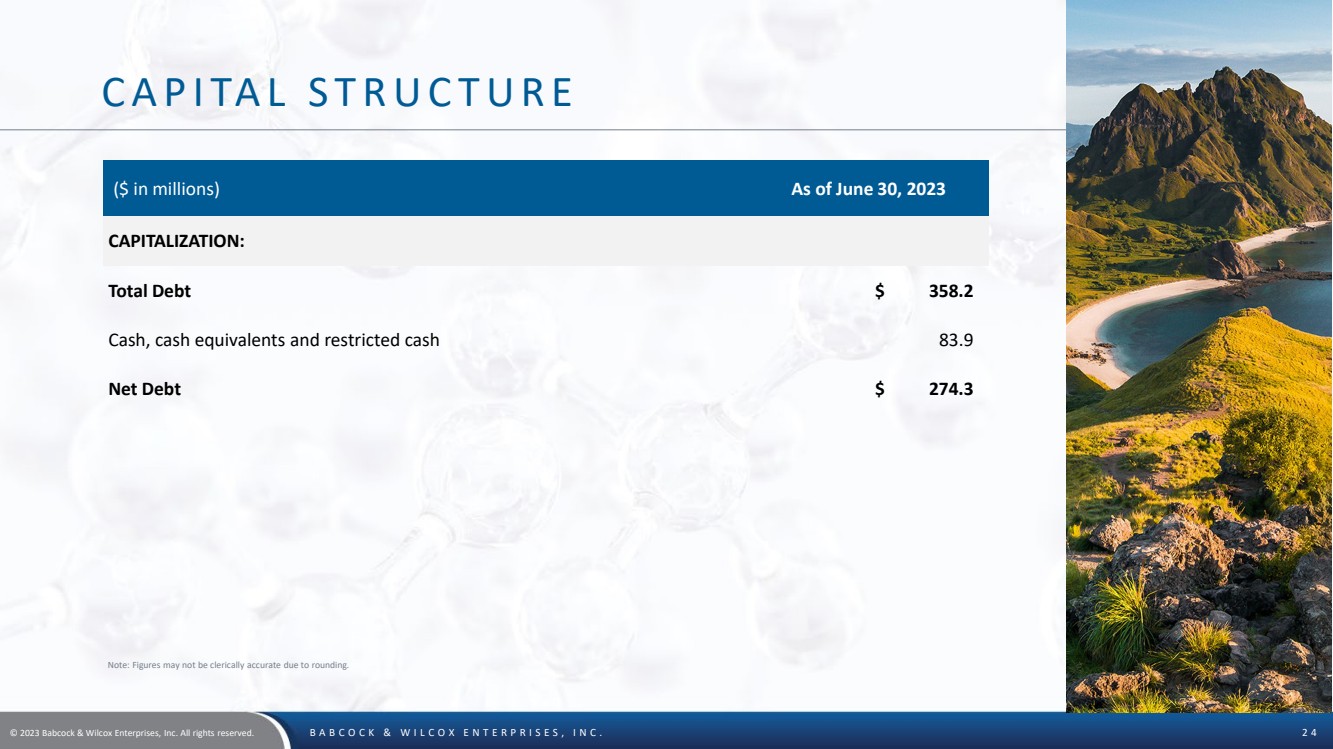
CAPITAL STRUCTURE
($ in millions) As of June 30, 2023
CAPITALIZATION:
Total Debt $ 358.2
Cash, cash equivalents and restricted cash 83.9
Net Debt $ 274.3
Note: Figures may not be clerically accurate due to rounding. |

| © 2023 Babcock & Wilcox Enterprises, Inc. All rights reserved. BABCOCK & WILCOX ENTERPRISES, INC. 2 5
APPENDIX |
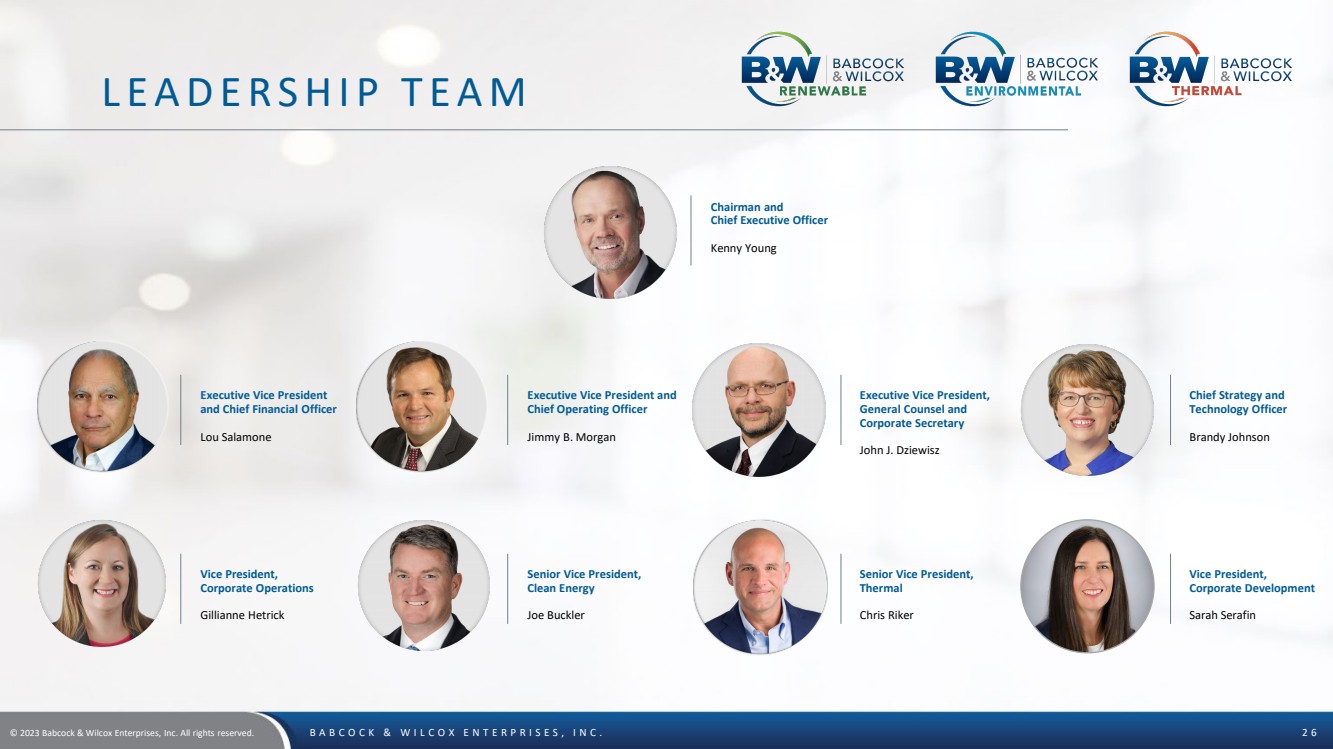
| © 2023 Babcock & Wilcox Enterprises, Inc. All rights reserved. BABCOCK & WILCOX ENTERPRISES, INC. 2 6
LEADERSHIP TEAM
Chairman and
Chief Executive Officer
Kenny Young
Executive Vice President
and Chief Financial Officer
Lou Salamone
Executive Vice President and
Chief Operating Officer
Jimmy B. Morgan
Executive Vice President,
General Counsel and
Corporate Secretary
John J. Dziewisz
Chief Strategy and
Technology Officer
Brandy Johnson
Vice President,
Corporate Operations
Gillianne Hetrick
Senior Vice President,
Clean Energy
Joe Buckler
Senior Vice President,
Thermal
Chris Riker
Vice President,
Corporate Development
Sarah Serafin |

| © 2023 Babcock & Wilcox Enterprises, Inc. All rights reserved. BABCOCK & WILCOX ENTERPRISES, INC. 2 7
CORPORATE GOVERNANCE
Joseph Tato Rebecca Stahl
Chairman and
Chief Executive Officer
Kenny Young
Henry Bartoli
BOARD OF DIRECTORS
Alan Howe Philip Moeller
Peter O’Keefe Phillip Piddington
Homaira Akbari Rod O’Connor
ADVISORY BOARD
Eric Powell |
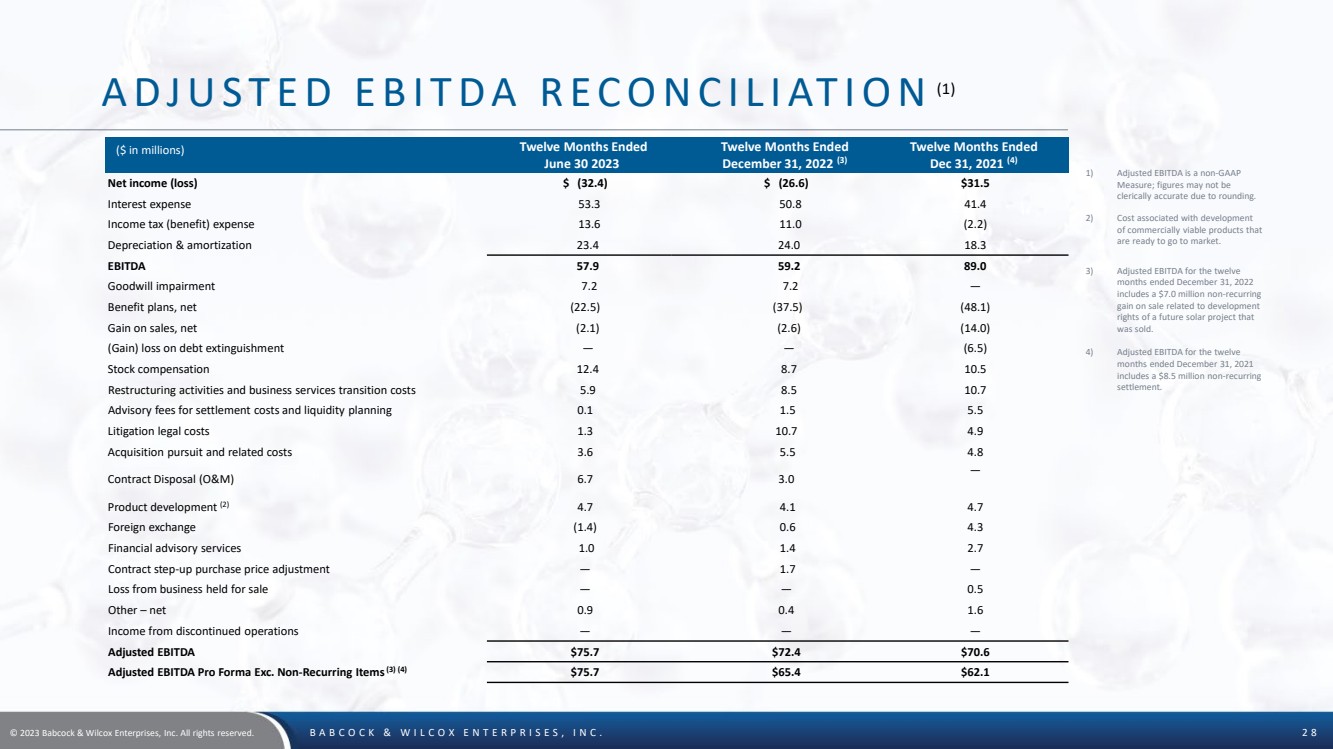
| © 2023 Babcock & Wilcox Enterprises, Inc. All rights reserved. BABCOCK & WILCOX ENTERPRISES, INC. 2 8
ADJUSTED EBITDA RECONCILIATION (1)
($ in millions) Twelve Months Ended
June 30 2023
Twelve Months Ended
December 31, 2022 (3)
Twelve Months Ended
Dec 31, 2021 (4)
Net income (loss) $ (32.4) $ (26.6) $31.5
Interest expense 53.3 50.8 41.4
Income tax (benefit) expense 13.6 11.0 (2.2)
Depreciation & amortization 23.4 24.0 18.3
EBITDA 57.9 59.2 89.0
Goodwill impairment 7.2 7.2 —
Benefit plans, net (22.5) (37.5) (48.1)
Gain on sales, net (2.1) (2.6) (14.0)
(Gain) loss on debt extinguishment — — (6.5)
Stock compensation 12.4 8.7 10.5
Restructuring activities and business services transition costs 5.9 8.5 10.7
Advisory fees for settlement costs and liquidity planning 0.1 1.5 5.5
Litigation legal costs 1.3 10.7 4.9
Acquisition pursuit and related costs 3.6 5.5 4.8
Contract Disposal (O&M) 6.7 3.0 —
Product development (2) 4.7 4.1 4.7
Foreign exchange (1.4) 0.6 4.3
Financial advisory services 1.0 1.4 2.7
Contract step-up purchase price adjustment — 1.7 —
Loss from business held for sale — — 0.5
Other – net 0.9 0.4 1.6
Income from discontinued operations — — —
Adjusted EBITDA $75.7 $72.4 $70.6
Adjusted EBITDA Pro Forma Exc. Non-Recurring Items(3) (4) $75.7 $65.4 $62.1
1) Adjusted EBITDA is a non-GAAP
Measure; figures may not be
clerically accurate due to rounding.
2) Cost associated with development
of commercially viable products that
are ready to go to market.
3)
4)
Adjusted EBITDA for the twelve
months ended December 31, 2022
includes a $7.0 million non-recurring
gain on sale related to development
rights of a future solar project that
was sold.
Adjusted EBITDA for the twelve
months ended December 31, 2021
includes a $8.5 million non-recurring
settlement. |

| © 2023 Babcock & Wilcox Enterprises, Inc. All rights reserved. BABCOCK & WILCOX ENTERPRISES, INC. 2 9
KEY TECHNOLOGIES AND CAPABILITIES |
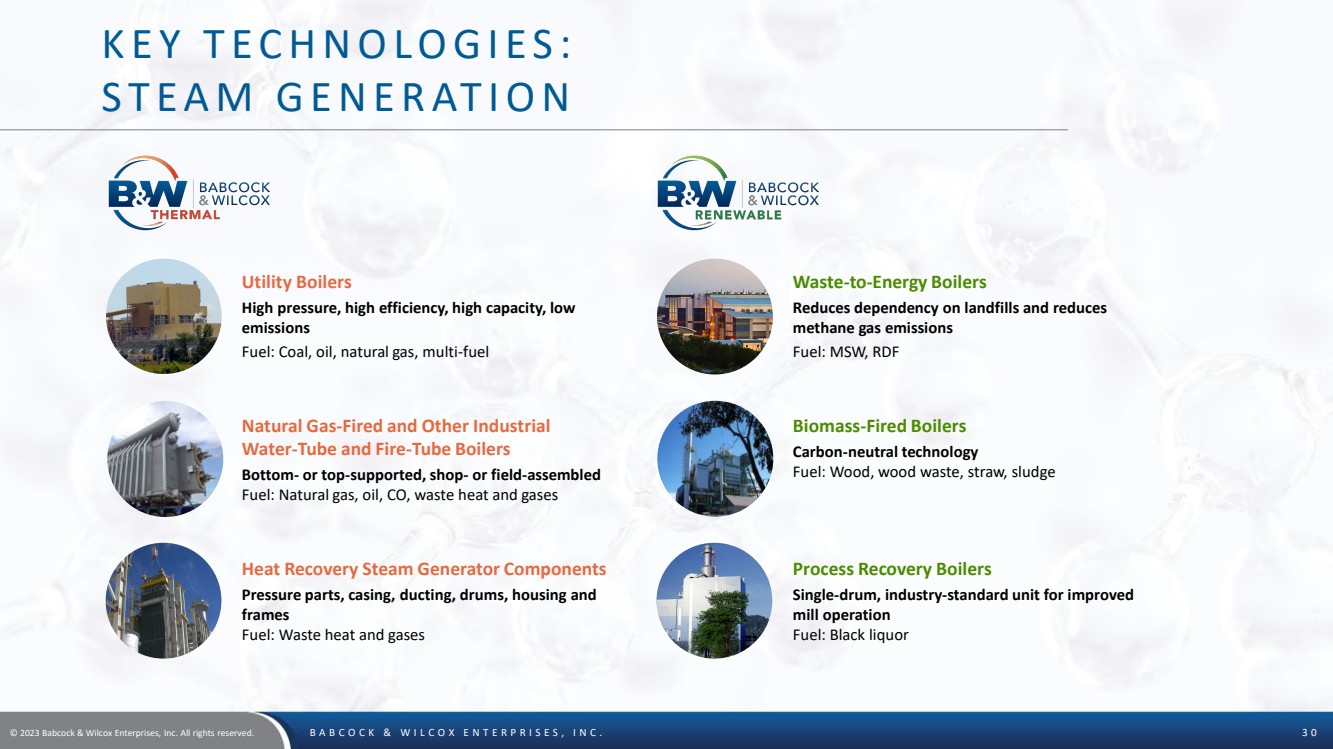
| © 2023 Babcock & Wilcox Enterprises, Inc. All rights reserved. BABCOCK & WILCOX ENTERPRISES, INC. 3 0
KEY TECHNOLOGIES:
STEAM GENERATION
Utility Boilers
High pressure, high efficiency, high capacity, low
emissions
Fuel: Coal, oil, natural gas, multi-fuel
Natural Gas-Fired and Other Industrial
Water-Tube and Fire-Tube Boilers
Bottom- or top-supported, shop- or field-assembled
Fuel: Natural gas, oil, CO, waste heat and gases
Heat Recovery Steam Generator Components
Pressure parts, casing, ducting, drums, housing and
frames
Fuel: Waste heat and gases
Waste-to-Energy Boilers
Reduces dependency on landfills and reduces
methane gas emissions
Fuel: MSW, RDF
Biomass-Fired Boilers
Carbon-neutral technology
Fuel: Wood, wood waste, straw, sludge
Process Recovery Boilers
Single-drum, industry-standard unit for improved
mill operation
Fuel: Black liquor |
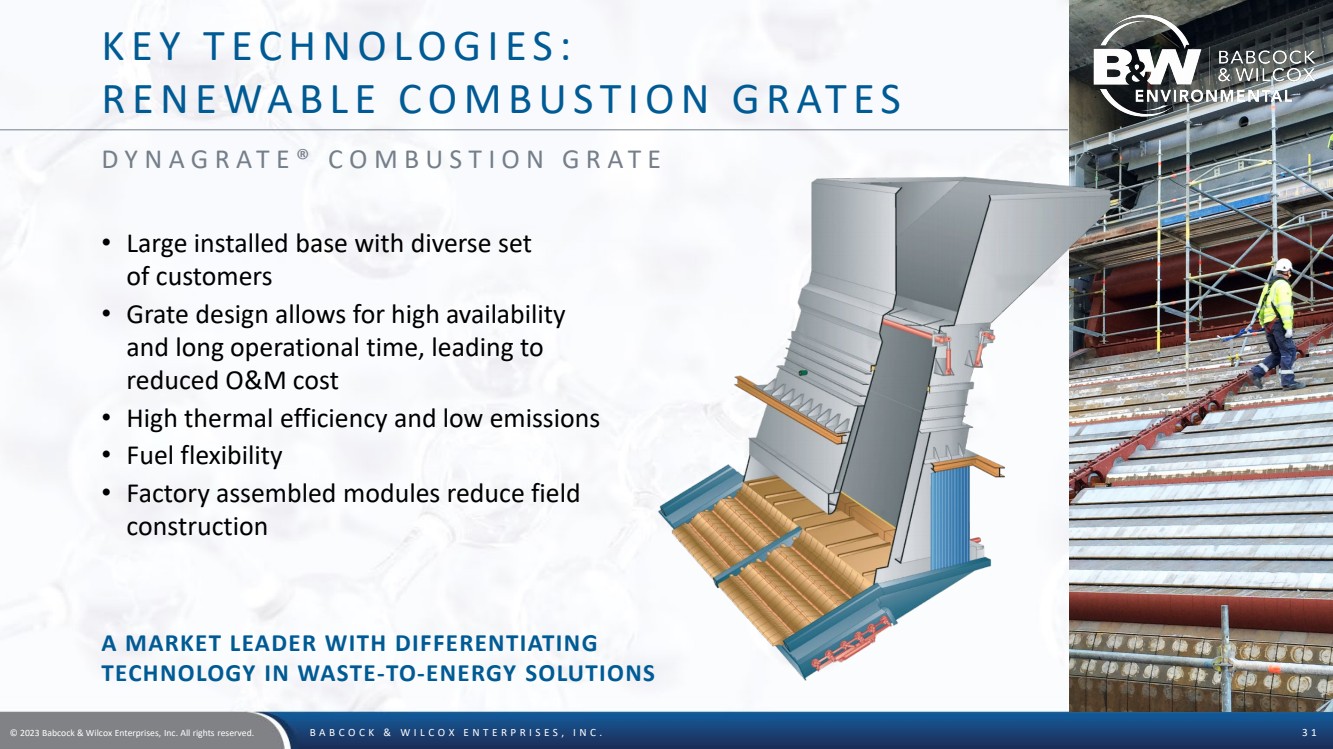
| © 2023 Babcock & Wilcox Enterprises, Inc. All rights reserved. BABCOCK & WILCOX ENTERPRISES, INC. 3 1
KEY TECHNOLOGIES:
RENEWABLE COMBUSTION GRATES
• Large installed base with diverse set
of customers
• Grate design allows for high availability
and long operational time, leading to
reduced O&M cost
• High thermal efficiency and low emissions
• Fuel flexibility
• Factory assembled modules reduce field
construction
DYNAGRATE ® COMBUSTION GRATE
A MARKET LEADER WITH DIFFERENTIATING
TECHNOLOGY IN WASTE-TO-ENERGY SOLUTIONS |
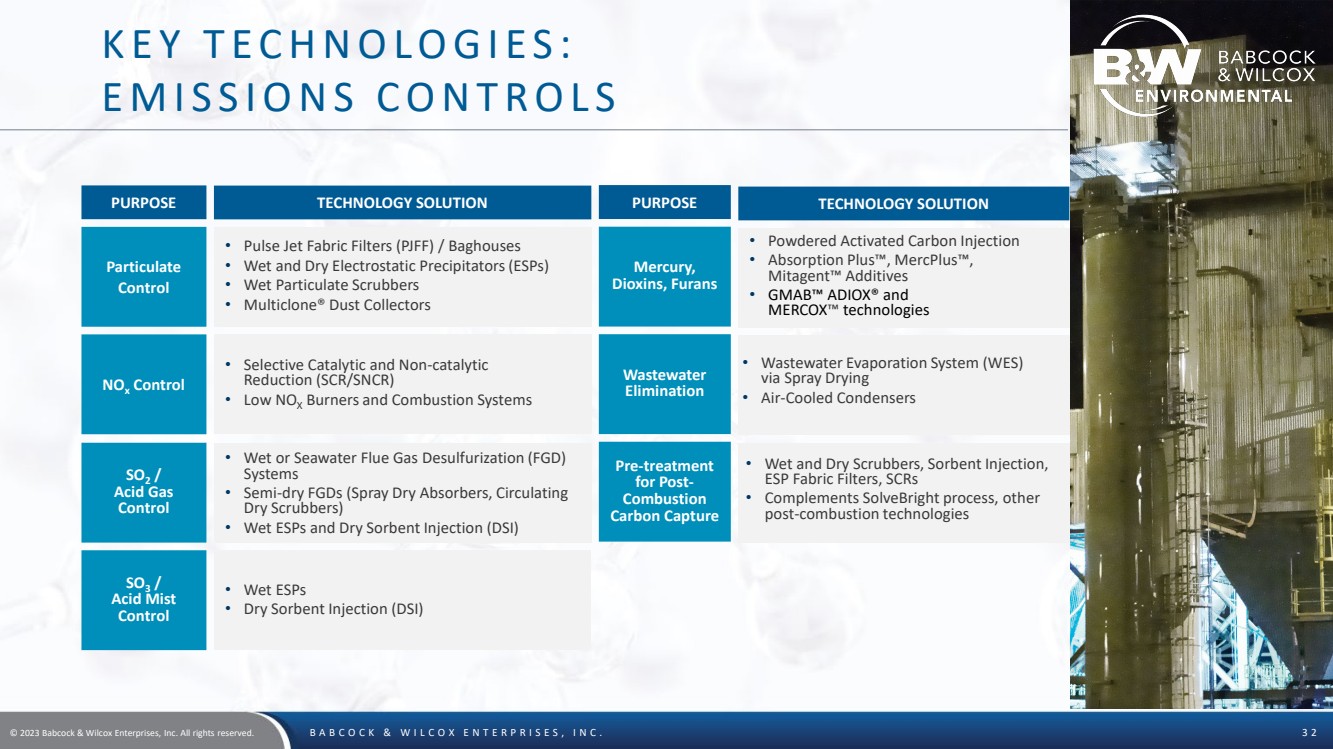
| © 2023 Babcock & Wilcox Enterprises, Inc. All rights reserved. BABCOCK & WILCOX ENTERPRISES, INC. 3 2
KEY TECHNOLOGIES:
EMISSIONS CONTROLS
• Wet ESPs
• Dry Sorbent Injection (DSI)
SO3 /
Acid Mist
Control
PURPOSE TECHNOLOGY SOLUTION
Particulate
Control
• Pulse Jet Fabric Filters (PJFF) / Baghouses
• Wet and Dry Electrostatic Precipitators (ESPs)
• Wet Particulate Scrubbers
• Multiclone® Dust Collectors
• Selective Catalytic and Non-catalytic
Reduction (SCR/SNCR)
• Low NOX Burners and Combustion Systems
NOx Control
• Wet or Seawater Flue Gas Desulfurization (FGD)
Systems
• Semi-dry FGDs (Spray Dry Absorbers, Circulating
Dry Scrubbers)
• Wet ESPs and Dry Sorbent Injection (DSI)
SO2 /
Acid Gas
Control
PURPOSE TECHNOLOGY SOLUTION
• Powdered Activated Carbon Injection
• Absorption Plus™, MercPlus™,
Mitagent™ Additives
• GMAB™ ADIOX® and
MERCOX™ technologies
Mercury,
Dioxins, Furans
• Wastewater Evaporation System (WES)
via Spray Drying
• Air-Cooled Condensers
Wastewater
Elimination
Pre-treatment
for Post- Combustion
Carbon Capture
• Wet and Dry Scrubbers, Sorbent Injection,
ESP Fabric Filters, SCRs
• Complements SolveBright process, other
post-combustion technologies |

| © 2023 Babcock & Wilcox Enterprises, Inc. All rights reserved. BABCOCK & WILCOX ENTERPRISES, INC. 3 3
KEY TECHNOLOGIES: FLUE GAS
TREATMENT FOR CARBON CAPTURE
• To optimize carbon capture on solvent-based scrubbing technologies,
reductions in various pollutants found in the incoming flue gas are required
• Our solutions include technologies for acid gases, particulate and acid mist,
NOx , mercury, and flue gas moisture
THE WORLDWIDE LEADER IN FLUE GAS PRE-TREATMENT
TECHNOLOGIES FOR POST-COMBUSTION CARBON CAPTURE |

| © 2023 Babcock & Wilcox Enterprises, Inc. All rights reserved. BABCOCK & WILCOX ENTERPRISES, INC. 3 4
KEY TECHNOLOGIES: SUBMERGED
GRIND CONVEYOR ASH HANDLING
• Lower equipment cost
• Lower installation cost
• Ability to utilize existing
hoppers and gate valves
• No hopper modifications
• Short outage time
• Short lead time
• Available redundancy
under the boiler
• Lower O&M costs
Designated to meet current and future U.S.
regulatory requirements for ash handling with:
AN INNOVATIVE SOLUTION TO ELIMINATE ASH PONDS |
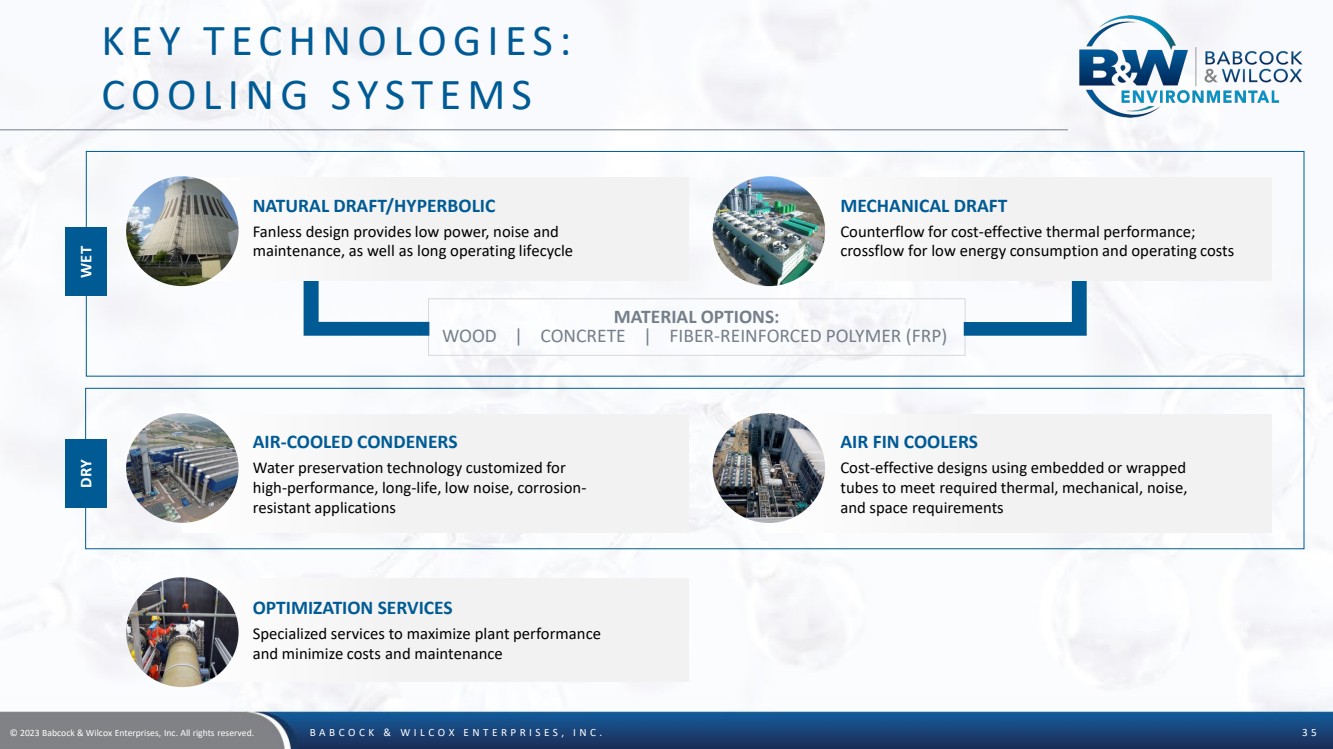
| © 2023 Babcock & Wilcox Enterprises, Inc. All rights reserved. BABCOCK & WILCOX ENTERPRISES, INC. 3 5
KEY TECHNOLOGIES:
COOLING SYSTEMS
MATERIAL OPTIONS:
WOOD | CONCRETE | FIBER-REINFORCED POLYMER (FRP)
NATURAL DRAFT/HYPERBOLIC
Fanless design provides low power, noise and
maintenance, as well as long operating lifecycle
MECHANICAL DRAFT
Counterflow for cost-effective thermal performance;
crossflow for low energy consumption and operating costs
WET
AIR-COOLED CONDENERS
Water preservation technology customized for
high-performance, long-life, low noise, corrosion-resistant applications
AIR FIN COOLERS
Cost-effective designs using embedded or wrapped
tubes to meet required thermal, mechanical, noise,
and space requirements
DRY
OPTIMIZATION SERVICES
Specialized services to maximize plant performance
and minimize costs and maintenance |
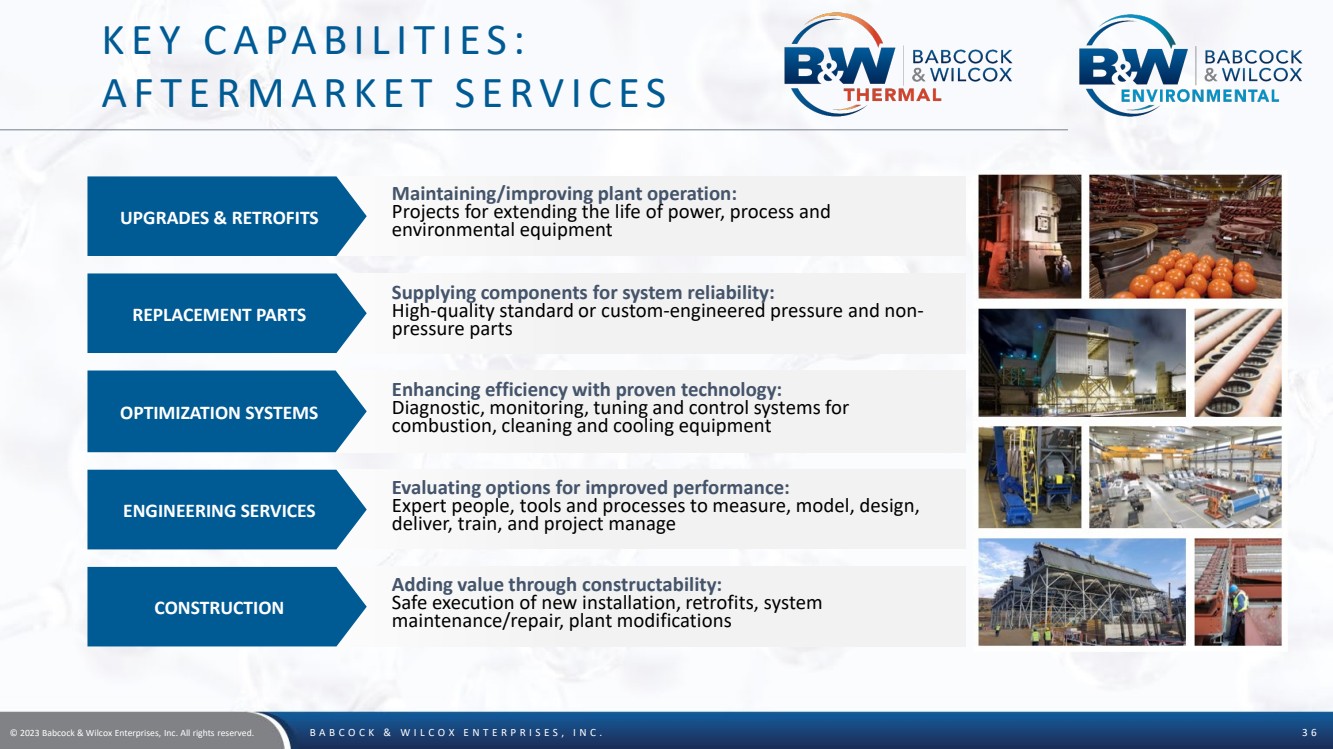
| © 2023 Babcock & Wilcox Enterprises, Inc. All rights reserved. BABCOCK & WILCOX ENTERPRISES, INC. 3 6
KEY CAPABILITIES:
AFTERMARKET SERVICES
Adding value through constructability:
Safe execution of new installation, retrofits, system
maintenance/repair, plant modifications CONSTRUCTION
OPTIMIZATION SYSTEMS
Enhancing efficiency with proven technology:
Diagnostic, monitoring, tuning and control systems for
combustion, cleaning and cooling equipment
UPGRADES & RETROFITS
Maintaining/improving plant operation:
Projects for extending the life of power, process and
environmental equipment
ENGINEERING SERVICES
Evaluating options for improved performance:
Expert people, tools and processes to measure, model, design,
deliver, train, and project manage
REPLACEMENT PARTS
Supplying components for system reliability:
High-quality standard or custom-engineered pressure and non- pressure parts |
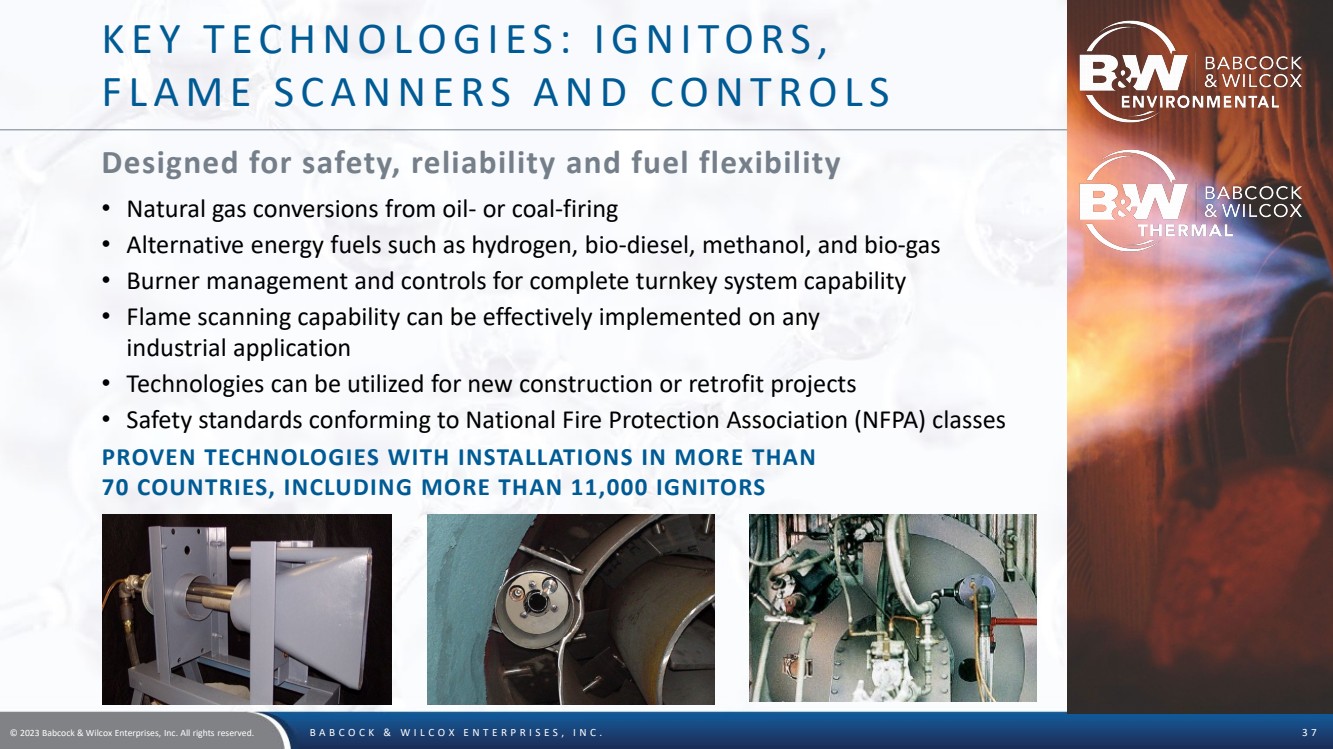
| © 2023 Babcock & Wilcox Enterprises, Inc. All rights reserved. BABCOCK & WILCOX ENTERPRISES, INC. 3 7
KEY TECHNOLOGIES: IGNITORS,
FLAME SCANNERS AND CONTROLS
• Natural gas conversions from oil- or coal-firing
• Alternative energy fuels such as hydrogen, bio-diesel, methanol, and bio-gas
• Burner management and controls for complete turnkey system capability
• Flame scanning capability can be effectively implemented on any
industrial application
• Technologies can be utilized for new construction or retrofit projects
• Safety standards conforming to National Fire Protection Association (NFPA) classes
Designed for safety, reliability and fuel flexibility
PROVEN TECHNOLOGIES WITH INSTALLATIONS IN MORE THAN
70 COUNTRIES, INCLUDING MORE THAN 11,000 IGNITORS |
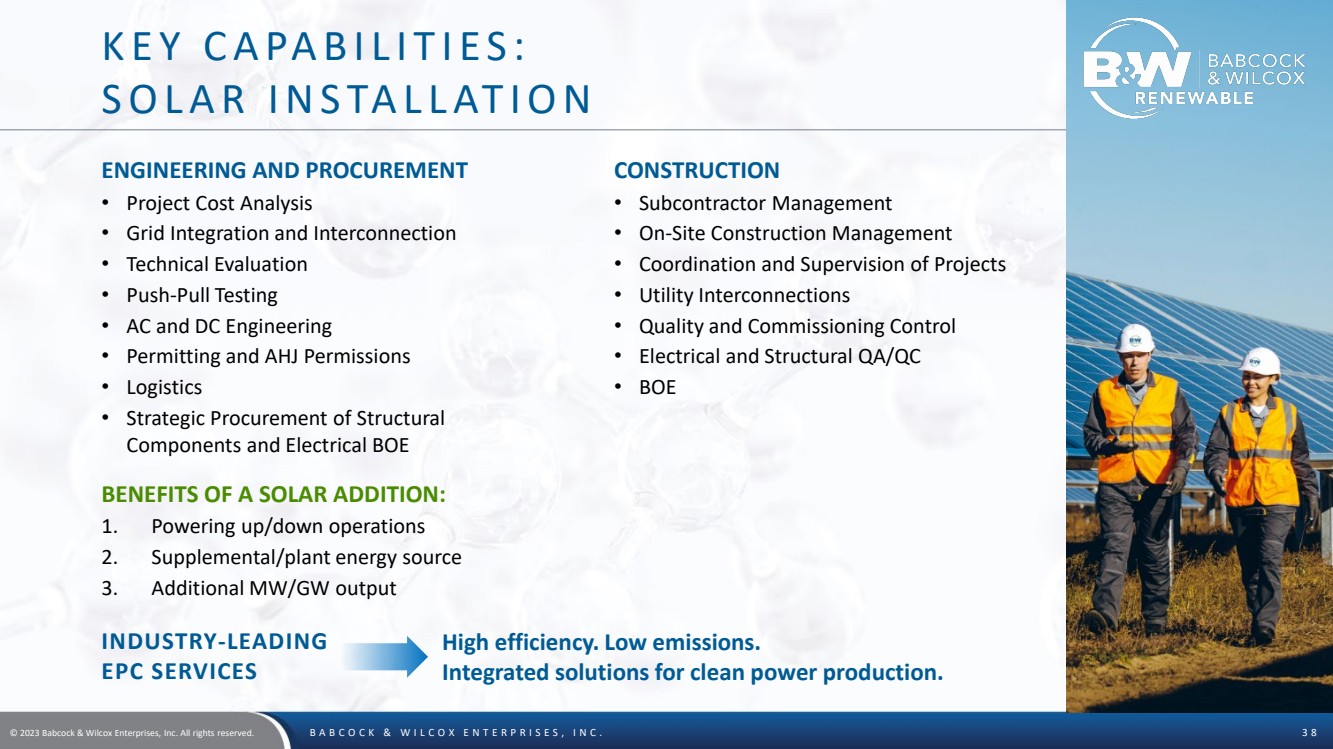
| © 2023 Babcock & Wilcox Enterprises, Inc. All rights reserved. BABCOCK & WILCOX ENTERPRISES, INC. 3 8
KEY CAPABILITIES:
SOLAR INSTALLATION
ENGINEERING AND PROCUREMENT
• Project Cost Analysis
• Grid Integration and Interconnection
• Technical Evaluation
• Push-Pull Testing
• AC and DC Engineering
• Permitting and AHJ Permissions
• Logistics
• Strategic Procurement of Structural
Components and Electrical BOE
CONSTRUCTION
• Subcontractor Management
• On-Site Construction Management
• Coordination and Supervision of Projects
• Utility Interconnections
• Quality and Commissioning Control
• Electrical and Structural QA/QC
• BOE
BENEFITS OF A SOLAR ADDITION:
1. Powering up/down operations
2. Supplemental/plant energy source
3. Additional MW/GW output
INDUSTRY-LEADING
EPC SERVICES
High efficiency. Low emissions.
Integrated solutions for clean power production. |
Cover
|
Aug. 08, 2023 |
| Document Information [Line Items] |
|
| Document Type |
8-K
|
| Amendment Flag |
false
|
| Document Period End Date |
Aug. 08, 2023
|
| Entity File Number |
001-36876
|
| Entity Registrant Name |
BABCOCK & WILCOX ENTERPRISES, INC.
|
| Entity Central Index Key |
0001630805
|
| Entity Tax Identification Number |
47-2783641
|
| Entity Incorporation, State or Country Code |
DE
|
| Entity Address, Address Line One |
1200 East Market Street
|
| Entity Address, Address Line Two |
Suite 650
|
| Entity Address, City or Town |
Akron
|
| Entity Address, State or Province |
OH
|
| Entity Address, Postal Zip Code |
44305
|
| City Area Code |
330
|
| Local Phone Number |
753-4511
|
| Written Communications |
false
|
| Soliciting Material |
false
|
| Pre-commencement Tender Offer |
false
|
| Pre-commencement Issuer Tender Offer |
false
|
| Entity Emerging Growth Company |
false
|
| Common Stock [Member] |
|
| Document Information [Line Items] |
|
| Title of 12(b) Security |
Common stock, $0.01 par value per share
|
| Trading Symbol |
BW
|
| Security Exchange Name |
NYSE
|
| 8.125% Senior Notes due 2026 [Member] |
|
| Document Information [Line Items] |
|
| Title of 12(b) Security |
8.125% Senior Notes due 2026
|
| Trading Symbol |
BWSN
|
| Security Exchange Name |
NYSE
|
| 6.50% Senior Notes due 2026 [Member] |
|
| Document Information [Line Items] |
|
| Title of 12(b) Security |
6.50% Senior Notes due 2026
|
| Trading Symbol |
BWNB
|
| Security Exchange Name |
NYSE
|
| 7.75% Series A Cumulative Perpetual Preferred Stock [Member] |
|
| Document Information [Line Items] |
|
| Title of 12(b) Security |
7.75% Series A Cumulative Perpetual Preferred Stock
|
| Trading Symbol |
BW PRA
|
| Security Exchange Name |
NYSE
|
| X |
- DefinitionBoolean flag that is true when the XBRL content amends previously-filed or accepted submission.
| Name: |
dei_AmendmentFlag |
| Namespace Prefix: |
dei_ |
| Data Type: |
xbrli:booleanItemType |
| Balance Type: |
na |
| Period Type: |
duration |
|
| X |
- DefinitionFor the EDGAR submission types of Form 8-K: the date of the report, the date of the earliest event reported; for the EDGAR submission types of Form N-1A: the filing date; for all other submission types: the end of the reporting or transition period. The format of the date is YYYY-MM-DD.
| Name: |
dei_DocumentPeriodEndDate |
| Namespace Prefix: |
dei_ |
| Data Type: |
xbrli:dateItemType |
| Balance Type: |
na |
| Period Type: |
duration |
|
| X |
- DefinitionThe type of document being provided (such as 10-K, 10-Q, 485BPOS, etc). The document type is limited to the same value as the supporting SEC submission type, or the word 'Other'.
| Name: |
dei_DocumentType |
| Namespace Prefix: |
dei_ |
| Data Type: |
dei:submissionTypeItemType |
| Balance Type: |
na |
| Period Type: |
duration |
|
| X |
- DefinitionAddress Line 1 such as Attn, Building Name, Street Name
| Name: |
dei_EntityAddressAddressLine1 |
| Namespace Prefix: |
dei_ |
| Data Type: |
xbrli:normalizedStringItemType |
| Balance Type: |
na |
| Period Type: |
duration |
|
| X |
- DefinitionAddress Line 2 such as Street or Suite number
| Name: |
dei_EntityAddressAddressLine2 |
| Namespace Prefix: |
dei_ |
| Data Type: |
xbrli:normalizedStringItemType |
| Balance Type: |
na |
| Period Type: |
duration |
|
| X |
- Definition
+ References
+ Details
| Name: |
dei_EntityAddressCityOrTown |
| Namespace Prefix: |
dei_ |
| Data Type: |
xbrli:normalizedStringItemType |
| Balance Type: |
na |
| Period Type: |
duration |
|
| X |
- DefinitionCode for the postal or zip code
| Name: |
dei_EntityAddressPostalZipCode |
| Namespace Prefix: |
dei_ |
| Data Type: |
xbrli:normalizedStringItemType |
| Balance Type: |
na |
| Period Type: |
duration |
|
| X |
- DefinitionName of the state or province.
| Name: |
dei_EntityAddressStateOrProvince |
| Namespace Prefix: |
dei_ |
| Data Type: |
dei:stateOrProvinceItemType |
| Balance Type: |
na |
| Period Type: |
duration |
|
| X |
- DefinitionA unique 10-digit SEC-issued value to identify entities that have filed disclosures with the SEC. It is commonly abbreviated as CIK. Reference 1: http://www.xbrl.org/2003/role/presentationRef
-Publisher SEC
-Name Exchange Act
-Number 240
-Section 12
-Subsection b-2
| Name: |
dei_EntityCentralIndexKey |
| Namespace Prefix: |
dei_ |
| Data Type: |
dei:centralIndexKeyItemType |
| Balance Type: |
na |
| Period Type: |
duration |
|
| X |
- DefinitionIndicate if registrant meets the emerging growth company criteria. Reference 1: http://www.xbrl.org/2003/role/presentationRef
-Publisher SEC
-Name Exchange Act
-Number 240
-Section 12
-Subsection b-2
| Name: |
dei_EntityEmergingGrowthCompany |
| Namespace Prefix: |
dei_ |
| Data Type: |
xbrli:booleanItemType |
| Balance Type: |
na |
| Period Type: |
duration |
|
| X |
- DefinitionCommission file number. The field allows up to 17 characters. The prefix may contain 1-3 digits, the sequence number may contain 1-8 digits, the optional suffix may contain 1-4 characters, and the fields are separated with a hyphen.
| Name: |
dei_EntityFileNumber |
| Namespace Prefix: |
dei_ |
| Data Type: |
dei:fileNumberItemType |
| Balance Type: |
na |
| Period Type: |
duration |
|
| X |
- DefinitionTwo-character EDGAR code representing the state or country of incorporation.
| Name: |
dei_EntityIncorporationStateCountryCode |
| Namespace Prefix: |
dei_ |
| Data Type: |
dei:edgarStateCountryItemType |
| Balance Type: |
na |
| Period Type: |
duration |
|
| X |
- DefinitionThe exact name of the entity filing the report as specified in its charter, which is required by forms filed with the SEC. Reference 1: http://www.xbrl.org/2003/role/presentationRef
-Publisher SEC
-Name Exchange Act
-Number 240
-Section 12
-Subsection b-2
| Name: |
dei_EntityRegistrantName |
| Namespace Prefix: |
dei_ |
| Data Type: |
xbrli:normalizedStringItemType |
| Balance Type: |
na |
| Period Type: |
duration |
|
| X |
- DefinitionThe Tax Identification Number (TIN), also known as an Employer Identification Number (EIN), is a unique 9-digit value assigned by the IRS. Reference 1: http://www.xbrl.org/2003/role/presentationRef
-Publisher SEC
-Name Exchange Act
-Number 240
-Section 12
-Subsection b-2
| Name: |
dei_EntityTaxIdentificationNumber |
| Namespace Prefix: |
dei_ |
| Data Type: |
dei:employerIdItemType |
| Balance Type: |
na |
| Period Type: |
duration |
|
| X |
- DefinitionLocal phone number for entity.
| Name: |
dei_LocalPhoneNumber |
| Namespace Prefix: |
dei_ |
| Data Type: |
xbrli:normalizedStringItemType |
| Balance Type: |
na |
| Period Type: |
duration |
|
| X |
- DefinitionBoolean flag that is true when the Form 8-K filing is intended to satisfy the filing obligation of the registrant as pre-commencement communications pursuant to Rule 13e-4(c) under the Exchange Act. Reference 1: http://www.xbrl.org/2003/role/presentationRef
-Publisher SEC
-Name Exchange Act
-Number 240
-Section 13e
-Subsection 4c
| Name: |
dei_PreCommencementIssuerTenderOffer |
| Namespace Prefix: |
dei_ |
| Data Type: |
xbrli:booleanItemType |
| Balance Type: |
na |
| Period Type: |
duration |
|
| X |
- DefinitionBoolean flag that is true when the Form 8-K filing is intended to satisfy the filing obligation of the registrant as pre-commencement communications pursuant to Rule 14d-2(b) under the Exchange Act. Reference 1: http://www.xbrl.org/2003/role/presentationRef
-Publisher SEC
-Name Exchange Act
-Number 240
-Section 14d
-Subsection 2b
| Name: |
dei_PreCommencementTenderOffer |
| Namespace Prefix: |
dei_ |
| Data Type: |
xbrli:booleanItemType |
| Balance Type: |
na |
| Period Type: |
duration |
|
| X |
- DefinitionTitle of a 12(b) registered security. Reference 1: http://www.xbrl.org/2003/role/presentationRef
-Publisher SEC
-Name Exchange Act
-Number 240
-Section 12
-Subsection b
| Name: |
dei_Security12bTitle |
| Namespace Prefix: |
dei_ |
| Data Type: |
dei:securityTitleItemType |
| Balance Type: |
na |
| Period Type: |
duration |
|
| X |
- DefinitionName of the Exchange on which a security is registered. Reference 1: http://www.xbrl.org/2003/role/presentationRef
-Publisher SEC
-Name Exchange Act
-Number 240
-Section 12
-Subsection d1-1
| Name: |
dei_SecurityExchangeName |
| Namespace Prefix: |
dei_ |
| Data Type: |
dei:edgarExchangeCodeItemType |
| Balance Type: |
na |
| Period Type: |
duration |
|
| X |
- DefinitionBoolean flag that is true when the Form 8-K filing is intended to satisfy the filing obligation of the registrant as soliciting material pursuant to Rule 14a-12 under the Exchange Act. Reference 1: http://www.xbrl.org/2003/role/presentationRef
-Publisher SEC
-Name Exchange Act
-Section 14a
-Number 240
-Subsection 12
| Name: |
dei_SolicitingMaterial |
| Namespace Prefix: |
dei_ |
| Data Type: |
xbrli:booleanItemType |
| Balance Type: |
na |
| Period Type: |
duration |
|
| X |
- DefinitionTrading symbol of an instrument as listed on an exchange.
| Name: |
dei_TradingSymbol |
| Namespace Prefix: |
dei_ |
| Data Type: |
dei:tradingSymbolItemType |
| Balance Type: |
na |
| Period Type: |
duration |
|
| X |
- DefinitionBoolean flag that is true when the Form 8-K filing is intended to satisfy the filing obligation of the registrant as written communications pursuant to Rule 425 under the Securities Act. Reference 1: http://www.xbrl.org/2003/role/presentationRef
-Publisher SEC
-Name Securities Act
-Number 230
-Section 425
| Name: |
dei_WrittenCommunications |
| Namespace Prefix: |
dei_ |
| Data Type: |
xbrli:booleanItemType |
| Balance Type: |
na |
| Period Type: |
duration |
|
| X |
- Details
| Name: |
us-gaap_StatementClassOfStockAxis=us-gaap_CommonStockMember |
| Namespace Prefix: |
|
| Data Type: |
na |
| Balance Type: |
|
| Period Type: |
|
|
| X |
- Details
| Name: |
us-gaap_StatementClassOfStockAxis=BW_SeniorNotes8.125PercentageDue2026Member |
| Namespace Prefix: |
|
| Data Type: |
na |
| Balance Type: |
|
| Period Type: |
|
|
| X |
- Details
| Name: |
us-gaap_StatementClassOfStockAxis=BW_SeniorNotes6.50PercentageDue2026Member |
| Namespace Prefix: |
|
| Data Type: |
na |
| Balance Type: |
|
| Period Type: |
|
|
| X |
- Details
| Name: |
us-gaap_StatementClassOfStockAxis=BW_SeriesA7.75PercentageCumulativePerpetualPreferredStockMember |
| Namespace Prefix: |
|
| Data Type: |
na |
| Balance Type: |
|
| Period Type: |
|
|
Babcock and Wilcox Enter... (NYSE:BW-A)
Historical Stock Chart
Von Apr 2024 bis Mai 2024

Babcock and Wilcox Enter... (NYSE:BW-A)
Historical Stock Chart
Von Mai 2023 bis Mai 2024
