30 June 2014  30 June 2013 
                                              Note    GBP'000       GBP'000 
Fixed assets 
Fixed asset investments                          9        27,689        24,567 
Investment in subsidiary undertakings           11        15,095        16,580 
                                                          42,784        41,147 
 
Current assets 
Trade and other debtors                         12            74            17 
Current asset investments                       12            42            21 
Cash at bank and in hand                        16         1,410         2,723 
                                                           1,526         2,761 
 
Creditors: amounts falling due within one 
 year                                           13      (15,260)      (16,742) 
Net current assets                                      (13,734)      (13,981) 
 
Net assets                                                29,050        27,166 
 
Capital and reserves 
Ordinary share capital                          14        10,006         9,300 
Share premium                                              5,527         3,756 
Capital redemption reserve                                 1,415         1,283 
Unrealised capital reserve                                   695         (167) 
Realised capital reserve                                    (64)           832 
Other distributable reserve                               11,471        12,162 
Total equity shareholders' funds                          29,050        27,166 
 
Basic and diluted net asset value per share 
 (pence)*                                       15         32.04         32.26 
 
 
   * excluding treasury shares 
 
   The Company balance sheet has been prepared in accordance with UK GAAP. 
 
   The accompanying notes form an integral part of these Financial 
Statements. 
 
   These Financial Statements were approved by the Board of Directors, and 
authorised for issue on 2 October 2014 and were signed on its behalf by 
 
   Patrick Crosthwaite 
 
   Chairman 
 
   Company number: 03495287 
 
   Consolidated statement of changes in equity 


                                                                                Capital    Unrealised  Realised      Other 
                                                      Ordinary share   Share   redemption   capital    capital   distributable 
                                                          capital     premium   reserve     reserve    reserve      reserve      Total 
                                                         GBP'000      GBP'000   GBP'000     GBP'000    GBP'000      GBP'000     GBP'000 
As at 1 July 2013                                              9,300    3,756       1,283     (1,690)     1,041         13,476   27,166 
Profit and total comprehensive income                              -        -           -       1,823     (372)            525    1,976 
Transfer of previously unrealised losses on sale or 
 write off of investments                                          -        -           -         524     (524)              -        - 
Dividends paid                                                     -        -           -           -         -        (2,132)  (2,132) 
Purchase of shares for treasury (including costs)                  -        -           -           -         -          (174)    (174) 
Purchase of own shares for cancellation (including 
 costs)                                                        (132)        -         132           -         -          (395)    (395) 
Issue of equity (net of costs)                                   838    1,771           -           -         -              -    2,609 
As at 30 June 2014                                            10,006    5,527       1,415         657       145         11,300   29,050 
As at 1 July 2012                                              8,844    2,335       1,065     (3,755)     1,970         15,491   25,950 
Profit and total comprehensive income                              -        -           -       1,105        31            590    1,726 
Transfer of previously unrealised losses on sale or 
 write off of investments                                          -        -           -         960     (960)              -        - 
Dividends paid                                                     -        -           -           -         -        (1,983)  (1,983) 
Cancellation of treasury shares                                 (77)        -          77           -         -              -        - 
Purchase of shares for treasury (including costs)                  -        -           -           -         -          (206)    (206) 
Purchase of own shares for cancellation (including 
 costs)                                                        (141)        -         141           -         -          (416)    (416) 
Issue of equity (net of costs)                                   674    1,421           -           -         -              -    2,095 
As at 30 June 2013                                             9,300    3,756       1,283     (1,690)     1,041         13,476   27,166 
 
 
   The nature of each reserve is described in note 1 below. 
 
   Company reconciliation of movements in shareholders' funds 


                                                                                Capital    Unrealised  Realised      Other 
                                                      Ordinary share   Share   redemption   capital    capital   distributable 
                                                          capital     premium   reserve     reserve    reserve*    reserve*      Total 
                                                         GBP'000      GBP'000   GBP'000     GBP'000    GBP'000      GBP'000     GBP'000 
As at 1 July 2013                                              9,300    3,756       1,283       (167)       832         12,162   27,166 
Return for the year                                                -        -           -       1,823     (372)          2,010    3,461 
Revaluation of investment in subsidiaries                          -        -           -     (1,485)         -              -  (1,485) 
Transfer of previously unrealised losses on sale or 
 write off of investments                                          -        -           -         524     (524)              -        - 
Dividends paid in year                                             -        -           -           -         -        (2,132)  (2,132) 
Purchase of shares for treasury (including costs)                  -        -           -           -         -          (174)    (174) 
Purchase of own shares for cancellation (including 
 costs)                                                        (132)        -         132           -         -          (395)    (395) 
Issue of equity (net of costs)                                   838    1,771           -           -         -              -    2,609 
As at 30 June 2014                                            10,006    5,527       1,415         695      (64)         11,471   29,050 
As at 1 July 2012                                              8,844    2,335       1,065     (3,252)     1,761         15,197   25,950 
Return for the year                                                -        -           -       1,105        31          (430)      706 
Revaluation of investment in subsidiaries                          -        -           -       1,020         -              -    1,020 
Transfer of previously unrealised losses on sale or 
 write off of investments                                          -        -           -         960     (960)              -        - 
Dividends paid in year                                             -        -           -           -         -        (1,983)  (1,983) 
Cancellation of treasury shares                                 (77)        -          77           -         -              -        - 
Purchase of shares for treasury (including costs)                  -        -           -           -         -          (206)    (206) 
Purchase of own shares for cancellation (including 
 costs)                                                        (141)        -         141           -         -          (416)    (416) 
Issue of equity (net of costs)                                   674    1,421           -           -         -              -    2,095 
As at 30 June 2013                                             9,300    3,756       1,283       (167)       832         12,162   27,166 
 
 
   * Included within these reserves is an amount of GBP11,407,000 (2013: 
GBP12,827,000) which is considered distributable. 
 
   The nature of each reserve is described in note 1 below. 
 
   Consolidated cashflow statement 


                                                                       Year ended     Year ended 
                                                                       30 June 2014   30 June 2013 
                                                               Note      GBP'000        GBP'000 
Operating activities 
Investment income received                                                      880            917 
Deposit interest received                                                        18             22 
Dividend income received                                                         29             34 
Investment management fees paid                                               (473)          (453) 
Other cash payments                                                           (267)          (269) 
Net cash flows from operating activities                         17             187            251 
 
Cash flows from investing activities 
Purchase of non-current asset investments                                   (2,539)        (1,062) 
Disposal of non-current asset investments                                     1,129          2,399 

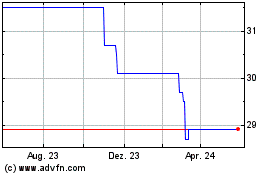
Albion Crown Vct (LSE:CRWN)
Historical Stock Chart
Von Jun 2024 bis Jul 2024 Click Here for more Albion Crown Vct Charts.
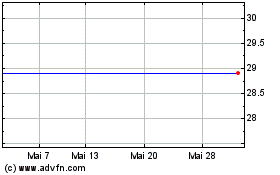
Albion Crown Vct (LSE:CRWN)
Historical Stock Chart
Von Jul 2023 bis Jul 2024 Click Here for more Albion Crown Vct Charts.