Sales: € 264m (+3.2% as reported) Essential products
sales: €160m (+6.0% as reported) Net income, Group share:
€24m (9.0% of sales) EBITDA: €45m (17.0% of sales)
Cash flow generation: €27m
Regulatory News:
The Board of Directors of Vetoquinol SA (Paris:VETO) met on
September 10, 2024 to review business activity and approve the
financial statements for the first half of 2024. The auditors have
released their first half limited review report.
Vetoquinol reported sales of €264 million for the first 6
months of FY 2024, up +3.2% on a reported basis. Further
simplification of the Complementary products range resulted in a
voluntary decline of around 1,6% in sales for the 1st half of FY
2024. The currency impact is insignificant (-0.3 M€) at the end of
June 2024 vs. -2.0 M€ for the same period of FY 2023.
Sales of Essential products totaled €160m, up +6.0% on a
reported basis, and accounted for 61% of the Group’s sales in H1
2024 vs. 59% in H1 2023. Essential products, the main driver of
the Group's strategy, continues to lead Vetoquinol's
development.
At June 30, 2024, almost all the Group's strategic countries
were up from the first half 2023. This is the fruit of the ongoing
work of our teams in the field. The Europe strategic territory grew
by +5.0% on a reported basis, with the return of volume growth.
This is the result of the sustained performance of Essentials
products in the Group's first territory. The Asia/Pacific/Rest of
World territory grew by 10.0% on a reported basis. The Americas,
i.e. Canada, Brazil and Mexico, were also up. In the United States,
on the other hand, the expected landing after several years of
strong growth was harder than anticipated. This was due to a
decline in inventories at American wholesalers, coupled with the
temporary unavailability of a product range. These factors had a
negative impact of -8.7% on sales in this territory.
Sales of products for companion animals (€188m) were up +3.8% on
a reported basis and accounted for 71.2% of the group’s total sales
(vs. €181m in H1 2023). Farm animals products came to €76 million,
up +1.8% on a reported basis (vs. €75 million in H1 2023).
Gross margin on purchases was 72.3%, slightly up on the
H1 2023 figure. This trend is linked to the product mix, and in
particular to the continued growth of Essential products, as well
as to selling price increases of over +3%. These factors offset the
rise in purchasing costs for raw materials and outsourced
manufacturing.
Other external purchases and expenses rose sharply by +20.8%
(vs. -7.9% in H1 2023), i.e. +€10.3m without any significant
currency impact, reflecting increased R&D and marketing
expenditure (+€9.0m). Personnel costs were up +€4.3m, reflecting
salary inflation applied in the Group. Total headcount is up
slightly: 2,519 at June 30, 2024 vs. 2,497 at June 30, 2023.
Depreciation and amortization charges linked to IFRS 16
generated a depreciation charge of € -3.0 million vs. € -2.9
million at June 30, 2023.
EBIT before amortization of intangible assets acquired
amounted to €38.5 million for the year ended June 30,
2024, representing 14.6% of total sales.
Group operating income recurring was €32 million (12.1%
of sales).
Other operating income and expenses amounted to €1.1m, compared
with €2.6m at June 30, 2023. This net income relates to the sale of
an industrial site in Brazil. As a reminder, the net income of €2.6
million recorded at June 30, 2023 included a renegotiation of the
acquisition price of Clarion (Brazilian subsidiary) and reflected
an uncertain local macro-economic situation.
Income tax expense for H1 2024 was -€11.2m (vs. -€10.4m in H1
2023). The apparent tax rate was 32.0% (vs. 24.4% at end June
2023).
Vetoquinol's EBITDA stood at €45 million at June 30,
2024, (17.0% of sales). It has been impacted by the drop in
business in the United States, by the increased pace of R&D
spending (8.1% of sales vs. 6.9% of sales in H1 2023) to support
the Group's development, and by the decision to commit a
significant portion of the annual marketing budget in the first
half of the year.
Net income for the Vetoquinol Group amounted to €24 million,
or 9.0% of H1 2024 sales.
The Vetoquinol Group has an overall net cash position of €142
million, an increase of €12 million over the first 6 months of
2024.
The Vetoquinol Group has sound fundamentals (operating
profitability, cash flow generation, solid shareholders’ equity) to
pursue its development strategy, and the means to finance its
external growth ambitions.
The Half-Year Results 2024 presentation, as well as the first
half financial report, are available on Vetoquinol website:
https://vetoquinol.com/fr/investisseurs
Next publication: Q3 2024 sales, October 30, 2024 after
market close
ABOUT VETOQUINOL Vetoquinol is a leading international player in
animal health, with operations in Europe, the Americas and
Asia/Pacific. Independent and a pure player, Vetoquinol innovates,
develops and markets veterinary medicines and non-medicated
products for farm animals (cattle, pigs) and companion animals
(dogs, cats). Since its foundation in 1933, Vetoquinol has combined
innovation and geographic diversification. The strengthening of the
product portfolio and acquisitions made in high-potential
territories ensure hybrid growth for the Group. As of June 30,
2024, Vetoquinol employed 2,519 people.
Vetoquinol has been listed on Euronext Paris since 2006 (symbol:
VETO). The Vetoquinol share is eligible for the French PEA and
PEA-PME personal equity plans.
APPENDIX
SALES
€m
2024
2023
Change on a reported
basis
Change at constant exchange
rates
Q1 Sales
133,6
145,4
-8,1%
-8,0%
Q2 Sales
130,8
110,8
+18,0%
+17,8%
First semester sales
264,4
256,2
+3,2%
+3,1%
SUMMARY INCOME STATEMENT
€m
30/06/2024
30/06/2023
Variation
Total sales
of which Essentials
264,4
160,2
256,2
151,0
+3,2%
+6,0%
EBIT before depreciation of acquired
assets
in % of total sales
38,5
14,6
45,4
17,7
-15,1%
Net income Group share
in % of total sales
23,8
9,0
32,2
12,6
-26,1%
EBITDA
in % of total sales
45,0
17,0
59,7*
23,3
-24,6%
* Reported data including positive non-recurring impact in
Brazil (+6.1 M€)
EBITDA RECONCILIATION
€m
30/06/2024
30/06/2023
Net income before equity method
23,8
32,2
Income tax expense
11,2
10,4
Net financial income/expense
(2,0)
(1,3)
Provisions recognized under non-recurring
operating income and expenses
(1,0)
3,5
Provisions and write-backs
(2,9)
(0,7)
Depreciation and amortization (including
IFRS 16)
15,9
15,5
EBITDA
45,0
59,7*
* Excluding the non-recurring impact of Brazil in H1 2023,
EBITDA was €53.6m (21%).
ALTERNATIVE PERFORMANCE INDICATORS Vetoquinol Group
management considers that these indicators, which are not defined
by IFRS, provide additional information that is relevant for
shareholders seeking to analyze underlying trends and Group
performance and financial position. They are used by management for
performance analysis.
Essentials products: The products referred to as
“Essentials” comprise veterinary drugs and non-medical products
sold by the Vetoquinol Group. They are existing or potential
market-leading products designed to meet the daily requirements of
vets in the companion animal or farm animal sector. They are
intended for sale worldwide and their scale effect improves their
economic performance.
Constant exchange rates: Application of the previous
period’s exchange rates to the current financial year, all other
things remaining equal.
Like-for-like (LFL) growth: Year-on-year sales growth in
terms of volume and/or price at constant consolidation scope and
exchange rates.
EBIT before amortization of acquired assets: This KPI
isolates the non-cash impact of depreciation charges on intangible
assets arising from mergers and acquisitions.
Net cash: Cash and cash equivalents less bank overdrafts
and borrowings, (IFRS 16 compliant)
View source
version on businesswire.com: https://www.businesswire.com/news/home/20240912468049/en/
FOR FURTHER INFORMATION PLEASE CONTACT:
VETOQUINOL
Investor Relations Fanny Toillon Phone: +33 (0)3
84 62 59 88 relations.investisseurs@vetoquinol.com
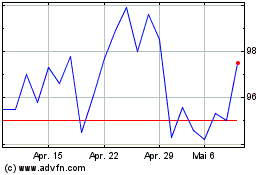
Vetoquinol (EU:VETO)
Historical Stock Chart
Von Nov 2024 bis Dez 2024

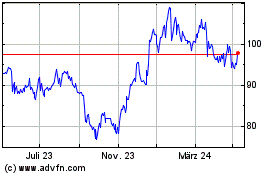
Vetoquinol (EU:VETO)
Historical Stock Chart
Von Dez 2023 bis Dez 2024
