Interfor Reports Voting Results from Annual General Meeting
05 Mai 2023 - 1:15AM

INTERFOR CORPORATION (“Interfor” or the “Company”)
(TSX: IFP) announced the voting results for the election of its
Board of Directors, which took place at the Company’s Annual
General Meeting held today in Montreal, Quebec. A total of
37,222,951 common shares were voted by proxy and in person at the
meeting representing 72.36% of the votes attached to all
outstanding shares. The nominees listed in the management
information circular dated March 8, 2023, were elected as directors
of the Company and detailed results of the votes cast by proxy and
in person are set out below:
|
|
Name of Nominee |
Votes For |
For % |
|
| |
Ian Fillinger |
35,816,870 |
96.36% |
|
| |
Christopher R. Griffin |
36,026,671 |
96.92% |
|
| |
Rhonda D. Hunter |
25,894,372 |
69.66% |
|
| |
J. Eddie McMillan |
33,870,338 |
91.12% |
|
| |
Thomas V. Milroy |
36,467,853 |
98.11% |
|
| |
Gillian L. Platt |
36,488,294 |
98.17% |
|
| |
Lawrence Sauder |
34,317,540 |
92.33% |
|
| |
Curtis M. Stevens |
36,348,528 |
97.79% |
|
| |
Thomas Temple |
36,303,664 |
97.67% |
|
| |
Douglas W.G. Whitehead |
35,653,730 |
95.92% |
|
| |
|
|
|
|
At the Annual General Meeting, shareholders also approved: (i)
the appointment of the auditor and authorization of the directors
to fix the auditor’s remuneration; (ii) a non-binding advisory
resolution accepting the Company’s approach to executive
compensation. Detailed voting results for the meeting are available
on SEDAR at www.sedar.com.
ABOUT INTERFOR
Interfor is a growth-oriented forest products company with
operations in Canada and the United States. The Company has annual
lumber production capacity of approximately 5.2 billion board feet
and offers a diverse line of lumber products to customers around
the world. For more information about Interfor, visit our website
at www.interfor.com.
For further information:Xenia KritsosGeneral Counsel &
Corporate Secretary(604) 422-3400
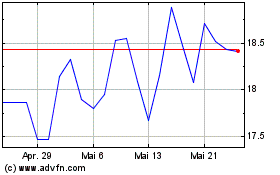
Interfor (TSX:IFP)
Historical Stock Chart
Von Dez 2024 bis Jan 2025

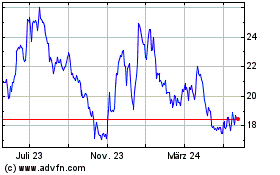
Interfor (TSX:IFP)
Historical Stock Chart
Von Jan 2024 bis Jan 2025
