0001166003
false
0001166003
2023-10-30
2023-10-30
iso4217:USD
xbrli:shares
iso4217:USD
xbrli:shares
UNITED STATES
SECURITIES AND EXCHANGE COMMISSION
Washington, D.C. 20549
FORM 8-K
CURRENT REPORT
Pursuant to Section 13
or 15(d) of the
Securities Exchange Act of 1934
Date of Report (Date
of earliest event reported): October 30, 2023
XPO, INC.
(Exact name of registrant as specified in its charter)
| Delaware |
|
001-32172 |
|
03-0450326 |
(State or other jurisdiction of
incorporation) |
|
(Commission File Number) |
|
(I.R.S. Employer
Identification No.) |
Five American Lane, Greenwich, Connecticut 06831
(Address of principal executive offices)
(855)
976-6951
(Registrant’s telephone number, including
area code)
Check the appropriate box below if the Form 8-K filing is intended to simultaneously satisfy the filing obligation of the registrant under any of the following provisions:
| ¨ |
Written communications pursuant to Rule 425 under the Securities Act (17 CFR 230.425) |
| ¨ |
Soliciting material pursuant to Rule 14a-12 under the Exchange Act (17 CFR 240.14a-12) |
| ¨ |
Pre-commencement communications pursuant to Rule 14d-2(b) under the Exchange Act (17 CFR 240.14d-2(b)) |
| ¨ |
Pre-commencement communications pursuant to Rule 13e-4(c) under the Exchange Act (17 CFR 240.13e-4(c)) |
Securities registered pursuant to Section 12(b) of the Act:
| Title
of each class |
|
Trading
symbol(s) |
|
Name
of each exchange on which registered |
| Common
stock, par value $0.001 per share |
|
XPO |
|
New
York Stock Exchange |
Indicate by check mark whether the registrant is an emerging
growth company as defined in Rule 405 of the Securities Act of 1933 (§230.405 of this chapter) or
Rule 12b-2 of the Securities Exchange Act of 1934 (§240.12b-2 of this chapter). |
| |
| Emerging growth company ¨ |
| |
| If an emerging growth company, indicate by check mark if the registrant has elected not to use the extended transition period for complying with any new or revised financial accounting standards provided pursuant to Section 13(a) of the Exchange Act. ¨ |
Item 7.01. Regulation FD Disclosure.
On October 30, 2023, XPO, Inc. (the “Company”)
released a slide presentation expected to be used by the Company in connection with certain future investor presentations. A copy of the
presentation is attached as Exhibit 99.1 to this Current Report on Form 8-K.
The slide presentation should be read together and with the Company’s
filings with the Securities and Exchange Commission, including the Quarterly Report on Form 10-Q for the fiscal quarter ended September 30,
2023.
The information furnished in this Item 7.01, including Exhibit 99.1,
shall not be deemed “filed” for purposes of Section 18 of the Securities Exchange Act of 1934, as amended (the “Exchange
Act”), or otherwise subject to the liabilities of that Section, and shall not be deemed to be incorporated by reference into any
filing of the Company under the Exchange Act or the Securities Act of 1933, as amended, except to the extent that the registrant specifically
incorporates any such information by reference.
| Item 9.01. |
|
Financial Statements and Exhibits. |
(d) Exhibits
SIGNATURE
Pursuant to the requirements of the Securities
Exchange Act of 1934, the registrant has duly caused this report to be signed on its behalf by the undersigned hereunto duly authorized.
| |
|
|
|
| Date: October 30, 2023 |
XPO, INC.
|
| |
By: |
/s/
Kyle Wismans |
| |
|
Kyle Wismans |
| |
|
Chief Financial Officer |
| |

Investor Overview Q3 2023 October 2023 Exhibit 99.1
2 Forward - looking statements This document includes forward - looking statements within the meaning of Section 27 A of the Securities Act of 1933 , as amended, and Section 21 E of the Securities Exchange Act of 1934 , as amended, including statements relating to our full year 2023 expectations of gross capex, interest expense, pension income, effective tax rate, and diluted share count, and future financial targets of North American LTL revenue CAGR, adjusted EBITDA CAGR, and adjusted operating ratio improvement . All statements other than statements of historical fact are, or may be deemed to be, forward - looking statements . In some cases, forward - looking statements can be identified by the use of forward - looking terms such as “anticipate,” “estimate,” “believe,” “continue,” “could,” “intend,” “may,” “plan,” “potential,” “predict,” “should,” “will,” “expect,” “objective,” “projection,” “forecast,” “goal,” “guidance,” “outlook,” “effort,” “target,” “trajectory” or the negative of these terms or other comparable terms . These forward - looking statements are based on certain assumptions and analyses made by us in light of our experience and our perception of historical trends, current conditions and expected future developments, as well as other factors we believe are appropriate in the circumstances . These forward - looking statements are subject to known and unknown risks, uncertainties and assumptions that may cause actual results, levels of activity, performance or achievements to be materially different from any future results, levels of activity, performance or achievements expressed or implied by such forward - looking statements . Factors that might cause or contribute to a material difference include the risks discussed in our filings with the SEC, and the following : the effects of business, economic, political, legal, and regulatory impacts or conflicts upon our operations ; supply chain disruptions, the global shortage of certain components such as semiconductor chips, strains on production or extraction of raw materials, cost inflation and labor and equipment shortages ; our ability to align our investments in capital assets, including equipment, service centers, and warehouses and other network facilities, to our customers’ demands ; our ability to implement our cost and revenue initiatives ; the effectiveness of our action plan, and other management actions, to improve our North American LTL business ; our ability to benefit from a sale, spin - off or other divestiture of one or more business units ; our ability to successfully integrate and realize anticipated synergies, cost savings and profit improvement opportunities with respect to acquired companies ; goodwill impairment, including in connection with a business unit sale or other divestiture ; fluctuations in currency exchange rates ; fuel price and fuel surcharge changes ; the expected benefits of the spin - offs of GXO Logistics, Inc . and RXO, Inc . on the size and business diversity of our company ; our ability to develop and implement suitable information technology systems and prevent failures in or breaches of such systems ; our indebtedness ; our ability to raise debt and equity capital ; fluctuations in fixed and floating interest rates ; our ability to maintain positive relationships with our network of third - party transportation providers ; our ability to attract and retain qualified drivers ; labor matters ; litigation ; risks associated with our self - insured claims ; governmental or political actions ; and competition and pricing pressures . All forward - looking statements set forth in this document are qualified by these cautionary statements and there can be no assurance that the actual results or developments anticipated by us will be realized or, even if substantially realized, that they will have the expected consequences to or effects on us or our business or operations . Forward - looking statements set forth in this document speak only as of the date hereof, and we do not undertake any obligation to update forward - looking statements except to the extent required by law . Non - GAAP financial measures This presentation contains non - GAAP financial measures . For a description of these non - GAAP financial measures, including a reconciliation to the most comparable measure under GAAP, see the Appendix to this presentation .

Third quarter 2023 highlights $1.98 billion of revenue, up 2% YoY $278 million of adjusted EBITDA, up 6% YoY $0.88 adjusted diluted earnings per share 1 LTL adjusted operating ratio of 86.2%, improving sequentially by 140 bps, outperforming seasonality by 370 bps LTL shipments per day up 7.8% and tonnage per day up 3.1% YoY, outperforming seasonality LTL yield, ex - fuel, up 6.4% YoY, significantly accelerating from Q2’23 LTL damage claims ratio of 0.4% improved from 0.7% in Q2’23 Record service quality drove a significant improvement in operating results Delivering solid results 1 Adjusted diluted earnings from continuing operations per share Refer to “Financial Reconciliations” and “Non - GAAP Financial Measures” sections in Appendix for related information 3

4 Third quarter 2023 performance REVENUE $1.98 billion OPERATING INCOME $154 million NET INCOME 1 $86 million DILUTED EARNINGS PER SHARE 2 $0.72 ADJUSTED NET INCOME 1 $105 million ADJUSTED DILUTED EPS 2 $ 0.88 ADJUSTED EBITDA $ 278 million CASH FLOW FROM OPERATING ACTIVITIES 3 $236 million NORTH AMERICAN LTL REVENUE $1.23 billion ADJUSTED EBITDA $241 million ADJUSTED OPERATING RATIO 86.2% 1 Net income from continuing operations attributable to common shareholders 2 Diluted earnings from continuing operations per share 3 Net cash provided by operating activities from continuing operations Refer to “Financial Reconciliations” and “Non - GAAP Financial Measures” sections in Appendix for related information EUROPEAN TRANSPORTATION REVENUE $752 million ADJUSTED EBITDA $44 million BY SEGMENT

Four pillars of LTL 2.0 plan will drive significant margin and earnings expansion 5 Provide best - in - class service 2 3 4 Invest in network for the long - term Accelerate yield growth Drive cost efficiencies Targets for LTL Growth, Profitability and Efficiency, 2021 - 2027 1 Revenue CAGR of 6% to 8% Adjusted EBITDA CAGR of 11% to 13% Adjusted operating ratio improvement of a t least 600 bps Note: Targets are for North American LTL only and assume 8% to 12% gross capex as a percent of revenue, on average, over the nex t several years Refer to “Non - GAAP Financial Measures” section in Appendix for related information

Strong position in North American LTL 6 6

A leading carrier in a compelling industry • $59 billion bedrock industry for the US economy; with 77% of share held by top 10 LTL players • Diverse demand across verticals, with secular growth drivers • Attractive pricing environment, with industry pricing positive YoY each year for over a decade • Strong service quality is key gating factor for share gains • Industry service center capacity stayed nearly flat for a decade, while demand trended up 1 6% North American LTL industry revenue CAGR Sources: Third - party research; company filings Note: Revenue CAGR for period 2010 – 2022 1 US service centers, includes ARCB, FDX, ODFL, SAIA, XPO and YELL; total number of service centers includes zones with doors 7

A major player in the supply - chain ecosystem Note: Company data for North American LTL segment as of December 31, 2022, unless otherwise noted; customers, employees, driv ers , trailers, and service centers are as of September 30, 2023 Refer to “Financial Reconciliations” and “Non - GAAP Financial Measures” sections in Appendix for related information 9% 2022 revenue allocated to gross capex 34 % return on invested capital >12 million s hipments per year 30 ,000 customers served $4.6 billion annual revenue 8 % 2022 industry share 8 13,0 0 0 d rivers 32 ,0 0 0 t railers 18 billion pounds of freight per year 6 2 0 million l inehaul miles run per year 22,0 0 0 e mployees 294 service centers

9 Expansive network covering 99% of US zip codes • 294 service centers • Cross - border and offshore capabilities • Strategic investments in high - demand markets Freight Assembly Centers Service Centers

Strategic mix of blue - chip and local customers 10 2% revenue from largest customer, low concentration risk 16 - y ear average t enure of t op 10 customers 30,000 customers as of September 30, 2023 Note: Company data for North American LTL segment as of December 31, 2022, unless otherwise noted; selected customers of XPO

LTL growth plan and levers 11

Provide best - in - class service Accelerate yield growth Drive cost efficiencies • Leveraging service excellence to earn price; Q3’23 contract renewal pricing up 9% YoY • Expanding accessorial revenue from value - added services • Growing share of higher - yielding local channel through growing local salesforce • Insourcing more linehaul miles: reduced Q3’23 outsourced miles by 200 bps YoY • Improving productivity of pickup - and - delivery and dock operations • Rationalizing corporate cost structure 12 Strong momentum in executing LTL 2.0 growth plan • Building a customer - centric service organization • Incentivizing employees to drive service quality • Improved Q3’23 damage claims ratio to 0.4% from 1.2% at launch of LTL 2.0 Invest in network for the long - term • Expanding linehaul fleet with tractors and in - house trailer manufacturing • Adding new doors in capacity - constrained markets • Making disciplined investments to further improve service

13 11% to 13% adjusted EBITDA CAGR in North American LTL 2021 - 2027 Combination of volume gains + pricing over inflation 6% to 7% 3% to 4% 2% Operating costs optimized through technology Linehaul insourced from third parties Expected components and contributions 11% to 13%

1.1% 1.2% 1.1% 0.9% 0.9% 1.0% 1.0% 1.2% 1.1% 0.9% 0.9% 0.6% 0.7% 0.7% 0.4% Q1 2020 Q2 2020 Q3 2020 Q4 2020 Q1 2021 Q2 2021 Q3 2021 Q4 2021 Q1 2022 Q2 2022 Q3 2022 Q4 2022 Q1 2023 Q2 2023 Q3 2023 Note: Based on claims payment data 14 LTL 2.0 service initiatives drove company - best damage claims ratio in Q3’23 LTL 2.0 Damage claims ratio (as a % of LTL revenue)

Employee engagement and satisfaction at record levels H ighest employee satisfaction in a decade 17% better employee retention 15 Note: Data points are for full year 2022 unless otherwise specified 47 % of drivers have 10+ years tenure Experienced drivers are the #1 asset for service quality 100+ graduates in field management program Strong leadership training programs drive career growth 54% of field management trainees are diverse DE&I initiatives identify and advance high - potential talent Employee satisfaction in Q3’23 up over 20% since starting LTL 2.0

Disciplined investing in high - return projects 16 Tractor age in years As of December 31 5.3 5.1 5.4 5.9 5.9 Note: Gross capex and revenue for North American LTL only Growth plan anticipates gross capex of 8% to 12% of revenue on average for the next several years 5.2 $145 $197 $145 $197 $424 $448 3.8% 5.2% 4.1% 4.8% 9.1% 12.9% 0.0% 2.0% 4.0% 6.0% 8.0% 10.0% 12.0% 14.0% $- $100 $200 $300 $400 $500 $600 $700 $800 2018 2019 2020 2021 2022 YTD 2023 Gross capex as a % of revenue Gross capex ($ millions)

In - house capabilities provide distinct competitive advantages Trailer manufacturing facility in Arkansas • Expanded linehaul trailer fleet by 4,700 units or 10% in 2022 • Self - sufficient for critical component of fleet capacity, instead of relying on OEMs • Added second production line in January 2022 and third line in December 2022 • Maintains OEM parts inventories for maintenance shops in the XPO network • On track to exceed production target of 6,000 trailers in 2023 17 Ability to control capacity and timing to best meet demand National footprint of 130 commercial driver training schools • Trained over 1,700 drivers in 2022, nearly double the 2021 count • Unique advantage in combatting industrywide driver shortage • XPO - trained drivers historically have better safety records and less turnover • Dockworker - to - driver career paths and upskilling options enhance retention

Appendix 18

European Transportation segment • In France: the #1 full truckload (FTL) broker and the #1 pallet network (LTL) provider • In Iberia (Spain and Portugal): the #1 FTL broker and the #1 LTL provider • In the UK: a top - tier dedicated truckload provider, and the largest single - owner LTL network • Serves a diverse base of customers with consumer, trade and industrial markets, including many sector leaders that have long - tenured relationships with XPO • Range of services includes dedicated truckload, LTL, FTL brokerage, managed transportation, last mile and freight forwarding, as well as multimodal solutions that are customized to reduce CO 2 e emissions Unique pan - European transportation platform holds leading positions in key geographies 19 19

20 The company provided the following updated expectations: • Gross capex of $675 million to $725 million • Interest expense of $170 million to $175 million • Pension income of $15 million to $20 million • Effective tax rate of 23% to 24% • Diluted share count of 118 million Full year 2023 planning assumptions

Financial reconciliations The following table reconciles XPO’s net income from continuing operations attributable to common shareholders for the period s e nded September 30, 2023 and 2022 to adjusted EBITDA for the same periods. 21 Reconciliation of net income from continuing operations to adjusted EBITDA Refer to “Non - GAAP Financial Measures” section on page 25 of this document $ in millions (unaudited) Change % Change % Net income from continuing operations attributable to common shareholders $ 86 $ 92 -6.5% $ 134 $ 220 -39.1% Debt extinguishment loss - - 23 26 Interest expense 41 35 126 103 Income tax provision 31 27 48 66 Depreciation and amortization expense 110 99 318 289 Transaction and integration costs 8 2 47 16 Restructuring costs 1 7 35 15 Other 1 - 1 - Adjusted EBITDA $ 278 $ 262 6.1% $ 732 $ 735 -0.4% Three Months Ended September 30, Nine Months Ended September 30, 2023 2022 2023 2022

Financial reconciliations (cont.) The following table reconciles XPO’s net income from continuing operations attributable to common shareholders for the period s e nded September 30, 2023 and 2022 to adjusted net income from continuing operations attributable to common shareholders for the sam e periods. 22 1 The income tax rate applied to reconciling items is based on the GAAP annual effective tax rate, excluding discrete items, no n - deductible compensation, and contribution - and margin - based taxes Refer to “Non - GAAP Financial Measures” section on page 25 of this document Reconciliation of adjusted net income and adjusted diluted earnings per share $ in millions, except per-share data (unaudited) Net income from continuing operations attributable to common shareholders $ 86 $ 92 $ 134 $ 220 Debt extinguishment loss - - 23 26 Amortization of acquisition-related intangible assets 15 13 42 40 Transaction and integration costs 8 2 47 16 Restructuring costs 1 7 35 15 Income tax associated with the adjustments above (1) (5) (4) (28) (22) Adjusted net income from continuing operations attributable to common shareholders $ 105 $ 110 $ 253 $ 295 Adjusted diluted earnings from continuing operations per share $ 0.88 $ 0.95 $ 2.15 $ 2.55 Weighted-average common shares outstanding Diluted weighted-average common shares outstanding 119 116 118 116 2023 2022 2023 2022 Three Months Ended Nine Months Ended September 30, September 30,

Financial reconciliations (cont.) The following table reconciles XPO’s operating income attributable to its North American less - than - truckload segment to adjusted operating income, adjusted operating ratio and adjusted EBITDA for the respective periods shown in the table below. 23 Reconciliation of North American less - than - truckload adjusted operating ratio and adjusted EBITDA 1 Fuel, operating expenses and supplies includes fuel - related taxes 2 Operating ratio is calculated as (1 – (operating income divided by revenue)) 3 Adjusted operating ratio is calculated as (1 – (adjusted operating income divided by revenue)); adjusted operating margin is th e inverse of adjusted operating ratio 4 Adjusted EBITDA is used by the company’s chief operating decision maker to evaluate segment profit (loss) in accordance with ASC 280 Refer to “Non - GAAP Financial Measures” section on page 25 of this document $ in millions (unaudited) Revenue (excluding fuel surcharge revenue) $ 1,005 $ 940 Fuel surcharge revenue 223 196 Revenue 1,228 1,136 Salaries, wages and employee benefits 616 573 Purchased transportation 97 87 Fuel, operating expenses and supplies (1) 244 226 Operating taxes and licenses 11 12 Insurance and claims 20 33 (Gains) losses on sales of property and equipment 4 1 Depreciation and amortization 75 71 Transaction and integration costs - - Restructuring costs - 4 Operating income 161 129 Operating ratio (2) 86.8% 88.7% Amortization expense 9 9 Transaction and integration costs - - Restructuring costs - 4 Gains on real estate transactions - - Adjusted operating income $ 170 $ 142 Adjusted operating ratio (3) 86.2% 87.6% Depreciation expense 66 62 Pension income 5 4 Gains on real estate transactions - - Adjusted EBITDA (4) $ 241 $ 208 2023 2023 June 30, Three Months Ended September 30,
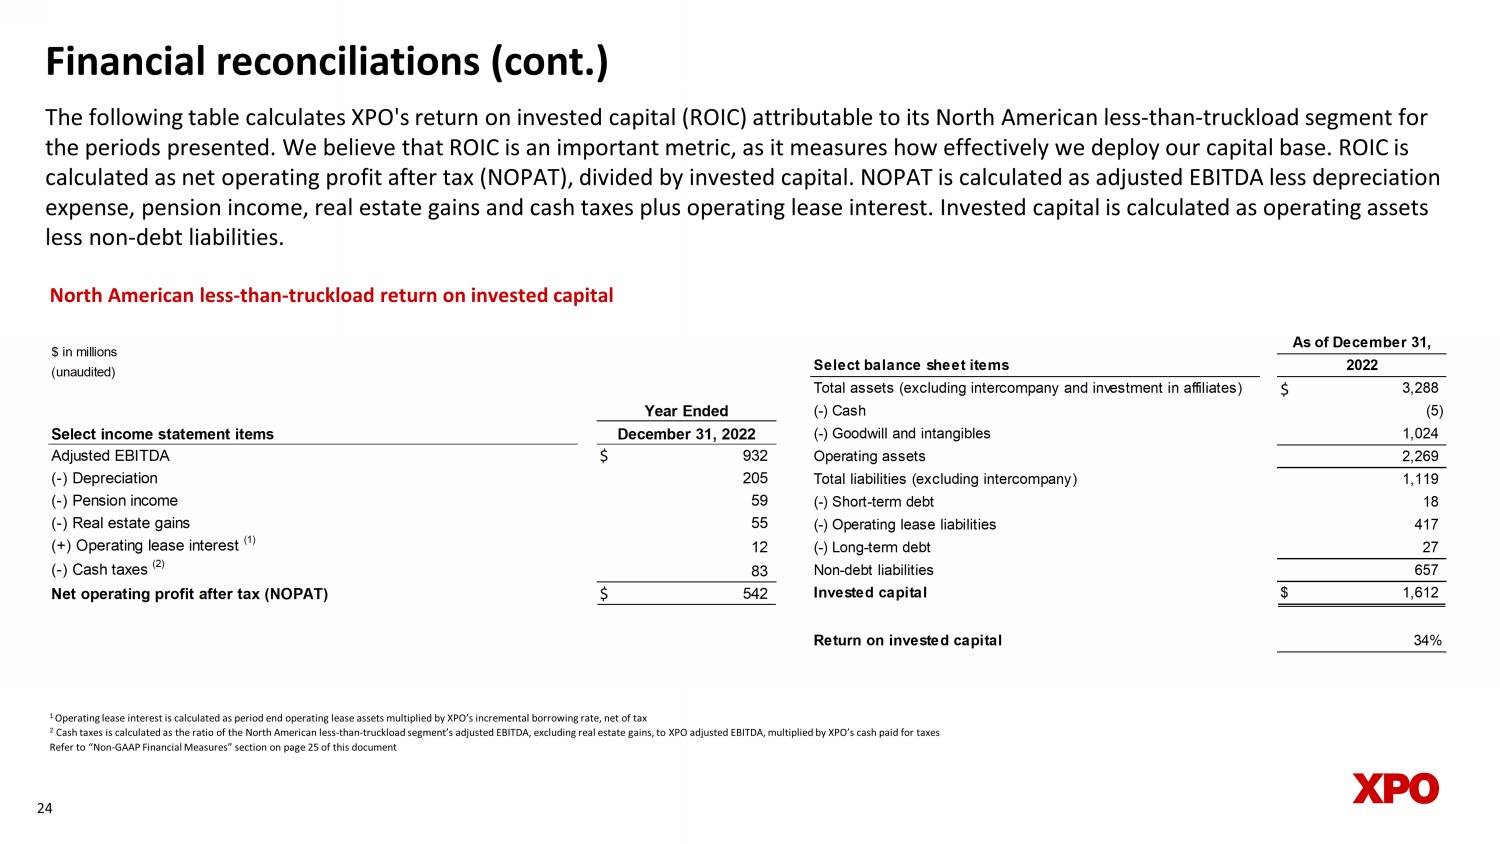
Financial reconciliations (cont.) The following table calculates XPO's return on invested capital (ROIC) attributable to its North American less - than - truckload se gment for the periods presented. We believe that ROIC is an important metric, as it measures how effectively we deploy our capital base . R OIC is calculated as net operating profit after tax (NOPAT), divided by invested capital. NOPAT is calculated as adjusted EBITDA les s d epreciation expense, pension income, real estate gains and cash taxes plus operating lease interest. Invested capital is calculated as op era ting assets less non - debt liabilities. 24 North American less - than - truckload return on invested capital 1 Operating lease interest is calculated as period end operating lease assets multiplied by XPO’s incremental borrowing rate, n et of tax 2 Cash taxes is calculated as the ratio of the North American less - than - truckload segment’s adjusted EBITDA, excluding real estat e gains, to XPO adjusted EBITDA, multiplied by XPO’s cash paid for taxes Refer to “Non - GAAP Financial Measures” section on page 25 of this document $ in millions (unaudited) Select income statement items Adjusted EBITDA $ 1,012 (-) Corporate costs (1) 80 (-) Depreciation 205 (-) Pension income 59 (-) Real estate gains 55 (+) Operating lease interest (2) 12 (-) Cash taxes (3) 83 Net operating profit after tax (NOPAT) $ 542 Select balance sheet items Total assets (excluding intercompany and investment in affiliates) $ 3,288 (-) Cash (5) (-) Goodwill and intangibles 1,024 Operating assets 2,269 Total liabilities (excluding intercompany) 1,119 (-) Short-term debt 18 (-) Operating lease liabilities 417 (-) Long-term debt 27 Non-debt liabilities 657 Invested capital $ 1,612 Return on invested capital 34% As of December 31, 2022 Year Ended December 31, 2022 $ in millions (unaudited) Select income statement items Adjusted EBITDA $ 932 (-) Depreciation 205 (-) Pension income 59 (-) Real estate gains 55 (+) Operating lease interest (1) 12 (-) Cash taxes (2) 83 Net operating profit after tax (NOPAT) $ 542 Year Ended December 31, 2022

Non - GAAP financial measures As required by the rules of the Securities and Exchange Commission (“SEC”), we provide reconciliations of the non - GAAP financial measures contained in this document to the most directly comparable measure under GAAP, which are set forth in the financial tables attached to this document . This document contains the following non - GAAP financial measures : adjusted earnings before interest, taxes, depreciation and amortization (“adjusted EBITDA”) on a consolidated basis ; adjusted diluted earnings from continuing operations per share (“adjusted EPS”) ; adjusted operating ratio for our North American less - than - truckload segment ; adjusted net income from continuing operations attributable to common shareholders ; adjusted operating income for our North American less - than - truckload segment ; and return on invested capital ("ROIC") for our North American less - than - truckload segment . We believe that the above adjusted financial measures facilitate analysis of our ongoing business operations because they exclude items that may not be reflective of, or are unrelated to, XPO and its business segments’ core operating performance, and may assist investors with comparisons to prior periods and assessing trends in our underlying businesses . Other companies may calculate these non - GAAP financial measures differently, and therefore our measures may not be comparable to similarly titled measures of other companies . These non - GAAP financial measures should only be used as supplemental measures of our operating performance . Adjusted EBITDA, adjusted net income from continuing operations attributable to common shareholders and adjusted EPS include adjustments for transaction and integration costs, as well as restructuring costs, and other adjustments as set forth in the attached tables . Transaction and integration adjustments are generally incremental costs that result from an actual or planned acquisition, divestiture or spin - off and may include transaction costs, consulting fees, stock - based compensation, retention awards, internal salaries and wages (to the extent the individuals are assigned full - time to integration and transformation activities) and certain costs related to integrating and converging IT systems . Restructuring costs primarily relate to severance costs associated with business optimization initiatives . Management uses these non - GAAP financial measures in making financial, operating and planning decisions and evaluating XPO’s and each business segment’s ongoing performance . We believe that adjusted EBITDA improves comparability from period to period by removing the impact of our capital structure (interest and financing expenses), asset base (depreciation and amortization), tax impacts and other adjustments as set out in the attached tables that management has determined are not reflective of core operating activities and thereby assist investors with assessing trends in our underlying businesses . We believe that adjusted net income from continuing operations attributable to common shareholders and adjusted EPS improve the comparability of our operating results from period to period by removing the impact of certain costs and gains that management has determined are not reflective of our core operating activities, including amortization of acquisition - related intangible assets, transaction and integration costs, restructuring costs and other adjustments as set out in the attached tables . We believe that adjusted operating income and adjusted operating ratio improve the comparability of our operating results from period to period by removing the impact of certain transaction and integration costs and restructuring costs, as well as amortization expenses . We believe that ROIC is an important metric as it measures how effectively we deploy our capital base . ROIC is calculated as net operating profit after tax ("NOPAT"), divided by invested capital . NOPAT is calculated as adjusted EBITDA less depreciation expense, pension income, real estate gains and cash taxes plus operating lease interest . Invested capital is calculated as operating assets less non - debt liabilities . With respect to our financial targets for the six - year period 2021 through 2027 of North American less - than - truckload adjusted EBITDA CAGR, and adjusted operating ratio, a reconciliation of these non - GAAP measures to the corresponding GAAP measures is not available without unreasonable effort due to the variability and complexity of the reconciling items described above that we exclude from these non - GAAP target measures . The variability of these items may have a significant impact on our future GAAP financial results and, as a result, we are unable to prepare the forward - looking statement of income and statement of cash flows in accordance with GAAP that would be required to produce such a reconciliation . 25
v3.23.3
| X |
- DefinitionBoolean flag that is true when the XBRL content amends previously-filed or accepted submission.
| Name: |
dei_AmendmentFlag |
| Namespace Prefix: |
dei_ |
| Data Type: |
xbrli:booleanItemType |
| Balance Type: |
na |
| Period Type: |
duration |
|
| X |
- DefinitionFor the EDGAR submission types of Form 8-K: the date of the report, the date of the earliest event reported; for the EDGAR submission types of Form N-1A: the filing date; for all other submission types: the end of the reporting or transition period. The format of the date is YYYY-MM-DD.
| Name: |
dei_DocumentPeriodEndDate |
| Namespace Prefix: |
dei_ |
| Data Type: |
xbrli:dateItemType |
| Balance Type: |
na |
| Period Type: |
duration |
|
| X |
- DefinitionThe type of document being provided (such as 10-K, 10-Q, 485BPOS, etc). The document type is limited to the same value as the supporting SEC submission type, or the word 'Other'.
| Name: |
dei_DocumentType |
| Namespace Prefix: |
dei_ |
| Data Type: |
dei:submissionTypeItemType |
| Balance Type: |
na |
| Period Type: |
duration |
|
| X |
- DefinitionAddress Line 1 such as Attn, Building Name, Street Name
| Name: |
dei_EntityAddressAddressLine1 |
| Namespace Prefix: |
dei_ |
| Data Type: |
xbrli:normalizedStringItemType |
| Balance Type: |
na |
| Period Type: |
duration |
|
| X |
- Definition
+ References
+ Details
| Name: |
dei_EntityAddressCityOrTown |
| Namespace Prefix: |
dei_ |
| Data Type: |
xbrli:normalizedStringItemType |
| Balance Type: |
na |
| Period Type: |
duration |
|
| X |
- DefinitionCode for the postal or zip code
| Name: |
dei_EntityAddressPostalZipCode |
| Namespace Prefix: |
dei_ |
| Data Type: |
xbrli:normalizedStringItemType |
| Balance Type: |
na |
| Period Type: |
duration |
|
| X |
- DefinitionName of the state or province.
| Name: |
dei_EntityAddressStateOrProvince |
| Namespace Prefix: |
dei_ |
| Data Type: |
dei:stateOrProvinceItemType |
| Balance Type: |
na |
| Period Type: |
duration |
|
| X |
- DefinitionA unique 10-digit SEC-issued value to identify entities that have filed disclosures with the SEC. It is commonly abbreviated as CIK. Reference 1: http://www.xbrl.org/2003/role/presentationRef
-Publisher SEC
-Name Exchange Act
-Number 240
-Section 12
-Subsection b-2
| Name: |
dei_EntityCentralIndexKey |
| Namespace Prefix: |
dei_ |
| Data Type: |
dei:centralIndexKeyItemType |
| Balance Type: |
na |
| Period Type: |
duration |
|
| X |
- DefinitionIndicate if registrant meets the emerging growth company criteria. Reference 1: http://www.xbrl.org/2003/role/presentationRef
-Publisher SEC
-Name Exchange Act
-Number 240
-Section 12
-Subsection b-2
| Name: |
dei_EntityEmergingGrowthCompany |
| Namespace Prefix: |
dei_ |
| Data Type: |
xbrli:booleanItemType |
| Balance Type: |
na |
| Period Type: |
duration |
|
| X |
- DefinitionCommission file number. The field allows up to 17 characters. The prefix may contain 1-3 digits, the sequence number may contain 1-8 digits, the optional suffix may contain 1-4 characters, and the fields are separated with a hyphen.
| Name: |
dei_EntityFileNumber |
| Namespace Prefix: |
dei_ |
| Data Type: |
dei:fileNumberItemType |
| Balance Type: |
na |
| Period Type: |
duration |
|
| X |
- DefinitionTwo-character EDGAR code representing the state or country of incorporation.
| Name: |
dei_EntityIncorporationStateCountryCode |
| Namespace Prefix: |
dei_ |
| Data Type: |
dei:edgarStateCountryItemType |
| Balance Type: |
na |
| Period Type: |
duration |
|
| X |
- DefinitionThe exact name of the entity filing the report as specified in its charter, which is required by forms filed with the SEC. Reference 1: http://www.xbrl.org/2003/role/presentationRef
-Publisher SEC
-Name Exchange Act
-Number 240
-Section 12
-Subsection b-2
| Name: |
dei_EntityRegistrantName |
| Namespace Prefix: |
dei_ |
| Data Type: |
xbrli:normalizedStringItemType |
| Balance Type: |
na |
| Period Type: |
duration |
|
| X |
- DefinitionThe Tax Identification Number (TIN), also known as an Employer Identification Number (EIN), is a unique 9-digit value assigned by the IRS. Reference 1: http://www.xbrl.org/2003/role/presentationRef
-Publisher SEC
-Name Exchange Act
-Number 240
-Section 12
-Subsection b-2
| Name: |
dei_EntityTaxIdentificationNumber |
| Namespace Prefix: |
dei_ |
| Data Type: |
dei:employerIdItemType |
| Balance Type: |
na |
| Period Type: |
duration |
|
| X |
- DefinitionLocal phone number for entity.
| Name: |
dei_LocalPhoneNumber |
| Namespace Prefix: |
dei_ |
| Data Type: |
xbrli:normalizedStringItemType |
| Balance Type: |
na |
| Period Type: |
duration |
|
| X |
- DefinitionBoolean flag that is true when the Form 8-K filing is intended to satisfy the filing obligation of the registrant as pre-commencement communications pursuant to Rule 13e-4(c) under the Exchange Act. Reference 1: http://www.xbrl.org/2003/role/presentationRef
-Publisher SEC
-Name Exchange Act
-Number 240
-Section 13e
-Subsection 4c
| Name: |
dei_PreCommencementIssuerTenderOffer |
| Namespace Prefix: |
dei_ |
| Data Type: |
xbrli:booleanItemType |
| Balance Type: |
na |
| Period Type: |
duration |
|
| X |
- DefinitionBoolean flag that is true when the Form 8-K filing is intended to satisfy the filing obligation of the registrant as pre-commencement communications pursuant to Rule 14d-2(b) under the Exchange Act. Reference 1: http://www.xbrl.org/2003/role/presentationRef
-Publisher SEC
-Name Exchange Act
-Number 240
-Section 14d
-Subsection 2b
| Name: |
dei_PreCommencementTenderOffer |
| Namespace Prefix: |
dei_ |
| Data Type: |
xbrli:booleanItemType |
| Balance Type: |
na |
| Period Type: |
duration |
|
| X |
- DefinitionTitle of a 12(b) registered security. Reference 1: http://www.xbrl.org/2003/role/presentationRef
-Publisher SEC
-Name Exchange Act
-Number 240
-Section 12
-Subsection b
| Name: |
dei_Security12bTitle |
| Namespace Prefix: |
dei_ |
| Data Type: |
dei:securityTitleItemType |
| Balance Type: |
na |
| Period Type: |
duration |
|
| X |
- DefinitionName of the Exchange on which a security is registered. Reference 1: http://www.xbrl.org/2003/role/presentationRef
-Publisher SEC
-Name Exchange Act
-Number 240
-Section 12
-Subsection d1-1
| Name: |
dei_SecurityExchangeName |
| Namespace Prefix: |
dei_ |
| Data Type: |
dei:edgarExchangeCodeItemType |
| Balance Type: |
na |
| Period Type: |
duration |
|
| X |
- DefinitionBoolean flag that is true when the Form 8-K filing is intended to satisfy the filing obligation of the registrant as soliciting material pursuant to Rule 14a-12 under the Exchange Act. Reference 1: http://www.xbrl.org/2003/role/presentationRef
-Publisher SEC
-Name Exchange Act
-Section 14a
-Number 240
-Subsection 12
| Name: |
dei_SolicitingMaterial |
| Namespace Prefix: |
dei_ |
| Data Type: |
xbrli:booleanItemType |
| Balance Type: |
na |
| Period Type: |
duration |
|
| X |
- DefinitionTrading symbol of an instrument as listed on an exchange.
| Name: |
dei_TradingSymbol |
| Namespace Prefix: |
dei_ |
| Data Type: |
dei:tradingSymbolItemType |
| Balance Type: |
na |
| Period Type: |
duration |
|
| X |
- DefinitionBoolean flag that is true when the Form 8-K filing is intended to satisfy the filing obligation of the registrant as written communications pursuant to Rule 425 under the Securities Act. Reference 1: http://www.xbrl.org/2003/role/presentationRef
-Publisher SEC
-Name Securities Act
-Number 230
-Section 425
| Name: |
dei_WrittenCommunications |
| Namespace Prefix: |
dei_ |
| Data Type: |
xbrli:booleanItemType |
| Balance Type: |
na |
| Period Type: |
duration |
|
XPO (NYSE:XPO)
Historical Stock Chart
Von Apr 2024 bis Mai 2024

XPO (NYSE:XPO)
Historical Stock Chart
Von Mai 2023 bis Mai 2024
