WHIRLPOOL CORP /DE/ 2000 North M-63 0000106640 false 0000106640 2024-02-27 2024-02-27 0000106640 exch:XCHI 2024-02-27 2024-02-27 0000106640 exch:XNYS 2024-02-27 2024-02-27
UNITED STATES
SECURITIES AND EXCHANGE COMMISSION
WASHINGTON, DC 20549
FORM 8-K
CURRENT REPORT
PURSUANT TO SECTION 13 OR 15(d)
OF THE SECURITIES EXCHANGE ACT OF 1934
Date of report (Date of earliest event reported): February 27, 2024
WHIRLPOOL CORPORATION
(Exact name of registrant as Specified in Charter)
|
|
|
|
|
| Delaware |
|
1-3932 |
|
38-1490038 |
(State or Other Jurisdiction
of Incorporation) |
|
(Commission
File Number) |
|
(I.R.S. Employer
Identification No.) |
|
|
|
| 2000 North M-63, Benton Harbor, Michigan |
|
49022-2692 |
| (Address of principal executive offices) |
|
(Zip Code) |
(269) 923-5000
(Registrant’s telephone number, including area code)
Check the appropriate box below if the Form 8-K filing is intended to simultaneously satisfy the filing obligation of the registrant under any of the following provisions:
| ☐ |
Written communications pursuant to Rule 425 under the Securities Act (17 CFR 230.425) |
| ☐ |
Soliciting material pursuant to Rule 14a-12 under the Exchange Act (17 CFR 240.14a-12) |
| ☐ |
Pre-commencement communications pursuant to Rule 14d-2(b) under the Exchange Act (17 CFR 240.14d-2(b)) |
| ☐ |
Pre-commencement communications pursuant to Rule 13e-4(c) under the Exchange Act (17 CFR 240.13e-4(c)) |
Securities registered pursuant to Section 12(b) of the Act:
|
|
|
|
|
Title of each class |
|
Trading
symbol(s) |
|
Name of each exchange
on which registered |
| Common stock, par value $1.00 per share |
|
WHR |
|
Chicago Stock Exchange and New York Stock Exchange |
Indicate by check mark whether the registrant is an emerging growth company as defined in Rule 405 of the Securities Act of 1933 (§230.405 of this chapter) or Rule 12b-2 of the Securities Exchange Act of 1934 (§240.12b-2 of this chapter).
Emerging growth company ☐
If an emerging growth company, indicate by check mark if the registrant has elected not to use the extended transition period for complying with any new or revised financial accounting standards provided pursuant to Section 13(a) of the Exchange Act. ☐
| Item 7.01. |
Regulation FD Disclosure. |
A copy of material which will be used in investor presentations delivered by Whirlpool Corporation representatives from time to time beginning on February 27, 2024 is furnished as Exhibit 99.1 to this Form 8-K. Exhibit 99.1 shall not be deemed “filed” for purposes of Section 18 of the Securities Exchange Act of 1934, as amended (the “Exchange Act”), or otherwise subject to the liabilities under that Section and shall not be deemed to be incorporated by reference into any filing of the Company under the Securities Act of 1933, as amended, or the Exchange Act.
| Item 9.01. |
Financial Statements and Exhibits. |
(d) Exhibits.
|
|
|
Exhibit No. |
|
Exhibit |
|
|
| Exhibit 99.1 |
|
Investor Presentation Material |
|
|
| Exhibit 104 |
|
Cover Page Interactive Data File (embedded within the Inline XBRL document) |
Website Disclosure
We routinely post important information for investors on our website, whirlpoolcorp.com, in the “Investors” section. We also intend to update the Hot Topics Q&A portion of this webpage as a means of disclosing material, non-public information and for complying with our disclosure obligations under Regulation FD. Accordingly, investors should monitor the Investors section of our website, in addition to following our press releases, SEC filings, public conference calls, presentations and webcasts. The information contained on, or that may be accessed through, our webpage is not incorporated by reference into, and is not a part of, this document.
SIGNATURES
Pursuant to the requirements of the Securities Exchange Act of 1934, the Registrant has duly caused this Form 8-K Report to be signed on its behalf by the undersigned hereunto duly authorized.
|
|
|
| WHIRLPOOL CORPORATION |
|
|
| By: |
|
/s/ Bridget K. Quinn |
| Name: |
|
Bridget K. Quinn |
| Title: |
|
Deputy General Counsel and Corporate Secretary |
| Date: |
|
February 27, 2024 |
Exhibit 99.1 Investor Day NYSE | Tuesday, February 27, 2024

Agenda Welcome, Overview, & Introductions K. Thomas 9:00–9:05
am Unlocking Value Creation M. Bitzer 9:05–9:30 am Through A Refocused Portfolio Organic Value Creation From A. Perucchetti & 9:30–10:15 am North America & SDA Global Business L. Beaufils Long Term Value Creation &
Capital Allocation J. Peters 10:15–10:45 am Break All 10:45–10:55 am M. Bitzer, J. Peters, Q&A 10:55–12:00 pm A. Perucchetti & L. Beaufils 2

Global Executive Team Roberto Campos Holger Gottstein EVP, Global
Product Organization & EVP, Strategy & Strategic Sourcing Business Development Marc Bitzer Jim Peters Chairman & EVP, Chief Financial Officer & Chief Executive Officer President, Whirlpool Asia Ava Harter Pam Klyn Carey
Martin EVP & EVP, Corporate Relations & EVP & Chief Legal Officer Sustainability Chief Human Resources Officer Alessandro Perucchetti Ludo Beaufils EVP & President, EVP, Kitchenaid North America Small Appliances
Gilles Morel Juan Carlos Puente EVP & EVP & President, President, EMEA Latin America 3 Today’s Presenters

Cautionary Statement This document contains forward-looking statements
about Whirlpool Corporation and its consolidated subsidiaries ( Whirlpool ) that speak only as of this date. Whirlpool disclaims any obligation to update these statements. Forward-looking statements in this document may include, but are not limited
to, statements regarding future financial results, long-term value creation goals, restructuring and resegmentation expectations, productivity, raw material prices and related costs, supply chain, transaction-related closing and synergies
expectations, asset impairment, litigation, ESG efforts, debt repayment expectations, and the impact of COVID-19 and the Russia/Ukraine, Israel and Red Sea conflicts on our operations. Many risks, contingencies and uncertainties could
cause actual results to differ materially from Whirlpool's forward-looking statements. Among these factors are: (1) intense competition in the home appliance industry, and the impact of the changing retail environment, including
direct-to-consumer sales; (2) Whirlpool's ability to maintain or increase sales to significant trade customers; (3) Whirlpool's ability to maintain its reputation and brand image; (4) the ability of Whirlpool to achieve its business objectives
and leverage its global operating platform, and accelerate the rate of innovation; (5) Whirlpool’s ability to understand consumer preferences and successfully develop new products; (6) Whirlpool's ability to obtain and protect intellectual
property rights; (7) acquisition, divestiture, and investment-related risks, including risks associated with our past acquisitions; (8) the ability of suppliers of critical parts, components and manufacturing equipment to deliver sufficient
quantities to Whirlpool in a timely and cost-effective manner; (9) COVID-19 pandemic, other public health emergency-related business disruptions and economic uncertainty; (10) Whirlpool's ability to navigate risks associated with our presence
in emerging markets; (11) risks related to our international operations; (12) Whirlpool's ability to respond to unanticipated social, political and/or economic events; (13) information technology system failures, data security breaches, data privacy
compliance, network disruptions, and cybersecurity attacks; (14) product liability and product recall costs; (15) Whirlpool's ability to attract, develop and retain executives and other qualified employees; (16) the impact of labor relations;
(17) fluctuations in the cost of key materials (including steel, resins, base metals) and components and the ability of Whirlpool to offset cost increases; (18) Whirlpool's ability to manage foreign currency fluctuations; (19)
impacts from goodwill impairment and related charges; (20) triggering events or circumstances impacting the carrying value of our long-lived assets; (21) inventory and other asset risk; (22) health care cost trends, regulatory changes and variations
between results and estimates that could increase future funding obligations for pension and postretirement benefit plans; (23) litigation, tax, and legal compliance risk and costs; (24) the effects and costs of governmental
investigations or related actions by third parties; (25) changes in the legal and regulatory environment including environmental, health and safety regulations, data privacy, and taxes and tariffs; (26) Whirlpool's ability to respond to the
impact of climate change and climate change regulation; and (27) the uncertain global economy and changes in economic conditions. Additional information concerning these and other factors can be found in Risk Factors in Item 1A of Whirlpool’s
2023 10-K report. We undertake no obligation to update any forward-looking statement, and investors are advised to review disclosures in our filings with the SEC. It is not possible to foresee or identify all factors that could cause actual
results to differ from expected or historic results. Therefore, investors should not consider the foregoing factors to be an exhaustive statement of all risks, uncertainties, or factors that could potentially cause actual results to
differ from forward-looking statements. 4
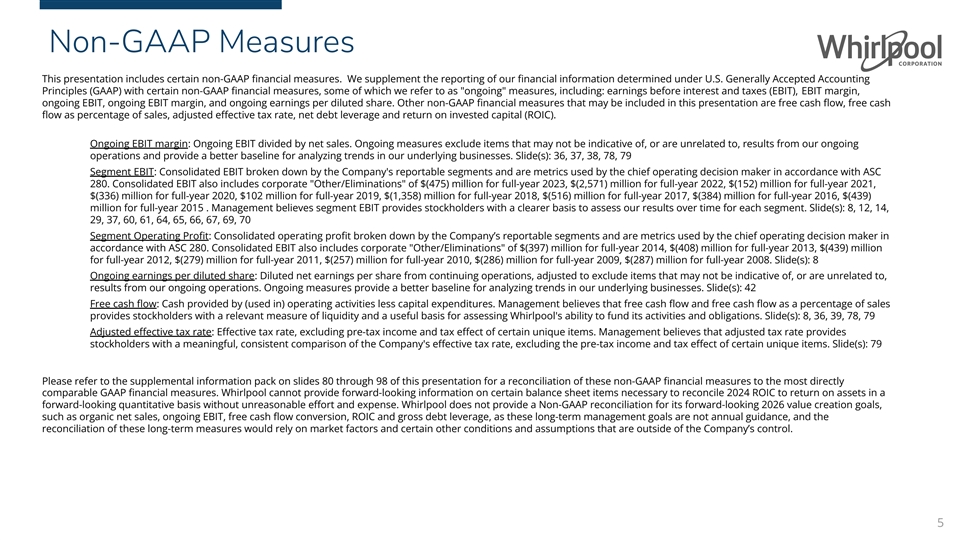
Non-GAAP Measures This presentation includes certain non-GAAP
financial measures. We supplement the reporting of our financial information determined under U.S. Generally Accepted Accounting Principles (GAAP) with certain non-GAAP financial measures, some of which we refer to as ongoing
measures, including: earnings before interest and taxes (EBIT), EBIT margin, ongoing EBIT, ongoing EBIT margin, and ongoing earnings per diluted share. Other non-GAAP financial measures that may be included in this presentation are free cash
flow, free cash flow as percentage of sales, adjusted effective tax rate, net debt leverage and return on invested capital (ROIC). Ongoing EBIT margin: Ongoing EBIT divided by net sales. Ongoing measures exclude items that may not
be indicative of, or are unrelated to, results from our ongoing operations and provide a better baseline for analyzing trends in our underlying businesses. Slide(s): 36, 37, 38, 78, 79 Segment EBIT: Consolidated EBIT broken down by the Company's
reportable segments and are metrics used by the chief operating decision maker in accordance with ASC 280. Consolidated EBIT also includes corporate Other/Eliminations of $(475) million for full-year 2023, $(2,571) million for full-year 2022, $(152)
million for full-year 2021, $(336) million for full-year 2020, $102 million for full-year 2019, $(1,358) million for full-year 2018, $(516) million for full-year 2017, $(384) million for full-year 2016, $(439) million for full-year 2015 . Management
believes segment EBIT provides stockholders with a clearer basis to assess our results over time for each segment. Slide(s): 8, 12, 14, 29, 37, 60, 61, 64, 65, 66, 67, 69, 70 Segment Operating Profit: Consolidated operating profit broken
down by the Company’s reportable segments and are metrics used by the chief operating decision maker in accordance with ASC 280. Consolidated EBIT also includes corporate Other/Eliminations of $(397) million for full-year 2014, $(408) million
for full-year 2013, $(439) million for full-year 2012, $(279) million for full-year 2011, $(257) million for full-year 2010, $(286) million for full-year 2009, $(287) million for full-year 2008. Slide(s): 8 Ongoing earnings per diluted share:
Diluted net earnings per share from continuing operations, adjusted to exclude items that may not be indicative of, or are unrelated to, results from our ongoing operations. Ongoing measures provide a better baseline for analyzing trends in our
underlying businesses. Slide(s): 42 Free cash flow: Cash provided by (used in) operating activities less capital expenditures. Management believes that free cash flow and free cash flow as a percentage of sales provides
stockholders with a relevant measure of liquidity and a useful basis for assessing Whirlpool's ability to fund its activities and obligations. Slide(s): 8, 36, 39, 78, 79 Adjusted effective tax rate: Effective tax rate, excluding pre-tax
income and tax effect of certain unique items. Management believes that adjusted tax rate provides stockholders with a meaningful, consistent comparison of the Company's effective tax rate, excluding the pre-tax income and tax
effect of certain unique items. Slide(s): 79 Please refer to the supplemental information pack on slides 80 through 98 of this presentation for a reconciliation of these non-GAAP financial measures to the most directly comparable GAAP
financial measures. Whirlpool cannot provide forward-looking information on certain balance sheet items necessary to reconcile 2024 ROIC to return on assets in a forward-looking quantitative basis without unreasonable effort and expense.
Whirlpool does not provide a Non-GAAP reconciliation for its forward-looking 2026 value creation goals, such as organic net sales, ongoing EBIT, free cash flow conversion, ROIC and gross debt leverage, as these long-term management goals are
not annual guidance, and the reconciliation of these long-term measures would rely on market factors and certain other conditions and assumptions that are outside of the Company’s control. 5
Unlocking Value Creation Through A Refocused Portfolio Marc Bitzer
Chairman & Chief Executive Officer Investor Day 2024 6
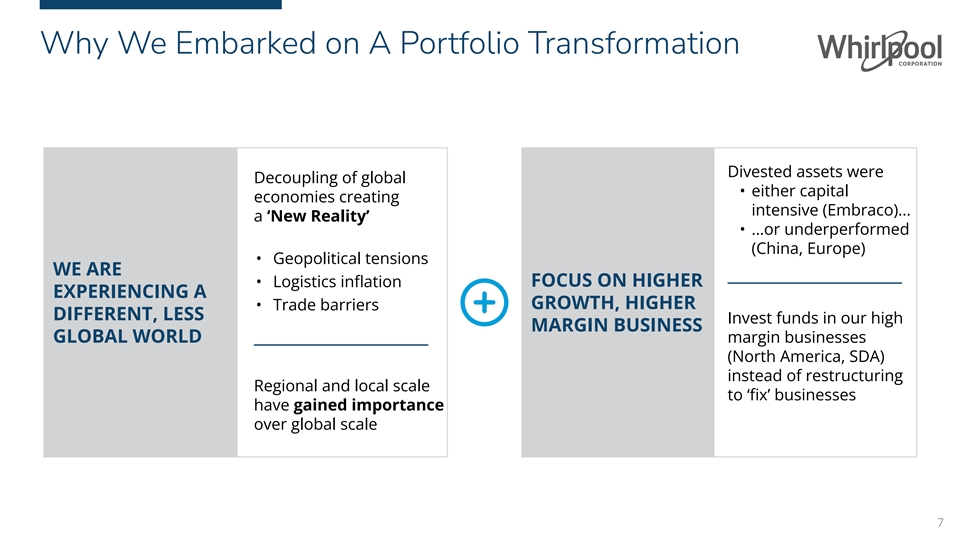
Why We Embarked on A Portfolio Transformation Divested assets were
Decoupling of global • either capital economies creating intensive (Embraco)... a ‘New Reality’ • …or underperformed (China, Europe) • Geopolitical tensions WE ARE FOCUS ON HIGHER • Logistics inflation
EXPERIENCING A GROWTH, HIGHER • Trade barriers DIFFERENT, LESS Invest funds in our high MARGIN BUSINESS GLOBAL WORLD margin businesses (North America, SDA) instead of restructuring Regional and local scale to ‘fix’ businesses
have gained importance over global scale 7

Why We Embarked on A Portfolio Transformation EXAMPLE: EMEA BUSINESS
RESULTS FREE CASH FLOW ($M) EBIT MARGIN %* 3% $200 0% $0 $(200) (3)% 2008 2023 Post Brexit and Russia Business Sale No Clear Path to Sustainable Value Creation 8 *Reflects EMEA operating profit margin for 2008-2013, EMEA ongoing
operating profit margin for 2014 and EMEA ongoing EBIT margin for 2015-2016, and EMEA EBIT margin for 2017-2023.
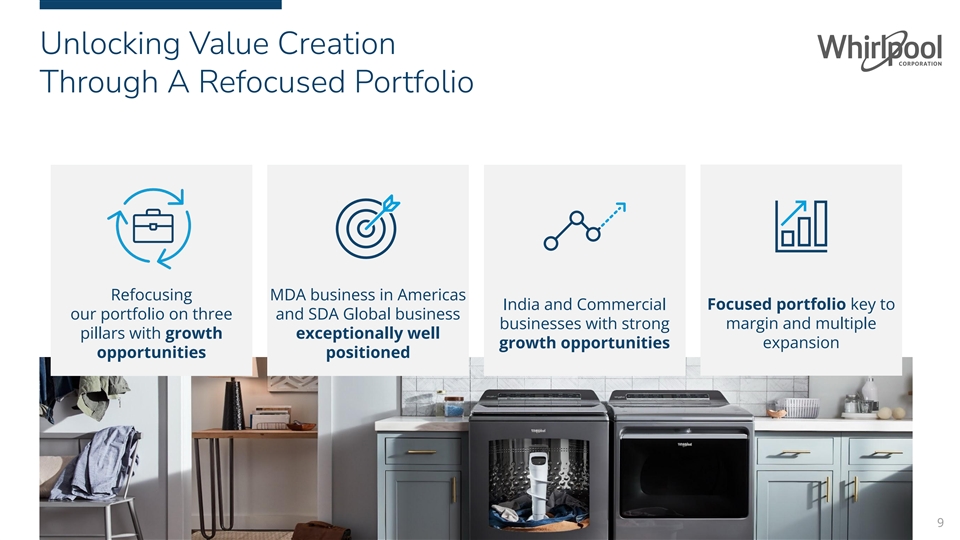
Unlocking Value Creation Through A Refocused Portfolio Refocusing MDA
business in Americas India and Commercial Focused portfolio key to our portfolio on three and SDA Global business businesses with strong margin and multiple pillars with growth exceptionally well growth opportunities expansion opportunities
positioned 9
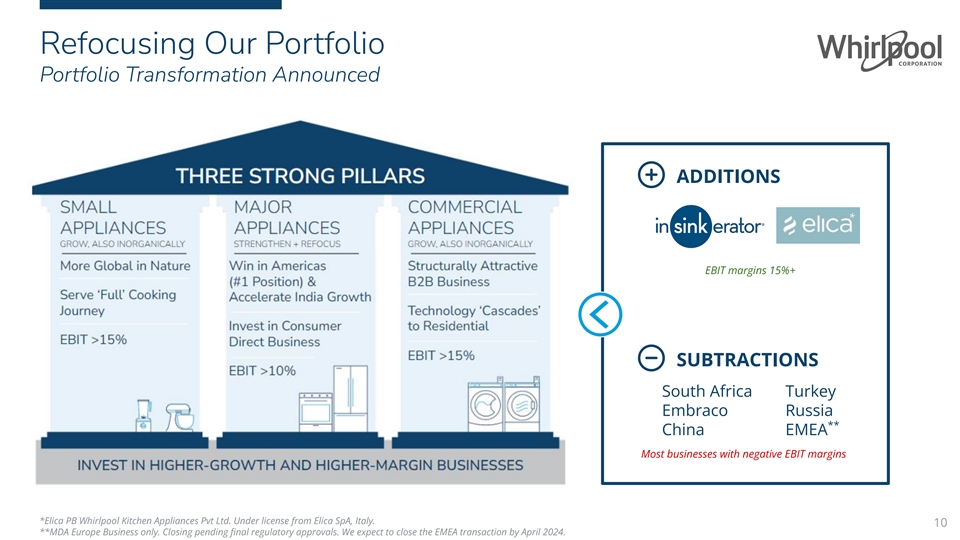
Refocusing Our Portfolio Portfolio Transformation Announced ADDITIONS *
EBIT margins 15%+ SUBTRACTIONS South Africa Turkey Embraco Russia ** China EMEA Most businesses with negative EBIT margins *Elica PB Whirlpool Kitchen Appliances Pvt Ltd. Under license from Elica SpA, Italy. 10 **MDA Europe Business only. Closing
pending final regulatory approvals. We expect to close the EMEA transaction by April 2024.

Our Major Appliance Business with A Strong Position in the Americas and
India NORTH AMERICA INDIA #1 $11.4B Share 2023 #3 $0.8B Position Net Sales Share 2023 Position Net Sales LATIN AMERICA #1 $3.4B Share 2023 Position Net Sales 11 Note: All figures reflective of the major domestic appliances (MDA)
only.

Segment Reporting Reflects Transformed Portfolio PRIOR REPORTING
SEGMENTS (2023) RECAST REPORTING SEGMENTS (2023) North America MDA NS | $11.4B NS | $10.8B Major Domestic Appliances EBIT | 9.7% EBIT | 9.4% North America Small Domestic Appliances (1) EMEA MDA NS | $3.6B NS | $3.4B Major Domestic Appliances EBIT |
1.6% EBIT | 0.7% EMEA Small Domestic Appliances Latin America MDA NS | $3.4B NS | $3.4B Major Domestic Appliances EBIT | 6.0% EBIT | 5.6% Latin America Small Domestic Appliances Asia MDA NS | $1.0B NS | $1.0B Major Domestic Appliances EBIT | 2.7%
EBIT | 2.3% Asia Small Domestic Appliances NS | $1.0B Rev | $X.XB SDA Global EBIT | 14.3% EBIT | $X.XB 12 (1) Post transaction closing, MDA EMEA will be included in prior comparable periods only.

Organic Value Creation From Our North American Business Alessandro
Perucchetti Executive Vice President and President, North America 13
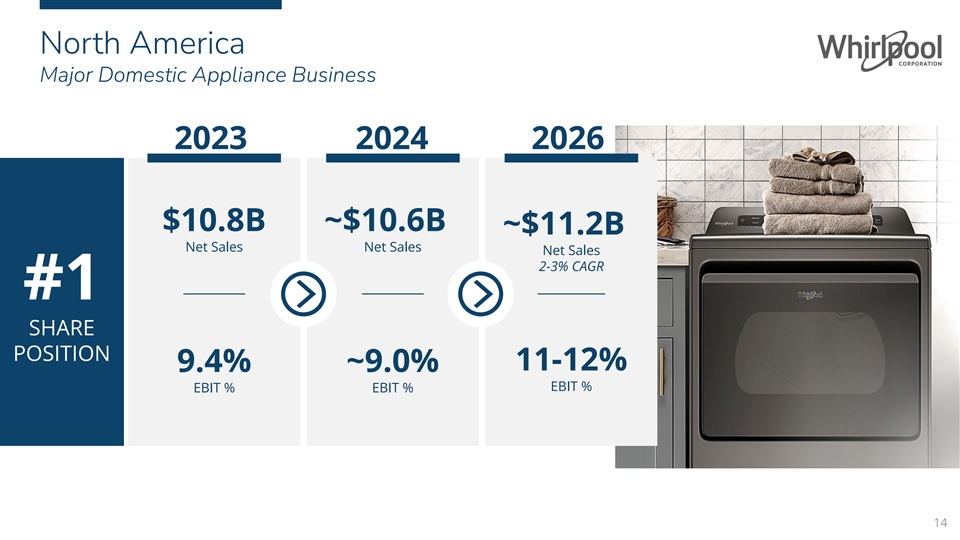
North America Major Domestic Appliance Business 2023 2024 2026 $10.8B
~$10.6B ~$11.2B Net Sales Net Sales Net Sales 2-3% CAGR #1 SHARE POSITION 11-12% 9.4% ~9.0% EBIT % EBIT % EBIT % 14

North America Journey STRONG EXECUTION WELL POSITIONED AND DELIVERING
MARGIN COVID DRIVEN GLOBAL POST REFOCUSED EXPANSION SUPPLY DISRUPTIONS COVID NORTH AMERICA 2024-2026 Pre-Covid: 2017-2019 2020-2021 2022-2023 ● Leading and stable share● Product shortages ● Unprecedented inflation ●
100bps+ of annual net accelerates margins & softening demand in cost margin expansion ● Product innovation beyond historical norms 2022 driving price/mix● Continued cadence of ● Supply constraints reduce ● Normalized
promotional product innovation ● Rationalized operating North America share to environment footprint driving strong ● Rebounding existing ~26% cost position● Delivered 1pt of 2023 home sales and new ● Cost based pricing to
share gains construction drive offset inflation demand 15
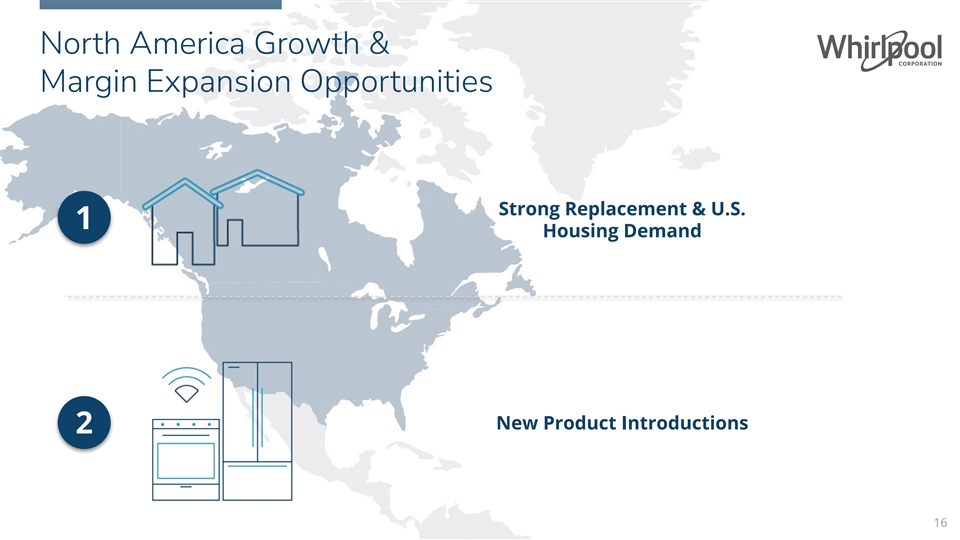
North America Growth & Margin Expansion Opportunities Strong
Replacement & U.S. 1 Housing Demand New Product Introductions 2 16

1 Three Fundamental Components of Appliance Demand U.S. DEMAND (% of
Units Sold) Discretionary Driven by existing home sales New Driven by new home sales Construction Driven by shrinking replacement Replacement cycle (historically approx. 10 years) 17

1 Replacement Demand Continues to Be Very Strong Overall 60 Appliance
Industry Shipments Replacement 40 Demand 20 Stronger replacement demand Steady replacement demand Demand driven by discretionary driven by increased usage and with ~10 year replacement cycle / new construction shortened replacement cycle 2000 2010
2023 18 Source: AHAM Sell-in, Traqline Sell-out Appliance Units (millions)
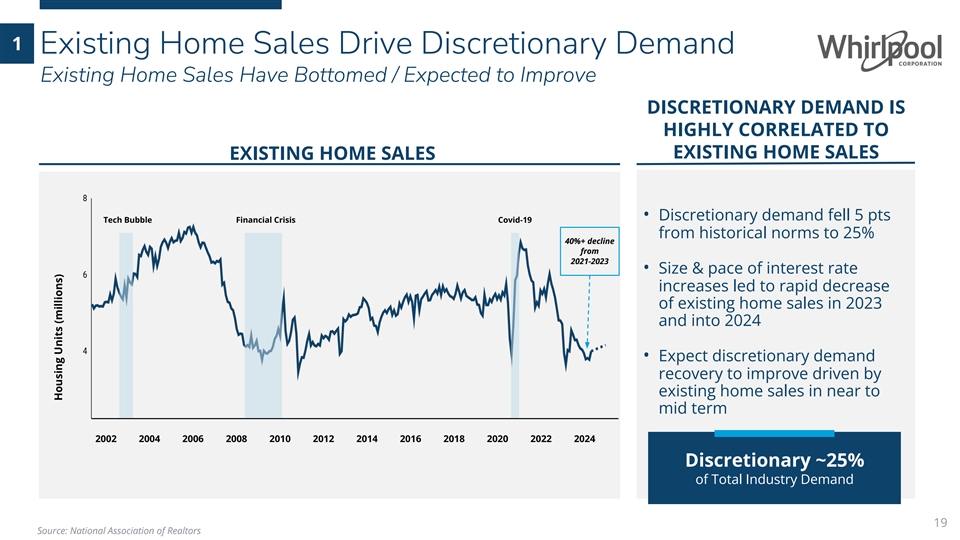
1 Existing Home Sales Drive Discretionary Demand Existing Home Sales
Have Bottomed / Expected to Improve DISCRETIONARY DEMAND IS HIGHLY CORRELATED TO EXISTING HOME SALES EXISTING HOME SALES • Discretionary demand fell 5 pts Tech Bubble Financial Crisis Covid-19 from historical norms to 25% 40%+ decline from
2021-2023 • Size & pace of interest rate increases led to rapid decrease of existing home sales in 2023 and into 2024 • Expect discretionary demand recovery to improve driven by existing home sales in near to mid term 2002 2004 2006
2008 2010 2012 2014 2016 2018 2020 2022 2024 Discretionary ~25% of Total Industry Demand 19 Source: National Association of Realtors Housing Units (millions)
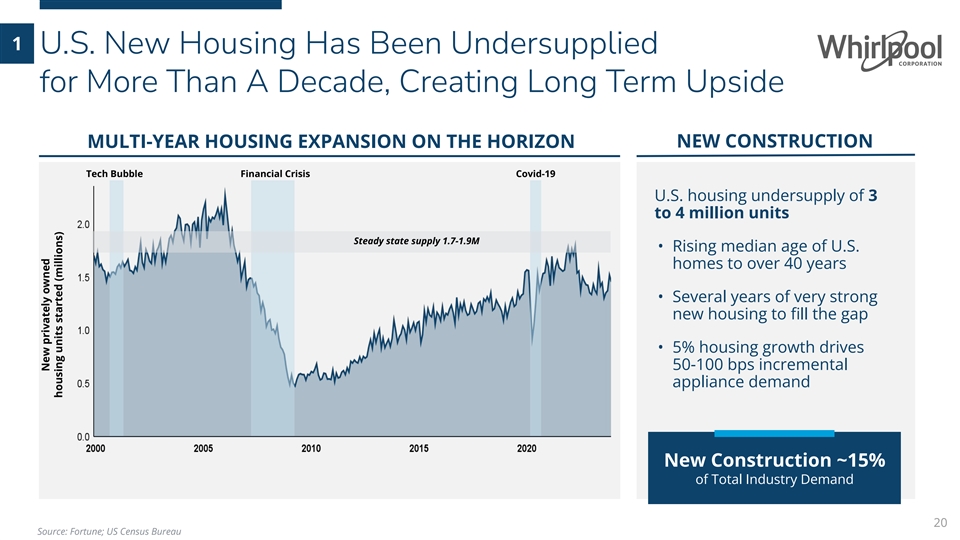
1 U.S. New Housing Has Been Undersupplied for More Than A Decade,
Creating Long Term Upside MULTI-YEAR HOUSING EXPANSION ON THE HORIZON NEW CONSTRUCTION Tech Bubble Financial Crisis Covid-19 U.S. housing undersupply of 3 to 4 million units Steady state supply 1.7-1.9M • Rising median age of U.S. homes to
over 40 years • Several years of very strong new housing to fill the gap • 5% housing growth drives 50-100 bps incremental appliance demand New Construction ~15% of Total Industry Demand 20 Source: Fortune; US Census Bureau New
privately owned housing units started (millions)
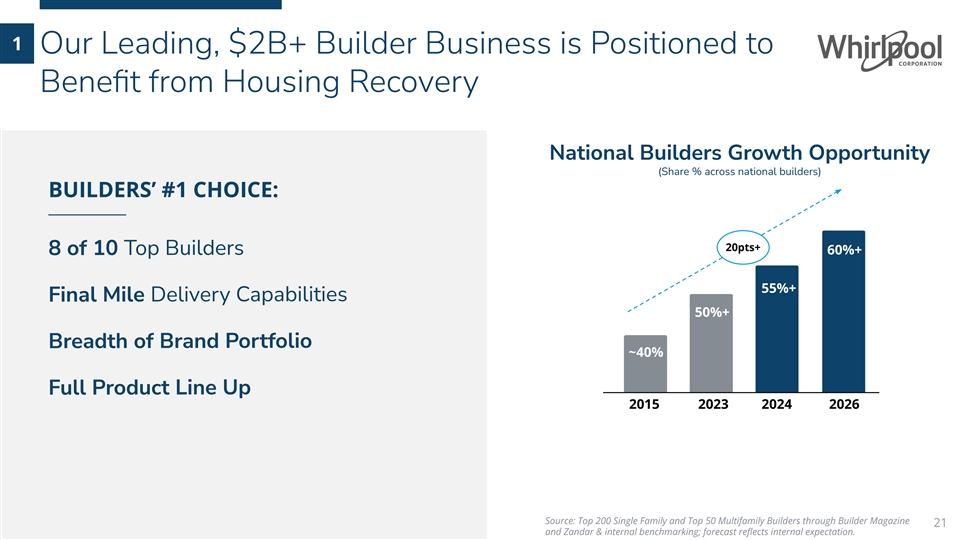
1 Our Leading, $2B+ Builder Business is Positioned to Benefit
from Housing Recovery National Builders Growth Opportunity (Share % across national builders) BUILDERS’ #1 CHOICE: 20pts+ 60%+ 55%+ 50%+ ~40% 2015 2023 2024 2026 Source: Top 200 Single Family and Top 50 Multifamily Builders through Builder
Magazine 21 and Zandar & internal benchmarking; forecast reflects internal expectation. 8 of 10 Top Builders Final Mile Delivery Capabilities Breadth of Brand Portfolio Full Product Line Up

2 Consumers Remain at the Core of Our Innovation $515M 2K+ ~3.5K ~$100M
20%+ 2023 Capex + R&D North American Global Invested in New Product in North America Patents Filed Engineers Technology Centers Introductions in 2019-2023 in 2023 in 2021-2023 North America in 2023 vs. 2022 22 Whirlpool Corporation
Confidential
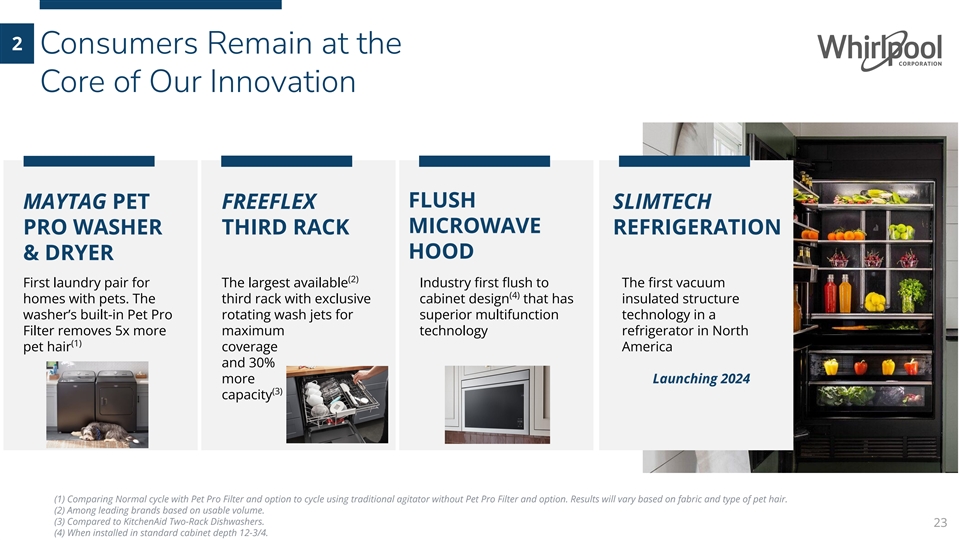
2 Consumers Remain at the Core of Our Innovation FLUSH MAYTAG PET
FREEFLEX SLIMTECH MICROWAVE PRO WASHER THIRD RACK REFRIGERATION HOOD & DRYER (2) First laundry pair for The largest available Industry first flush to The first vacuum (4) homes with pets. The third rack with exclusive cabinet
design that has insulated structure washer’s built-in Pet Pro rotating wash jets for superior multifunction technology in a Filter removes 5x more maximum technology refrigerator in North (1) pet hair coverage America and 30% more Launching
2024 (3) capacity (1) Comparing Normal cycle with Pet Pro Filter and option to cycle using traditional agitator without Pet Pro Filter and option. Results will vary based on fabric and type of pet hair. (2) Among leading brands based on usable
volume. (3) Compared to KitchenAid Two-Rack Dishwashers. 23 (4) When installed in standard cabinet depth 12-3/4.
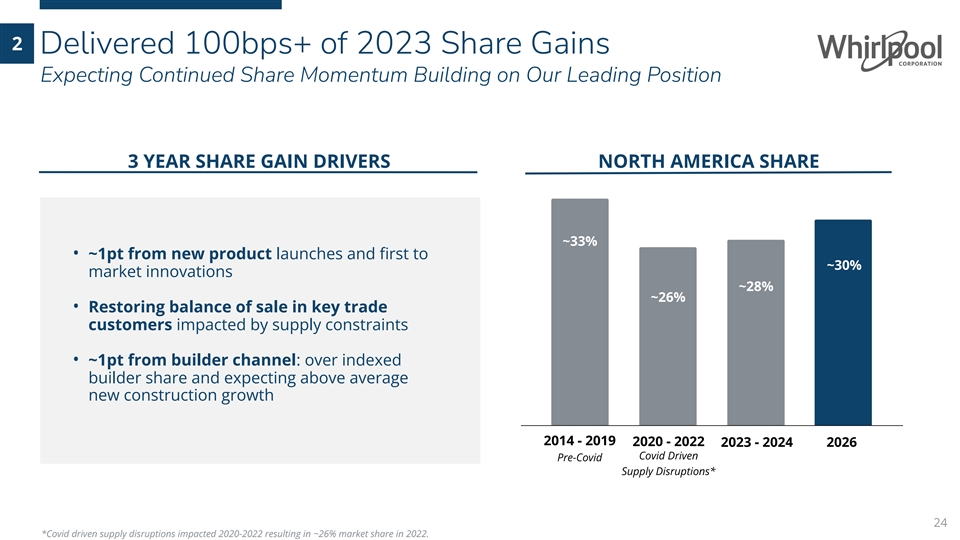
2 Delivered 100bps+ of 2023 Share Gains Expecting Continued Share
Momentum Building on Our Leading Position 3 YEAR SHARE GAIN DRIVERS NORTH AMERICA SHARE ~33% • ~1pt from new product launches and first to ~30% market innovations ~28% ~26% • Restoring balance of sale in key trade customers
impacted by supply constraints • ~1pt from builder channel: over indexed builder share and expecting above average new construction growth 2014 - 2019 2020 - 2022 2023 - 2024 2026 Covid Driven Pre-Covid Supply Disruptions* 24 *Covid driven
supply disruptions impacted 2020-2022 resulting in ~26% market share in 2022.
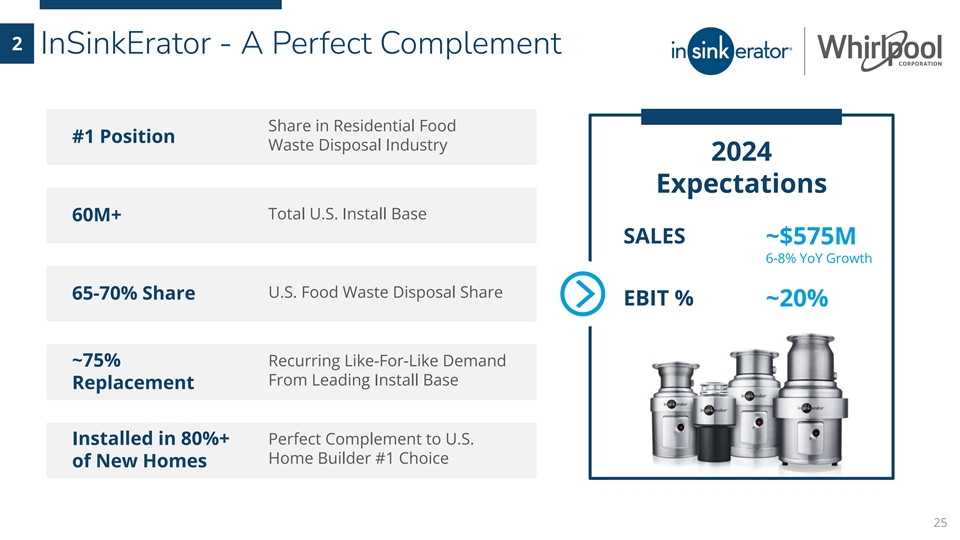
2 InSinkErator - A Perfect Complement Share in Residential Food #1
Position Waste Disposal Industry 2024 Expectations Total U.S. Install Base 60M+ SALES ~$575M 6-8% YoY Growth U.S. Food Waste Disposal Share 65-70% Share EBIT % ~20% ~75% Recurring Like-For-Like Demand From Leading Install Base Replacement Installed
in 80%+ Perfect Complement to U.S. Home Builder #1 Choice of New Homes 25

2 Runway for Growth for InSinkErator U.S. OPPORTUNITY: INTERNATIONAL
OPPORTUNITY: Food Waste Disposers ~80% of • Close 20pt penetration gap • 5-6% penetration rates in vs. dishwashers Canada, U.K., Australia & InSinkErator Sales ~40% in New Zealand • New housing growth Closing Penetration Gaps
• 10pts of adoption would drive • Next Gen: expanding Through Consumer Education ~$100M in sales margins and unlocking D2C of Environmental Benefits and Addressing Misconceptions • Leading U.S. position • ~1.6% U.S.
residential Instant Hot Water SIGNIFICANT PENETRATION household penetration Dispensers ~10% of OPPORTUNITY FOR THIS ~$50M BUSINESS • Strong new product pipeline InSinkErator Sales • Very attractive margin profile 26

Organic Value Creation From Our SDA Global Business Ludo Beaufils
Executive Vice President, KitchenAid Small Appliances 27
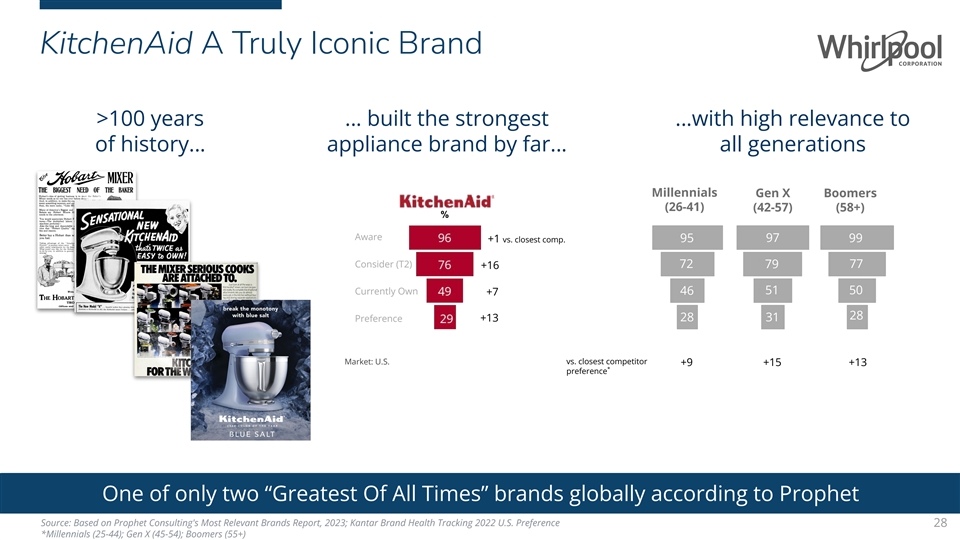
KitchenAid A Truly Iconic Brand >100 years … built the
strongest …with high relevance to of history… appliance brand by far… all generations Millennials Gen X Boomers (26-41) (42-57) (58+) % Aware +1 vs. closest comp. 95 97 99 Consider (T2) 72 79 77 +16 Currently Own 46 51 50 +7 28 +13
28 31 Preference vs. closest competitor Market: U.S. +9 +15 +13 * preference One of only two “Greatest Of All Times” brands globally according to Prophet One of only two “Greatest Of All Times” brands globally according to
Prophet Source: Based on Prophet Consulting's Most Relevant Brands Report, 2023; Kantar Brand Health Tracking 2022 U.S. Preference 28 *Millennials (25-44); Gen X (45-54); Boomers (55+)
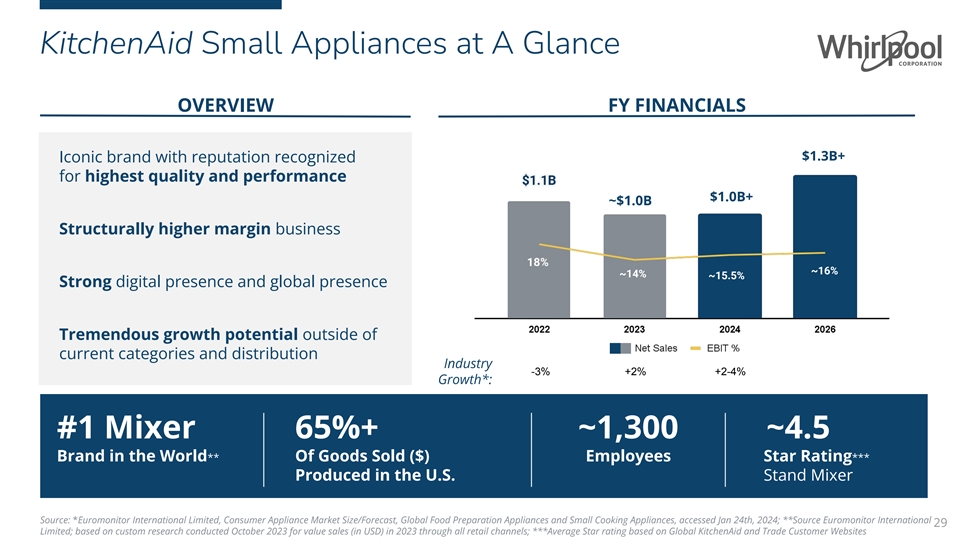
KitchenAid Small Appliances at A Glance OVERVIEW FY FINANCIALS $1.3B+
Iconic brand with reputation recognized for highest quality and performance $1.0B+ ~$1.0B Structurally higher margin business ~16% ~14% ~15.5% Strong digital presence and global presence Tremendous growth potential outside of current categories and
distribution Industry -3%+2%+2-4% Growth*: #1 Mixer 65%+ ~1,300 ~4.5 Brand in the World** Of Goods Sold ($) Employees Star Rating*** Produced in the U.S. Stand Mixer Source: *Euromonitor International Limited, Consumer Appliance Market
Size/Forecast, Global Food Preparation Appliances and Small Cooking Appliances, accessed Jan 24th, 2024; **Source Euromonitor International 29 Limited; based on custom research conducted October 2023 for value sales (in USD) in 2023 through all
retail channels; ***Average Star rating based on Global KitchenAid and Trade Customer Websites

Diversified KitchenAid Product Portfolio to Serve Full Food
Journey STAND MIXERS & COFFEE & BREAKFAST ATTACHMENTS FOOD PREP COOKING 30

Strong Product Base with Innovative Launches Ahead and Global Expansion
Opportunities HIGH PREFERENCE ACROSS ALL MAJOR CATEGORIES STRONG U.S. POSITION, LARGE GLOBAL POTENTIAL LONG TERM VALUE CREATION GLOBAL CATEGORY SIZE* • Sustained investment in our stand mixer business $5B $6B $4B $3B $8B • Accelerate
growth with stand mixer attachments • Expand new segments with brand preference, quality and industry expertise Stand Food Traditional Espresso Countertop Mixer Processor Blender Machine Cooking 34 52 29 21 7 Long Term Value Creation ** Beyond
Current Product Portfolio KITCHENAID BRAND PREFERENCE Market: U.S. Source: *Euromonitor International Limited, Consumer Appliance Market Size/Forecast, Global Blenders, Food Processors, Mixers, Espresso Coffee Machines, Slow Cookers and Other
Small Cooking Appliances, accessed Jan 24th, 2024.**Kantar Brand Health Tracking 2022, Preference Score, U.S. Market, Stand Mixer, Food Processor, Traditional Blender, Espresso Machines, and Major Appliance Cooking (Cooktops + Wall Oven + Range), 31
which serves as a proxy for KitchenAid Smalls Countertop Cooking Brand. Preference.

Exciting Times Ahead… New KitchenAid Launches THE MOST SEARCHED
ENTERING THE BRAND IN CORDLESS FULLY AUTOMATIC * HANDHELDS , ESPRESSO CATEGORY REVOLUTIONIZING IN FORCE THE CATEGORY Launched in 2023, Launch expected Q2 2024 off to a strong start 32 *2022 SEO Global Cordless Category Analysis: Top 6 Most
Searched For Brands in Cordless Environment in the U.S. and U.K.
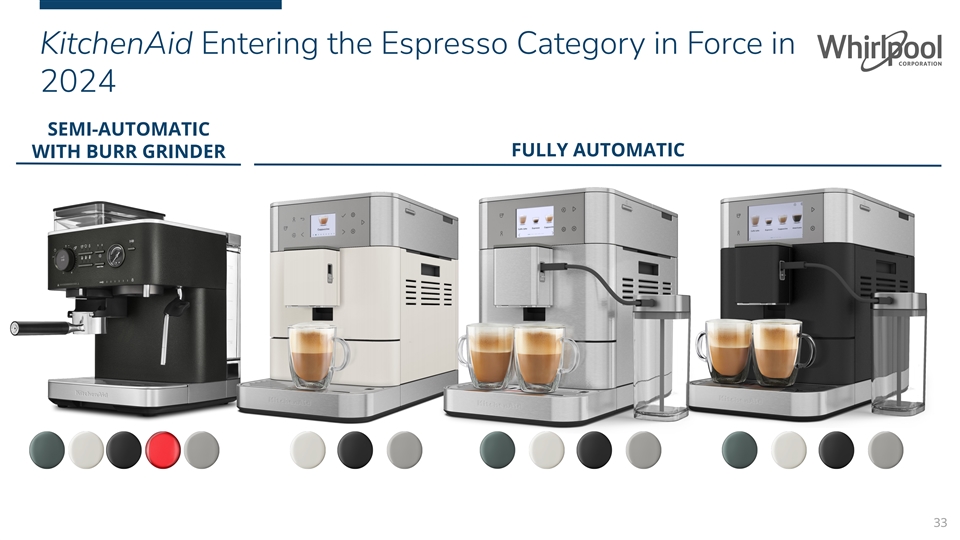
KitchenAid Entering the Espresso Category in Force in 2024
SEMI-AUTOMATIC FULLY AUTOMATIC WITH BURR GRINDER 33
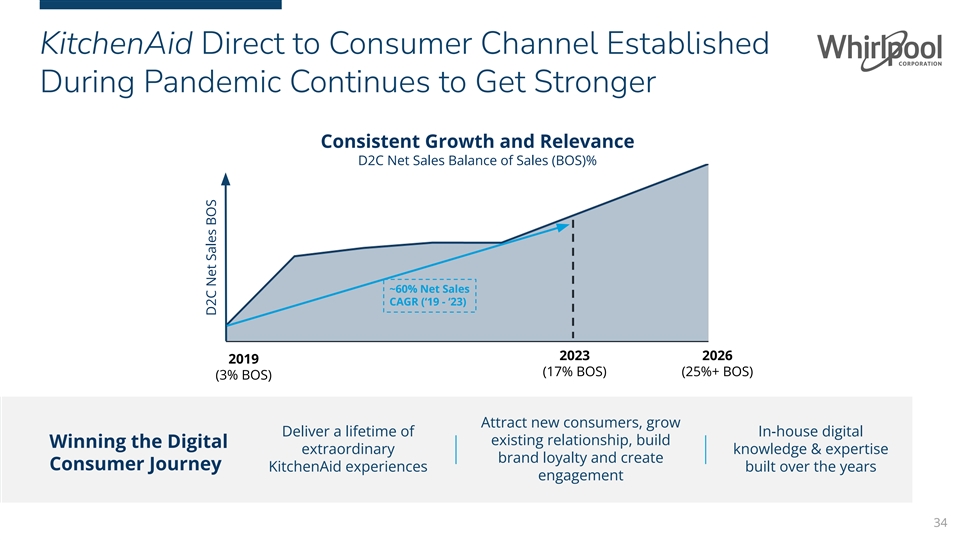
KitchenAid Direct to Consumer Channel Established During Pandemic
Continues to Get Stronger Consistent Growth and Relevance D2C Net Sales Balance of Sales (BOS)% ~60% Net Sales CAGR (‘19 - ‘23) 2023 2026 2019 (17% BOS) (25%+ BOS) (3% BOS) Attract new consumers, grow Deliver a lifetime of In-house
digital existing relationship, build Winning the Digital extraordinary knowledge & expertise brand loyalty and create Consumer Journey KitchenAid experiences built over the years engagement 34 D2C Net Sales BOS

Long-Term Value Creation & Capital Allocation Jim Peters EVP &
Chief Financial Officer 35

Introducing 2026 Value Creation Targets Net Sales Ongoing EBIT FCF ROIC
Annual Organic Net Sales Ongoing Earnings Before Free Cash Flow Return on Growth Excluding Currency Interest and Tax, % of Net Sales as % of Net Sales Invested Capital 2026 Target ~$17.2B ~9.0% ~7.0% 9-11% 2024 Proforma ~$16.2B ~7.0% ~4.0% 7-8%
(Excl. MDA Europe) 2024 Guidance ~$16.9B ~6.8% ~3.5% 7-8% (Includes Q1 MDA Europe: ~$700M NS and $10-15M EBIT) 36 Note: Value creation of incremental ~$0.5B EBIT and >0.5% of FCF between 2024 and 2026.

Organic Growth and Margin Expansion Across All of Our Business Segments
2024 GUIDANCE 2026 TARGET Net Sales EBIT % Net Sales EBIT % MDA ~Flat ~9.0% 2-3% 11-12% North America (CAGR) MDA 3-4% ~8.0% ~2.5% ~6.5% Latin America (CAGR) MDA ~5.0% ~3.0% 5-6% ~7.0% Asia (CAGR) ~7.5% ~15.5% ~10% ~16.0% SDA Global (CAGR) * $16.9B
~6.8% 3-4% ~9.0% TOTAL (CAGR) 37 *Includes Q1 2024 for MDA Europe.
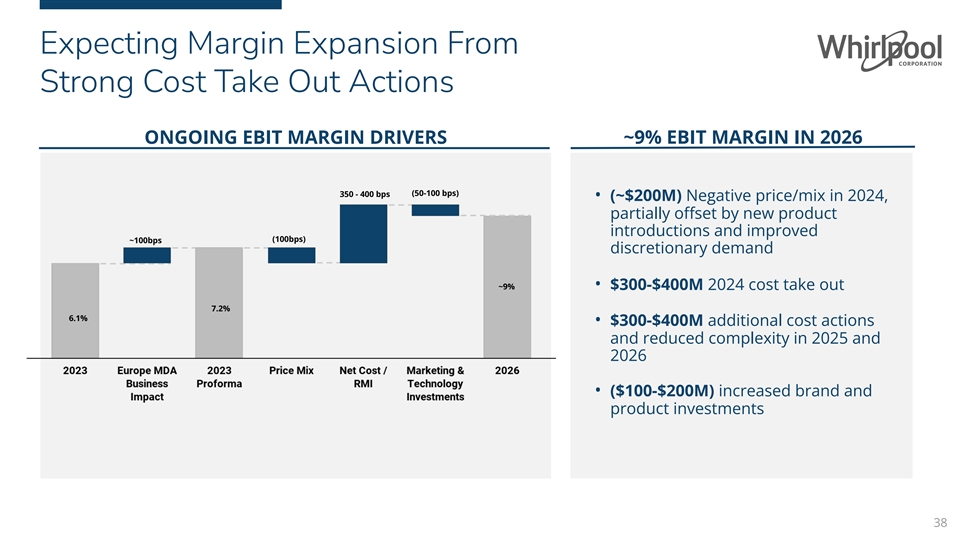
Expecting Margin Expansion From Strong Cost Take Out Actions ONGOING
EBIT MARGIN DRIVERS ~9% EBIT MARGIN IN 2026 (50-100 bps) 350 - 400 bps • (~$200M) Negative price/mix in 2024, partially offset by new product introductions and improved (100bps) ~100bps discretionary demand ~9% • $300-$400M 2024
cost take out 7.2% 6.1% • $300-$400M additional cost actions and reduced complexity in 2025 and 2026 • ($100-$200M) increased brand and product investments 38
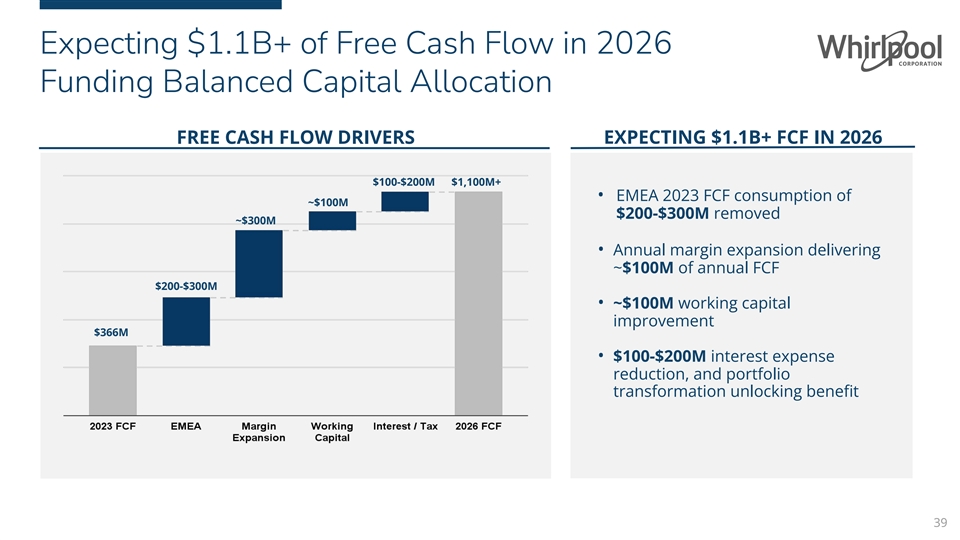
Expecting $1.1B+ of Free Cash Flow in 2026 Funding Balanced Capital
Allocation FREE CASH FLOW DRIVERS EXPECTING $1.1B+ FCF IN 2026 $100-$200M $1,100M+ • EMEA 2023 FCF consumption of ~$100M $200-$300M removed ~$300M • Annual margin expansion delivering ~$100M of annual FCF $200-$300M • ~$100M
working capital improvement $366M • $100-$200M interest expense reduction, and portfolio transformation unlocking benefit 39

History of Shareholder Friendly Capital Allocations 5 YEAR CAPITAL
ALLOCATION ($B) Shareholder Returns $3.9B $2.2B buybacks and $1.7B dividends ~$4B * Inorganic Investments $3.1B InSinkErator & Elica India acquisitions Returned to Shareholders in the Last 5 Years ~5% of sales reinvested (in line with Organic
Investments $5.0B long-term target) $12.0B 40 *Elica PB Whirlpool Kitchen Appliances Pvt Ltd.

Clear Capital Allocation Priorities • Invest ~6% of net sales in
Capex & R&D Fund Organic Growth 1 • ~100+ new production introductions coming 2024 Fund Dividend 2 • Guideline ~30% of multi-year ongoing EPS • ~2x net debt leverage target 3 Debt Service • Maintain investment grade
credit rating • ~$2.6B share repurchase authorization remaining Share Buy Back or 4 Value Creating M&A • Target immediately accretive acquisitions 41

2 Fund Dividend Guideline: ~30% of Multi-Year Ongoing EPS Average
Returning Cash to Shareholders Through Steady or Increasing Dividends Since 1955 ~31% ~70 Years ~10% CAGR $1.75 10 year average of consecutive dividend / share Q1’24 in line with dividend (2014-2023) dividend / guideline payments share 42
Dividends Declared ($) Dividend as % of Ongoing EPS
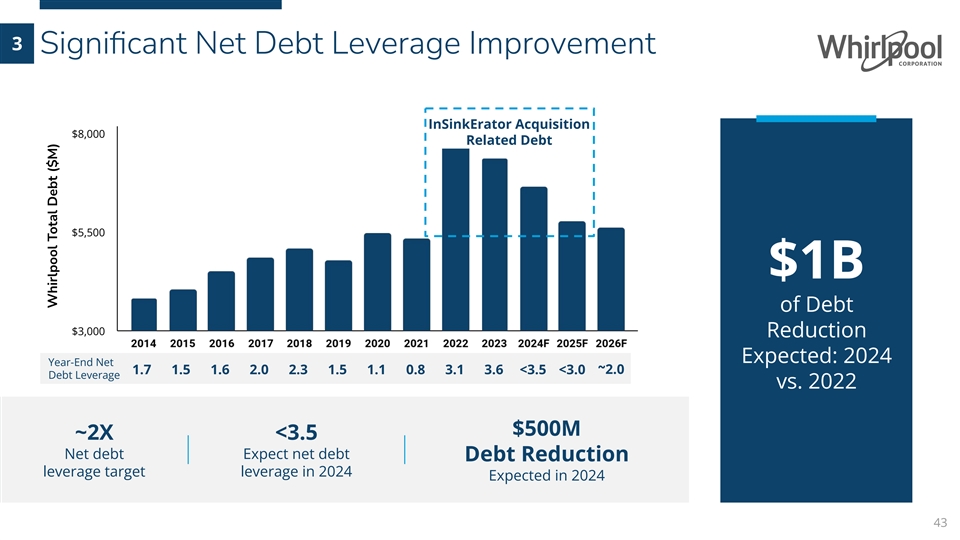
Debt LeverageYear-End Net 3 Significant Net Debt Leverage
Improvement InSinkErator Acquisition $8,000 Related Debt $5,500 $1B of Debt $3,000 Reduction Expected: 2024 1.7 1.5 1.6 2.0 2.3 1.5 1.1 0.8 3.1 3.6 <3.5 <3.0~2.0 vs. 2022 $500M ~2X <3.5 Net debt Expect net debt Debt Reduction leverage
target leverage in 2024 Expected in 2024 43 Whirlpool Total Debt ($M)

3 Well Balanced, Low Interest, Debt Ladder Provides Flexibility &
Value for Shareholders Debt By Maturity w/ Fixed Rate Weighted Avg. Interest Rate of ~3% Acquisition Related Term Loan $2.1B Senior Notes due after 2030 $2,000 $500 $0 2024 2025 2026 2027 2028 2029 2030 2031 2032 2033 2034 2035 2036 2037 2038 2039
2040 2041 2042 2043 2044 2045 2046 2047 2048 2049 2050 Senior Notes 4.0% 3.7% 1.3% 1.1% 0.5% 4.8% - 2.4% 4.7% 5.5% - - - - - - - - - 5.2% - - 4.5% - - - 4.6% Fixed Interest Rates 44 Financing Arrangements ($M)
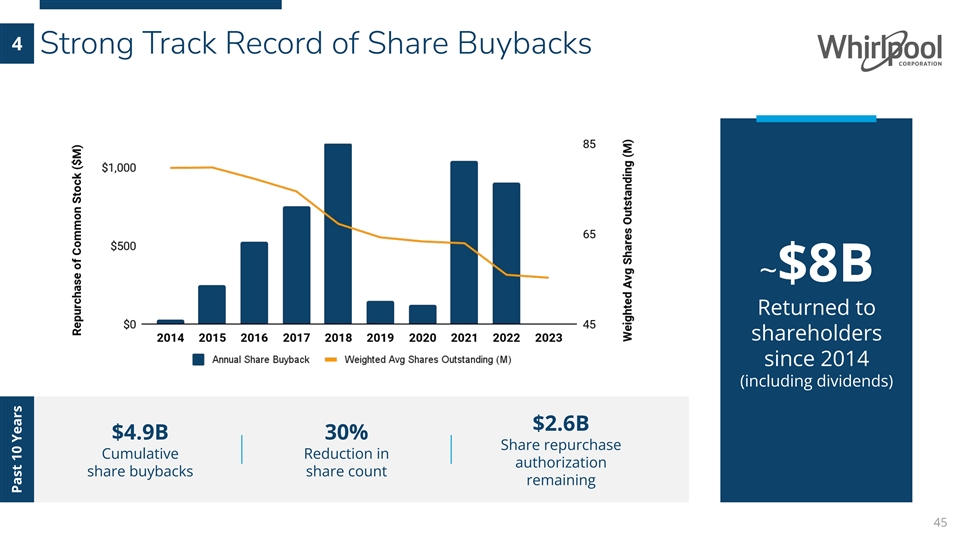
4 Strong Track Record of Share Buybacks ~$8B Returned to shareholders
since 2014 (including dividends) $2.6B $4.9B 30% Share repurchase Cumulative Reduction in authorization share buybacks share count remaining 45 Past 10 Years

4 Opportunistic M&A Not A Priority in 2024 M&A Criteria
Targeting immediately Margin 1 & FCF accretive acquisitions High ROIC Targets 2 Focus on Small Appliances & 3 Commercial Appliances However, debt 4 reduction and dividend remain 2024 priority 46
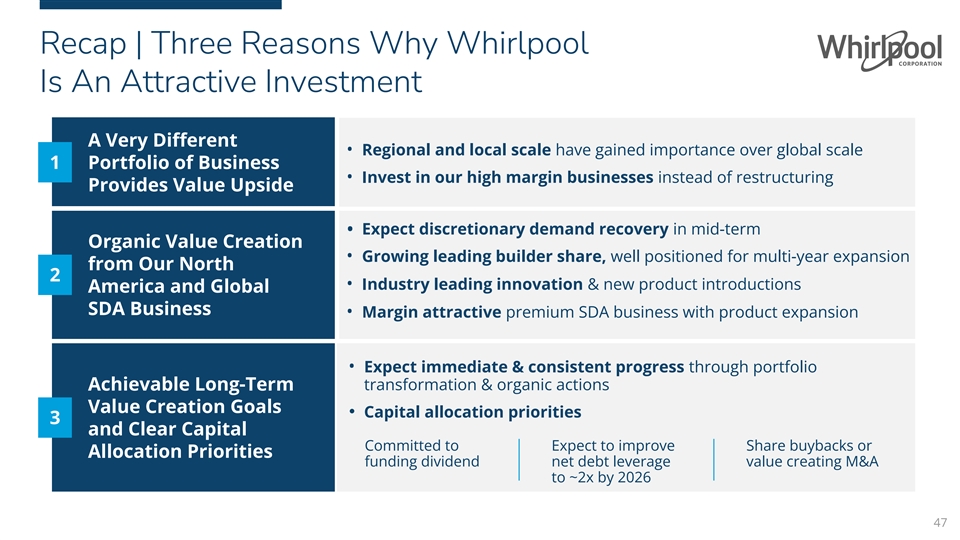
Recap | Three Reasons Why Whirlpool Is An Attractive Investment A Very
Different • Regional and local scale have gained importance over global scale 1 Portfolio of Business • Invest in our high margin businesses instead of restructuring Provides Value Upside • Expect discretionary demand
recovery in mid-term Organic Value Creation • Growing leading builder share, well positioned for multi-year expansion from Our North 2 • Industry leading innovation & new product introductions America and Global SDA Business •
Margin attractive premium SDA business with product expansion • Expect immediate & consistent progress through portfolio Achievable Long-Term transformation & organic actions Value Creation Goals • Capital allocation priorities 3
and Clear Capital Committed to Expect to improve Share buybacks or Allocation Priorities funding dividend net debt leverage value creating M&A to ~2x by 2026 47

* Whirlpool Corporation ownership of the Hotpoint brand in EMEA and
Asia Pacific regions is not affiliated with the Hotpoint brand sold in the Americas 48
Recap | Three Reasons Why Whirlpool Is An Attractive Investment
Achievable Long-Term Organic Value Creation A Very Different from Our North Value Creation Goals Portfolio of Business America and Global and Clear Capital Provides Value Upside SDA Business Allocation Priorities 49 49 49

Whirlpool Investor Day Appendix

Appendix Content Our Business Segment Overview Committed to Delivering
Strong Cost Position 51

Leading Appliance Manufacturer With 110+ Years of Improving Life at
Home SALES BY SALES BY SEGMENT CATEGORY $19B MDA Asia 5% Dishwashing SDA Global 5% and Other 2023 NET SALES, 19% AS REPORTED MDA Latin America 17% Cooking 24% MDA EMEA 18% 59K EMPLOYEES Laundry 27% MDA North America 55% 55 Refrigeration
MANUFACTURING & 30% TECHNOLOGY CENTERS SDA: Small Domestic Appliances MDA: Major Domestic Appliances 52 52 Note: InSinkErator sales included in MDA North America; SDA Global sales included in Cooking category.
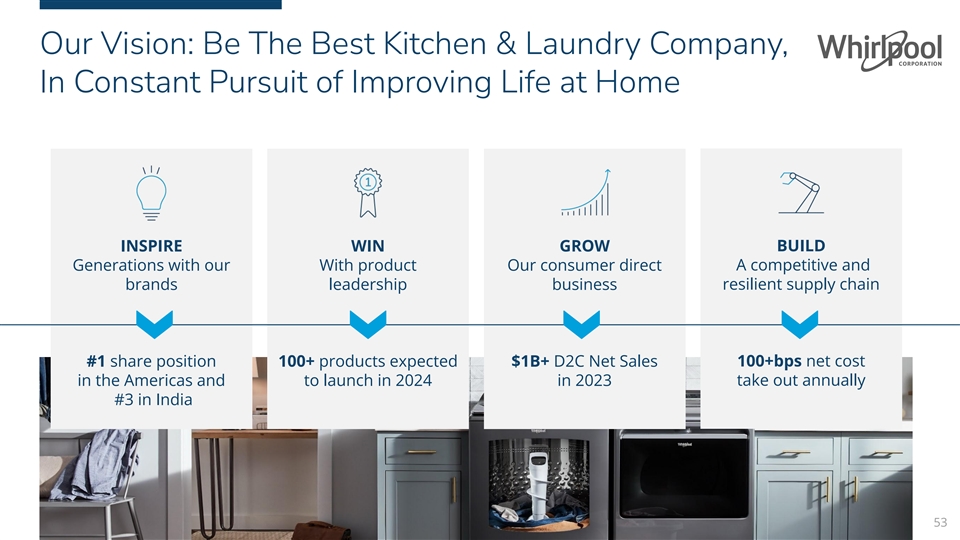
Our Vision: Be The Best Kitchen & Laundry Company, In Constant
Pursuit of Improving Life at Home INSPIRE WIN GROW BUILD Generations with our With product Our consumer direct A competitive and resilient supply chain brands leadership business #1 share position 100+ products expected $1B+ D2C Net Sales 100+bps
net cost take out annually in the Americas and to launch in 2024 in 2023 #3 in India 53
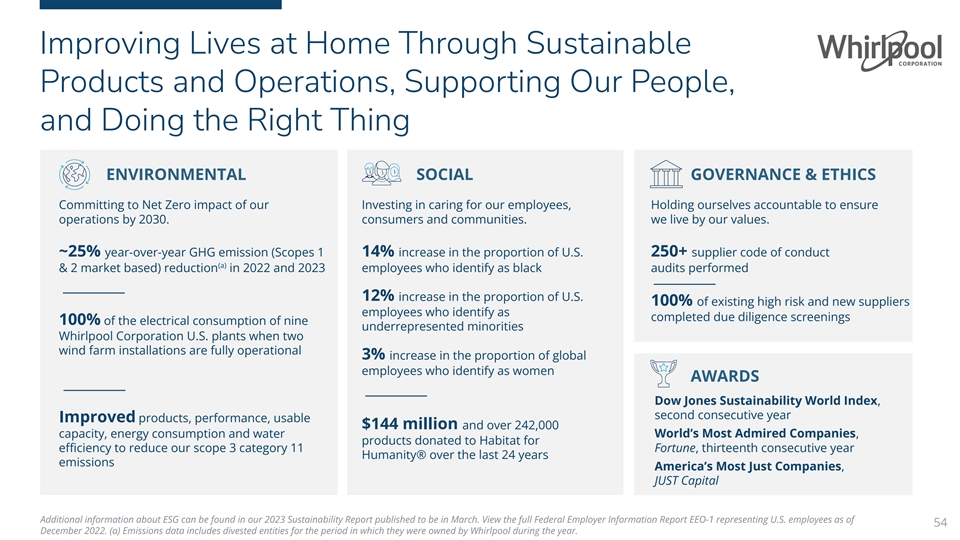
Improving Lives at Home Through Sustainable Products and Operations,
Supporting Our People, and Doing the Right Thing ENVIRONMENTAL SOCIAL GOVERNANCE & ETHICS Committing to Net Zero impact of our Investing in caring for our employees, Holding ourselves accountable to ensure operations by 2030. consumers and
communities. we live by our values. ~25% year-over-year GHG emission (Scopes 1 14% increase in the proportion of U.S. 250+ supplier code of conduct (a) & 2 market based) reduction in 2022 and 2023 employees who identify as black audits performed
12% increase in the proportion of U.S. 100% of existing high risk and new suppliers employees who identify as completed due diligence screenings 100% of the electrical consumption of nine underrepresented minorities Whirlpool Corporation U.S. plants
when two wind farm installations are fully operational 3% increase in the proportion of global employees who identify as women AWARDS Dow Jones Sustainability World Index, second consecutive year Improved products, performance, usable $144 million
and over 242,000 capacity, energy consumption and water World’s Most Admired Companies, products donated to Habitat for efficiency to reduce our scope 3 category 11 Fortune, thirteenth consecutive year Humanity® over the last 24
years emissions America’s Most Just Companies, JUST Capital Additional information about ESG can be found in our 2023 Sustainability Report published to be in March. View the full Federal Employer Information Report EEO-1 representing U.S.
employees as of 54 December 2022. (a) Emissions data includes divested entities for the period in which they were owned by Whirlpool during the year.

Regional Leading Scale With Top Positioning in Multiple Countries
CANADA #1 $0.8B Whirlpool Whirlpool UNITED STATES Share Position 2023 Revenue ~80% ~5M #1 $10.6B Whirlpool Whirlpool Appliance 2023 Industry Share Position 2023 Revenue Penetration Units INDIA ~90% ~52M #3 $0.8B Appliance 2023 Industry Whirlpool
Whirlpool Penetration Units Share Position 2023 Revenue ~25% ~26M MEXICO Appliance 2023 Industry Penetration Units #2 $0.7B Whirlpool Whirlpool Share Position 2023 Revenue ~90% ~7M BRAZIL Appliance 2023 Industry Penetration Units #1 $2B Whirlpool
Whirlpool Share Position 2023 Revenue ~65% ~13M Appliance 2023 Industry Penetration Units Note: All figures reflective of the major domestic appliances (MDA) only; United States industry AHAM T6; Canada industry AHAM T5; Mexico industry
ANFAD T4, COBUS and internal estimates; Brazil industry 55 GFK T3; India industry GFK adjusted (% of sales not captured by GFK, coverage factor given by GFK).

Proven Track Record of Our Innovation… We’ve constantly
innovated to care for consumers, many first-to-market innovations 2023 1911 1949 1967 2006 2015 2020 First Electric First Side-by-Side First Countertop French-Door Built-In Industry 1st 5-Door Largest Third Rack First Flush Built-In* Design
Over-the-Range Wringer Washer Refrigerator Microwave Refrigerator Configuration Dishwasher Microwave 1919 1961 1998 2013 2018 2021 2024 First Iconic First Self-Ventilated First Energy/Water First Induction Dual Bulk Load & Go First Smart
Top Load First Vacuum Insulated KitchenAid Stand Cooktop Oven Efficient Double Oven Dispensing Washer with 2-in-1 Structure Technology on a Mixer Top-Load Washer Freestanding Range Washer Removable Agitator Refrigerator in North America
…continuing to improve life at home 56 *30 width, when installed in standard cabinet depth of 12-3/4

Best Brand and Product Portfolio Multiple Billion Dollar Brands Premium
(~20%) Mass (~75%) Value (~5%) LEADING BRANDS ACROSS PRICE SEGMENTS * % of Net Sales (2023) Major Domestic Appliances & Adjacent Products Small Domestic Appliances STRONG PRODUCT INNOVATION *Elica PB Whirlpool Kitchen Appliances Pvt Ltd. Under
license from Elica SpA, Italy. 57 Note: Reflects brand portfolio expected post the closing of the Europe transaction.

Strong Cost Position With History of Cost Discipline ~$500M FIXED COST
REDUCTION SINCE 2019 -12% 2019 2023 As Reported; Includes Factory, Logistics & SG&A Fixed Costs * 2019 2023 59K Employees 92K Employees 41 Manufacturing Plants 34 Manufacturing Plants 91M Square Feet 66M Square Feet 58 *From 2018 10-K to
reflect the figures at the start of 2019. Fixed Costs (millions)

Appendix Content Our Business Segment Overview Committed to Delivering
Strong Cost Position 59
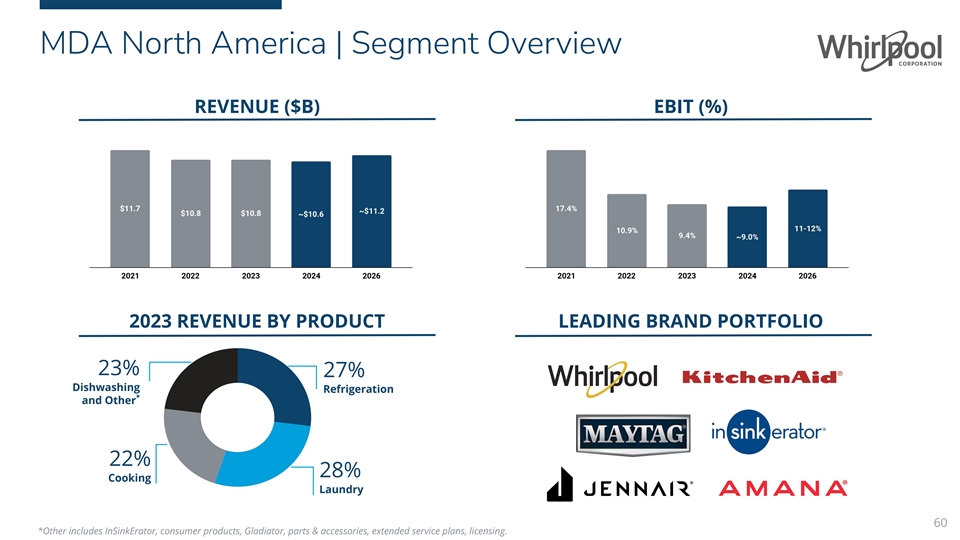
MDA North America | Segment Overview REVENUE ($B) EBIT (%) 2023 REVENUE
BY PRODUCT LEADING BRAND PORTFOLIO 23% 27% Dishwashing Refrigeration * and Other 22% 28% Cooking Laundry 60 *Other includes InSinkErator, consumer products, Gladiator, parts & accessories, extended service plans, licensing.
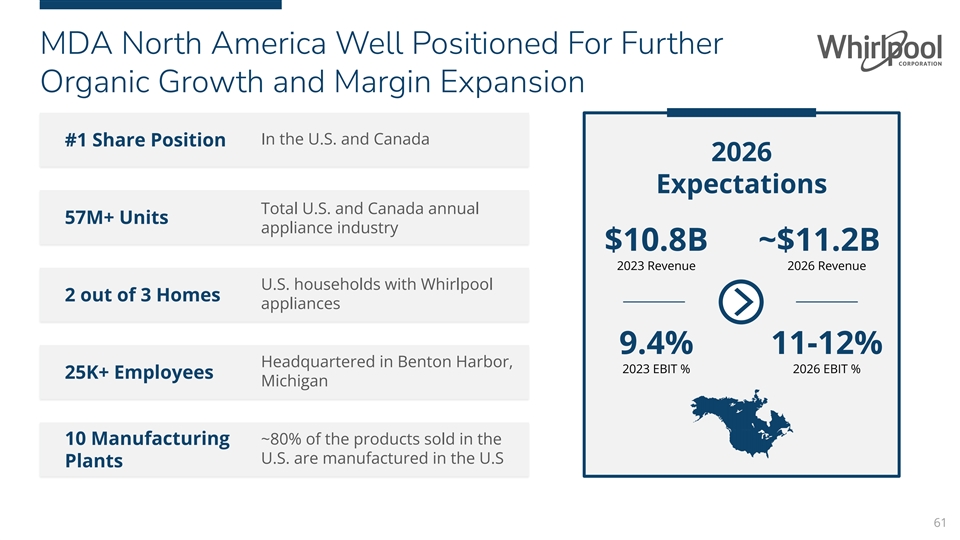
MDA North America Well Positioned For Further Organic Growth and Margin
Expansion In the U.S. and Canada #1 Share Position 2026 Expectations Total U.S. and Canada annual 57M+ Units appliance industry $10.8B ~$11.2B 2023 Revenue 2026 Revenue U.S. households with Whirlpool 2 out of 3 Homes appliances 9.4% 11-12%
Headquartered in Benton Harbor, 2023 EBIT % 2026 EBIT % 25K+ Employees Michigan 10 Manufacturing ~80% of the products sold in the U.S. are manufactured in the U.S Plants 61

Enhancing The Consumer Experience With Our Major Domestic Appliance
Adjacent Product Portfolio AFFRESH INSINKERATOR CLEANING PRODUCTS ~$550M GLADIATOR ~$400M PARTS & ACCESSORIES EXTENDED SERVICE PLAN & LICENSING ~$400M 62 Note: Figures represent 2023 Net Sales.

Whirlpool Well Positioned With Brand and Product Portfolio Regardless
of Where Consumers Shop Whirlpool North America Net Sales BOS % 100% ● Maintained or increased balance of sale across home improvement 75% retailers ● 10pt+ increase in national 50% builder share since 2015 Independent Retailers ●
Post-Covid, North America 25% Builders direct to consumer (D2C) has grown 30%+ since 2020 All Others D2C/Online Only 0% 2015 2017 2019 2021 2023 63 BOS: Balance of Sales

MDA Latin America | Segment Overview REVENUE ($B) EBIT (%) 2023 REVENUE
BY PRODUCT LEADING BRAND PORTFOLIO 14% 44% Dishwashing * Refrigeration and Other 13% 29% Cooking Laundry 64 *Other includes spare parts, water filters and subscriptions, air conditioning.

MDA Latin America Well Positioned With Two Exceptional Brands In Latin
America #1 Share Position 2026 Expectations Total Brazil and Mexico annual 20M+ Units industry $3.4B ~$3.7B 2023 Revenue 2026 Revenue Brastemp #1; Consul #3 and is #1 and #3 Most * found in 55%+ of Brazilian homes Preferred Brands 5.6% ~8.0% Opened
$52M manufacturing 2023 EBIT % 2026 EBIT % 12K+ Employees location in Argentina in 2022 8 Manufacturing Local brands target ~80% of ** consumers in Brazil Plants *Brand preference is based on 2023 Brand Guidance Study provided by KANTAR Insights;
the presence of Consul is based on KANTAR installed park study in 2022. 65 ** Mass through super premium; based on Brand Guidance Study provided by KANTAR Insights. Brastemp consumer target is 25 to 65 years old.
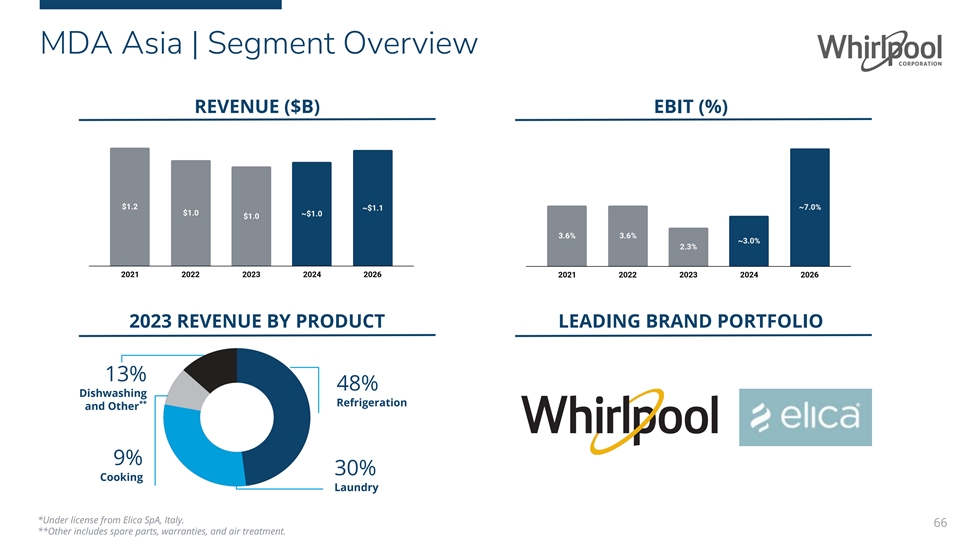
MDA Asia | Segment Overview REVENUE ($B) EBIT (%) 2023 REVENUE BY
PRODUCT LEADING BRAND PORTFOLIO 13% 48% Dishwashing ** Refrigeration and Other * 9% 30% Cooking Laundry *Under license from Elica SpA, Italy. 66 **Other includes spare parts, warranties, and air treatment.
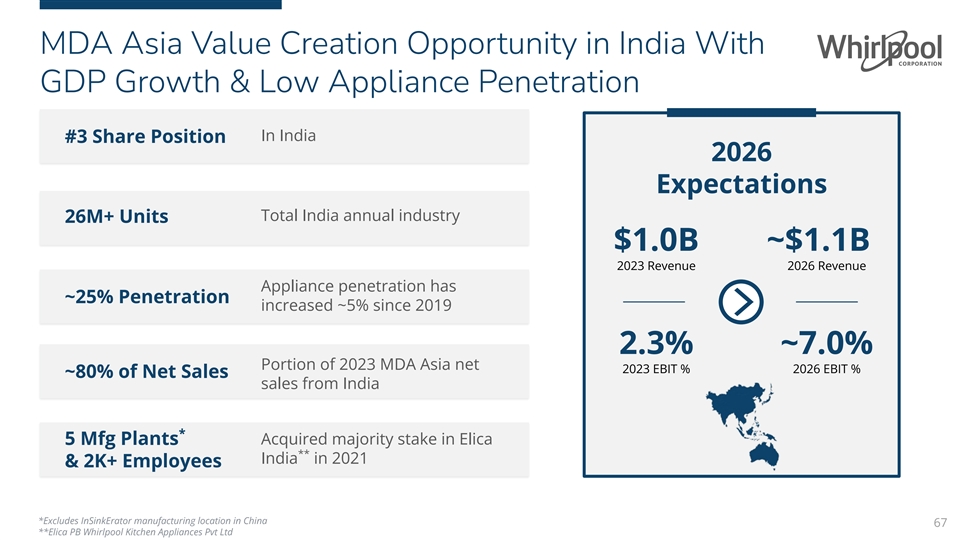
MDA Asia Value Creation Opportunity in India With GDP Growth & Low
Appliance Penetration In India #3 Share Position 2026 Expectations Total India annual industry 26M+ Units $1.0B ~$1.1B 2023 Revenue 2026 Revenue Appliance penetration has ~25% Penetration increased ~5% since 2019 2.3% ~7.0% Portion of 2023 MDA Asia
net 2023 EBIT % 2026 EBIT % ~80% of Net Sales sales from India * 5 Mfg Plants Acquired majority stake in Elica ** India in 2021 & 2K+ Employees *Excludes InSinkErator manufacturing location in China 67 **Elica PB Whirlpool Kitchen Appliances Pvt
Ltd

High Single-Digit Revenue CAGR and EBIT Margin Expected in India Over
the Long Term EXPECTING POSITIVE INDUSTRY WELL POSITIONED FOR SHIFTING TREND TO CONTINUE CONSUMER DEMAND WITH STRONG (4-6% INDUSTRY GROWTH IN 2024) OPPORTUNITY IN COOKING India T2 Appliance Industry Whirlpool India Net Sales BOS % +21% BOS: Balance
of Sales 68 Industry source: GFK adjusted (% of sales not captured by GFK, coverage factor given by GFK) Units (millions)

SDA Global | Segment Overview REVENUE ($B) EBIT (%) 2023 REVENUE BY
REGION PREMIUM PRODUCT PORTFOLIO 5% 6% Asia Latin America 69% 20% North EMEA America 69

SDA Global With Strong Margins and Industry Leading Mixer *
Demonstrated product leadership #1 Mixer Brand 2026 Expectations ** Stand mixer rating 4.5 Stars $1.0B ~$1.3B 2023 Revenue 2026 Revenue 10+ New Product Fully automatic espresso machine, rice cooker & more expected Launches in 2024 14.3% ~16.0%
$40M investment in 2016 to 2023 EBIT % 2026 EBIT % ~1.3K Employees expand capacity 65%+ of goods sold ($) produced 1 Manufacturing in the U.S. Plant Source: *Source Euromonitor International Limited; based on custom research conducted October 2023
for value sales (in USD) in 2023 through all retail channels; **Average Star rating based on Global KitchenAid 70 and Trade Customer Websites

Appendix Content Our Business Segment Overview Committed to Delivering
Strong Cost Position 71
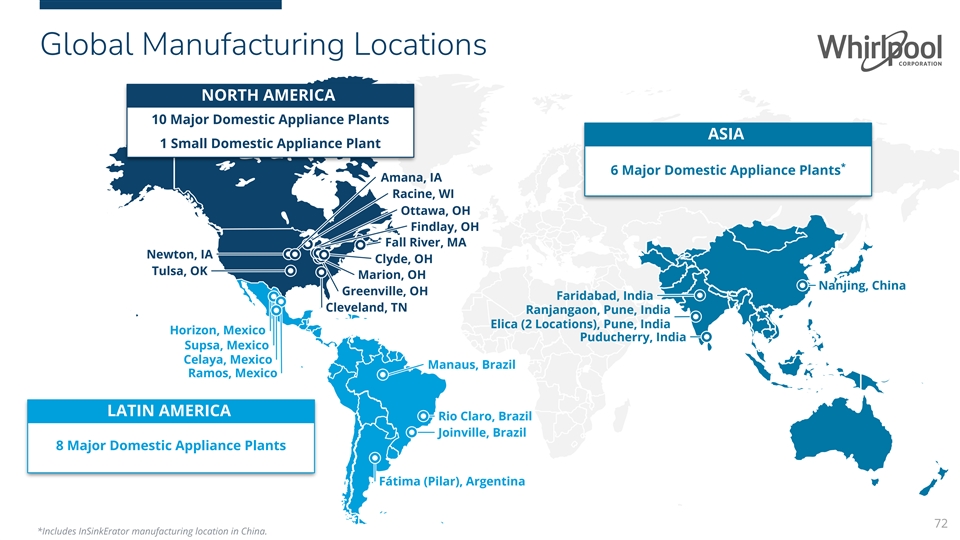
Global Manufacturing Locations NORTH AMERICA 10 Major Domestic
Appliance Plants ASIA 1 Small Domestic Appliance Plant * 6 Major Domestic Appliance Plants Amana, IA Racine, WI Ottawa, OH Findlay, OH Fall River, MA Newton, IA Clyde, OH Tulsa, OK Marion, OH Nanjing, China Greenville, OH Faridabad, India Cleveland,
TN Ranjangaon, Pune, India Elica (2 Locations), Pune, India Horizon, Mexico Puducherry, India Supsa, Mexico Celaya, Mexico Manaus, Brazil Ramos, Mexico LATIN AMERICA Rio Claro, Brazil Joinville, Brazil 8 Major Domestic Appliance Plants Fátima
(Pilar), Argentina 72 *Includes InSinkErator manufacturing location in China.
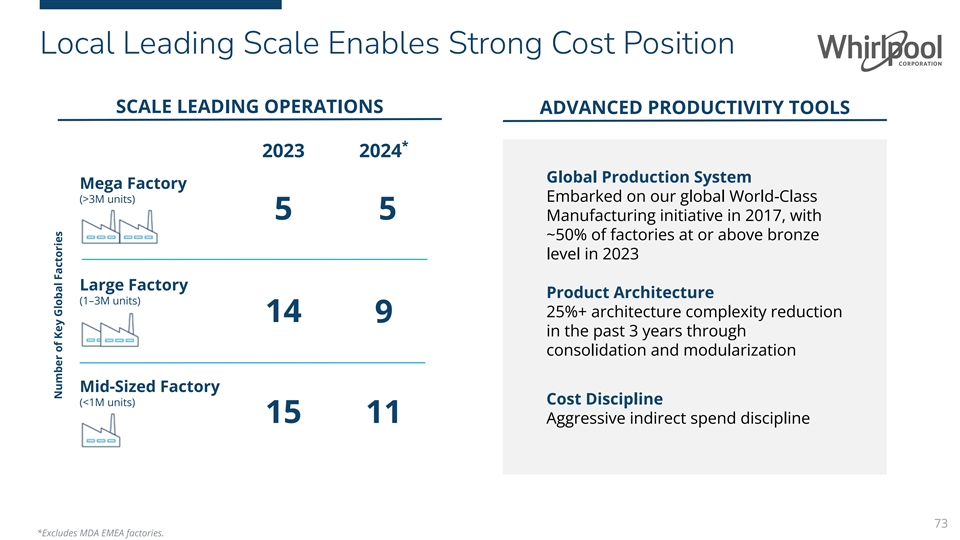
Need information Local Leading Scale Enables Strong Cost Position SCALE
LEADING OPERATIONS ADVANCED PRODUCTIVITY TOOLS * 2023 2024 Global Production System Mega Factory (>3M units) Embarked on our global World-Class 5 5 Manufacturing initiative in 2017, with ~50% of factories at or above bronze level in 2023 Large
Factory Product Architecture (1–3M units) 25%+ architecture complexity reduction 14 9 in the past 3 years through consolidation and modularization Mid-Sized Factory Cost Discipline (<1M units) 15 11 Aggressive indirect spend discipline 73
*Excludes MDA EMEA factories. Ready for design Suggest introducing a map slide after or before (lets see what that slide looks like) combining pp. 15, 22, 27 Number of Key Global Factories

End-to-End Supply Chain and Manufacturing Excellence PRODUCTIVITY:
Further strengthen World Class World Class Manufacturing methodology and Manufacturing expect to deliver 100+bps annual net cost take out and efficiency gains Increase supply chain resiliency through dual sourcing and part complexity reduction,
with a 50%+ Automation reduction in parts in the last 3 years AUTOMATION: Invest in intelligent factories and automation delivering continuous improvement Digital Transformation $30M+ plant system digitization that monitors and optimizes performance
Ottawa Plant 74

Strong Focus on Cost Composition and Drivers of Net Cost Take Out COGS:
~$13B ~80% Variable ~5% RESEARCH & ~10% DEVELOPMENT: LOGISTICS: Investment in our SG&A: ~$1.6B Balancing innovative products capacity, cost ~25% and service MANUFACTURING ADMINISTRATION: / QUALITY: Organizational Automation and
simplification world class ~70% RAW manufacturing, MATERIALS: improving Dual sourcing, ~60% assembly yields optimizing supplier footprints, and MARKETING & reduced part ~30% TECHNOLOGY: complexity Brand and product investments 75 Note:
2023 figures excluding EMEA. Including EMEA, 2023 COGS is $16.3B and SG&A is $2.0B.

Delivering Net Cost Benefit 8 of the Last 10 Years… $1.7B+
NET COST TAKE OUT SINCE 2015 $300-$400M cost take out expected in 2024 and additional actions through 2026 76 Note: Net cost take out only. Negative figures represent cost reduction. Net Cost Take Out (millions)
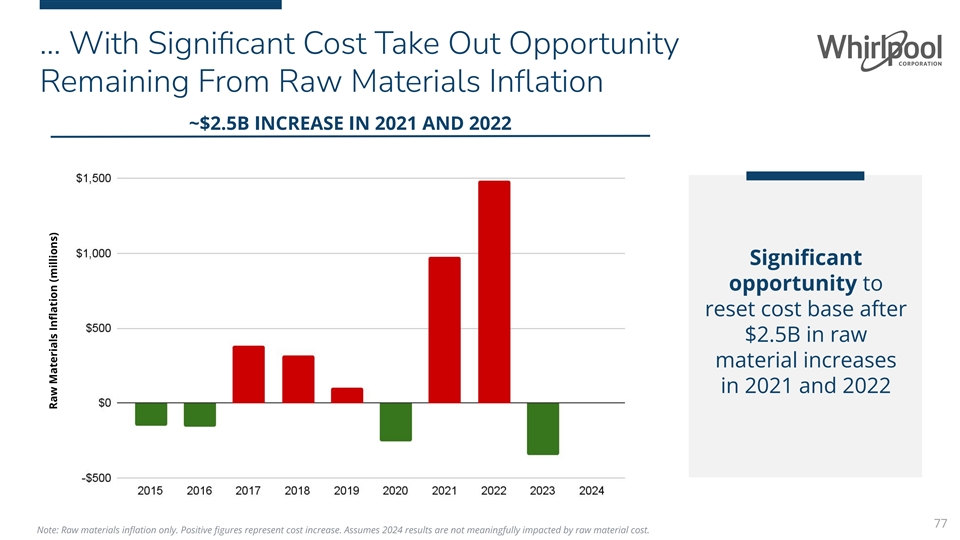
… With Significant Cost Take Out Opportunity Remaining From
Raw Materials Inflation ~$2.5B INCREASE IN 2021 AND 2022 Significant opportunity to reset cost base after $2.5B in raw material increases in 2021 and 2022 77 Note: Raw materials inflation only. Positive figures represent cost
increase. Assumes 2024 results are not meaningfully impacted by raw material cost. Raw Materials Inflation (millions)
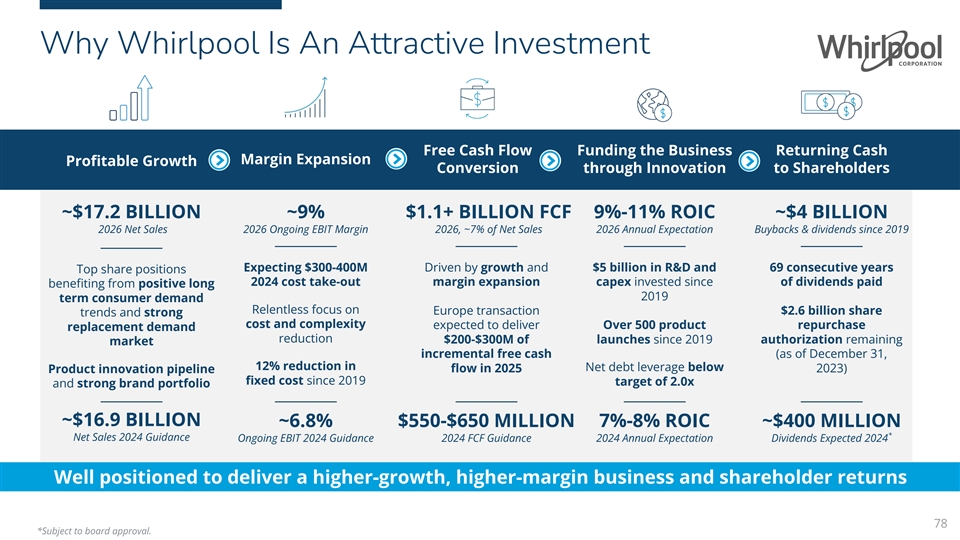
Why Whirlpool Is An Attractive Investment Free Cash Flow Funding the
Business Returning Cash Margin Expansion Profitable Growth Conversion through Innovation to Shareholders ~$17.2 BILLION ~9% $1.1+ BILLION FCF 9%-11% ROIC ~$4 BILLION 2026 Net Sales 2026 Ongoing EBIT Margin 2026, ~7% of Net Sales 2026 Annual
Expectation Buybacks & dividends since 2019 Expecting $300-400M Driven by growth and $5 billion in R&D and 69 consecutive years Top share positions 2024 cost take-out margin expansion capex invested since of dividends paid benefiting
from positive long 2019 term consumer demand Relentless focus on Europe transaction $2.6 billion share trends and strong cost and complexity expected to deliver Over 500 product repurchase replacement demand reduction $200-$300M of launches since
2019 authorization remaining market incremental free cash (as of December 31, 12% reduction in flow in 2025 Net debt leverage below 2023) Product innovation pipeline fixed cost since 2019 target of 2.0x and strong brand portfolio ~$16.9
BILLION ~6.8% $550-$650 MILLION 7%-8% ROIC ~$400 MILLION * Net Sales 2024 Guidance Ongoing EBIT 2024 Guidance 2024 FCF Guidance 2024 Annual Expectation Dividends Expected 2024 Well positioned to deliver a higher-growth, higher-margin business and
shareholder returns 78 *Subject to board approval.

2026 Value Creation * 2024 GUIDANCE 2026 TARGET ~$16.9B ~$17.2B NET
SALES ONGOING EBIT ~$1.15B ~$1.6B % OF NET SALES ~6.8% ~9% ~$350M ~$250M INTEREST EXPENSE ADJUSTED EFFECTIVE TAX RATE ~0% 20%-25% FREE CASH FLOW $550-$650M $1.1B+ ~20% CASH TAX RATE ~15% 79 *Includes Q1 2024 for MDA Europe.
Whirlpool Investor Day Supplemental Information

EMEA Operating Profit The reconciliation provided below
reconciles the non-GAAP financial measure EMEA ongoing business segment operating profit (loss) with the most directly comparable GAAP financial measure, EMEA segment operating profit (loss), for the twelve months ended
December 31, 2014. Operating profit reconciliation: 2014 Reported measure (operating profit) $59 Acquisition Related Costs and Inventory PPA 60 Ongoing business measure (operating profit) $119 81
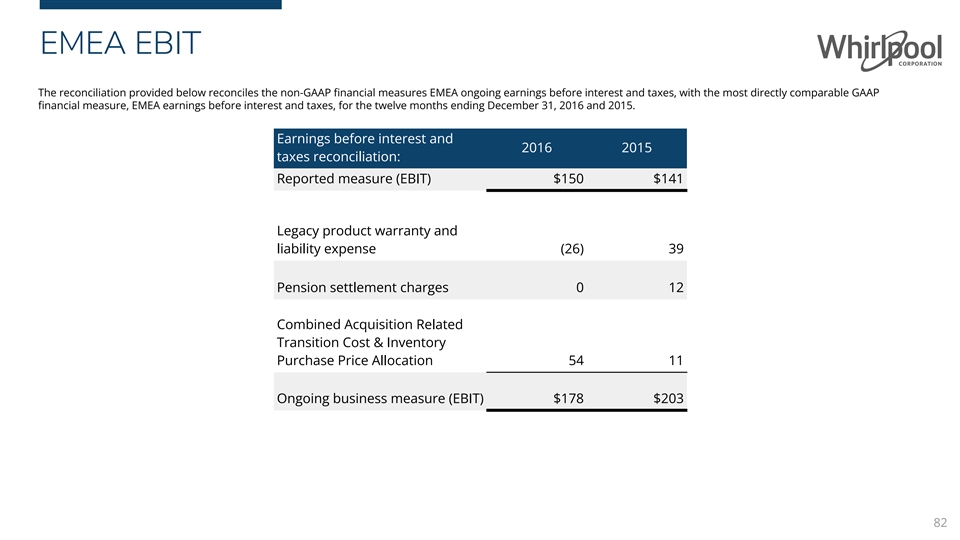
EMEA EBIT The reconciliation provided below reconciles the non-GAAP
financial measures EMEA ongoing earnings before interest and taxes, with the most directly comparable GAAP financial measure, EMEA earnings before interest and taxes, for the twelve months ending December 31, 2016 and 2015. Earnings
before interest and 2016 2015 taxes reconciliation: Reported measure (EBIT) $150 $141 Legacy product warranty and liability expense (26) 39 Pension settlement charges 0 12 Combined Acquisition Related Transition Cost & Inventory Purchase Price
Allocation 54 11 Ongoing business measure (EBIT) $178 $203 82

EMEA Free Cash Flow EMEA free cash flow is cash provided by (used
in) operating activities after capital expenditures and proceeds from sale of assets through 2021. The reconciliation provided below reconciles twelve months ended December 31, 2023, 2022, 2021, 2020, 2019, 2018, 2017, 2016, 2015, 2014, 2013, 2012,
2011, 2010, 2009, and 2008 free cash flow with cash provided by (used in) operating activities, the most directly comparable GAAP financial measure. (millions of dollars) 2023 2022 2021 2020 2019 2018 2017 2016 2015 2014 2013 2012 2011
2010 2009 2008 Cash provided by (used in) operating activities $(68) $(123) $192 $93 $147 $(35) $(2) $(93) $340 $50 $115 $(19) $9 $213 $301 $231 Capital expenditures (107) (132) (152) (116) (124) (154) (218) (199) (220) (129) (101) (88) (103) (98)
(116) (156) Proceeds from Sale of Assets - - 15 26 18 2 2 12 1 - 2 8 3 - - - Free cash flow $(175) $(255) $55 $3 $40 $(187) $(218) $(281) $121 $(79) $16 $(99) $(91) $115 $185 $75 Note: Numbers may not reconcile due to rounding; Cash provided
by (used in) financing activities and cash provided by (used in) investing activities are not provided based on the segment nature of this reconciliation 83
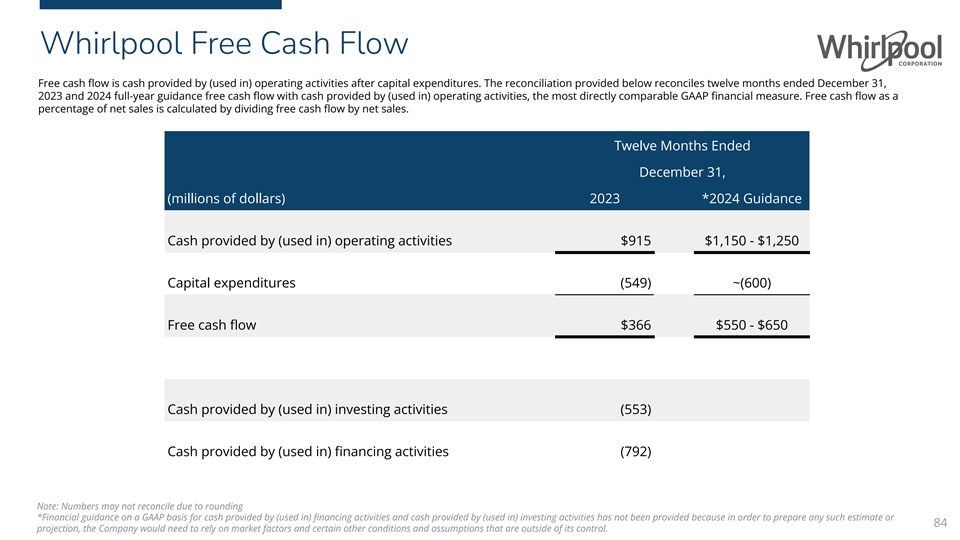
Whirlpool Free Cash Flow Free cash flow is cash provided by (used
in) operating activities after capital expenditures. The reconciliation provided below reconciles twelve months ended December 31, 2023 and 2024 full-year guidance free cash flow with cash provided by (used in) operating activities, the most
directly comparable GAAP financial measure. Free cash flow as a percentage of net sales is calculated by dividing free cash flow by net sales. Twelve Months Ended December 31, (millions of dollars) 2023 *2024 Guidance Cash provided
by (used in) operating activities $915 $1,150 - $1,250 Capital expenditures (549) ~(600) Free cash flow $366 $550 - $650 Cash provided by (used in) investing activities (553) Cash provided by (used in) financing activities (792) Note:
Numbers may not reconcile due to rounding *Financial guidance on a GAAP basis for cash provided by (used in) financing activities and cash provided by (used in) investing activities has not been provided because in order to prepare any such
estimate or 84 projection, the Company would need to rely on market factors and certain other conditions and assumptions that are outside of its control.

2024 Ongoing EBIT & EPS The reconciliation provided below
reconciles the non-GAAP financial measures ongoing earnings before interest and taxes and ongoing earnings per diluted share, with the most directly comparable GAAP financial measures, net earnings available to Whirlpool and net earnings
per diluted share available to Whirlpool, for the twelve months ending December 31, 2024. Ongoing EBIT margin is calculated by dividing ongoing EBIT by net sales. EBIT margin is calculated by dividing EBIT by net sales. The earnings per diluted
share GAAP measure and ongoing measure are presented net of tax, while each adjustment is presented on a pre-tax basis. Our anticipated full-year GAAP tax rate is approximately 24%. The aggregate income tax impact of the taxable components of each
adjustment is presented in the income tax impact line item at our anticipated full-year adjusted tax (non-GAAP) rate of approximately 0.0%. Earnings per diluted Earnings before interest & taxes* share Results Classification Reported
measure ~$1,100 ~$9.50 Restructuring Expense ~50 ~1.00 Total income tax impact - Normalized tax rate adjustments ~3.50 Ongoing measure ~$1,150 ~$14.00 Net Sales ~$16,900 Ongoing EBIT Margin 6.8% Note: Numbers may not reconcile due to rounding
*Earnings Before Interest & Taxes (EBIT) is a non-GAAP measure. The Company does not provide a forward-looking quantitative reconciliation of EBIT to the most directly comparable GAAP financial measure, net earnings available to Whirlpool,
because the net earnings available to noncontrolling interests item of such reconciliation -- which has historically represented a relatively insignificant amount of the Company's overall net earnings -- implicates the Company's projections
regarding the earnings of the Company's non wholly-owned subsidiaries and joint ventures that cannot be quantified precisely or without unreasonable 85 efforts.

2023 Ongoing EBIT & EPS The reconciliation provided below
reconciles the non-GAAP financial measures ongoing earnings before interest and taxes and ongoing earnings per diluted share, with the most directly comparable GAAP financial measures, net earnings (loss) available to Whirlpool and net
earnings (loss) per diluted share available to Whirlpool, for the twelve months ending December 31, 2023. Net earnings (loss) margin is calculated by dividing net earnings (loss) available to Whirlpool by net sales. Ongoing EBIT margin is calculated
by dividing ongoing EBIT by net sales. EBIT margin is calculated by dividing EBIT by net sales. The earnings per diluted share GAAP measure and ongoing measure are presented net of tax, while each adjustment is presented on a pre-tax basis. Our
full-year GAAP tax rate was 13.0%. The aggregate income tax impact of the taxable components of each adjustment is presented in the income tax impact line item at our full-year adjusted tax (non-GAAP) rate of (6.7)%. Twelve Months Twelve Months
Ended Ended December 31, 2023 December 31, Earnings before Earnings per Earnings Before Interest & Taxes Reconciliation: 2023 Results classification interest & taxes diluted share Reported measure $ 916 $ 8.72 Net earnings (loss)
available to Whirlpool $ 481 (Gain) loss on sale and Net earnings (loss) available to noncontrolling disposal of businesses interests 7 & Selling, general and administrative & including equity Income tax expense (benefit) 77 Impact of
M&A transactions method investment 181 3.27 Interest and sundry Legacy EMEA legal matters (income) expense 94 1.71 Interest expense 351 Total income tax impact 0.35 Normalized tax rate Earnings (loss) before interest & taxes $ 916 adjustment
2.11 Ongoing measure $ 1,191 $ 16.16 Net sales $ 19,455 Net Sales $ 19,455 Net earnings (loss) margin 2.5% Ongoing EBIT Margin 6.1% Note: Numbers may not reconcile due to rounding 86

2022 Ongoing EBIT & EPS The reconciliation provided below
reconciles the non-GAAP financial measures ongoing earnings before interest and taxes and ongoing earnings per diluted share, with the most directly comparable GAAP financial measures, net earnings (loss) available to Whirlpool and net
earnings (loss) per basic share available to Whirlpool, for the twelve months ended December 31, 2022. Net earnings (loss) margin is calculated by dividing net earnings (loss) available to Whirlpool by net sales. Ongoing EBIT margin is calculated by
dividing ongoing EBIT by net sales. EBIT margin is calculated by dividing EBIT by net sales. The earnings per basic share GAAP measure and ongoing measure are presented net of tax, while each adjustment is presented on a pre-tax basis. Our full-year
GAAP tax rate was (21.6)%. The aggregate income tax impact of the taxable components of each adjustment is presented in the income tax impact line item at our full-year adjusted tax rate (non-GAAP) of 4.4%. Twelve Months Ended Twelve Months Ended
December 31, 2022 Earnings before Earnings per interest & taxes diluted share Results classification Earnings Before Interest & Taxes Reconciliation: December 31, 2022 Reported measure $ (1,056) $ (27.18) Net earnings (loss) available
to Whirlpool $ (1,519) Impairment of goodwill Net earnings (loss) available to noncontrolling and other intangibles & interests 8 Impairment of goodwill, Equity method investment intangibles and other assets income (loss), net of tax 396 7.08
(Gain) loss on sale and Income tax expense (benefit) 265 disposal of businesses & Selling, general and Interest expense 190 Impact of M&A transactions administrative 1,936 34.63 Substantial liquidation of Interest and sundry subsidiary
(income) expense 84 1.51 Earnings (loss) before interest & taxes $ (1,056) Total income tax impact (1.89) Net sales $ 19,724 Normalized tax rate adjustment 5.69 Net earnings (loss) margin (7.7)% Share adjustment (0.20) Ongoing measure $ 1,360 $
19.64 Net Sales $ 19,724 Ongoing EBIT Margin 6.9% Note: Numbers may not reconcile due to rounding 87

2021 Ongoing EBIT & EPS The reconciliation provided below
reconciles the non-GAAP financial measures ongoing earnings before interest and taxes and ongoing earnings per diluted share, with the most directly comparable GAAP financial measures, net earnings available to Whirlpool and net earnings
per diluted share available to Whirlpool, for the twelve months ended December 31, 2021. Ongoing EBIT margin is calculated by dividing ongoing EBIT by net sales. EBIT margin is calculated by dividing EBIT by net sales. Net earnings margin is
calculated by dividing net earnings available to Whirlpool by net sales. The earnings per diluted share GAAP measure and ongoing measure are presented net of tax, while each adjustment is presented on a pre-tax basis. Our full year GAAP tax rate was
22.2%. The aggregate income tax impact of the taxable components of each adjustment is presented in the income tax impact line item at our full-year adjusted tax rate (non-GAAP) of 23.5%. Twelve Months Ended Twelve Months Ended December 31, 2021
Results Earnings before Earnings per Earnings Before Interest & Taxes Reconciliation: December 31, 2021 interest & taxes diluted share classification Reported measure $ 2,499 $ 28.36 Net earnings (loss) available to Whirlpool $ 1,783
Net earnings (loss) available to noncontrolling Restructuring costs Restructuring costs 38 0.61 interests 23 (Gain) loss on sale (Gain) loss on sale and disposal of and disposal of businesses businesses (107) (1.69) Income tax expense
(benefit) 518 (Gain) loss on (Gain) loss on previously held previously held Interest expense 175 equity interest equity interest (42) (0.50) Product warranty and liability Cost of products Earnings (loss) before interest & taxes $ 2,499
(income) expense sold (9) (0.14) Income tax impact 0.41 Net sales $ 21,985 Normalized tax rate adjustment (0.46) Net earnings (loss) margin 8.1% Ongoing measure $ 2,379 $ 26.59 Net Sales $ 21,985 Ongoing EBIT Margin 10.8% Note: Numbers may not
reconcile due to rounding 88

2020 Ongoing EBIT & EPS The reconciliation provided below
reconciles the non-GAAP financial measures ongoing earnings before interest and taxes and ongoing earnings per diluted share, with the most directly comparable GAAP financial measures, net earnings (loss) available to Whirlpool and net
earnings (loss) per diluted share available to Whirlpool, for the twelve months ended December 31, 2020. Net earnings margin is calculated by dividing net earnings available to Whirlpool by net sales. Ongoing EBIT margin is calculated by dividing
ongoing EBIT by net sales. EBIT margin is calculated by dividing EBIT by net sales. The earnings per diluted share GAAP measure and ongoing measure are presented net of tax, while each adjustment is presented on a pre-tax basis. Our full year GAAP
tax rate is approximately 26.5%. The aggregate income tax impact of the taxable components of each adjustment is presented in the income tax impact line item at our full-year adjusted tax rate of approximately 26.3%. Twelve Months Twelve Months
Ended Ended December 31, 2020 Earnings Before Interest & Taxes Earnings before Earnings per Reconciliation: December 31, 2020 interest & taxes diluted share Results classification Net earnings (loss) available to Whirlpool $ 1,075
Reported measure $ 1,636 $ 16.98 Restructuring costs Restructuring costs 288 4.54 Net earnings (loss) available to noncontrolling interests (10) Product warranty and liability (income) expense Cost of products sold (30) (0.47) Income tax expense
(benefit) 382 Sale leaseback, real estate and receivable adjustments Cost of products sold (74) (1.16) Sale leaseback, real estate and Selling, general and Interest expense 189 receivable adjustments administrative (39) (0.61) Corrective
action recovery Cost of products sold (14) (0.22) Earnings (loss) before interest & taxes $ 1,636 (Gain) loss on sale and disposal of (Gain) loss on sale and Net sales $ 19,456 businesses disposal of businesses (7) (0.10) Income tax impact
(0.53) Net earnings (loss) margin 5.5% Normalized tax rate adjustment 0.03 Ongoing measure $ 1,760 $ 18.46 Net Sales $ 19,456 Ongoing EBIT Margin 9.0% Note: Numbers may not reconcile due to rounding 89
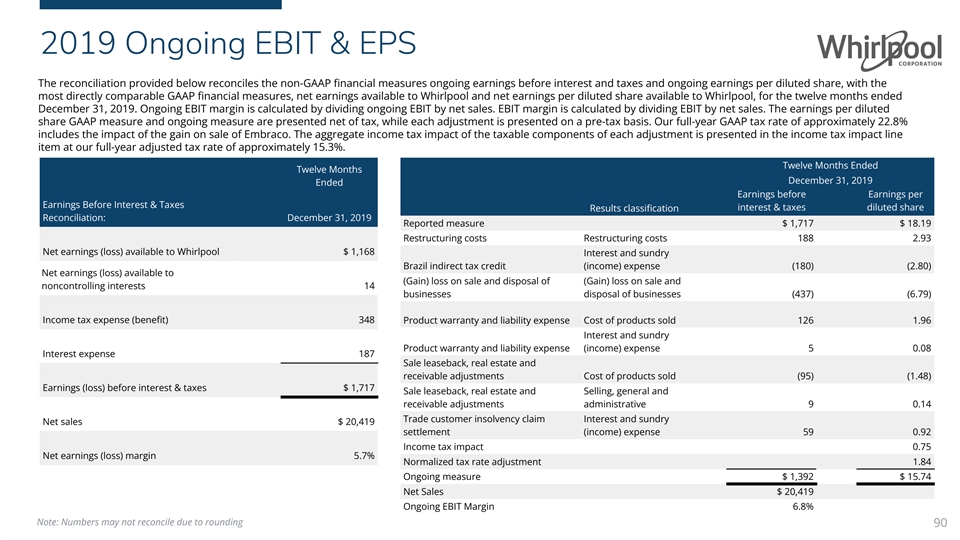
2019 Ongoing EBIT & EPS The reconciliation provided below
reconciles the non-GAAP financial measures ongoing earnings before interest and taxes and ongoing earnings per diluted share, with the most directly comparable GAAP financial measures, net earnings available to Whirlpool and net earnings
per diluted share available to Whirlpool, for the twelve months ended December 31, 2019. Ongoing EBIT margin is calculated by dividing ongoing EBIT by net sales. EBIT margin is calculated by dividing EBIT by net sales. The earnings per diluted share
GAAP measure and ongoing measure are presented net of tax, while each adjustment is presented on a pre-tax basis. Our full-year GAAP tax rate of approximately 22.8% includes the impact of the gain on sale of Embraco. The aggregate income tax impact
of the taxable components of each adjustment is presented in the income tax impact line item at our full-year adjusted tax rate of approximately 15.3%. Twelve Months Ended Twelve Months December 31, 2019 Ended Earnings before Earnings per Earnings
Before Interest & Taxes interest & taxes diluted share Results classification Reconciliation: December 31, 2019 Reported measure $ 1,717 $ 18.19 Restructuring costs Restructuring costs 188 2.93 Net earnings (loss) available to
Whirlpool $ 1,168 Interest and sundry Brazil indirect tax credit (income) expense (180) (2.80) Net earnings (loss) available to (Gain) loss on sale and disposal of (Gain) loss on sale and noncontrolling interests 14 businesses disposal of businesses
(437) (6.79) Income tax expense (benefit) 348 Product warranty and liability expense Cost of products sold 126 1.96 Interest and sundry Product warranty and liability expense (income) expense 5 0.08 Interest expense 187 Sale leaseback, real
estate and receivable adjustments Cost of products sold (95) (1.48) Earnings (loss) before interest & taxes $ 1,717 Sale leaseback, real estate and Selling, general and receivable adjustments administrative 9 0.14 Trade customer insolvency claim
Interest and sundry Net sales $ 20,419 settlement (income) expense 59 0.92 Income tax impact 0.75 Net earnings (loss) margin 5.7% Normalized tax rate adjustment 1.84 Ongoing measure $ 1,392 $ 15.74 Net Sales $ 20,419 Ongoing EBIT Margin 6.8% Note:
Numbers may not reconcile due to rounding 90
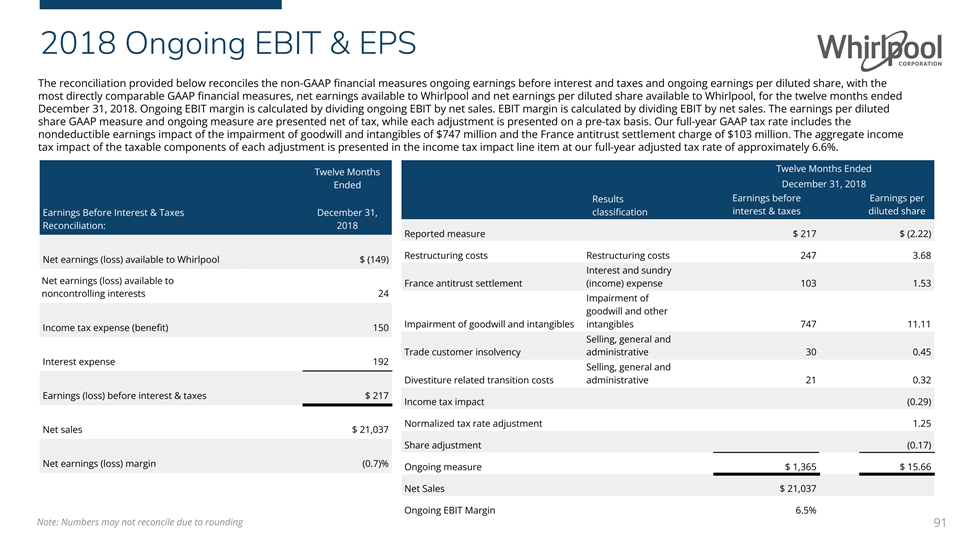
2018 Ongoing EBIT & EPS The reconciliation provided below
reconciles the non-GAAP financial measures ongoing earnings before interest and taxes and ongoing earnings per diluted share, with the most directly comparable GAAP financial measures, net earnings available to Whirlpool and net earnings
per diluted share available to Whirlpool, for the twelve months ended December 31, 2018. Ongoing EBIT margin is calculated by dividing ongoing EBIT by net sales. EBIT margin is calculated by dividing EBIT by net sales. The earnings per diluted share
GAAP measure and ongoing measure are presented net of tax, while each adjustment is presented on a pre-tax basis. Our full-year GAAP tax rate includes the nondeductible earnings impact of the impairment of goodwill and intangibles of $747 million
and the France antitrust settlement charge of $103 million. The aggregate income tax impact of the taxable components of each adjustment is presented in the income tax impact line item at our full-year adjusted tax rate of approximately 6.6%. Twelve
Months Ended Twelve Months Ended December 31, 2018 Earnings before Earnings per Results interest & taxes diluted share Earnings Before Interest & Taxes December 31, classification Reconciliation: 2018 Reported measure $ 217 $ (2.22)
Restructuring costs Restructuring costs 247 3.68 Net earnings (loss) available to Whirlpool $ (149) Interest and sundry Net earnings (loss) available to France antitrust settlement (income) expense 103 1.53 noncontrolling interests 24 Impairment of
goodwill and other Impairment of goodwill and intangibles intangibles 747 11.11 Income tax expense (benefit) 150 Selling, general and Trade customer insolvency administrative 30 0.45 Interest expense 192 Selling, general and Divestiture
related transition costs administrative 21 0.32 Earnings (loss) before interest & taxes $ 217 Income tax impact (0.29) Normalized tax rate adjustment 1.25 Net sales $ 21,037 Share adjustment (0.17) Net earnings (loss) margin (0.7)% Ongoing
measure $ 1,365 $ 15.66 Net Sales $ 21,037 Ongoing EBIT Margin 6.5% Note: Numbers may not reconcile due to rounding 91
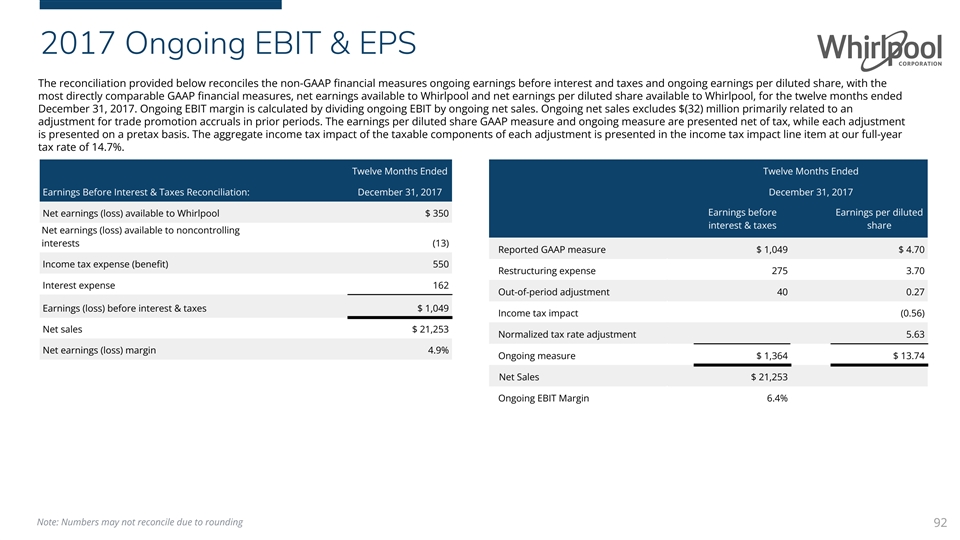
2017 Ongoing EBIT & EPS The reconciliation provided below
reconciles the non-GAAP financial measures ongoing earnings before interest and taxes and ongoing earnings per diluted share, with the most directly comparable GAAP financial measures, net earnings available to Whirlpool and net earnings
per diluted share available to Whirlpool, for the twelve months ended December 31, 2017. Ongoing EBIT margin is calculated by dividing ongoing EBIT by ongoing net sales. Ongoing net sales excludes $(32) million primarily related to an adjustment for
trade promotion accruals in prior periods. The earnings per diluted share GAAP measure and ongoing measure are presented net of tax, while each adjustment is presented on a pretax basis. The aggregate income tax impact of the taxable components of
each adjustment is presented in the income tax impact line item at our full-year tax rate of 14.7%. Twelve Months Ended Twelve Months Ended Earnings Before Interest & Taxes Reconciliation: December 31, 2017 December 31, 2017 Earnings before
Earnings per diluted Net earnings (loss) available to Whirlpool $ 350 interest & taxes share Net earnings (loss) available to noncontrolling interests (13) Reported GAAP measure $ 1,049 $ 4.70 Income tax expense (benefit) 550 Restructuring
expense 275 3.70 Interest expense 162 Out-of-period adjustment 40 0.27 Earnings (loss) before interest & taxes $ 1,049 Income tax impact (0.56) Net sales $ 21,253 Normalized tax rate adjustment 5.63 Net earnings (loss) margin 4.9% Ongoing
measure $ 1,364 $ 13.74 Net Sales $ 21,253 Ongoing EBIT Margin 6.4% Note: Numbers may not reconcile due to rounding 92

2016 Ongoing EBIT & EPS The reconciliation provided below
reconciles the non-GAAP financial measures ongoing business earnings before interest and taxes and ongoing business earnings per diluted share, with the most directly comparable GAAP financial measures, net earnings available to
Whirlpool and net earnings per diluted share available to Whirlpool, for the twelve months ended December 31, 2016. Ongoing business EBIT margin is calculated by dividing ongoing business EBIT by net sales. The earnings per diluted share GAAP
measure and ongoing business measure are presented net of tax, while each adjustment is presented on a pre-tax basis. The aggregate income tax impact of the taxable components of each adjustment is presented in the income tax impact line item at our
full-year tax rate of 16.6%. Twelve Months Twelve Months Ended Ended December 31, 2016 Earnings Before Interest & Taxes Reconciliation: December 31, 2016 Earnings before Earnings per interest & taxes diluted share Net earnings (loss)
available to Whirlpool $ 888 Net earnings (loss) available to noncontrolling Reported GAAP measure $ 1,275 $ 11.50 interests 40 Restructuring expense 173 2.24 Income tax expense (benefit) 186 Interest expense 161 Acquisition related transition
costs 86 1.11 Legacy product warranty and liability Earnings (loss) before interest & taxes $ 1,275 expense (23) (0.30) Net sales $ 20,718 Income tax impact (0.49) Net earnings (loss) margin 6.2% Ongoing measure $ 1,511 $ 14.06 Net Sales $
20,718 Ongoing EBIT Margin 7.3% Note: Numbers may not reconcile due to rounding 93

2015 Ongoing EBIT & EPS The reconciliation provided below
reconciles the non-GAAP financial measures ongoing business earnings before interest and taxes and ongoing business earnings per diluted share, with the most directly comparable GAAP financial measures, net earnings available to
Whirlpool and net earnings per diluted share available to Whirlpool, for the twelve months ending December 31, 2015. Ongoing business EBIT margin is calculated by dividing ongoing business EBIT by net sales. Twelve Months Ended Twelve Months Ended
December 31, 2015 Earnings before Earnings per Earnings Before Interest & Taxes Reconciliation: December 31, 2015 interest & taxes diluted share Reported GAAP measure $ 1,196 $ 9.83 Net earnings (loss) available to Whirlpool $ 783
Restructuring expense 201 2.03 Net earnings (loss) available to noncontrolling interests 39 Combined Acquisition Related Transition Costs 64 0.66 Income tax expense (benefit) 209 Benefit Plan Curtailment Gain (62) (0.63) Gain/Expenses
Related to a Interest expense 165 Business Investment (46) (0.44) Legacy Product Warranty and Earnings (loss) before interest & taxes $ 1,196 Liability Expense 42 0.42 Pension Settlement Charges 15 0.16 Net sales $ 20,891 Antitrust and Dispute
Resolutions 35 0.35 Net earnings (loss) margin 5.7% Ongoing measure $ 1,445 $ 12.38 Net Sales $ 20,891 Ongoing EBIT Margin 6.9% Note: Numbers may not reconcile due to rounding 94
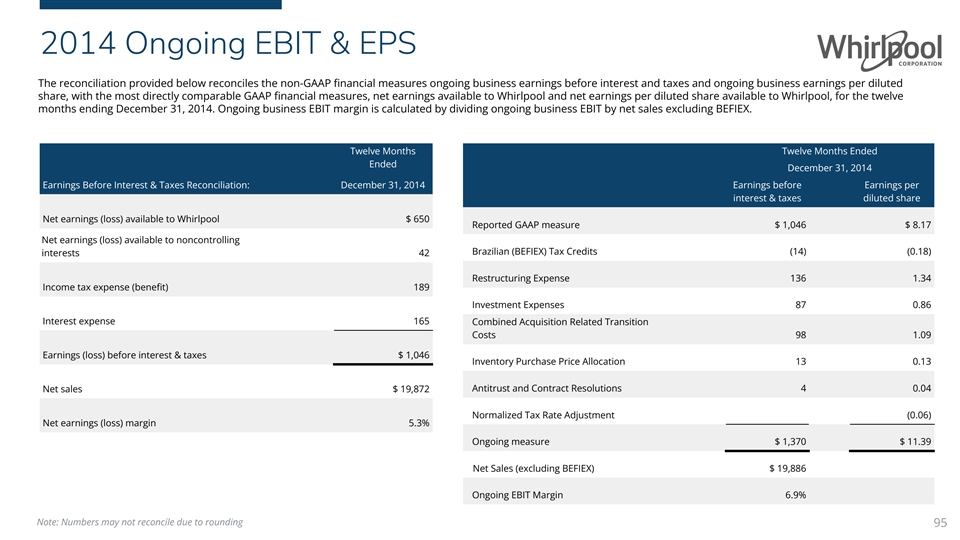
2014 Ongoing EBIT & EPS The reconciliation provided below
reconciles the non-GAAP financial measures ongoing business earnings before interest and taxes and ongoing business earnings per diluted share, with the most directly comparable GAAP financial measures, net earnings available to
Whirlpool and net earnings per diluted share available to Whirlpool, for the twelve months ending December 31, 2014. Ongoing business EBIT margin is calculated by dividing ongoing business EBIT by net sales excluding BEFIEX. Twelve Months Twelve
Months Ended Ended December 31, 2014 Earnings Before Interest & Taxes Reconciliation: December 31, 2014 Earnings before Earnings per interest & taxes diluted share Net earnings (loss) available to Whirlpool $ 650 Reported GAAP measure $
1,046 $ 8.17 Net earnings (loss) available to noncontrolling Brazilian (BEFIEX) Tax Credits (14) (0.18) interests 42 Restructuring Expense 136 1.34 Income tax expense (benefit) 189 Investment Expenses 87 0.86 Interest expense 165 Combined
Acquisition Related Transition Costs 98 1.09 Earnings (loss) before interest & taxes $ 1,046 Inventory Purchase Price Allocation 13 0.13 Net sales $ 19,872 Antitrust and Contract Resolutions 4 0.04 Normalized Tax Rate Adjustment (0.06) Net
earnings (loss) margin 5.3% Ongoing measure $ 1,370 $ 11.39 Net Sales (excluding BEFIEX) $ 19,886 Ongoing EBIT Margin 6.9% Note: Numbers may not reconcile due to rounding 95
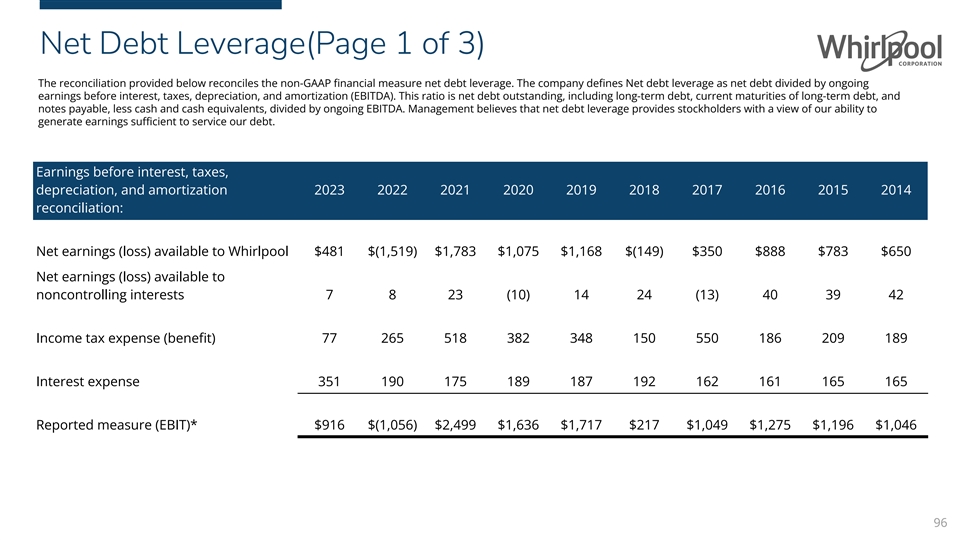
Net Debt Leverage(Page 1 of 3) The reconciliation provided below
reconciles the non-GAAP financial measure net debt leverage. The company defines Net debt leverage as net debt divided by ongoing earnings before interest, taxes, depreciation, and amortization (EBITDA). This ratio is net debt
outstanding, including long-term debt, current maturities of long-term debt, and notes payable, less cash and cash equivalents, divided by ongoing EBITDA. Management believes that net debt leverage provides stockholders with a view of our ability to
generate earnings sufficient to service our debt. Earnings before interest, taxes, depreciation, and amortization 2023 2022 2021 2020 2019 2018 2017 2016 2015 2014 reconciliation: Net earnings (loss) available to Whirlpool $481 $(1,519) $1,783
$1,075 $1,168 $(149) $350 $888 $783 $650 Net earnings (loss) available to noncontrolling interests 7 8 23 (10) 14 24 (13) 40 39 42 Income tax expense (benefit) 77 265 518 382 348 150 550 186 209 189 Interest expense 351 190 175 189 187 192 162
161 165 165 Reported measure (EBIT)* $916 $(1,056) $2,499 $1,636 $1,717 $217 $1,049 $1,275 $1,196 $1,046 96

Net Debt Leverage (Page 2 of 3) Earnings before interest, taxes,
depreciation, and 2023 2022 2021 2020 2019 2018 2017 2016 2015 2014 amortization reconciliation: Reported measure (EBIT) $916 $(1,056) $2,499 $1,636 $1,717 $217 $1,049 $1,275 $1,196 $1,046 Acquisition related transition costs - - - - - - - 86 64 98
Antitrust and dispute resolutions - - - - - 103 - - 35 4 Benefit plan curtailment gain - - - - - - - - (62) - Brazilian (BEFIEX) tax credits - - - - (180) - - - - (14) Corrective action recovery - - - (14) - - - - - - (Gain) loss on previously
held equity interest - - (42) - - - - - - - (Gain) loss on sale and disposal of businesses - - (107) (7) (437) 21 - - - - Gain/expenses related to a business investment - - - - - - - - (46) - Impact of M&A Transactions 181 1,936 - - - - - - - -
Impairment of goodwill and intangibles - 396 - - - 747 - - - - Inventory purchase price allocation - - - - - - - - - 13 Legacy EMEA legal matters 94 - - - - - - - - - Investment expenses - - - - - - - - - 87 Legacy product warranty and liability
expense - - - - - - - (23) 42 - Out-of-period adjustment - - - - - - 40 - - - Pension settlement charges - - - - - - - - 15 - Product warranty and liability expense - - (9) (30) 131 - - - - - Restructuring expense - - 38 288 188 247 275 173 201 136
Sale leaseback, real estate, and receivable adjustments - - - (113) (86) - - - - - Substantial liquidation of subsidiary - 84 - - - - - - - - Trade customer insolvency - - - - 59 30 - - - - Ongoing business measure (EBIT) $1,191 $1,360 $2,379 $1,760
$1,392 $1,365 $1,364 $1,511 $1,445 $1,370 Depreciation and Amortization $361 $475 $494 $568 $587 $645 $654 $655 $668 $560 Ongoing EBITDA $1,552 $1,835 $2,873 $2,328 $1,979 $2,010 $2,018 $2,166 $2,113 $1,930 97

Net Debt Leverage (Page 3 of 3) 2023 2022 2021 2020 2019 2018 2017 2016
2015 2014 Gross debt outstanding Long-term debt $6,414 $7,363 $4,929 $5,059 $4,140 $4,046 $4,392 $3,876 $3,470 $3,544 Current maturities of long-term debt 800 248 298 298 559 947 376 560 508 234 Notes payable 17 4 10 12 294 1034 450 34 20 569 Gross
debt outstanding $7,231 $7,615 $5,237 $5,369 $4,993 $6,027 $5,218 $4,470 $3,998 $4,347 Cash & cash equivalents $1,570 $1,958 $3,044 $2,924 $1,952 $1,498 $1,196 $1,085 $772 $1,026 2023 2022 2021 2020 2019 2018 2017 2016 2015 2014 Net debt to
EBITDA ratio Net debt outstanding $5,661 $5,657 $2,193 $2,445 $3,041 $4,529 $4,022 $3,385 $3,226 $3,321 Ongoing EBITDA $1,552 $1,835 $2,873 $2,328 $1,979 $2,010 $2,018 $2,166 $2,113 $1,930 Net debt to EBITDA ratio 3.6 3.1 0.8 1.1 1.5 2.3 2.0 1.6 1.5
1.7 Note: Numbers may not reconcile due to rounding 98
v3.24.0.1
| X |
- DefinitionBoolean flag that is true when the XBRL content amends previously-filed or accepted submission.
| Name: |
dei_AmendmentFlag |
| Namespace Prefix: |
dei_ |
| Data Type: |
xbrli:booleanItemType |
| Balance Type: |
na |
| Period Type: |
duration |
|
| X |
- DefinitionFor the EDGAR submission types of Form 8-K: the date of the report, the date of the earliest event reported; for the EDGAR submission types of Form N-1A: the filing date; for all other submission types: the end of the reporting or transition period. The format of the date is YYYY-MM-DD.
| Name: |
dei_DocumentPeriodEndDate |
| Namespace Prefix: |
dei_ |
| Data Type: |
xbrli:dateItemType |
| Balance Type: |
na |
| Period Type: |
duration |
|
| X |
- DefinitionThe type of document being provided (such as 10-K, 10-Q, 485BPOS, etc). The document type is limited to the same value as the supporting SEC submission type, or the word 'Other'.
| Name: |
dei_DocumentType |
| Namespace Prefix: |
dei_ |
| Data Type: |
dei:submissionTypeItemType |
| Balance Type: |
na |
| Period Type: |
duration |
|
| X |
- DefinitionAddress Line 1 such as Attn, Building Name, Street Name
| Name: |
dei_EntityAddressAddressLine1 |
| Namespace Prefix: |
dei_ |
| Data Type: |
xbrli:normalizedStringItemType |
| Balance Type: |
na |
| Period Type: |
duration |
|
| X |
- Definition
+ References
+ Details
| Name: |
dei_EntityAddressCityOrTown |
| Namespace Prefix: |
dei_ |
| Data Type: |
xbrli:normalizedStringItemType |
| Balance Type: |
na |
| Period Type: |
duration |
|
| X |
- DefinitionCode for the postal or zip code
| Name: |
dei_EntityAddressPostalZipCode |
| Namespace Prefix: |
dei_ |
| Data Type: |
xbrli:normalizedStringItemType |
| Balance Type: |
na |
| Period Type: |
duration |
|
| X |
- DefinitionName of the state or province.
| Name: |
dei_EntityAddressStateOrProvince |
| Namespace Prefix: |
dei_ |
| Data Type: |
dei:stateOrProvinceItemType |
| Balance Type: |
na |
| Period Type: |
duration |
|
| X |
- DefinitionA unique 10-digit SEC-issued value to identify entities that have filed disclosures with the SEC. It is commonly abbreviated as CIK. Reference 1: http://www.xbrl.org/2003/role/presentationRef
-Publisher SEC
-Name Exchange Act
-Number 240
-Section 12
-Subsection b-2
| Name: |
dei_EntityCentralIndexKey |
| Namespace Prefix: |
dei_ |
| Data Type: |
dei:centralIndexKeyItemType |
| Balance Type: |
na |
| Period Type: |
duration |
|
| X |
- DefinitionIndicate if registrant meets the emerging growth company criteria. Reference 1: http://www.xbrl.org/2003/role/presentationRef
-Publisher SEC
-Name Exchange Act
-Number 240
-Section 12
-Subsection b-2
| Name: |
dei_EntityEmergingGrowthCompany |
| Namespace Prefix: |
dei_ |
| Data Type: |
xbrli:booleanItemType |
| Balance Type: |
na |
| Period Type: |
duration |
|
| X |
- DefinitionCommission file number. The field allows up to 17 characters. The prefix may contain 1-3 digits, the sequence number may contain 1-8 digits, the optional suffix may contain 1-4 characters, and the fields are separated with a hyphen.
| Name: |
dei_EntityFileNumber |
| Namespace Prefix: |
dei_ |
| Data Type: |
dei:fileNumberItemType |
| Balance Type: |
na |
| Period Type: |
duration |
|
| X |
- DefinitionTwo-character EDGAR code representing the state or country of incorporation.
| Name: |
dei_EntityIncorporationStateCountryCode |
| Namespace Prefix: |
dei_ |
| Data Type: |
dei:edgarStateCountryItemType |
| Balance Type: |
na |
| Period Type: |
duration |
|
| X |
- DefinitionThe exact name of the entity filing the report as specified in its charter, which is required by forms filed with the SEC. Reference 1: http://www.xbrl.org/2003/role/presentationRef
-Publisher SEC
-Name Exchange Act
-Number 240
-Section 12
-Subsection b-2
| Name: |
dei_EntityRegistrantName |
| Namespace Prefix: |
dei_ |
| Data Type: |
xbrli:normalizedStringItemType |
| Balance Type: |
na |
| Period Type: |
duration |
|
| X |
- DefinitionThe Tax Identification Number (TIN), also known as an Employer Identification Number (EIN), is a unique 9-digit value assigned by the IRS. Reference 1: http://www.xbrl.org/2003/role/presentationRef
-Publisher SEC
-Name Exchange Act
-Number 240
-Section 12
-Subsection b-2
| Name: |
dei_EntityTaxIdentificationNumber |
| Namespace Prefix: |
dei_ |
| Data Type: |
dei:employerIdItemType |
| Balance Type: |
na |
| Period Type: |
duration |
|
| X |
- DefinitionLocal phone number for entity.
| Name: |
dei_LocalPhoneNumber |
| Namespace Prefix: |
dei_ |
| Data Type: |
xbrli:normalizedStringItemType |
| Balance Type: |
na |
| Period Type: |
duration |
|
| X |
- DefinitionBoolean flag that is true when the Form 8-K filing is intended to satisfy the filing obligation of the registrant as pre-commencement communications pursuant to Rule 13e-4(c) under the Exchange Act. Reference 1: http://www.xbrl.org/2003/role/presentationRef
-Publisher SEC
-Name Exchange Act
-Number 240
-Section 13e
-Subsection 4c
| Name: |
dei_PreCommencementIssuerTenderOffer |
| Namespace Prefix: |
dei_ |
| Data Type: |
xbrli:booleanItemType |
| Balance Type: |
na |
| Period Type: |
duration |
|
| X |
- DefinitionBoolean flag that is true when the Form 8-K filing is intended to satisfy the filing obligation of the registrant as pre-commencement communications pursuant to Rule 14d-2(b) under the Exchange Act. Reference 1: http://www.xbrl.org/2003/role/presentationRef
-Publisher SEC
-Name Exchange Act
-Number 240
-Section 14d
-Subsection 2b
| Name: |
dei_PreCommencementTenderOffer |
| Namespace Prefix: |
dei_ |
| Data Type: |
xbrli:booleanItemType |
| Balance Type: |
na |
| Period Type: |
duration |
|
| X |
- DefinitionTitle of a 12(b) registered security. Reference 1: http://www.xbrl.org/2003/role/presentationRef
-Publisher SEC
-Name Exchange Act
-Number 240
-Section 12
-Subsection b
| Name: |
dei_Security12bTitle |
| Namespace Prefix: |
dei_ |
| Data Type: |
dei:securityTitleItemType |
| Balance Type: |
na |
| Period Type: |
duration |
|
| X |
- DefinitionName of the Exchange on which a security is registered. Reference 1: http://www.xbrl.org/2003/role/presentationRef
-Publisher SEC
-Name Exchange Act
-Number 240
-Section 12
-Subsection d1-1
| Name: |
dei_SecurityExchangeName |
| Namespace Prefix: |
dei_ |
| Data Type: |
dei:edgarExchangeCodeItemType |
| Balance Type: |
na |
| Period Type: |
duration |
|
| X |
- DefinitionBoolean flag that is true when the Form 8-K filing is intended to satisfy the filing obligation of the registrant as soliciting material pursuant to Rule 14a-12 under the Exchange Act. Reference 1: http://www.xbrl.org/2003/role/presentationRef
-Publisher SEC
-Name Exchange Act
-Section 14a
-Number 240
-Subsection 12
| Name: |
dei_SolicitingMaterial |
| Namespace Prefix: |
dei_ |
| Data Type: |
xbrli:booleanItemType |
| Balance Type: |
na |
| Period Type: |
duration |
|
| X |
- DefinitionTrading symbol of an instrument as listed on an exchange.
| Name: |
dei_TradingSymbol |
| Namespace Prefix: |
dei_ |
| Data Type: |
dei:tradingSymbolItemType |
| Balance Type: |
na |
| Period Type: |
duration |
|
| X |
- DefinitionBoolean flag that is true when the Form 8-K filing is intended to satisfy the filing obligation of the registrant as written communications pursuant to Rule 425 under the Securities Act. Reference 1: http://www.xbrl.org/2003/role/presentationRef
-Publisher SEC
-Name Securities Act
-Number 230
-Section 425
| Name: |
dei_WrittenCommunications |
| Namespace Prefix: |
dei_ |
| Data Type: |
xbrli:booleanItemType |
| Balance Type: |
na |
| Period Type: |
duration |
|
| X |
- Details
| Name: |
dei_EntityListingsExchangeAxis=exch_XCHI |
| Namespace Prefix: |
|
| Data Type: |
na |
| Balance Type: |
|
| Period Type: |
|
|
| X |
- Details
| Name: |
dei_EntityListingsExchangeAxis=exch_XNYS |
| Namespace Prefix: |
|
| Data Type: |
na |
| Balance Type: |
|
| Period Type: |
|
|
Whirlpool (NYSE:WHR)
Historical Stock Chart
Von Apr 2024 bis Mai 2024

Whirlpool (NYSE:WHR)
Historical Stock Chart
Von Mai 2023 bis Mai 2024
