Changes in Brokered Deposits at 36 Banks -- WSJ
12 September 2023 - 2:30PM
Dow Jones News
Brokered deposits accounting for more than 10% of domestic
deposits can make regulators wary. The Federal Deposit Insurance
Corp. can charge higher insurance fees to banks that have high
concentrations of brokered deposits.
Brokered Deposits as a Share of All Domestic Deposits, This Year Vs Last Year

                               2Q 2023                   2Q 2022
                         Domestic   Percent       Domestic   Percent
                         Deposits   Brokered      Deposits   Brokered
JP Morgan Chase           $2.068T      4.39%       $2.128T      2.87%
Bank of America           $1.879T      1.78%       $1.964T      0.04%
Citibank                 $742.47B      9.54%      $753.68B      8.58%
Wells Fargo               $1.360T      6.39%       $1.442T      0.49%
U.S. Bancorp             $526.74B      6.65%      $455.31B      6.25%
PNC Bank                 $434.51B      1.99%      $446.68B      0.65%
Truist Financial         $418.24B      7.72%      $435.44B      5.26%
Goldman Sachs            $352.19B     20.63%      $343.13B     30.47%
Capital One              $367.82B      5.42%      $313.95B      1.66%
TD Bank                  $303.90B      0.71%      $356.36B      0.62%
Bank of NY Mellon        $193.69B      0.56%      $213.70B      0.01%
State Street             $164.78B      6.96%      $166.58B      6.16%
BMO Harris Bank          $202.24B      6.97%      $133.33B      2.05%
Citizens Financial       $180.71B      4.89%      $181.57B      2.46%
First Citizens Bank      $141.34B      2.25%       $89.43B      1.33%
M&T Bank                 $165.25B      7.72%      $173.07B      2.28%
Fifth Third Bank         $169.65B      4.01%      $166.58B      2.19%
Morgan Stanley Bank      $175.79B     22.22%      $169.57B      7.02%
Morgan Stanley Priv Bank $179.78B     20.84%      $182.63B      5.11%
KeyCorp                  $148.18B      5.76%      $149.41B      0.09%
Huntington Bank          $152.05B      3.32%      $148.69B      2.68%
Ally Financial           $158.82B      8.61%

   $142.59B      4.88%
American Express         $135.60B     23.03%      $104.57B      22.14%
HSBC Bank                $131.84B     13.62%      $130.88B      14.35%
Northern Bank             $39.50B      0.00%       $54.63B       0.00%
Regions Bank             $129.40B      1.56%      $139.56B       1.05%
Discover                 $101.21B     20.12%       $79.90B      14.46%
Flagstar Bank             $88.63B     10.46%       $41.38B      10.82%
Santander Bank            $77.10B      9.76%       $71.87B       0.00%
City National Bank        $73.92B     11.40%       $79.76B       0.03%
Comerica                  $67.61B      7.63%       $76.90B       0.66%
Zions Bancorp             $74.32B     11.37%       $79.06B       0.00%
First Horizon             $66.59B      5.57%       $71.88B       0.78%
Webster Financial         $59.03B      5.48%       $53.22B       0.24%
East West Bank            $53.15B      6.82%       $51.58B       6.83%
Western Alliance Bank     $51.29B     35.64%       $54.03B       6.58%
Source: FDIC
(END) Dow Jones Newswires
September 12, 2023 08:15 ET (12:15 GMT)
Copyright (c) 2023 Dow Jones & Company, Inc.
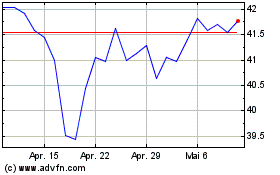
US Bancorp (NYSE:USB)
Historical Stock Chart
Von Mär 2024 bis Apr 2024

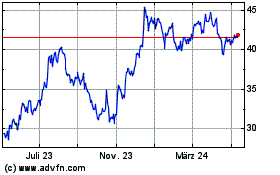
US Bancorp (NYSE:USB)
Historical Stock Chart
Von Apr 2023 bis Apr 2024
