0000751364false00007513642024-02-082024-02-08

UNITED STATES
SECURITIES AND EXCHANGE COMMISSION
Washington, D.C. 20549
FORM 8-K
CURRENT REPORT
Pursuant to Section 13 or 15(d) of the
Securities Exchange Act of 1934
Date of Report (Date of earliest event reported): February 8, 2024
NNN REIT, INC.
(exact name of registrant as specified in its charter)
|
|
|
|
|
Maryland |
|
001-11290 |
|
56-1431377 |
(State or other jurisdiction of incorporation or organization) |
|
(Commission File Number) |
|
(I.R.S. Employment Identification No.) |
450 South Orange Avenue, Suite 900, Orlando, Florida 32801
(Address of principal executive offices, including zip code)
(407) 265-7348
(Registrant’s telephone number, including area code)
Not applicable
(Former name or former address, if changed since last report)
Check the appropriate box below if the Form 8-K filing is intended to simultaneously satisfy the filing obligation of the registrant under any of the following provisions:
|
|
☐ |
Written communications pursuant to Rule 425 under the Securities Act (17 CFR 230.425) |
|
|
☐ |
Soliciting material pursuant to Rule 14a-12 under the Exchange Act (17 CFR 240.14a-12) |
|
|
☐ |
Pre-commencement communications pursuant to Rule 14d-2(b) under the Exchange Act (17 CFR 240.14d-2(b)) |
|
|
☐ |
Pre-commencement communications pursuant to Rule 13e-4(c) under the Exchange Act (17 CFR 240.13e-4(c)) |
Securities registered pursuant to Section 12(b) of the Act:
|
|
|
Title of each class |
Trading Symbol(s) |
Name of exchange on which registered |
Common Stock, $0.01 par value |
NNN |
New York Stock Exchange |
Indicate by check mark whether the registrant is an emerging growth company as defined in Rule 405 of the Securities Act of 1933 (§230.405 of this chapter) or Rule 12b-2 of the Securities Exchange Act of 1934 (§240.12b-2 of this chapter).
Emerging growth company ☐
If an emerging growth company, indicate by check mark if the registrant has elected not to use the extended transition
period for complying with any new or revised financial accounting standards provided pursuant to Section 13(a) of the Exchange Act. ☐
Item 2.02. Results of Operations and Financial Condition.
On February 8, 2024, NNN REIT, Inc. (the "Company"), issued a press release announcing its results of operations and financial condition for the quarter and year ended December 31, 2023. The press release is attached hereto as Exhibit 99.1 to this report and the supplemental data is attached hereto as Exhibit 99.2 to this report. The press release and the supplemental data are available on the Company's website.
The information in this Form 8-K is being furnished and shall not be deemed to be “filed” for purposes of Section 18 of the Securities Exchange Act of 1934 (the “Exchange Act”) or otherwise subject to the liabilities of such section, nor shall such information be deemed to be incorporated by reference in any filing under the Securities Act of 1933 or the Exchange Act, except as shall be expressly set forth by specific reference in such a filing.
Pursuant to the requirements of the Securities Exchange Act of 1934, the registrant has duly caused this report to be signed on its behalf by the undersigned hereunto duly authorized.
|
|
|
|
|
|
|
|
|
|
|
|
NNN REIT, Inc. |
|
|
|
Dated: February 8, 2024 |
|
By: |
|
/s/ Kevin B. Habicht |
|
|
|
|
Kevin B. Habicht |
|
|
|
|
Executive Vice President and Chief Financial Officer |
Exhibit 99.1

|
|
NEWS RELEASE |
|
For information contact: |
|
Kevin B. Habicht |
|
Chief Financial Officer |
|
(407) 265-7348 |
FOR IMMEDIATE RELEASE |
|
February 8, 2024 |
2023 ANNUAL RESULTS AND 2024 GUIDANCE
ANNOUNCED BY NNN REIT, INC.
Orlando, Florida, February 8, 2024 – NNN REIT, Inc. (NYSE: NNN), a real estate investment trust, today announced operating results for the quarter and year ended December 31, 2023. Highlights include:
Operating Results:
•Revenues and net earnings, FFO, Core FFO and AFFO available to common stockholders and diluted per share amounts:
|
|
|
|
|
|
|
|
|
|
|
|
|
|
|
|
|
|
|
Quarter Ended |
|
|
Year Ended |
|
|
|
December 31, |
|
|
December 31, |
|
|
|
2023 |
|
|
2022 |
|
|
2023 |
|
|
2022 |
|
|
|
(in thousands, except per share data) |
|
Revenues |
|
$ |
216,231 |
|
|
$ |
198,520 |
|
|
$ |
828,111 |
|
|
$ |
773,053 |
|
|
|
|
|
|
|
|
|
|
|
|
|
|
Net earnings available to common stockholders |
|
$ |
96,682 |
|
|
$ |
90,662 |
|
|
$ |
392,340 |
|
|
$ |
334,626 |
|
Net earnings per common share |
|
$ |
0.53 |
|
(1) |
$ |
0.50 |
|
|
$ |
2.16 |
|
(1) |
$ |
1.89 |
|
|
|
|
|
|
|
|
|
|
|
|
|
|
FFO available to common stockholders |
|
$ |
151,712 |
|
|
$ |
142,178 |
|
|
$ |
589,074 |
|
|
$ |
548,884 |
|
FFO per common share |
|
$ |
0.83 |
|
(1) |
$ |
0.79 |
|
|
$ |
3.24 |
|
(1) |
$ |
3.10 |
|
|
|
|
|
|
|
|
|
|
|
|
|
|
Core FFO available to common stockholders |
|
$ |
154,281 |
|
|
$ |
142,893 |
|
|
$ |
592,528 |
|
|
$ |
556,404 |
|
Core FFO per common share |
|
$ |
0.85 |
|
(1) |
$ |
0.80 |
|
|
$ |
3.26 |
|
(1) |
$ |
3.14 |
|
|
|
|
|
|
|
|
|
|
|
|
|
|
AFFO available to common stockholders |
|
$ |
148,997 |
|
|
$ |
145,142 |
|
|
$ |
591,523 |
|
|
$ |
568,952 |
|
AFFO per common share |
|
$ |
0.82 |
|
|
$ |
0.81 |
|
|
$ |
3.26 |
|
|
$ |
3.21 |
|
|
|
(1) |
During the quarter ended December 31, 2023, one tenant was reclassified to accrual basis for accounting purposes due to their improved qualitative and/or quantitative credit factors, which resulted in an increase of accrued rent in the amount of $5,573. Excluding such, net earnings per common share would have been $0.50 and $2.13, FFO per common share would have been $0.80 and $3.21 and Core FFO would have been $0.82 and $3.23 for the quarter and year ended December 31, 2023, respectively. |
2023 Highlights:
•Net earnings per common share increased 14.3% over prior year results
•FFO per common share increased 4.5% over prior year results
•Core FFO per common share increased 3.8% over prior year results
•AFFO per common share increased 1.6% over prior year results
1
2023 Highlights (continued):
•Dividend yield of 5.2% at December 31, 2023
•Annual dividend per common share increased to $2.23 marking the 34th consecutive year of annual dividend increases - the third longest record of consecutive annual dividend increases of all public REITs
•Maintained high occupancy levels at 99.5%, with a weighted average remaining lease term of 10.1 years, at December 31, 2023 as compared to 99.2% at September 30, 2023, and 99.4% at December 31, 2022
•$819.7 million in property investments, including the acquisition of 165 properties with aggregate gross leasable area of approximately 1,281,000 square feet at an initial cash cap rate of 7.3%, with a weighted average remaining lease term of 18.8 years
•Sold 45 properties for $115.7 million, producing $47.5 million of gains on sales, at a cap rate of 5.9%
•Raised $31.4 million in net proceeds from issuance of 726,364 common shares
•Issued $500 million principal amount of 5.600% senior unsecured notes due 2033
•Maintained sector leading 12.0 year weighted average debt maturity
•Total average annual shareholder returns (11.0% for the past 30 years) exceed industry equity averages for the past 2-, 3-, 10-, 15-, 20-, 25- and 30-years
Fourth Quarter 2023 Highlights:
•$269.7 million in property investments, including the acquisition of 40 properties with an aggregate gross leasable area of approximately 278,000 square feet at an initial cash cap rate of 7.6%, with a weighted average remaining lease term of 19.6 years
•Sold 19 properties for $26.6 million, producing $7.3 million of gains on sales, at a cap rate of 6.5%
The company announced 2024 Core FFO guidance of $3.25 to $3.31 per share. The 2024 AFFO is estimated to be $3.29 to $3.35 per share. The Core FFO guidance equates to net earnings of $1.94 to $2.00 per share, plus $1.31 per share of expected real estate depreciation and amortization and excludes any gains from the sale of real estate, charges for impairments and executive retirement costs. The guidance is based on current plans and assumptions and subject to risks and uncertainties more fully described in this press release and the company's reports filed with the Securities and Exchange Commission.
Steve Horn, Chief Executive Officer, commented: "NNN continues to execute with excellence. In 2023, we grew Core FFO 3.8 percent, deployed over $800 million of capital in new real estate investments and successfully executed the NNN REIT name change and branding campaign. We ended the year with $132.0 million drawn on our $1.1 billion credit facility, accentuating our ability to raise capital and generate strong free cash flow and proceeds from selective asset dispositions, even in a challenging capital market environment. NNN maintains a multi-year view and is well-positioned to execute the 2024 strategy."
NNN REIT invests primarily in high-quality retail properties subject generally to long-term, net leases. As of December 31, 2023, the company owned 3,532 properties in 49 states with a gross leasable area of approximately 36.0 million square feet and a weighted average remaining lease term of 10.1 years. NNN is one of only three publicly traded REITs to have increased annual dividends for 34 or more consecutive years. For more information on the company, visit www.nnnreit.com.
Management will hold a conference call on February 8, 2024, at 10:30 a.m. ET to review these results. The call can be accessed on the NNN REIT website live at http://www.nnnreit.com. For those unable to listen to the live broadcast, a replay will be available on the company’s website. In addition, a summary of any earnings guidance given on the call will be posted to the company’s web site.
Statements in this press release that are not strictly historical are “forward-looking” statements. These statements generally are characterized by the use of terms such as "believe," "expect," "intend," "may," "estimated," or other similar words or expressions. Forward-looking statements involve known and unknown risks, which may cause the company’s actual future results to differ materially from expected results. These risks include, among others, general economic conditions, including inflation, local real estate conditions, changes in interest rates, increases in operating costs, the preferences and financial condition of the company's tenants, the availability of capital, risks related to the company's status as a REIT and the potential impacts of an epidemic or pandemic on the company's business operations, financial results and financial position on the world economy. Additional information concerning these and other factors that could cause actual results to differ materially from these forward-looking statements is contained from time to time in the company’s Securities and Exchange Commission (the “Commission”) filings, including, but not limited to, the company’s Annual Report on Form 10-K. Copies of each filing may be obtained from the company or the Commission. Such forward-looking statements should be regarded solely as reflections of
2
the company’s current operating plans and estimates. Actual operating results may differ materially from what is expressed or forecast in this press release. NNN REIT, Inc. undertakes no obligation to publicly release the results of any revisions to these forward-looking statements that may be made to reflect events or circumstances after the date these statements were made.
Funds From Operations, commonly referred to as "FFO", is a relative non-GAAP financial measure of operating performance of an equity REIT in order to recognize that income-producing real estate historically has not depreciated on the basis determined under GAAP. FFO is defined by the National Association of Real Estate Investment Trusts (“NAREIT”) and is used by the company as follows: net earnings (computed in accordance with GAAP) plus depreciation and amortization of assets unique to the real estate industry, excluding gains (or including losses), any applicable taxes and noncontrolling interests on the disposition of certain assets, the company’s share of these items from the company’s noncontrolling interests and any impairment charges on a depreciable real estate asset.
FFO is generally considered by industry analysts to be the most appropriate measure of performance of real estate companies. FFO does not necessarily represent cash provided by operating activities in accordance with GAAP and should not be considered an alternative to net earnings as an indication of the company’s performance or to cash flow as a measure of liquidity or ability to make distributions. Management considers FFO an appropriate measure of performance of an equity REIT because it primarily excludes the assumption that the value of the real estate assets diminishes predictably over time, and because industry analysts have accepted it as a performance measure. The company’s computation of FFO may differ from the methodology for calculating FFO used by other equity REITs, and therefore, may not be comparable to such other REITs. A reconciliation of net earnings (computed in accordance with GAAP) to FFO, as defined by NAREIT, is included in the financial information accompanying this release.
Core Funds From Operations (“Core FFO”) is a non-GAAP measure of operating performance that adjusts FFO to eliminate the impact of certain GAAP income and expense amounts that the company believes are infrequent and unusual in nature and/or not related to its core real estate operations. Exclusion of these items from similar FFO-type metrics is common within the REIT industry, and management believes that presentation of Core FFO provides investors with a potential metric to assist in their evaluation of the company’s operating performance across multiple periods and in comparison to the operating performance of its peers because it removes the effect of unusual items that are not expected to impact the company’s operating performance on an ongoing basis. Core FFO is used by management in evaluating the performance of the company’s core business operations and is a factor in determining management compensation. Items included in calculating FFO that may be excluded in calculating Core FFO may include items such as transaction related gains, income or expense, impairments on land or commercial mortgage residual interests, executive retirement costs, or other non-core amounts as they occur. The company’s computation of Core FFO may differ from the methodology for calculating Core FFO used by other equity REITs, and therefore, may not be comparable to such other REITs. A reconciliation of net earnings (computed in accordance with GAAP) to Core FFO is included in the financial information accompanying this release.
Adjusted Funds From Operations (“AFFO”) is a non-GAAP financial measure of operating performance used by many companies in the REIT industry. AFFO adjusts FFO for certain non-cash items that reduce or increase net income in accordance with GAAP. AFFO should not be considered an alternative to net earnings, as an indication of the company's performance or to cash flow as a measure of liquidity or ability to make distributions. Management considers AFFO a useful supplemental measure of the company’s performance. The company’s computation of AFFO may differ from the methodology for calculating AFFO used by other equity REITs, and therefore, may not be comparable to such other REITs. A reconciliation of net earnings (computed in accordance with GAAP) to AFFO is included in the financial information accompanying this release.
Earnings Before Interest, Taxes, Depreciation and Amortization for Real Estate as defined by NAREIT (“EBITDA”) is a metric established by NAREIT and commonly used by real estate companies. The measure is a result of net earnings (computed in accordance with GAAP), plus interest expense, income tax expense, depreciation and amortization, excluding any gains (or including any losses) on disposition of real estate, any impairment charges and after adjustments for income and losses attributable to noncontrolling interests. Management considers the non-GAAP measure of EBITDA to be an appropriate measure of the company's performance and should be considered in addition to, net earnings or loss, as a measure of the company's operating performance. The company’s computation of EBITDA may differ from the methodology for calculating EBITDA used by other equity REITs, and therefore, may not be comparable to such other REITs. A reconciliation of net earnings (computed in accordance with GAAP) to EBITDA, as defined by NAREIT, is included in the company’s Annual Supplemental Data accompanying this release.
3
NNN REIT, Inc.
Income Statement Summary
(dollars in thousands, except per share data)
(unaudited)
|
|
|
|
|
|
|
|
|
|
|
|
|
|
|
|
|
|
|
Quarter Ended |
|
|
Year Ended |
|
|
|
December 31, |
|
|
December 31, |
|
|
|
2023 |
|
|
2022 |
|
|
2023 |
|
|
2022 |
|
Revenues: |
|
|
|
|
|
|
|
|
|
|
|
|
Rental income |
|
$ |
215,178 |
|
|
$ |
198,217 |
|
|
$ |
826,090 |
|
|
$ |
771,618 |
|
Interest and other income from real estate transactions |
|
|
1,053 |
|
|
|
303 |
|
|
|
2,021 |
|
|
|
1,435 |
|
|
|
|
216,231 |
|
|
|
198,520 |
|
|
|
828,111 |
|
|
|
773,053 |
|
Operating expenses: |
|
|
|
|
|
|
|
|
|
|
|
|
General and administrative |
|
|
10,530 |
|
|
|
10,788 |
|
|
|
43,746 |
|
|
|
41,695 |
|
Real estate |
|
|
8,237 |
|
|
|
7,035 |
|
|
|
28,378 |
|
|
|
26,281 |
|
Depreciation and amortization |
|
|
60,079 |
|
|
|
57,322 |
|
|
|
238,625 |
|
|
|
223,834 |
|
Leasing transaction costs |
|
|
76 |
|
|
|
61 |
|
|
|
299 |
|
|
|
320 |
|
Impairment losses – real estate, net of recoveries |
|
|
2,315 |
|
|
|
1,088 |
|
|
|
5,990 |
|
|
|
8,309 |
|
Executive retirement costs |
|
|
2,569 |
|
|
|
715 |
|
|
|
3,454 |
|
|
|
7,520 |
|
|
|
|
83,806 |
|
|
|
77,009 |
|
|
|
320,492 |
|
|
|
307,959 |
|
Gain on disposition of real estate |
|
|
7,263 |
|
|
|
6,787 |
|
|
|
47,485 |
|
|
|
17,443 |
|
Earnings from operations |
|
|
139,688 |
|
|
|
128,298 |
|
|
|
555,104 |
|
|
|
482,537 |
|
|
|
|
|
|
|
|
|
|
|
|
|
|
Other expenses (revenues): |
|
|
|
|
|
|
|
|
|
|
|
|
Interest and other income |
|
|
(383 |
) |
|
|
(29 |
) |
|
|
(1,134 |
) |
|
|
(149 |
) |
Interest expense |
|
|
43,389 |
|
|
|
37,665 |
|
|
|
163,898 |
|
|
|
148,065 |
|
|
|
|
43,006 |
|
|
|
37,636 |
|
|
|
162,764 |
|
|
|
147,916 |
|
|
|
|
|
|
|
|
|
|
|
|
|
|
Net earnings |
|
|
96,682 |
|
|
|
90,662 |
|
|
|
392,340 |
|
|
|
334,621 |
|
Loss attributable to noncontrolling interests |
|
|
— |
|
|
|
— |
|
|
|
— |
|
|
|
5 |
|
Net earnings available to common stockholders |
|
$ |
96,682 |
|
|
$ |
90,662 |
|
|
$ |
392,340 |
|
|
$ |
334,626 |
|
|
|
|
|
|
|
|
|
|
|
|
|
|
Weighted average common shares outstanding: |
|
|
|
|
|
|
|
|
|
|
|
|
Basic |
|
|
181,425,202 |
|
|
|
178,779,100 |
|
|
|
181,200,040 |
|
|
|
176,403,656 |
|
Diluted |
|
|
181,932,133 |
|
|
|
179,472,118 |
|
|
|
181,689,723 |
|
|
|
177,067,865 |
|
|
|
|
|
|
|
|
|
|
|
|
|
|
Net earnings per share available to common stockholders: |
|
|
|
|
|
|
|
|
|
|
|
|
Basic |
|
$ |
0.53 |
|
|
$ |
0.51 |
|
|
$ |
2.16 |
|
|
$ |
1.89 |
|
Diluted |
|
$ |
0.53 |
|
(1) |
$ |
0.50 |
|
|
$ |
2.16 |
|
(1) |
$ |
1.89 |
|
|
|
(1) |
During the quarter ended December 31, 2023, one tenant was reclassified to accrual basis for accounting purposes due to their improved qualitative and/or quantitative credit factors, which resulted in an increase of accrued rent in the amount of $5,573. Excluding such, net earnings per common share would have been $0.50 and $2.13 for the quarter and year ended December 31, 2023, respectively. |
4
NNN REIT, Inc.
(dollars in thousands, except per share data)
(unaudited)
|
|
|
|
|
|
|
|
|
|
|
|
|
|
|
|
|
|
|
Quarter Ended |
|
|
Year Ended |
|
|
|
December 31, |
|
|
December 31, |
|
|
|
2023 |
|
|
2022 |
|
|
2023 |
|
|
2022 |
|
Funds From Operations ("FFO") Reconciliation: |
|
|
|
|
|
|
|
|
|
|
|
|
Net earnings available to common stockholders |
|
$ |
96,682 |
|
|
$ |
90,662 |
|
|
$ |
392,340 |
|
|
$ |
334,626 |
|
Real estate depreciation and amortization |
|
|
59,978 |
|
|
|
57,215 |
|
|
|
238,229 |
|
|
|
223,392 |
|
Gain on disposition of real estate |
|
|
(7,263 |
) |
|
|
(6,787 |
) |
|
|
(47,485 |
) |
|
|
(17,443 |
) |
Impairment losses – depreciable real estate, net of recoveries |
|
|
2,315 |
|
|
|
1,088 |
|
|
|
5,990 |
|
|
|
8,309 |
|
Total FFO adjustments |
|
|
55,030 |
|
|
|
51,516 |
|
|
|
196,734 |
|
|
|
214,258 |
|
FFO available to common stockholders |
|
$ |
151,712 |
|
|
$ |
142,178 |
|
|
$ |
589,074 |
|
|
$ |
548,884 |
|
|
|
|
|
|
|
|
|
|
|
|
|
|
FFO per common share: |
|
|
|
|
|
|
|
|
|
|
|
|
Basic |
|
$ |
0.84 |
|
|
$ |
0.80 |
|
|
$ |
3.25 |
|
|
$ |
3.11 |
|
Diluted |
|
$ |
0.83 |
|
(1) |
$ |
0.79 |
|
|
$ |
3.24 |
|
(1) |
$ |
3.10 |
|
|
|
|
|
|
|
|
|
|
|
|
|
|
Core Funds From Operations ("Core FFO") Reconciliation: |
|
|
|
|
|
|
|
|
|
|
|
|
Net earnings available to common stockholders |
|
$ |
96,682 |
|
|
$ |
90,662 |
|
|
$ |
392,340 |
|
|
$ |
334,626 |
|
Total FFO adjustments |
|
|
55,030 |
|
|
|
51,516 |
|
|
|
196,734 |
|
|
|
214,258 |
|
FFO available to common stockholders |
|
|
151,712 |
|
|
|
142,178 |
|
|
|
589,074 |
|
|
|
548,884 |
|
|
|
|
|
|
|
|
|
|
|
|
|
|
Executive retirement costs |
|
|
2,569 |
|
|
|
715 |
|
|
|
3,454 |
|
|
|
7,520 |
|
Total Core FFO adjustments |
|
|
2,569 |
|
|
|
715 |
|
|
|
3,454 |
|
|
|
7,520 |
|
Core FFO available to common stockholders |
|
$ |
154,281 |
|
|
$ |
142,893 |
|
|
$ |
592,528 |
|
|
$ |
556,404 |
|
|
|
|
|
|
|
|
|
|
|
|
|
|
Core FFO per common share: |
|
|
|
|
|
|
|
|
|
|
|
|
Basic |
|
$ |
0.85 |
|
|
$ |
0.80 |
|
|
$ |
3.27 |
|
|
$ |
3.15 |
|
Diluted |
|
$ |
0.85 |
|
(1) |
$ |
0.80 |
|
|
$ |
3.26 |
|
(1) |
$ |
3.14 |
|
|
|
(1) |
During the quarter ended December 31, 2023, one tenant was reclassified to accrual basis for accounting purposes due to their improved qualitative and/or quantitative credit factors, which resulted in an increase of accrued rent in the amount of $5,573. Excluding such, FFO per common share would have been $0.80 and $3.21 and Core FFO would have been $0.82 and $3.23 for the quarter and year ended December 31, 2023, respectively. |
5
NNN REIT, Inc.
(dollars in thousands, except per share data)
(unaudited)
|
|
|
|
|
|
|
|
|
|
|
|
|
|
|
|
|
|
|
Quarter Ended |
|
|
Year Ended |
|
|
|
December 31, |
|
|
December 31, |
|
|
|
2023 |
|
|
2022 |
|
|
2023 |
|
|
2022 |
|
Adjusted Funds From Operations ("AFFO") Reconciliation: |
|
|
|
|
|
|
|
|
|
|
|
|
Net earnings available to common stockholders |
|
$ |
96,682 |
|
|
$ |
90,662 |
|
|
$ |
392,340 |
|
|
$ |
334,626 |
|
Total FFO adjustments |
|
|
55,030 |
|
|
|
51,516 |
|
|
|
196,734 |
|
|
|
214,258 |
|
Total Core FFO adjustments |
|
|
2,569 |
|
|
|
715 |
|
|
|
3,454 |
|
|
|
7,520 |
|
Core FFO available to common stockholders |
|
|
154,281 |
|
|
|
142,893 |
|
|
|
592,528 |
|
|
|
556,404 |
|
|
|
|
|
|
|
|
|
|
|
|
|
|
Straight-line accrued rent, net of reserves |
|
|
(5,957 |
) |
|
|
261 |
|
|
|
(7,453 |
) |
|
|
3,559 |
|
Net capital lease rent adjustment |
|
|
75 |
|
|
|
78 |
|
|
|
319 |
|
|
|
302 |
|
Below-market rent amortization |
|
|
(82 |
) |
|
|
(100 |
) |
|
|
(431 |
) |
|
|
(510 |
) |
Stock based compensation expense |
|
|
2,592 |
|
|
|
2,344 |
|
|
|
10,846 |
|
|
|
10,078 |
|
Capitalized interest expense |
|
|
(1,912 |
) |
|
|
(334 |
) |
|
|
(4,286 |
) |
|
|
(881 |
) |
Total AFFO adjustments |
|
|
(5,284 |
) |
|
|
2,249 |
|
|
|
(1,005 |
) |
|
|
12,548 |
|
AFFO available to common stockholders |
|
$ |
148,997 |
|
|
$ |
145,142 |
|
|
$ |
591,523 |
|
|
$ |
568,952 |
|
|
|
|
|
|
|
|
|
|
|
|
|
|
AFFO per common share: |
|
|
|
|
|
|
|
|
|
|
|
|
Basic |
|
$ |
0.82 |
|
|
$ |
0.81 |
|
|
$ |
3.26 |
|
|
$ |
3.23 |
|
Diluted |
|
$ |
0.82 |
|
|
$ |
0.81 |
|
|
$ |
3.26 |
|
|
$ |
3.21 |
|
|
|
|
|
|
|
|
|
|
|
|
|
|
Other Information: |
|
|
|
|
|
|
|
|
|
|
|
|
Rental income from operating leases(1) |
|
$ |
209,037 |
|
|
$ |
192,738 |
|
|
$ |
805,136 |
|
|
$ |
751,680 |
|
Earned income from direct financing leases(1) |
|
$ |
133 |
|
|
$ |
146 |
|
|
$ |
560 |
|
|
$ |
595 |
|
Percentage rent(1) |
|
$ |
241 |
|
|
$ |
310 |
|
|
$ |
1,631 |
|
|
$ |
1,541 |
|
|
|
|
|
|
|
|
|
|
|
|
|
|
Real estate expense reimbursement from tenants(1) |
|
$ |
5,767 |
|
|
$ |
5,023 |
|
|
$ |
18,763 |
|
|
$ |
17,802 |
|
Real estate expenses |
|
|
(8,237 |
) |
|
|
(7,035 |
) |
|
|
(28,378 |
) |
|
|
(26,281 |
) |
Real estate expenses, net of tenant reimbursements |
|
$ |
(2,470 |
) |
|
$ |
(2,012 |
) |
|
$ |
(9,615 |
) |
|
$ |
(8,479 |
) |
|
|
|
|
|
|
|
|
|
|
|
|
|
Amortization of debt costs |
|
$ |
1,295 |
|
|
$ |
1,200 |
|
|
$ |
4,943 |
|
|
$ |
4,734 |
|
Scheduled debt principal amortization (excluding
maturities) |
|
$ |
— |
|
(2) |
$ |
170 |
|
|
$ |
173 |
|
(2) |
$ |
664 |
|
Non-real estate depreciation expense |
|
$ |
105 |
|
|
$ |
109 |
|
|
$ |
409 |
|
|
$ |
454 |
|
|
|
(1) |
For the quarters ended December 31, 2023 and 2022, the aggregate of such amounts is $215,178 and $198,217, respectively, and $826,090 and $771,618, for the year ended December 31, 2023 and 2022, respectively, and is classified as rental income on the income statement summary. |
(2) |
In April 2023, NNN repaid the remaining mortgages payable principal balance of $9,774. |
6
NNN REIT, Inc.
2024 Earnings Guidance:
Guidance is based on current plans and assumptions and subject to risks and uncertainties more fully described in this press release and the company's reports filed with the Commission.
|
|
|
|
|
2024 Guidance |
Net earnings per common share excluding any gains on disposition
of real estate, impairment charges, and executive retirement costs |
|
$1.94 - $2.00 per share |
Real estate depreciation and amortization per share |
|
$1.31 per share |
Core FFO per share |
|
$3.25 - $3.31 per share |
AFFO per share |
|
$3.29 - $3.35 per share |
General and administrative expenses |
|
$46 - $48 Million |
Real estate expenses, net of tenant reimbursements |
|
$9 - $11 Million |
Acquisition volume |
|
$400 - $500 Million |
Disposition volume |
|
$80 - $120 Million |
7
NNN REIT, Inc.
Balance Sheet Summary
(dollars in thousands)
(unaudited)
|
|
|
|
|
|
|
|
|
|
|
December 31,
2023 |
|
|
December 31,
2022 |
|
Assets: |
|
|
|
|
|
|
Real estate portfolio, net of accumulated depreciation and amortization |
|
$ |
8,535,851 |
|
|
$ |
8,020,814 |
|
Cash and cash equivalents |
|
|
1,189 |
|
|
|
2,505 |
|
Restricted cash and cash held in escrow |
|
|
3,966 |
|
|
|
4,273 |
|
Receivables, net of allowance of $669 and $708, respectively |
|
|
3,649 |
|
|
|
3,612 |
|
Accrued rental income, net of allowance of $4,168 and $3,836, respectively |
|
|
34,611 |
|
|
|
27,795 |
|
Debt costs, net of accumulated amortization of $23,952 and $21,663, respectively |
|
|
3,243 |
|
|
|
5,352 |
|
Other assets |
|
|
79,459 |
|
|
|
81,694 |
|
Total assets |
|
$ |
8,661,968 |
|
|
$ |
8,146,045 |
|
|
|
|
|
|
|
|
Liabilities: |
|
|
|
|
|
|
Line of credit payable |
|
$ |
132,000 |
|
|
$ |
166,200 |
|
Mortgages payable, including unamortized premium and net of unamortized debt costs |
|
|
— |
|
|
|
9,964 |
|
Notes payable, net of unamortized discount and unamortized debt costs |
|
|
4,228,544 |
|
|
|
3,739,890 |
|
Accrued interest payable |
|
|
34,374 |
|
|
|
23,826 |
|
Other liabilities |
|
|
109,593 |
|
|
|
82,663 |
|
Total liabilities |
|
|
4,504,511 |
|
|
|
4,022,543 |
|
|
|
|
|
|
|
|
Stockholders' equity of NNN |
|
|
4,157,457 |
|
|
|
4,123,502 |
|
|
|
|
|
|
|
|
Total liabilities and equity |
|
$ |
8,661,968 |
|
|
$ |
8,146,045 |
|
|
|
|
|
|
|
|
Common shares outstanding |
|
|
182,474,770 |
|
|
|
181,424,670 |
|
|
|
|
|
|
|
|
Gross leasable area, Property Portfolio (square feet) |
|
|
35,966,000 |
|
|
|
35,010,000 |
|
8
NNN REIT, Inc.
Debt Summary
As of December 31, 2023
(dollars in thousands)
(unaudited)
|
|
|
|
|
|
|
|
|
|
|
|
|
|
|
|
|
|
|
Unsecured Debt |
|
Principal |
|
|
Principal,
Net of
Unamortized
Discount |
|
|
Stated
Rate |
|
|
Effective
Rate |
|
|
Maturity
Date |
Line of credit payable |
|
$ |
132,000 |
|
|
$ |
132,000 |
|
|
SOFR + 87.5bps |
|
|
|
6.185 |
% |
|
June 2025 |
|
|
|
|
|
|
|
|
|
|
|
|
|
|
|
Unsecured notes payable: |
|
|
|
|
|
|
|
|
|
|
|
|
|
|
2024 |
|
|
350,000 |
|
|
|
349,961 |
|
|
|
3.900 |
% |
|
|
3.924 |
% |
|
June 2024 |
2025 |
|
|
400,000 |
|
|
|
399,790 |
|
|
|
4.000 |
% |
|
|
4.029 |
% |
|
November 2025 |
2026 |
|
|
350,000 |
|
|
|
348,707 |
|
|
|
3.600 |
% |
|
|
3.733 |
% |
|
December 2026 |
2027 |
|
|
400,000 |
|
|
|
399,320 |
|
|
|
3.500 |
% |
|
|
3.548 |
% |
|
October 2027 |
2028 |
|
|
400,000 |
|
|
|
398,487 |
|
|
|
4.300 |
% |
|
|
4.388 |
% |
|
October 2028 |
2030 |
|
|
400,000 |
|
|
|
399,161 |
|
|
|
2.500 |
% |
|
|
2.536 |
% |
|
April 2030 |
2033 |
|
|
500,000 |
|
|
|
488,699 |
|
|
|
5.600 |
% |
|
|
5.905 |
% |
|
October 2033 |
2048 |
|
|
300,000 |
|
|
|
296,136 |
|
|
|
4.800 |
% |
|
|
4.890 |
% |
|
October 2048 |
2050 |
|
|
300,000 |
|
|
|
294,423 |
|
|
|
3.100 |
% |
|
|
3.205 |
% |
|
April 2050 |
2051 |
|
|
450,000 |
|
|
|
442,053 |
|
|
|
3.500 |
% |
|
|
3.602 |
% |
|
April 2051 |
2052 |
|
|
450,000 |
|
|
|
440,059 |
|
|
|
3.000 |
% |
|
|
3.118 |
% |
|
April 2052 |
Total |
|
|
4,300,000 |
|
|
|
4,256,796 |
|
|
|
|
|
|
|
|
|
|
|
|
|
|
|
|
|
|
|
|
|
|
|
|
Total unsecured debt(1) |
|
$ |
4,432,000 |
|
|
$ |
4,388,796 |
|
|
|
|
|
|
|
|
|
|
|
|
|
|
|
|
|
|
|
|
|
|
|
|
Debt costs |
|
|
|
|
$ |
(42,595 |
) |
|
|
|
|
|
|
|
|
Accumulated amortization |
|
|
|
14,343 |
|
|
|
|
|
|
|
|
|
Debt costs, net of accumulated amortization |
|
|
|
(28,252 |
) |
|
|
|
|
|
|
|
|
Notes payable, net of unamortized discount and
unamortized debt costs |
|
|
$ |
4,228,544 |
|
|
|
|
|
|
|
|
|
|
|
(1) |
Unsecured debt has a weighted average interest rate of 4.0% and a weighted average maturity of 12.0 years. |
As of December 31, 2023, Net Debt / EBITDA based on current quarter EBITDA annualized is 5.5x.
9
NNN REIT, Inc.
Debt Summary - Continued
As of December 31, 2023
(unaudited)
Credit Facility and Note Covenants
The following is a summary of key financial covenants for the company's unsecured credit facility and notes, as defined and calculated per the terms of the facility's credit agreement and the notes' governing documents, respectively, which are included in the company's filings with the Commission. These calculations, which are not based on U.S. GAAP measurements, are presented to investors to show that as of December 31, 2023, the company believes it is in compliance with the covenants.
|
|
|
|
|
Key Covenants |
|
Required |
|
December 31, 2023 |
Unsecured Bank Credit Facility: |
|
|
|
|
Maximum leverage ratio |
|
< 0.60 |
|
0.38 |
Minimum fixed charge coverage ratio |
|
> 1.50 |
|
4.52 |
Maximum secured indebtedness ratio |
|
< 0.40 |
|
— |
Unencumbered asset value ratio |
|
> 1.67 |
|
2.62 |
Unencumbered interest ratio |
|
> 1.75 |
|
4.51 |
Unsecured Notes: |
|
|
|
|
Limitation on incurrence of total debt |
|
≤ 60% |
|
41.5% |
Limitation on incurrence of secured debt |
|
≤ 40% |
|
— |
Debt service coverage ratio |
|
≥ 1.50 |
|
4.5 |
Maintenance of total unencumbered assets |
|
≥ 150% |
|
241% |
10
NNN REIT, Inc.
Property Portfolio
Top 20 Lines of Trade
|
|
|
|
|
|
|
|
|
|
|
As of December 31, |
|
|
Lines of Trade |
|
2023(1) |
|
2022(2) |
1. |
|
Convenience stores |
|
16.4% |
|
16.5% |
2. |
|
Automotive service |
|
15.6% |
|
13.7% |
3. |
|
Restaurants – full service |
|
8.7% |
|
9.1% |
4. |
|
Restaurants – limited service |
|
8.5% |
|
8.9% |
5. |
|
Family entertainment centers |
|
6.4% |
|
5.9% |
6. |
|
Recreational vehicle dealers, parts and accessories |
|
4.6% |
|
4.1% |
7. |
|
Health and fitness |
|
4.5% |
|
4.9% |
8. |
|
Theaters |
|
4.1% |
|
4.3% |
9. |
|
Equipment rental |
|
3.0% |
|
3.1% |
10. |
|
Wholesale clubs |
|
2.5% |
|
2.6% |
11. |
|
Automotive parts |
|
2.5% |
|
2.6% |
12. |
|
Drug stores |
|
2.4% |
|
2.6% |
13. |
|
Home improvement |
|
2.2% |
|
2.3% |
14. |
|
Furniture |
|
2.0% |
|
2.3% |
15. |
|
Medical service providers |
|
1.7% |
|
1.9% |
16. |
|
General merchandise |
|
1.4% |
|
1.6% |
17. |
|
Consumer electronics |
|
1.4% |
|
1.4% |
18. |
|
Home furnishings |
|
1.3% |
|
1.4% |
19. |
|
Travel plazas |
|
1.3% |
|
1.4% |
20. |
|
Automobile auctions, wholesale |
|
1.1% |
|
1.3% |
|
|
Other |
|
8.4% |
|
8.1% |
|
|
Total |
|
100.0% |
|
100.0% |
Top 10 States
|
|
|
|
|
|
|
|
|
|
|
|
|
State |
|
% of Total(1) |
|
|
|
State |
|
% of Total(1) |
1. |
|
Texas |
|
16.8% |
|
6. |
|
North Carolina |
|
3.9% |
2. |
|
Florida |
|
9.4% |
|
7. |
|
Tennessee |
|
3.8% |
3. |
|
Illinois |
|
5.2% |
|
8. |
|
Indiana |
|
3.7% |
4. |
|
Ohio |
|
4.9% |
|
9. |
|
California |
|
3.3% |
5. |
|
Georgia |
|
4.7% |
|
10. |
|
Virginia |
|
3.3% |
As a percentage of annual base rent, which is the annualized base rent for all leases in place.
|
|
|
|
(1) |
$818,749,000 as of December 31, 2023. |
|
(2) |
$771,984,000 as of December 31, 2022. |
|
|
11
NNN REIT, Inc.
Property Portfolio - Continued
Top 20 Tenants
|
|
|
|
|
|
|
|
|
Tenant |
|
# of
Properties |
|
% of
Total(1) |
1. |
|
7-Eleven |
|
138 |
|
4.4% |
2. |
|
Mister Car Wash |
|
121 |
|
4.2% |
3. |
|
Camping World |
|
47 |
|
3.8% |
4. |
|
Dave & Buster's |
|
32 |
|
3.5% |
5. |
|
LA Fitness |
|
29 |
|
3.1% |
6. |
|
GPM Investments (convenience stores) |
|
150 |
|
3.0% |
7. |
|
Flynn Restaurant Group (Taco Bell/Arby's) |
|
204 |
|
2.8% |
8. |
|
AMC Theatres |
|
20 |
|
2.7% |
9. |
|
BJ's Wholesale Club |
|
13 |
|
2.5% |
10. |
|
Mavis Tire Express Services |
|
140 |
|
2.3% |
11. |
|
Couche Tard (Pantry) |
|
92 |
|
2.2% |
12. |
|
Sunoco |
|
61 |
|
2.1% |
13. |
|
Walgreens |
|
49 |
|
1.9% |
14. |
|
Chuck E. Cheese |
|
53 |
|
1.9% |
15. |
|
United Rentals |
|
50 |
|
1.7% |
16. |
|
Frisch's Restaurants |
|
68 |
|
1.6% |
17. |
|
Fikes (Convenience Stores) |
|
58 |
|
1.5% |
18. |
|
Life Time Fitness |
|
3 |
|
1.3% |
19. |
|
Bob Evans |
|
106 |
|
1.3% |
20. |
|
Best Buy |
|
16 |
|
1.3% |
Lease Expirations(2)
|
|
|
|
|
|
|
|
|
|
|
|
|
|
|
|
|
% of
Total(1) |
|
# of
Properties |
|
Gross Leasable
Area (3) |
|
|
|
% of
Total(1) |
|
# of
Properties |
|
Gross Leasable
Area (3) |
2024 |
|
1.7% |
|
54 |
|
803,000 |
|
2030 |
|
3.3% |
|
109 |
|
1,221,000 |
2025 |
|
5.1% |
|
185 |
|
1,941,000 |
|
2031 |
|
7.3% |
|
185 |
|
2,697,000 |
2026 |
|
4.8% |
|
212 |
|
2,127,000 |
|
2032 |
|
5.9% |
|
215 |
|
2,328,000 |
2027 |
|
8.2% |
|
235 |
|
3,591,000 |
|
2033 |
|
4.9% |
|
138 |
|
1,467,000 |
2028 |
|
5.7% |
|
229 |
|
2,172,000 |
|
Thereafter |
|
49.1% |
|
1,831 |
|
15,592,000 |
2029 |
|
4.0% |
|
119 |
|
1,744,000 |
|
|
|
|
|
|
|
|
|
|
(1) |
Based on the annual base rent of $818,749,000, which is the annualized base rent for all leases in place as of December 31, 2023. |
(2) |
As of December 31, 2023, the weighted average remaining lease term is 10.1 years. |
(3) |
Square feet. |
12
NNN REIT, Inc.
Rent Deferral Lease Amendments
The following table outlines the rent deferred and corresponding scheduled repayment of the COVID-19 rent deferral lease amendments executed as of December 31, 2023 (dollars in thousands):
|
|
|
|
|
|
|
|
|
|
|
|
|
|
|
|
|
|
|
|
|
|
|
|
|
|
|
|
|
|
|
|
|
|
|
|
|
|
|
|
|
|
Deferred |
|
|
|
Scheduled Repayment |
|
|
|
|
Accrual
Basis |
|
|
Cash
Basis |
|
|
Total |
|
|
% of
Total |
|
|
|
Accrual
Basis |
|
|
Cash
Basis |
|
|
Total |
|
|
% of
Total |
|
|
Cumulative
Total |
|
2020 |
|
|
$ |
33,594 |
|
|
$ |
18,129 |
|
|
$ |
51,723 |
|
|
|
91.6 |
% |
|
|
$ |
3,239 |
|
|
$ |
20 |
|
|
$ |
3,259 |
|
|
|
5.8 |
% |
|
|
5.8 |
% |
|
|
|
|
|
|
|
|
|
|
|
|
|
|
|
|
|
|
|
|
|
|
|
|
|
|
|
|
|
|
2021 |
|
|
|
990 |
|
|
|
3,732 |
|
|
|
4,722 |
|
|
|
8.4 |
% |
|
|
|
25,935 |
|
|
|
5,841 |
|
|
|
31,776 |
|
|
|
56.3 |
% |
|
|
62.1 |
% |
|
|
|
|
|
|
|
|
|
|
|
|
|
|
|
|
|
|
|
|
|
|
|
|
|
|
|
|
|
|
2022 |
Q1 |
|
|
— |
|
|
|
— |
|
|
|
— |
|
|
|
— |
|
|
|
|
1,780 |
|
|
|
2,277 |
|
|
|
4,057 |
|
|
|
7.2 |
% |
|
|
69.3 |
% |
|
Q2 |
|
|
— |
|
|
|
— |
|
|
|
— |
|
|
|
— |
|
|
|
|
1,729 |
|
|
|
2,276 |
|
|
|
4,005 |
|
|
|
7.1 |
% |
|
|
76.4 |
% |
|
Q3 |
|
|
— |
|
|
|
— |
|
|
|
— |
|
|
|
— |
|
|
|
|
1,201 |
|
|
|
2,257 |
|
|
|
3,458 |
|
|
|
6.1 |
% |
|
|
82.5 |
% |
|
Q4 |
|
|
— |
|
|
|
— |
|
|
|
— |
|
|
|
— |
|
|
|
|
681 |
|
|
|
2,277 |
|
|
|
2,958 |
|
|
|
5.3 |
% |
|
|
87.8 |
% |
|
|
|
|
— |
|
|
|
— |
|
|
|
— |
|
|
|
— |
|
|
|
|
5,391 |
|
|
|
9,087 |
|
|
|
14,478 |
|
|
|
25.7 |
% |
|
|
87.8 |
% |
|
|
|
|
|
|
|
|
|
|
|
|
|
|
|
|
|
|
|
|
|
|
|
|
|
|
|
|
|
|
2023 |
Q1 |
|
|
— |
|
|
|
— |
|
|
|
— |
|
|
|
— |
|
|
|
|
9 |
|
|
|
1,677 |
|
|
|
1,686 |
|
|
|
3.0 |
% |
|
|
90.8 |
% |
|
Q2 |
|
|
— |
|
|
|
— |
|
|
|
— |
|
|
|
— |
|
|
|
|
10 |
|
|
|
476 |
|
|
|
486 |
|
|
|
0.9 |
% |
|
|
91.7 |
% |
|
Q3 |
|
|
— |
|
|
|
— |
|
|
|
— |
|
|
|
— |
|
|
|
|
— |
|
|
|
476 |
|
|
|
476 |
|
|
|
0.8 |
% |
|
|
92.5 |
% |
|
Q4 |
|
|
— |
|
|
|
— |
|
|
|
— |
|
|
|
— |
|
|
|
|
— |
|
|
|
476 |
|
|
|
476 |
|
|
|
0.8 |
% |
|
|
93.3 |
% |
|
|
|
|
— |
|
|
|
— |
|
|
|
— |
|
|
|
— |
|
|
|
|
19 |
|
|
|
3,105 |
|
|
|
3,124 |
|
|
|
5.5 |
% |
|
|
93.3 |
% |
|
|
|
|
|
|
|
|
|
|
|
|
|
|
|
|
|
|
|
|
|
|
|
|
|
|
|
|
|
|
2024 |
Q1 |
|
|
— |
|
|
|
— |
|
|
|
— |
|
|
|
— |
|
|
|
|
— |
|
|
|
476 |
|
|
|
476 |
|
|
|
0.8 |
% |
|
|
94.1 |
% |
|
Q2 |
|
|
— |
|
|
|
— |
|
|
|
— |
|
|
|
— |
|
|
|
|
— |
|
|
|
476 |
|
|
|
476 |
|
|
|
0.8 |
% |
|
|
94.9 |
% |
|
Q3 |
|
|
— |
|
|
|
— |
|
|
|
— |
|
|
|
— |
|
|
|
|
— |
|
|
|
476 |
|
|
|
476 |
|
|
|
0.8 |
% |
|
|
95.7 |
% |
|
Q4 |
|
|
— |
|
|
|
— |
|
|
|
— |
|
|
|
— |
|
|
|
|
— |
|
|
|
476 |
|
|
|
476 |
|
|
|
0.9 |
% |
|
|
96.6 |
% |
|
|
|
|
— |
|
|
|
— |
|
|
|
— |
|
|
|
— |
|
|
|
|
— |
|
|
|
1,904 |
|
|
|
1,904 |
|
|
|
3.3 |
% |
|
|
96.6 |
% |
|
|
|
|
|
|
|
|
|
|
|
|
|
|
|
|
|
|
|
|
|
|
|
|
|
|
|
|
|
|
2025 |
|
|
|
— |
|
|
|
— |
|
|
|
— |
|
|
|
— |
|
|
|
|
— |
|
|
|
1,904 |
|
|
|
1,904 |
|
|
|
3.4 |
% |
|
|
100.0 |
% |
|
|
|
|
|
|
|
|
|
|
|
|
|
|
|
|
|
|
|
|
|
|
|
|
|
|
|
|
|
|
|
|
|
$ |
34,584 |
|
|
$ |
21,861 |
|
|
$ |
56,445 |
|
|
|
100.0 |
% |
|
|
$ |
34,584 |
|
|
$ |
21,861 |
|
|
$ |
56,445 |
|
|
|
100.0 |
% |
|
|
|
Adjusted Results
The following table outlines the adjusted effects of excluding the scheduled repayments of the COVID-19 rent deferral lease amendments executed as of December 31, 2023:
|
|
|
|
|
|
|
|
|
|
|
|
|
|
|
|
|
|
|
|
|
|
|
|
|
|
|
Quarter Ended December 31, |
|
|
Year Ended December 31, |
|
|
|
2023 |
|
|
2022 |
|
|
% Change |
|
|
2023 |
|
|
2022 |
|
|
% Change |
|
Core FFO per common share: |
|
|
|
|
|
|
|
|
|
|
|
|
|
|
|
|
|
|
As reported |
|
$ |
0.85 |
|
|
$ |
0.80 |
|
|
|
6.3 |
% |
|
$ |
3.26 |
|
|
$ |
3.14 |
|
|
|
3.8 |
% |
Adjusted(1) |
|
$ |
0.85 |
|
|
$ |
0.78 |
|
|
|
9.0 |
% |
|
$ |
3.24 |
|
|
$ |
3.09 |
|
|
|
4.9 |
% |
Adjusted(2) |
|
$ |
0.81 |
|
|
$ |
0.78 |
|
|
|
3.8 |
% |
|
$ |
3.21 |
|
|
$ |
3.09 |
|
|
|
3.9 |
% |
|
|
|
|
|
|
|
|
|
|
|
|
|
|
|
|
|
|
|
AFFO per common share: |
|
|
|
|
|
|
|
|
|
|
|
|
|
|
|
|
|
|
As reported |
|
$ |
0.82 |
|
|
$ |
0.81 |
|
|
|
1.2 |
% |
|
$ |
3.26 |
|
|
$ |
3.21 |
|
|
|
1.6 |
% |
Adjusted(3) |
|
$ |
0.82 |
|
|
$ |
0.79 |
|
|
|
3.8 |
% |
|
$ |
3.24 |
|
|
$ |
3.13 |
|
|
|
3.5 |
% |
|
|
(1) |
Excludes the cash basis rent repayments from the Rent Deferral Lease Amendments table above. |
(2) |
During the quarter ended December 31, 2023, one tenant was reclassified to accrual basis for accounting purposes due to their improved qualitative and/or quantitative credit factors, which resulted in an increase of accrued rent in the amount of $5,573. Adjusted figures exclude both the effects of the cash basis rent repayments from the Rent Deferral Lease Amendments table above and the accrued rent of $5,573. |
(3) |
Excludes the cash and accrual basis rent repayments from the Rent Deferral Lease Amendments table above. |
13
Exhibit 99.2

ANNUAL SUPPLEMENTAL DATA
As of December 31, 2023

TABLE OF CONTENTS
2
Statements in this annual supplemental data that are not strictly historical are “forward-looking” statements. These statements generally are characterized by the use of terms such as "believe," "expect," "intend," "may," "estimated," or other similar words or expressions. Forward-looking statements involve known and unknown risks, which may cause the company’s actual future results to differ materially from expected results. These risks include, among others, general economic conditions, including inflation, local real estate conditions, changes in interest rates, increases in operating costs, the preferences and financial condition of the company's tenants, the availability of capital, risks related to the company's status as a REIT and the potential impacts of an epidemic or pandemic on the company's business operations, financial results and financial position and on the world economy. Additional information concerning these and other factors that could cause actual results to differ materially from these forward-looking statements is contained from time to time in the company’s Securities and Exchange Commission (the “Commission”) filings, including, but not limited to, the company’s Annual Report on Form 10-K for the year ended December 31, 2023.
Copies of each filing may be obtained from the company or the Commission. Such forward-looking statements should be regarded solely as reflections of the company’s current operating plans and estimates. Actual operating results may differ materially from what is expressed or forecast in this press release. NNN REIT, Inc. undertakes no obligation to publicly release the results of any revisions to these forward-looking statements that may be made to reflect events or circumstances after the date these statements were made.
3
(dollars in thousands, except per share data)
(unaudited)
|
|
|
|
|
|
|
|
|
|
|
|
|
|
|
|
|
|
|
Quarter Ended |
|
|
Year Ended |
|
|
|
December 31, |
|
|
December 31, |
|
|
|
2023 |
|
|
2022 |
|
|
2023 |
|
|
2022 |
|
Revenues: |
|
|
|
|
|
|
|
|
|
|
|
|
Rental income |
|
$ |
215,178 |
|
|
$ |
198,217 |
|
|
$ |
826,090 |
|
|
$ |
771,618 |
|
Interest and other income from real estate transactions |
|
|
1,053 |
|
|
|
303 |
|
|
|
2,021 |
|
|
|
1,435 |
|
|
|
|
216,231 |
|
|
|
198,520 |
|
|
|
828,111 |
|
|
|
773,053 |
|
Operating expenses: |
|
|
|
|
|
|
|
|
|
|
|
|
General and administrative |
|
|
10,530 |
|
|
|
10,788 |
|
|
|
43,746 |
|
|
|
41,695 |
|
Real estate |
|
|
8,237 |
|
|
|
7,035 |
|
|
|
28,378 |
|
|
|
26,281 |
|
Depreciation and amortization |
|
|
60,079 |
|
|
|
57,322 |
|
|
|
238,625 |
|
|
|
223,834 |
|
Leasing transaction costs |
|
|
76 |
|
|
|
61 |
|
|
|
299 |
|
|
|
320 |
|
Impairment losses – real estate, net of recoveries |
|
|
2,315 |
|
|
|
1,088 |
|
|
|
5,990 |
|
|
|
8,309 |
|
Executive retirement costs |
|
|
2,569 |
|
|
|
715 |
|
|
|
3,454 |
|
|
|
7,520 |
|
|
|
|
83,806 |
|
|
|
77,009 |
|
|
|
320,492 |
|
|
|
307,959 |
|
Gain on disposition of real estate |
|
|
7,263 |
|
|
|
6,787 |
|
|
|
47,485 |
|
|
|
17,443 |
|
Earnings from operations |
|
|
139,688 |
|
|
|
128,298 |
|
|
|
555,104 |
|
|
|
482,537 |
|
Other expenses (revenues): |
|
|
|
|
|
|
|
|
|
|
|
|
Interest and other income |
|
|
(383 |
) |
|
|
(29 |
) |
|
|
(1,134 |
) |
|
|
(149 |
) |
Interest expense |
|
|
43,389 |
|
|
|
37,665 |
|
|
|
163,898 |
|
|
|
148,065 |
|
|
|
|
43,006 |
|
|
|
37,636 |
|
|
|
162,764 |
|
|
|
147,916 |
|
Net earnings |
|
|
96,682 |
|
|
|
90,662 |
|
|
|
392,340 |
|
|
|
334,621 |
|
Loss attributable to noncontrolling interests |
|
|
— |
|
|
|
— |
|
|
|
— |
|
|
|
5 |
|
Net earnings available to common stockholders |
|
$ |
96,682 |
|
|
$ |
90,662 |
|
|
$ |
392,340 |
|
|
$ |
334,626 |
|
|
|
|
|
|
|
|
|
|
|
|
|
|
Weighted average common shares outstanding: |
|
|
|
|
|
|
|
|
|
|
|
|
Basic |
|
|
181,425,202 |
|
|
|
178,779,100 |
|
|
|
181,200,040 |
|
|
|
176,403,656 |
|
Diluted |
|
|
181,932,133 |
|
|
|
179,472,118 |
|
|
|
181,689,723 |
|
|
|
177,067,865 |
|
|
|
|
|
|
|
|
|
|
|
|
|
|
Net earnings per share available to common stockholders: |
|
|
|
|
|
|
|
|
|
|
|
|
Basic |
|
$ |
0.53 |
|
|
$ |
0.51 |
|
|
$ |
2.16 |
|
|
$ |
1.89 |
|
Diluted |
|
$ |
0.53 |
|
(1) |
$ |
0.50 |
|
|
$ |
2.16 |
|
(1) |
$ |
1.89 |
|
|
|
(1) |
During the quarter ended December 31, 2023, one tenant was reclassified to accrual basis for accounting purposes due to their improved qualitative and/or quantitative credit factors, which resulted in an increase of accrued rent in the amount of $5,573. Excluding such, net earnings per common share would have been $0.50 and $2.13 for the quarter and year ended December 31, 2023, respectively. |
4
|
FUNDS FROM OPERATIONS ("FFO")(1) |
(dollars in thousands, except per share data)
(unaudited)
|
|
|
|
|
|
|
|
|
|
|
|
|
|
|
|
|
|
|
Quarter Ended |
|
|
Year Ended |
|
|
|
December 31, |
|
|
December 31, |
|
|
|
2023 |
|
|
2022 |
|
|
2023 |
|
|
2022 |
|
Net earnings available to common stockholders |
|
$ |
96,682 |
|
|
$ |
90,662 |
|
|
$ |
392,340 |
|
|
$ |
334,626 |
|
Real estate depreciation and amortization |
|
|
59,978 |
|
|
|
57,215 |
|
|
|
238,229 |
|
|
|
223,392 |
|
Gain on disposition of real estate |
|
|
(7,263 |
) |
|
|
(6,787 |
) |
|
|
(47,485 |
) |
|
|
(17,443 |
) |
Impairment losses – depreciable real estate, net of recoveries |
|
|
2,315 |
|
|
|
1,088 |
|
|
|
5,990 |
|
|
|
8,309 |
|
Total FFO adjustments |
|
|
55,030 |
|
|
|
51,516 |
|
|
|
196,734 |
|
|
|
214,258 |
|
FFO available to common stockholders |
|
$ |
151,712 |
|
|
$ |
142,178 |
|
|
$ |
589,074 |
|
|
$ |
548,884 |
|
|
|
|
|
|
|
|
|
|
|
|
|
|
FFO per common share: |
|
|
|
|
|
|
|
|
|
|
|
|
Basic |
|
$ |
0.84 |
|
|
$ |
0.80 |
|
|
$ |
3.25 |
|
|
$ |
3.11 |
|
Diluted |
|
$ |
0.83 |
|
(2) |
$ |
0.79 |
|
|
$ |
3.24 |
|
(2) |
$ |
3.10 |
|
|
|
(1) |
FFO is a non-GAAP financial measure. Please reference the Earnings Release for the quarter and year ended December 31, 2023 for the company's definition and explanation of how the company utilizes this metric. |
(2) |
During the quarter ended December 31, 2023, one tenant was reclassified to accrual basis for accounting purposes due to their improved qualitative and/or quantitative credit factors, which resulted in an increase of accrued rent in the amount of $5,573. Excluding such, FFO per common share would have been $0.80 and $3.21 for the quarter and year ended December 31, 2023, respectively. |
5
|
CORE FUNDS FROM OPERATIONS ("Core FFO")(1) |
(dollars in thousands, except per share data)
(unaudited)
|
|
|
|
|
|
|
|
|
|
|
|
|
|
|
|
|
|
|
Quarter Ended |
|
|
Year Ended |
|
|
|
December 31, |
|
|
December 31, |
|
|
|
2023 |
|
|
2022 |
|
|
2023 |
|
|
2022 |
|
Net earnings available to common stockholders |
|
$ |
96,682 |
|
|
$ |
90,662 |
|
|
$ |
392,340 |
|
|
$ |
334,626 |
|
Total FFO adjustments |
|
|
55,030 |
|
|
|
51,516 |
|
|
|
196,734 |
|
|
|
214,258 |
|
FFO available to common stockholders |
|
|
151,712 |
|
|
|
142,178 |
|
|
|
589,074 |
|
|
|
548,884 |
|
|
|
|
|
|
|
|
|
|
|
|
|
|
Executive retirement costs |
|
|
2,569 |
|
|
|
715 |
|
|
|
3,454 |
|
|
|
7,520 |
|
Total Core FFO adjustments |
|
|
2,569 |
|
|
|
715 |
|
|
|
3,454 |
|
|
|
7,520 |
|
Core FFO available to common stockholders |
|
$ |
154,281 |
|
|
$ |
142,893 |
|
|
$ |
592,528 |
|
|
$ |
556,404 |
|
|
|
|
|
|
|
|
|
|
|
|
|
|
Core FFO per common share: |
|
|
|
|
|
|
|
|
|
|
|
|
Basic |
|
$ |
0.85 |
|
|
$ |
0.80 |
|
|
$ |
3.27 |
|
|
$ |
3.15 |
|
Diluted |
|
$ |
0.85 |
|
(2) |
$ |
0.80 |
|
|
$ |
3.26 |
|
(2) |
$ |
3.14 |
|
|
|
(1) |
Core FFO is a non-GAAP financial measure. Please reference the Earnings Release for the quarter and year ended December 31, 2023 for the company's definition and explanation of how the company utilizes this metric. |
(2) |
During the quarter ended December 31, 2023, one tenant was reclassified to accrual basis for accounting purposes due to their improved qualitative and/or quantitative credit factors, which resulted in an increase of accrued rent in the amount of $5,573. Excluding such, Core FFO would have been $0.82 and $3.23 for the quarter and year ended December 31, 2023, respectively. |
6
|
ADJUSTED FUNDS FROM OPERATIONS ("AFFO")(1) |
(dollars in thousands, except per share data)
(unaudited)
|
|
|
|
|
|
|
|
|
|
|
|
|
|
|
|
|
|
|
Quarter Ended |
|
|
Year Ended |
|
|
|
December 31, |
|
|
December 31, |
|
|
|
2023 |
|
|
2022 |
|
|
2023 |
|
|
2022 |
|
Net earnings available to common stockholders |
|
$ |
96,682 |
|
|
$ |
90,662 |
|
|
$ |
392,340 |
|
|
$ |
334,626 |
|
Total FFO adjustments |
|
|
55,030 |
|
|
|
51,516 |
|
|
|
196,734 |
|
|
|
214,258 |
|
Total Core FFO adjustments |
|
|
2,569 |
|
|
|
715 |
|
|
|
3,454 |
|
|
|
7,520 |
|
Core FFO available to common stockholders |
|
|
154,281 |
|
|
|
142,893 |
|
|
|
592,528 |
|
|
|
556,404 |
|
|
|
|
|
|
|
|
|
|
|
|
|
|
Straight-line accrued rent, net of reserves |
|
|
(5,957 |
) |
|
|
261 |
|
|
|
(7,453 |
) |
|
|
3,559 |
|
Net capital lease rent adjustment |
|
|
75 |
|
|
|
78 |
|
|
|
319 |
|
|
|
302 |
|
Below-market rent amortization |
|
|
(82 |
) |
|
|
(100 |
) |
|
|
(431 |
) |
|
|
(510 |
) |
Stock based compensation expense |
|
|
2,592 |
|
|
|
2,344 |
|
|
|
10,846 |
|
|
|
10,078 |
|
Capitalized interest expense |
|
|
(1,912 |
) |
|
|
(334 |
) |
|
|
(4,286 |
) |
|
|
(881 |
) |
Total AFFO adjustments |
|
|
(5,284 |
) |
|
|
2,249 |
|
|
|
(1,005 |
) |
|
|
12,548 |
|
AFFO available to common stockholders |
|
$ |
148,997 |
|
|
$ |
145,142 |
|
|
$ |
591,523 |
|
|
$ |
568,952 |
|
|
|
|
|
|
|
|
|
|
|
|
|
|
AFFO per common share: |
|
|
|
|
|
|
|
|
|
|
|
|
Basic |
|
$ |
0.82 |
|
|
$ |
0.81 |
|
|
$ |
3.26 |
|
|
$ |
3.23 |
|
Diluted |
|
$ |
0.82 |
|
|
$ |
0.81 |
|
|
$ |
3.26 |
|
|
$ |
3.21 |
|
|
|
(1) |
AFFO is a non-GAAP financial measure. Please reference the Earnings Release for the quarter and year ended December 31, 2023 for the company's definition and explanation of how the company utilizes this metric. |
7
(dollars in thousands)
(unaudited)
|
|
|
|
|
|
|
|
|
|
|
|
|
|
|
|
|
|
|
Quarter Ended |
|
|
Year Ended |
|
|
|
December 31, |
|
|
December 31, |
|
|
|
2023 |
|
|
2022 |
|
|
2023 |
|
|
2022 |
|
Rental income from operating leases(1) |
|
$ |
209,037 |
|
|
$ |
192,738 |
|
|
$ |
805,136 |
|
|
$ |
751,680 |
|
Earned income from direct financing leases(1) |
|
$ |
133 |
|
|
$ |
146 |
|
|
$ |
560 |
|
|
$ |
595 |
|
Percentage rent(1) |
|
$ |
241 |
|
|
$ |
310 |
|
|
$ |
1,631 |
|
|
$ |
1,541 |
|
|
|
|
|
|
|
|
|
|
|
|
|
|
Real estate expense reimbursement from tenants(1) |
|
$ |
5,767 |
|
|
$ |
5,023 |
|
|
$ |
18,763 |
|
|
$ |
17,802 |
|
Real estate expenses |
|
|
(8,237 |
) |
|
|
(7,035 |
) |
|
|
(28,378 |
) |
|
|
(26,281 |
) |
Real estate expenses, net of tenant reimbursements |
|
$ |
(2,470 |
) |
|
$ |
(2,012 |
) |
|
$ |
(9,615 |
) |
|
$ |
(8,479 |
) |
|
|
|
|
|
|
|
|
|
|
|
|
|
Amortization of debt costs |
|
$ |
1,295 |
|
|
$ |
1,200 |
|
|
$ |
4,943 |
|
|
$ |
4,734 |
|
Scheduled debt principal amortization (excluding maturities) |
|
$ |
— |
|
(2) |
$ |
170 |
|
|
$ |
173 |
|
(2) |
$ |
664 |
|
Non-real estate depreciation expense |
|
$ |
105 |
|
|
$ |
109 |
|
|
$ |
409 |
|
|
$ |
454 |
|
|
|
(1) |
For the quarters ended December 31, 2023 and 2022, the aggregate of such amounts is $215,178 and $198,217, respectively, and $826,090 and $771,618, for the year ended December 31, 2023 and 2022, respectively, and is classified as rental income on the income statement summary. |
(2) |
In April 2023, NNN repaid the remaining mortgages payable principal balance of $9,774. |
|
EARNINGS BEFORE INTEREST, TAXES, DEPRECIATION AND AMORTIZATION FOR REAL ESTATE ("EBITDA")(1) |
(dollars in thousands)
(unaudited)
|
|
|
|
|
|
|
|
|
|
|
|
|
|
|
|
|
|
|
Quarter Ended |
|
|
Year Ended |
|
|
|
December 31, |
|
|
December 31, |
|
|
|
2023 |
|
|
2022 |
|
|
2023 |
|
|
2022 |
|
Net earnings attributable to NNN |
|
$ |
96,682 |
|
|
$ |
90,662 |
|
|
$ |
392,340 |
|
|
$ |
334,626 |
|
Interest expense |
|
|
43,389 |
|
|
|
37,665 |
|
|
|
163,898 |
|
|
|
148,065 |
|
Depreciation and amortization |
|
|
60,079 |
|
|
|
57,322 |
|
|
|
238,625 |
|
|
|
223,834 |
|
Gain on disposition of real estate |
|
|
(7,263 |
) |
|
|
(6,787 |
) |
|
|
(47,485 |
) |
|
|
(17,443 |
) |
Impairment losses – real estate, net of recoveries |
|
|
2,315 |
|
|
|
1,088 |
|
|
|
5,990 |
|
|
|
8,309 |
|
Loss attributable to noncontrolling interests |
|
|
— |
|
|
|
— |
|
|
|
— |
|
|
|
(5 |
) |
EBITDA |
|
$ |
195,202 |
|
|
$ |
179,950 |
|
|
$ |
753,368 |
|
|
$ |
697,386 |
|
|
|
(1) |
EBITDA is non-GAAP financial measure. Please reference the Earnings Release for the quarter and year ended December 31, 2023 for the company's definition and explanation of how the company utilizes this metric. |
8
(dollars in thousands)
(unaudited)
|
|
|
|
|
|
|
|
|
|
|
December 31,
2023 |
|
|
December 31,
2022 |
|
Assets: |
|
|
|
|
|
|
Real estate portfolio, net of accumulated depreciation and amortization |
|
$ |
8,535,851 |
|
|
$ |
8,020,814 |
|
Cash and cash equivalents |
|
|
1,189 |
|
|
|
2,505 |
|
Restricted cash and cash held in escrow |
|
|
3,966 |
|
|
|
4,273 |
|
Receivables, net of allowance of $669 and $708, respectively |
|
|
3,649 |
|
|
|
3,612 |
|
Accrued rental income, net of allowance of $4,168 and $3,836, respectively |
|
|
34,611 |
|
|
|
27,795 |
|
Debt costs, net of accumulated amortization of $23,952 and $21,663, respectively |
|
|
3,243 |
|
|
|
5,352 |
|
Other assets |
|
|
79,459 |
|
|
|
81,694 |
|
Total assets |
|
$ |
8,661,968 |
|
|
$ |
8,146,045 |
|
|
|
|
|
|
|
|
Liabilities: |
|
|
|
|
|
|
Line of credit payable |
|
$ |
132,000 |
|
|
$ |
166,200 |
|
Mortgages payable, including unamortized premium and net of unamortized debt costs |
|
|
— |
|
|
|
9,964 |
|
Notes payable, net of unamortized discount and unamortized debt costs |
|
|
4,228,544 |
|
|
|
3,739,890 |
|
Accrued interest payable |
|
|
34,374 |
|
|
|
23,826 |
|
Other liabilities |
|
|
109,593 |
|
|
|
82,663 |
|
Total liabilities |
|
|
4,504,511 |
|
|
|
4,022,543 |
|
|
|
|
|
|
|
|
Stockholders' equity of NNN |
|
|
4,157,457 |
|
|
|
4,123,502 |
|
|
|
|
|
|
|
|
Total liabilities and equity |
|
$ |
8,661,968 |
|
|
$ |
8,146,045 |
|
|
|
|
|
|
|
|
Common shares outstanding |
|
|
182,474,770 |
|
|
|
181,424,670 |
|
|
|
|
|
|
|
|
Gross leasable area, Property Portfolio (square feet) |
|
|
35,966,000 |
|
|
|
35,010,000 |
|
9
As of December 31, 2023
(dollars in thousands)
(unaudited)
|
|
|
|
|
|
|
|
|
|
|
|
|
|
|
|
|
|
|
Unsecured Debt |
|
Principal |
|
|
Principal,
Net of
Unamortized
Discount |
|
|
Stated
Rate |
|
|
Effective
Rate |
|
|
Maturity
Date |
Line of credit payable |
|
$ |
132,000 |
|
|
$ |
132,000 |
|
|
SOFR + 87.5bps |
|
|
|
6.185 |
% |
|
June 2025 |
|
|
|
|
|
|
|
|
|
|
|
|
|
|
|
Unsecured notes payable: |
|
|
|
|
|
|
|
|
|
|
|
|
|
|
2024 |
|
|
350,000 |
|
|
|
349,961 |
|
|
|
3.900 |
% |
|
|
3.924 |
% |
|
June 2024 |
2025 |
|
|
400,000 |
|
|
|
399,790 |
|
|
|
4.000 |
% |
|
|
4.029 |
% |
|
November 2025 |
2026 |
|
|
350,000 |
|
|
|
348,707 |
|
|
|
3.600 |
% |
|
|
3.733 |
% |
|
December 2026 |
2027 |
|
|
400,000 |
|
|
|
399,320 |
|
|
|
3.500 |
% |
|
|
3.548 |
% |
|
October 2027 |
2028 |
|
|
400,000 |
|
|
|
398,487 |
|
|
|
4.300 |
% |
|
|
4.388 |
% |
|
October 2028 |
2030 |
|
|
400,000 |
|
|
|
399,161 |
|
|
|
2.500 |
% |
|
|
2.536 |
% |
|
April 2030 |
2033 |
|
|
500,000 |
|
|
|
488,699 |
|
|
|
5.600 |
% |
|
|
5.905 |
% |
|
October 2033 |
2048 |
|
|
300,000 |
|
|
|
296,136 |
|
|
|
4.800 |
% |
|
|
4.890 |
% |
|
October 2048 |
2050 |
|
|
300,000 |
|
|
|
294,423 |
|
|
|
3.100 |
% |
|
|
3.205 |
% |
|
April 2050 |
2051 |
|
|
450,000 |
|
|
|
442,053 |
|
|
|
3.500 |
% |
|
|
3.602 |
% |
|
April 2051 |
2052 |
|
|
450,000 |
|
|
|
440,059 |
|
|
|
3.000 |
% |
|
|
3.118 |
% |
|
April 2052 |
Total |
|
|
4,300,000 |
|
|
|
4,256,796 |
|
|
|
|
|
|
|
|
|
|
|
|
|
|
|
|
|
|
|
|
|
|
|
|
Total unsecured debt(1) |
|
$ |
4,432,000 |
|
|
$ |
4,388,796 |
|
|
|
|
|
|
|
|
|
|
|
|
|
|
|
|
|
|
|
|
|
|
|
|
Debt costs |
|
|
|
|
$ |
(42,595 |
) |
|
|
|
|
|
|
|
|
Accumulated amortization |
|
|
|
14,343 |
|
|
|
|
|
|
|
|
|
Debt costs, net of accumulated amortization |
|
|
|
(28,252 |
) |
|
|
|
|
|
|
|
|
Notes payable, net of unamortized discount and
unamortized debt costs |
|
|
$ |
4,228,544 |
|
|
|
|
|
|
|
|
|
(1) Unsecured debt has a weighted average interest rate of 4.0% and a weighted average maturity of 12.0 years.
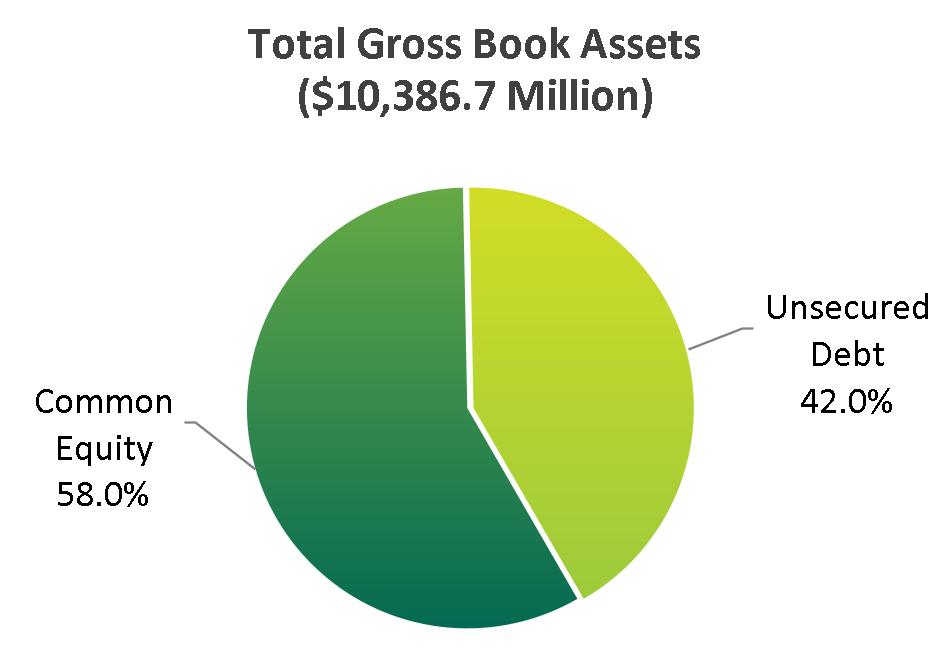
10
Ratings: Moody's Baa1; S&P BBB+
|
|
|
|
|
|
|
|
|
|
|
|
|
|
|
|
|
|
|
|
|
|
|
2019 |
|
|
2020 |
|
|
2021 |
|
|
2022 |
|
|
2023 |
|
Debt / Total assets (gross book) |
|
|
35.3 |
% |
|
|
34.4 |
% |
|
|
39.9 |
% |
|
|
40.4 |
% |
|
|
42.0 |
% |
Debt + preferred / Total assets (gross book) |
|
|
39.3 |
% |
|
|
38.4 |
% |
|
|
39.9 |
% |
|
|
40.4 |
% |
|
|
42.0 |
% |
Debt / EBITDA (last quarter annualized) |
|
|
4.8 |
|
|
|
5.0 |
|
|
|
5.2 |
|
|
|
5.4 |
|
|
|
5.5 |
|
Debt + preferred / EBITDA (last quarter annualized) |
|
|
5.3 |
|
|
|
5.6 |
|
|
|
5.2 |
|
|
|
5.4 |
|
|
|
5.5 |
|
EBITDA / Interest expense (cash) |
|
|
5.0 |
|
|
|
4.6 |
|
|
|
4.7 |
|
|
|
4.7 |
|
|
|
4.5 |
|
EBITDA / Fixed charges (cash) |
|
|
4.0 |
|
|
|
4.0 |
|
|
|
4.3 |
|
|
|
4.7 |
|
|
|
4.5 |
|
(1) Debt amounts used in calculations are net of cash balances.
|
CREDIT FACILITY AND NOTES COVENANTS |
The following is a summary of key financial covenants for the company's unsecured credit facility and notes, as defined and calculated per the terms of the facility's credit agreement and the notes' governing documents, respectively, which are included in the company's filings with the Commission. These calculations, which are not based on U.S. GAAP measurements, are presented to investors to show that as of December 31, 2023, the company believes it is in compliance with the covenants.
|
|
|
|
|
Key Covenants |
|
Required |
|
December 31, 2023 |
Unsecured Bank Credit Facility: |
|
|
|
|
Maximum leverage ratio |
|
< 0.60 |
|
0.38 |
Minimum fixed charge coverage ratio |
|
> 1.50 |
|
4.52 |
Maximum secured indebtedness ratio |
|
< 0.40 |
|
— |
Unencumbered asset value ratio |
|
> 1.67 |
|
2.62 |
Unencumbered interest ratio |
|
> 1.75 |
|
4.51 |
Unsecured Notes: |
|
|
|
|
Limitation on incurrence of total debt |
|
≤ 60% |
|
41.5% |
Limitation on incurrence of secured debt |
|
≤ 40% |
|
— |
Debt service coverage ratio |
|
≥ 1.50 |
|
4.5 |
Maintenance of total unencumbered assets |
|
≥ 150% |
|
241% |
11
|
LONG-TERM DIVIDEND HISTORY |
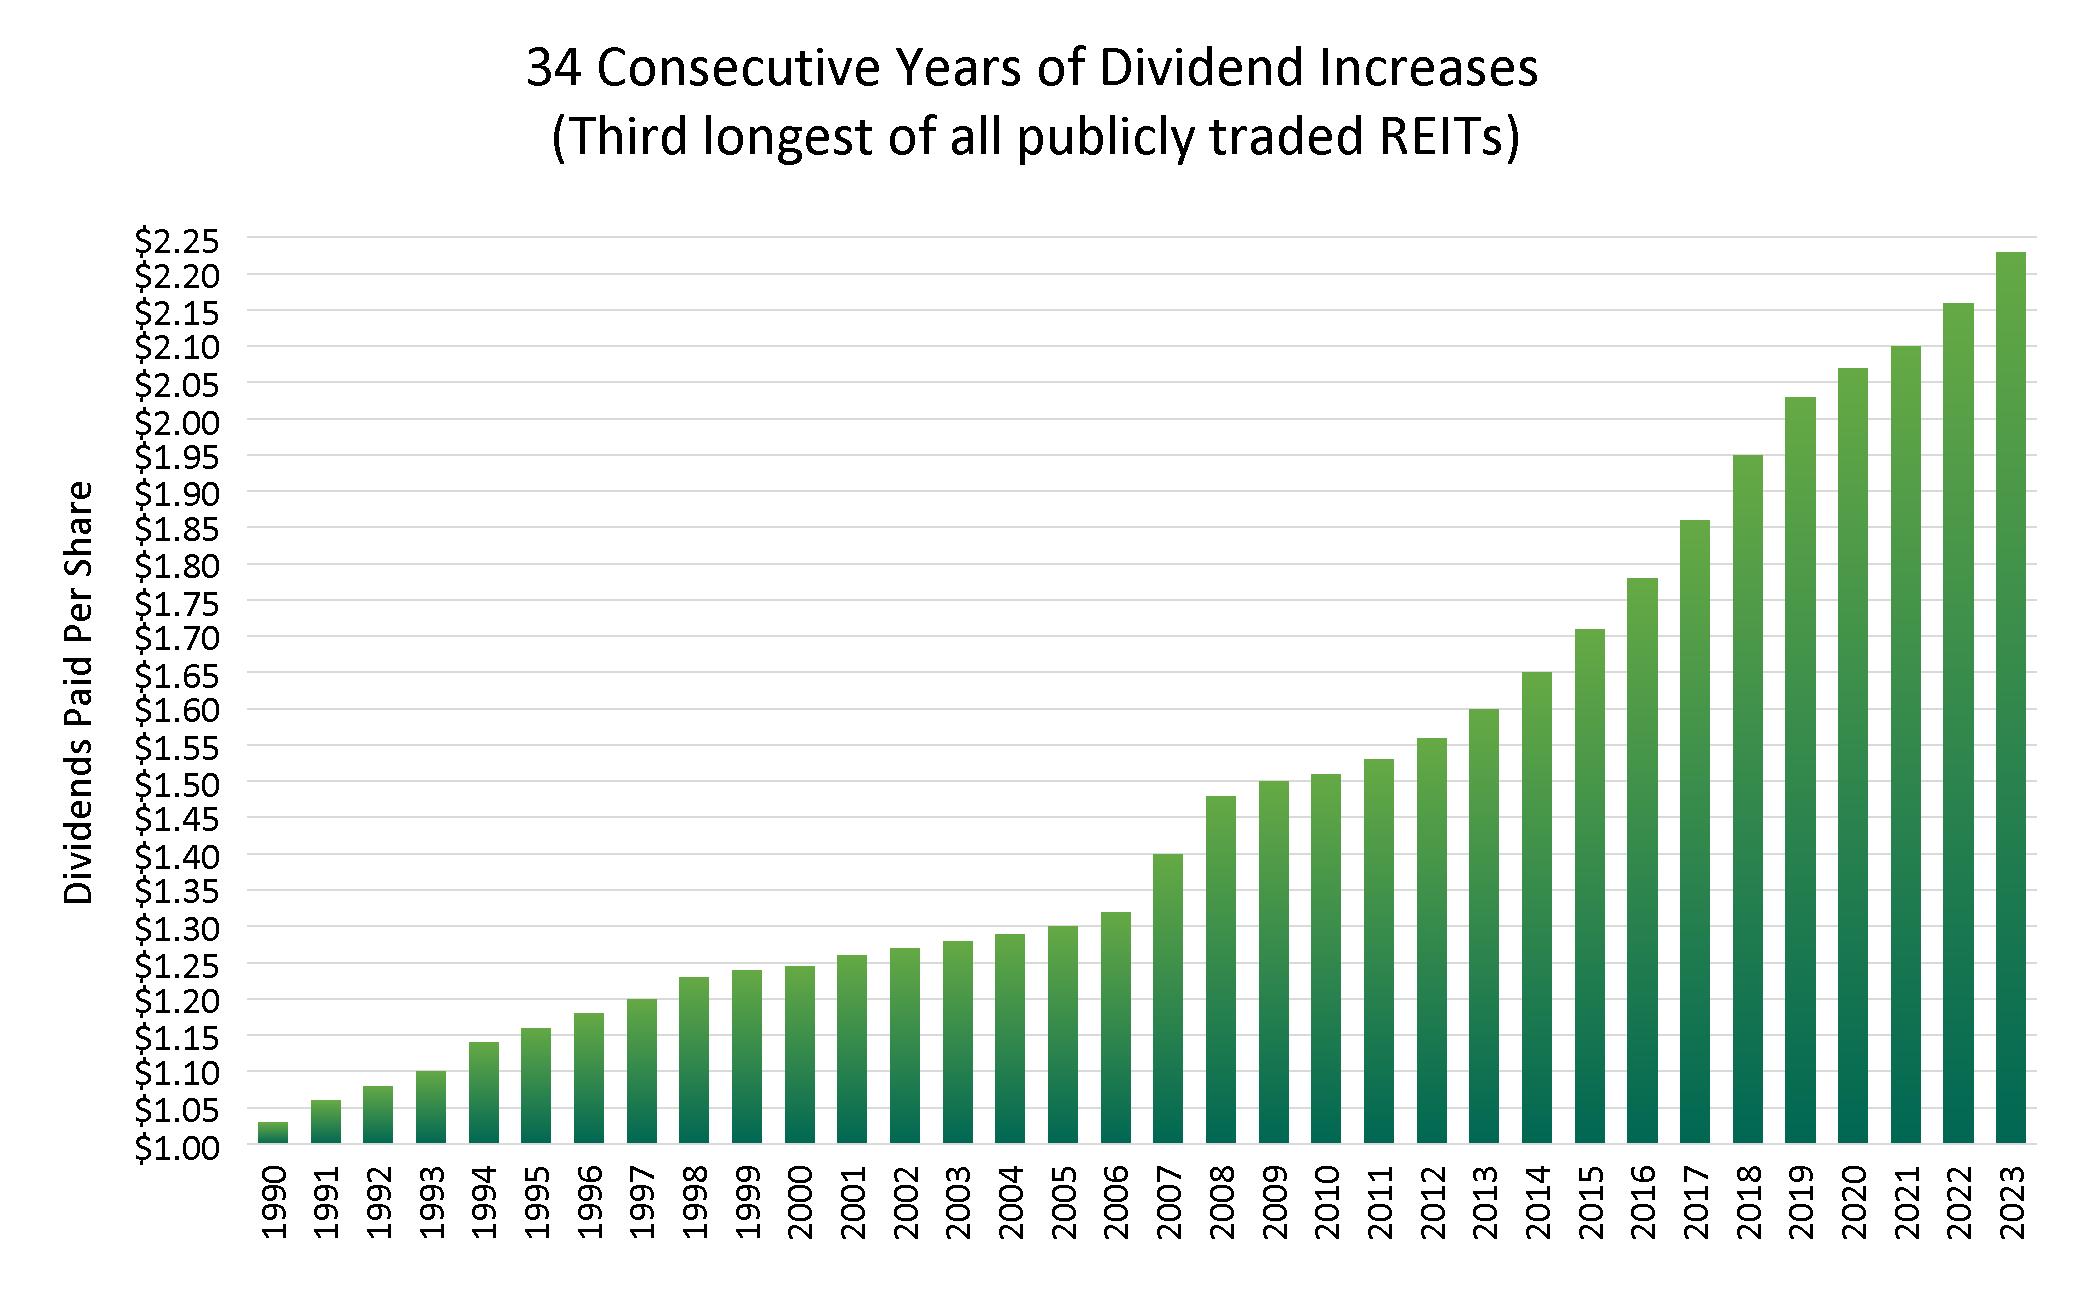
12
(dollars in thousands)
|
|
|
|
|
|
|
|
|
|
|
Year Ended December 31, |
|
|
|
2023 |
|
|
2022 |
|
Total dollars invested(1) |
|
$ |
819,710 |
|
|
$ |
847,747 |
|
Number of Properties |
|
|
165 |
|
|
|
223 |
|
Gross leasable area (square feet)(2) |
|
|
1,281,000 |
|
|
|
2,629,000 |
|
Cap rate (3) |
|
|
7.3 |
% |
|
|
6.4 |
% |
Weighted average lease term |
|
|
18.8 |
|
|
|
16.2 |
|
|
|
(1) |
Includes dollars invested in projects under construction or tenant improvements for each respective year. |
(2) |
Includes additional square footage from completed construction on existing Properties. |
(3) |
The cap rate is a weighted average, calculated as the initial cash annual base rent divided by the total purchase price of the Properties. |
(dollars in thousands)
|
|
|
|
|
|
|
|
|
|
|
|
|
|
|
|
|
|
|
|
|
|
|
|
|
|
|
Year Ended December 31, |
|
|
|
2023 |
|
|
2022 |
|
|
|
Occupied |
|
|
Vacant |
|
|
Total |
|
|
Occupied |
|
|
Vacant |
|
|
Total |
|
Number of properties |
|
|
24 |
|
|
|
21 |
|
|
|
45 |
|
|
|
17 |
|
|
|
16 |
|
|
|
33 |
|
Gross leasable area (square feet) |
|
|
177,000 |
|
|
|
116,000 |
|
|
|
293,000 |
|
|
|
138,000 |
|
|
|
173,000 |
|
|
|
311,000 |
|
Acquisition costs |
|
$ |
69,790 |
|
|
$ |
25,036 |
|
|
$ |
94,826 |
|
|
$ |
39,446 |
|
|
$ |
38,282 |
|
|
$ |
77,728 |
|
Net book value |
|
$ |
55,098 |
|
|
$ |
13,133 |
|
|
$ |
68,231 |
|
|
$ |
25,515 |
|
|
$ |
22,258 |
|
|
$ |
47,773 |
|
Net sale proceeds |
|
$ |
97,822 |
|
|
$ |
17,894 |
|
|
$ |
115,716 |
|
|
$ |
41,190 |
|
|
$ |
24,026 |
|
|
$ |
65,216 |
|
Cap rate(1) |
|
|
5.9 |
% |
|
|
— |
|
|
|
5.9 |
% |
|
|
5.9 |
% |
|
|
— |
|
|
|
5.9 |
% |
|
|
(1) |
The cap rate is a weighted average, calculated as the cash annual base rent divided by the total sales price of the properties. |
13
|
|
|
|
|
|
|
|
|
|
|
|
|
|
|
|
|
|
|
|
|
|
|
|
|
% of
Total(2) |
|
# of
Properties |
|
|
Gross Leasable
Area (3) |
|
|
|
|
% of
Total(2) |
|
# of
Properties |
|
|
Gross Leasable
Area (3) |
|
2024 |
|
1.7% |
|
|
54 |
|
|
|
803,000 |
|
|
2030 |
|
3.3% |
|
|
109 |
|
|
|
1,221,000 |
|
2025 |
|
5.1% |
|
|
185 |
|
|
|
1,941,000 |
|
|
2031 |
|
7.3% |
|
|
185 |
|
|
|
2,697,000 |
|
2026 |
|
4.8% |
|
|
212 |
|
|
|
2,127,000 |
|
|
2032 |
|
5.9% |
|
|
215 |
|
|
|
2,328,000 |
|
2027 |
|
8.2% |
|
|
235 |
|
|
|
3,591,000 |
|
|
2033 |
|
4.9% |
|
|
138 |
|
|
|
1,467,000 |
|
2028 |
|
5.7% |
|
|
229 |
|
|
|
2,172,000 |
|
|
Thereafter |
|
49.1% |
|
|
1,831 |
|
|
|
15,592,000 |
|
2029 |
|
4.0% |
|
|
119 |
|
|
|
1,744,000 |
|
|
|
|
|
|
|
|
|
|
|
|
|
(1) |
As of December 31, 2023, the weighted average remaining lease term is 10.1 years. |
(2) |
Based on the annual base rent of $818,749,000, which is the annualized base rent for all leases in place as of December 31, 2023. |
(3) |
Square feet. |
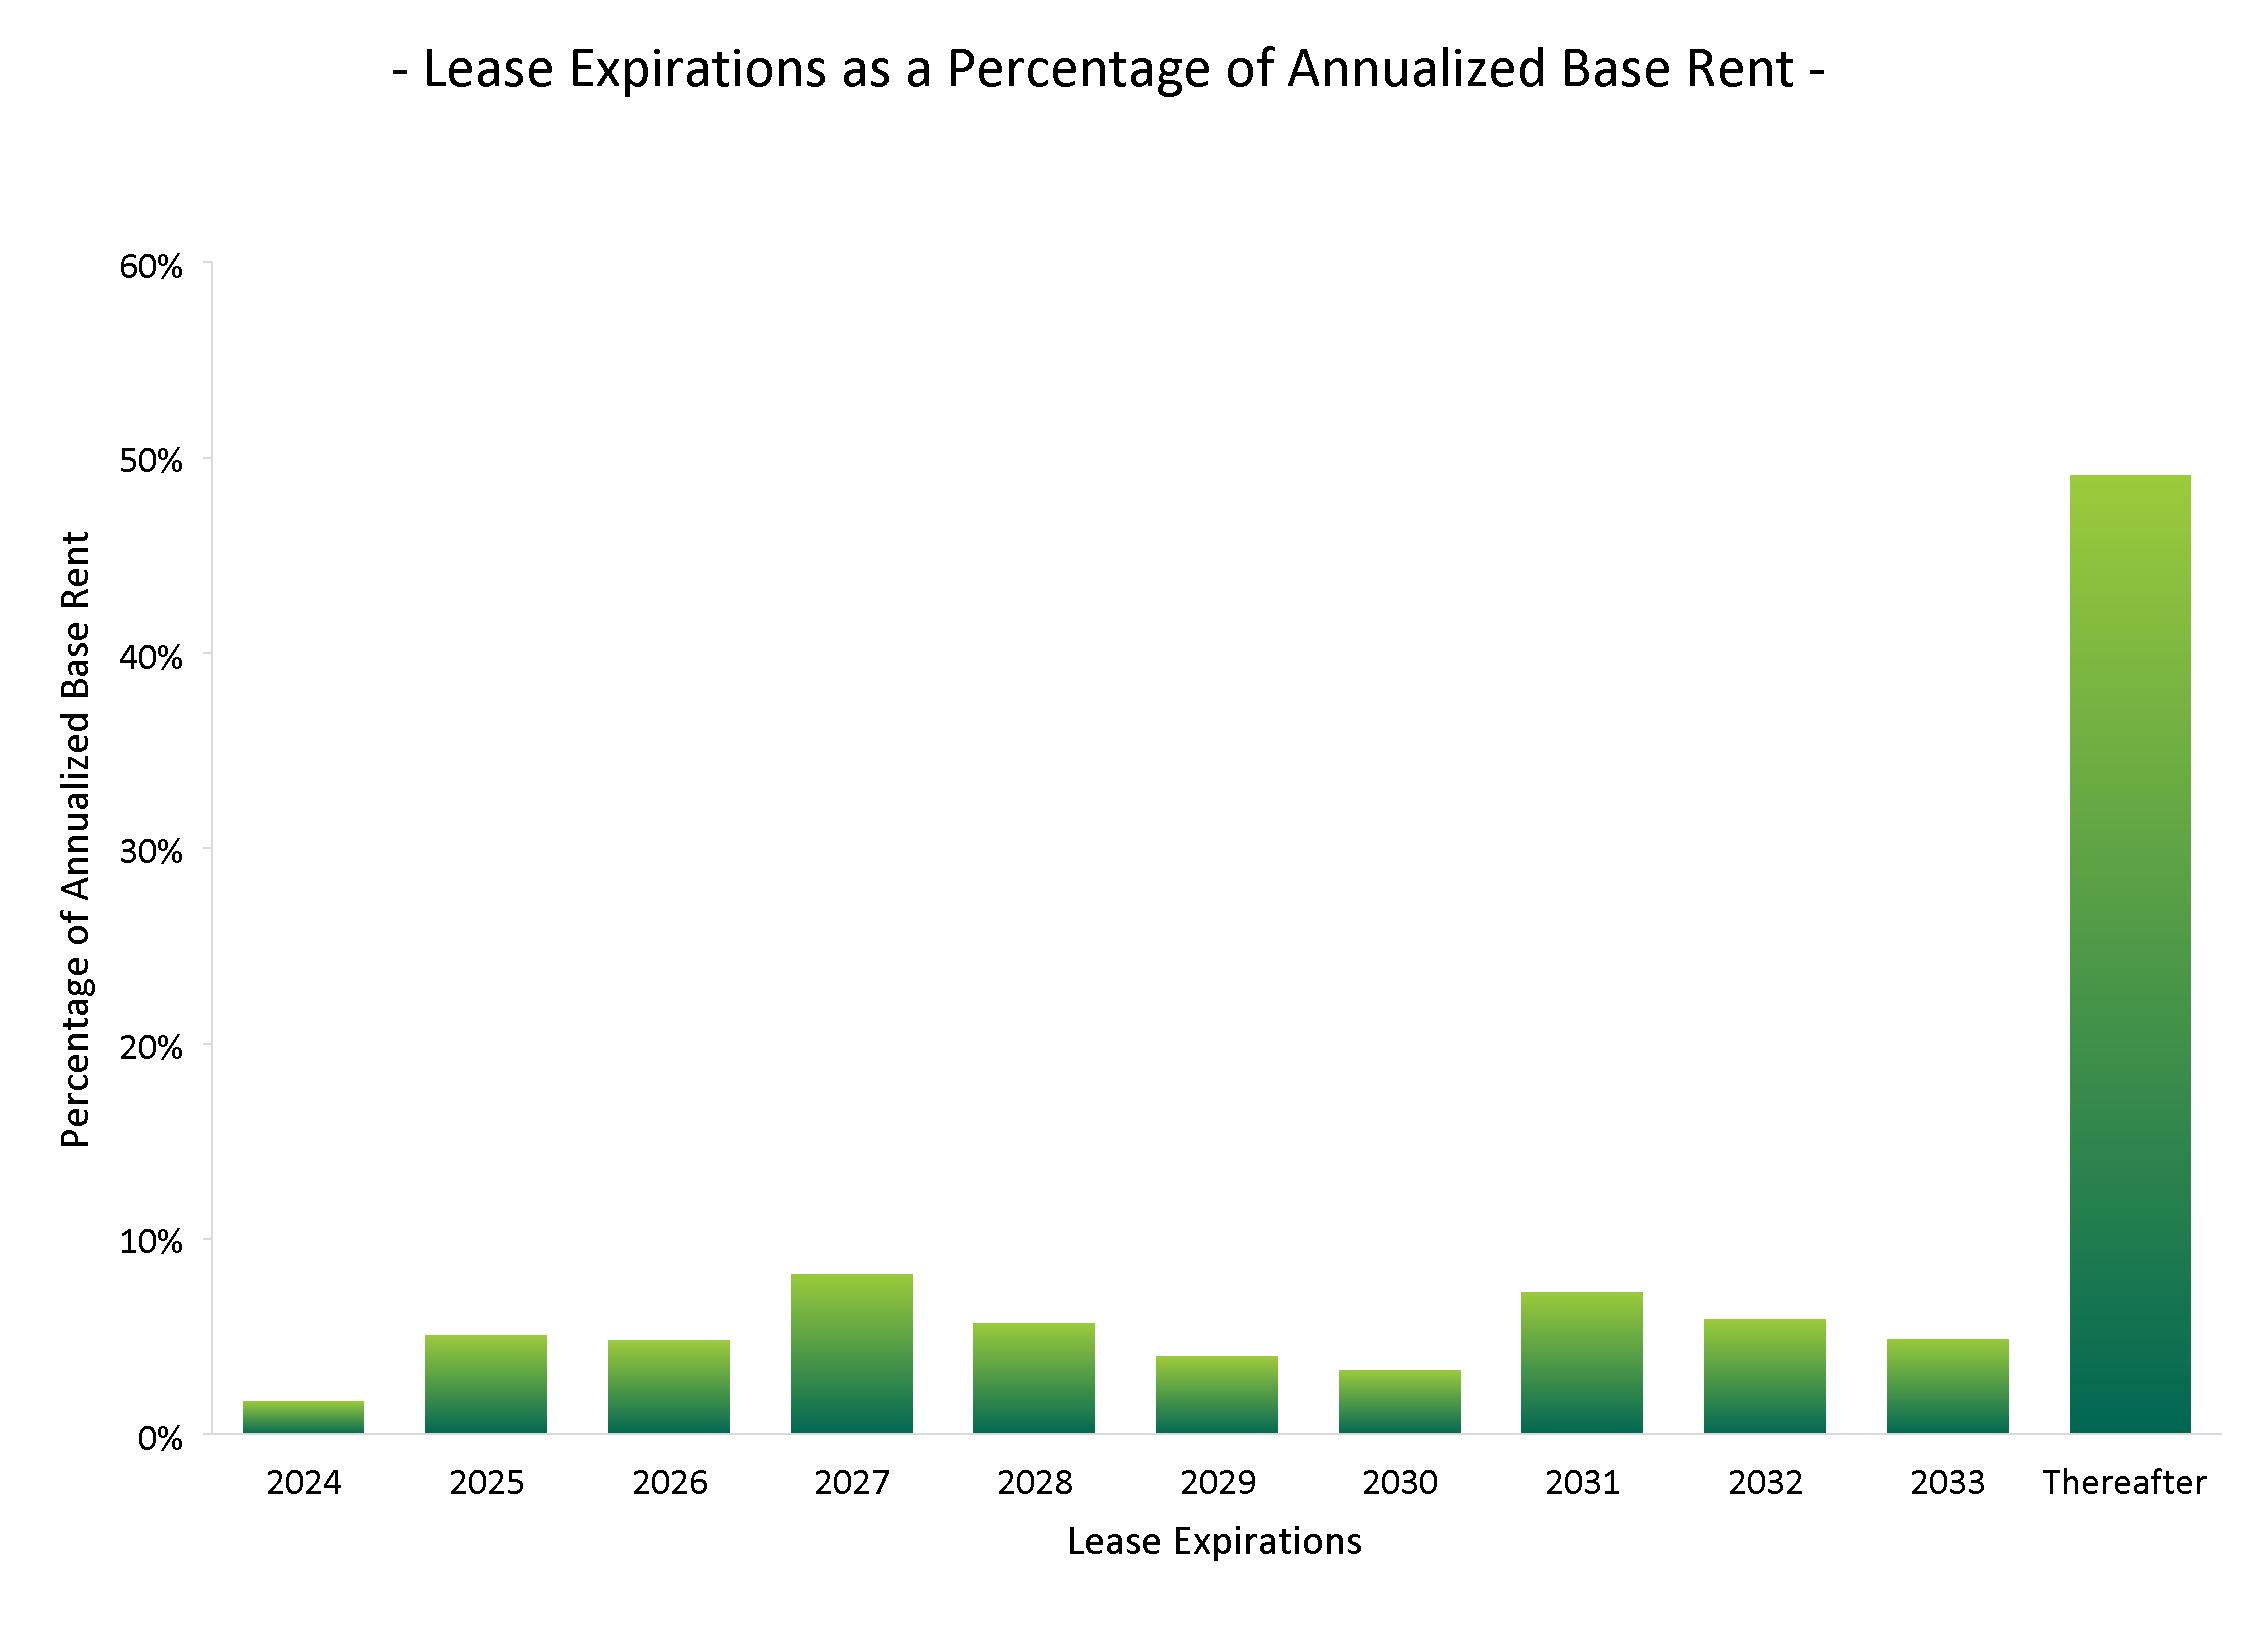
14
|
|
|
|
|
|
|
|
|
|
|
|
|
|
|
As of December 31, 2023 |
|
As of December 31, 2022 |
|
|
Lines of Trade |
|
% of Total(1) |
|
# of Properties |
|
% of Total(2) |
|
# of Properties |
1. |
|
Convenience stores |
|
16.4% |
|
661 |
|
16.5% |
|
650 |
2. |
|
Automotive service |
|
15.6% |
|
629 |
|
13.7% |
|
528 |
3. |
|
Restaurants – full service |
|
8.7% |
|
417 |
|
9.1% |
|
420 |
4. |
|
Restaurants – limited service |
|
8.5% |
|
610 |
|
8.9% |
|
611 |
5. |
|
Family entertainment centers |
|
6.4% |
|
94 |
|
5.9% |
|
88 |
6. |
|
Recreational vehicle dealers, parts and accessories |
|
4.6% |
|
62 |
|
4.1% |
|
52 |
7. |
|
Health and fitness |
|
4.5% |
|
33 |
|
4.9% |
|
34 |
8. |
|
Theaters |
|
4.1% |
|
33 |
|
4.3% |
|
33 |
9. |
|
Equipment rental |
|
3.0% |
|
99 |
|
3.1% |
|
100 |
10. |
|
Wholesale clubs |
|
2.5% |
|
13 |
|
2.6% |
|
13 |
11. |
|
Automotive parts |
|
2.5% |
|
144 |
|
2.6% |
|
152 |
12. |
|
Drug stores |
|
2.4% |
|
66 |
|
2.6% |
|
67 |
13. |
|
Home improvement |
|
2.2% |
|
50 |
|
2.3% |
|
50 |
14. |
|
Furniture |
|
2.0% |
|
75 |
|
2.3% |
|
80 |
15. |
|
Medical service providers |
|
1.7% |
|
79 |
|
1.9% |
|
84 |
16. |
|
General merchandise |
|
1.4% |
|
72 |
|
1.6% |
|
74 |
17. |
|
Consumer electronics |
|
1.4% |
|
17 |
|
1.4% |
|
17 |
18. |
|
Home furnishings |
|
1.3% |
|
13 |
|
1.4% |
|
16 |
19. |
|
Travel plazas |
|
1.3% |
|
24 |
|
1.4% |
|
24 |
20. |
|
Automobile auctions, wholesale |
|
1.1% |
|
15 |
|
1.3% |
|
15 |
|
|
Other |
|
8.4% |
|
326 |
|
8.1% |
|
303 |
|
|
Total |
|
100.0% |
|
3,532 |
|
100.0% |
|
3,411 |
|
|
|
As a percentage of annual base rent, which is the annualized base rent for all leases in place. |
|
(1) |
$818,749,000 as of December 31, 2023. |
|
(2) |
$771,984,000 as of December 31, 2022. |
|
|
|
|
|
|
|
|
|
|
|
|
|
State |
|
% of Total(1) |
|
|
|
State |
|
% of Total(1) |
1. |
|
Texas |
|
16.8% |
|
6. |
|
North Carolina |
|
3.9% |
2. |
|
Florida |
|
9.4% |
|
7. |
|
Tennessee |
|
3.8% |
3. |
|
Illinois |
|
5.2% |
|
8. |
|
Indiana |
|
3.7% |
4. |
|
Ohio |
|
4.9% |
|
9. |
|
California |
|
3.3% |
5. |
|
Georgia |
|
4.7% |
|
10. |
|
Virginia |
|
3.3% |
|
|
|
As a percentage of annual base rent, which is the annualized base rent for all leases in place. |
|
(1) |
$818,749,000 as of December 31, 2023. |
15
As a percentage of annual base rent - December 31, 2023
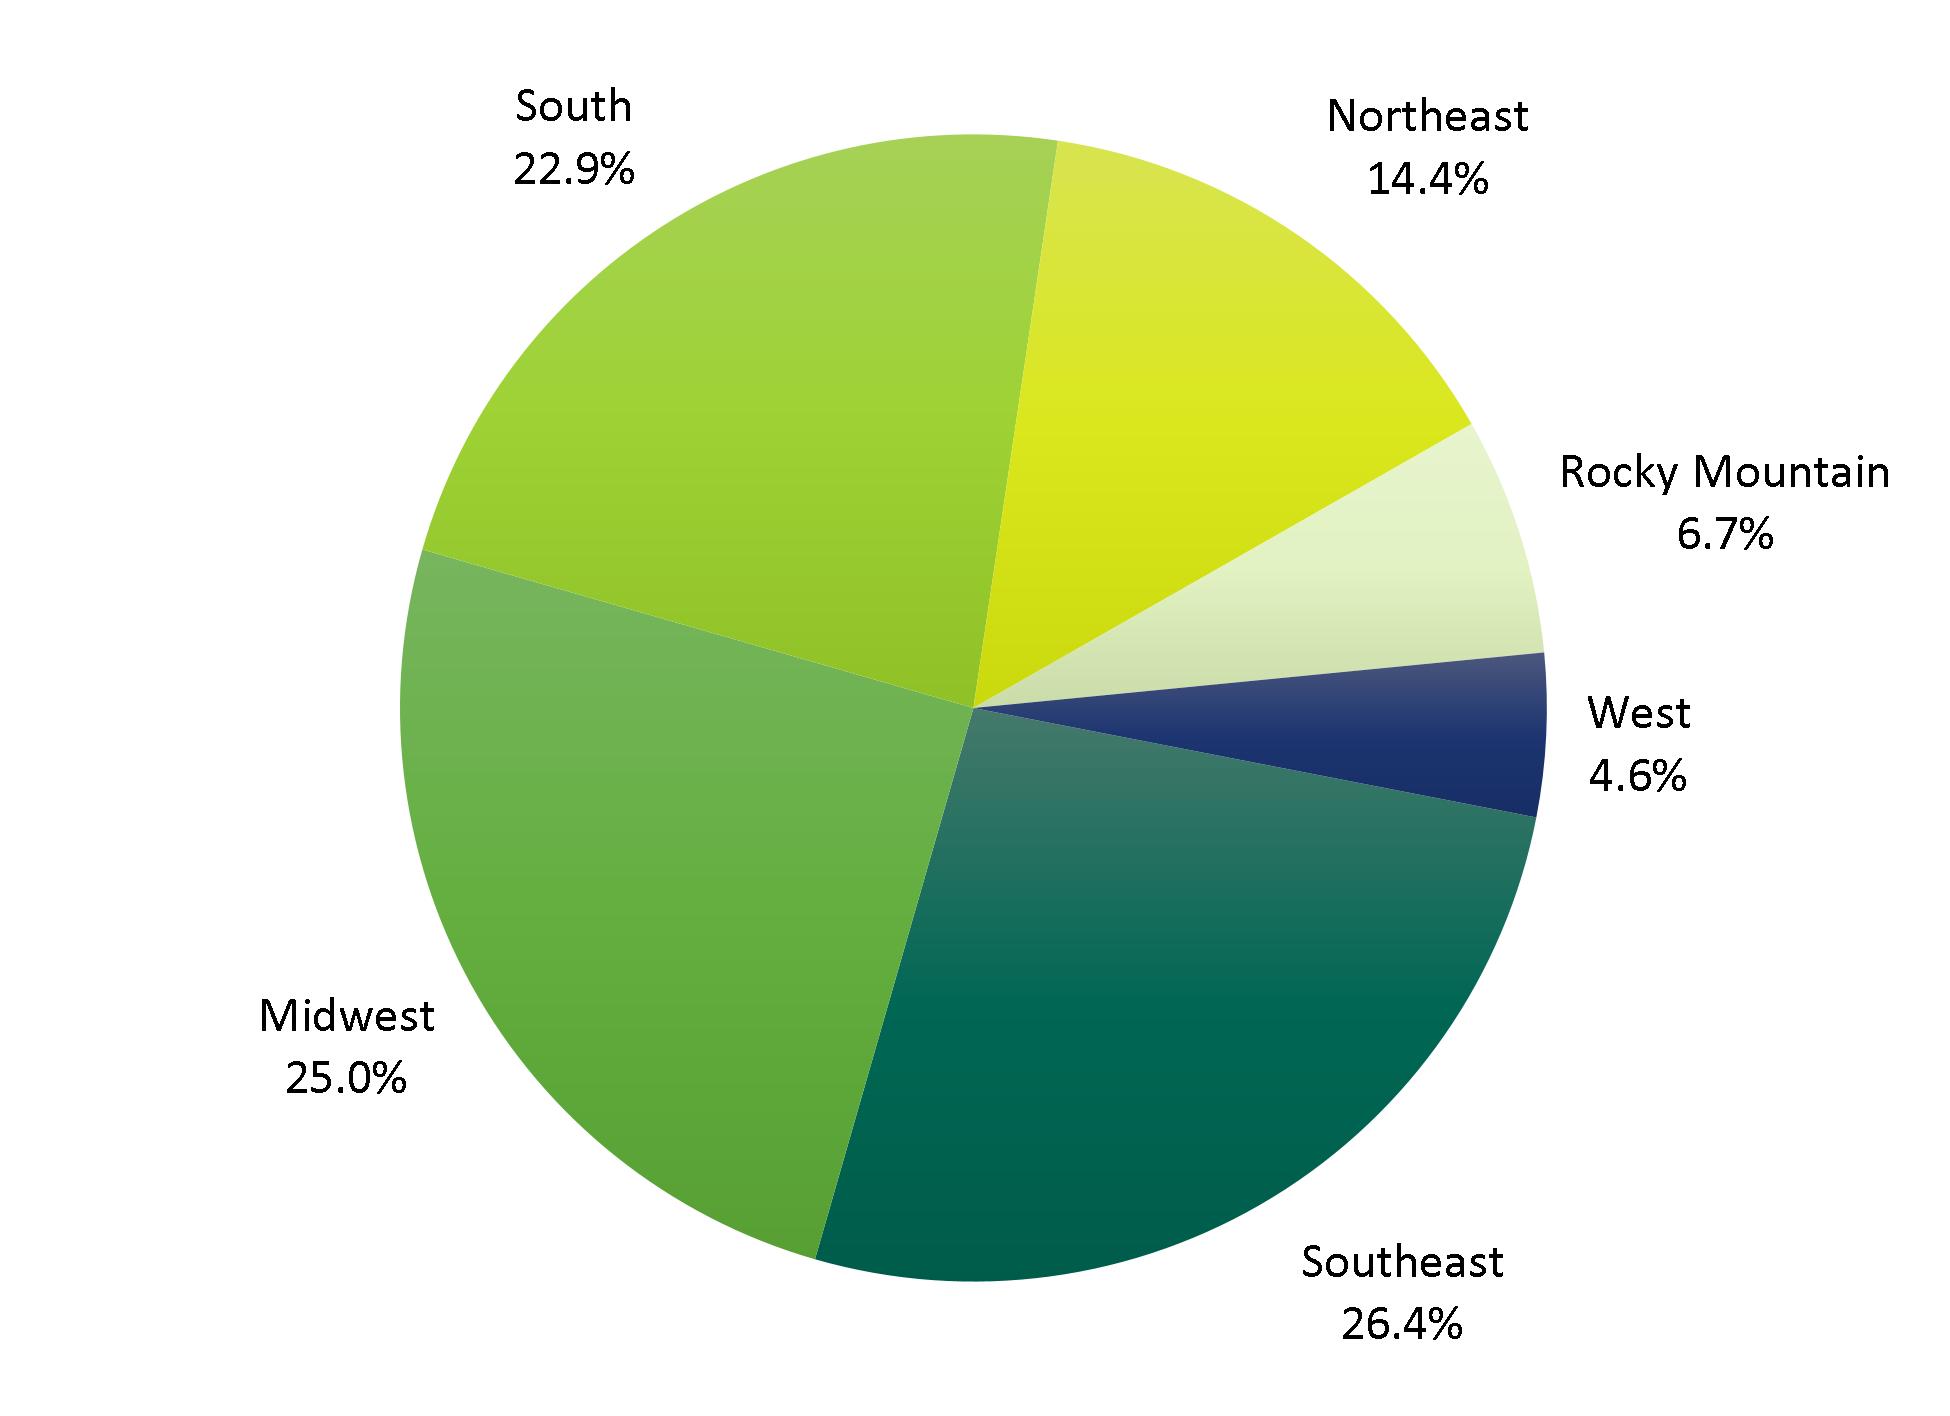
|
|
|
Based on the annual base rent of $818,749,000, which is the annualized base rent for all leases in place as of December 31, 2023. |
16
Creditworthy Retailers
▪17.1% of annual base rent is from tenants with investment grade rated debt
▪74.0% of annual base rent is from tenants that are publicly traded and/or have rated debt
▪Top 20 tenants (49.0% of annual base rent) operate an average of 1,570 stores each
Top 20 Tenants
|
|
|
|
|
|
|
|
|
Tenant |
|
# of
Properties |
|
% of
Total(1) |
1. |
|
7-Eleven |
|
138 |
|
4.4% |
2. |
|
Mister Car Wash |
|
121 |
|
4.2% |
3. |
|
Camping World |
|
47 |
|
3.8% |
4. |
|
Dave & Buster's |
|
32 |
|
3.5% |
5. |
|
LA Fitness |
|
29 |
|
3.1% |
6. |
|
GPM Investments (convenience stores) |
|
150 |
|
3.0% |
7. |
|
Flynn Restaurant Group (Taco Bell/Arby's) |
|
204 |
|
2.8% |
8. |
|
AMC Theatres |
|
20 |
|
2.7% |
9. |
|
BJ's Wholesale Club |
|
13 |
|
2.5% |
10. |
|
Mavis Tire Express Services |
|
140 |
|
2.3% |
11. |
|
Couche Tard (Pantry) |
|
92 |
|
2.2% |
12. |
|
Sunoco |
|
61 |
|
2.1% |
13. |
|
Walgreens |
|
49 |
|
1.9% |
14. |
|
Chuck E. Cheese |
|
53 |
|
1.9% |
15. |
|
United Rentals |
|
50 |
|
1.7% |
16. |
|
Frisch's Restaurants |
|
68 |
|
1.6% |
17. |
|
Fikes (Convenience Stores) |
|
58 |
|
1.5% |
18. |
|
Life Time Fitness |
|
3 |
|
1.3% |
19. |
|
Bob Evans |
|
106 |
|
1.3% |
20. |
|
Best Buy |
|
16 |
|
1.3% |
|
|
(1) |
Based on the annual base rent of $818,749,000, which is the annualized base rent for all leases in place as of December 31, 2023. |
17
(dollars in thousands)
|
|
|
|
|
Properties (Cash Basis) (1) |
|
|
|
Number of properties |
|
|
3,128 |
|
Year ended December 31, 2023 (2) |
|
$ |
711,693 |
|
Year ended December 31, 2022 (2) |
|
$ |
702,643 |
|
Change (in dollars) |
|
$ |
9,050 |
|
Change (percent) |
|
|
1.3 |
% |
|
|
(1) |
Includes all properties owned for current and prior year period excluding any properties under development or re-development. |
(2) |
Excludes the impact of the rent deferral lease amendments (Reference "Rent Deferral Lease Amendments" section of this Annual Supplemental Data). |
(dollars in thousands)
|
|
|
|
|
|
|
|
|
|
|
|
|
|
Year Ended December 31, 2023 |
|
Renewals With
Same Tenant(1) |
|
|
Vacancy Re-Lease
To New Tenant |
|
|
Releasing
Totals |
|
|
Number of leases |
|
|
109 |
|
|
|
23 |
|
|
|
132 |
|
|
New cash rents |
|
$ |
20,266 |
|
|
$ |
4,355 |
|
|
$ |
24,621 |
|
|
Prior cash rents |
|
$ |
19,003 |
|
|
$ |
4,566 |
|
|
$ |
23,569 |
|
(2) |
Recovery rate |
|
|
106.6 |
% |
|
|
95.4 |
% |
|
|
104.5 |
% |
|
Tenant improvements |
|
$ |
500 |
|
|
$ |
3,233 |
|
|
$ |
3,733 |
|
|
|
|
(1) |
Long-term renewal rate for the period of 2010 through 2023 was 83.1%. |
(2) |
Represents 2.9% of total annualized base rent as of December 31, 2023. |
18
|
OTHER PROPERTY PORTFOLIO DATA |
As of December 31, 2023
Tenant Financials
|
|
|
|
|
|
|
# of
Properties |
|
% of Annual
Base Rent (1) |
Property level financial information |
|
2,980 |
|
81% |
Tenant corporate financials |
|
2,763 |
|
78% |
|
|
|
|
|
|
|
|
|
Rent Increases |
|
% of Annual Base Rent (1) |
|
|
Annual |
|
Five Year |
|
Other |
|
Total |
CPI |
|
37% |
|
56% |
|
1% |
|
94% |
Fixed |
|
2% |
|
— |
|
1% |
|
3% |
No increases |
|
— |
|
— |
|
3% |
|
3% |
|
|
39% |
|
56% |
|
5% |
|
100% |
Lease Structure - as a percentage of the company's annual base rent(1)
•92.6% is from triple net leases
•95.5% is from triple net leases or double net leases (with roof warranty)
•29.9% is from master leases
•98.3% is from leases containing future lease renewal options
•0.5% is from leases containing purchase options
|
|
(1) |
Based on the annual base rent of $818,749,000, which is the annualized base rent for all leases in place as of December 31, 2023. |
Guidance is based on current plans and assumptions and subject to risks and uncertainties more fully described in this press release and the company's reports filed with the Commission.
|
|
|
|
|
2024 Guidance |
Net earnings per common share excluding any gains on disposition
of real estate, impairment charges, and executive retirement costs |
|
$1.94 - $2.00 per share |
Real estate depreciation and amortization per share |
|
$1.31 per share |
Core FFO per share |
|
$3.25 - $3.31 per share |
AFFO per share |
|
$3.29 - $3.35 per share |
General and administrative expenses |
|
$46 - $48 Million |
Real estate expenses, net of tenant reimbursements |
|
$9 - $11 Million |
Acquisition volume |
|
$400 - $500 Million |
Disposition volume |
|
$80 - $120 Million |
19
|
RENT DEFERRAL LEASE AMENDMENTS |
The following table outlines the rent deferred and corresponding scheduled repayment by quarter of the rent deferral lease amendments executed as of December 31, 2023 (dollars in thousands):
|
|
|
|
|
|
|
|
|
|
|
|
|
|
|
|
|
|
|
|
|
|
|
|
|
|
|
|
|
|
|
|
|
|
|
|
|
|
|
|
|
|
Deferred |
|
|
|
Scheduled Repayment |
|
|
|
|
Accrual
Basis |
|
|
Cash
Basis |
|
|
Total |
|
|
% of
Total |
|
|
|
Accrual
Basis |
|
|
Cash
Basis |
|
|
Total |
|
|
% of
Total |
|
|
Cumulative
Total |
|
2020 |
|
|
$ |
33,594 |
|
|
$ |
18,129 |
|
|
$ |
51,723 |
|
|
|
91.6 |
% |
|
|
$ |
3,239 |
|
|
$ |
20 |
|
|
$ |
3,259 |
|
|
|
5.8 |
% |
|
|
5.8 |
% |
|
|
|
|
|
|
|
|
|
|
|
|
|
|
|
|
|
|
|
|
|
|
|
|
|
|
|
|
|
|
2021 |
|
|
|
990 |
|
|
|
3,732 |
|
|
|
4,722 |
|
|
|
8.4 |
% |
|
|
|
25,935 |
|
|
|
5,841 |
|
|
|
31,776 |
|
|
|
56.3 |
% |
|
|
62.1 |
% |
|
|
|
|
|
|
|
|
|
|
|
|
|
|
|
|
|
|
|
|
|
|
|
|
|
|
|
|
|
|
2022 |
Q1 |
|
|
— |
|
|
|
— |
|
|
|
— |
|
|
|
— |
|
|
|
|
1,780 |
|
|
|
2,277 |
|
|
|
4,057 |
|
|
|
7.2 |
% |
|
|
69.3 |
% |
|
Q2 |
|
|
— |
|
|
|
— |
|
|
|
— |
|
|
|
— |
|
|
|
|
1,729 |
|
|
|
2,276 |
|
|
|
4,005 |
|
|
|
7.1 |
% |
|
|
76.4 |
% |
|
Q3 |
|
|
— |
|
|
|
— |
|
|
|
— |
|
|
|
— |
|
|
|
|
1,201 |
|
|
|
2,257 |
|
|
|
3,458 |
|
|
|
6.1 |
% |
|
|
82.5 |
% |
|
Q4 |
|
|
— |
|
|
|
— |
|
|
|
— |
|
|
|
— |
|
|
|
|
681 |
|
|
|
2,277 |
|
|
|
2,958 |
|
|
|
5.3 |
% |
|
|
87.8 |
% |
|
|
|
|
— |
|
|
|
— |
|
|
|
— |
|
|
|
— |
|
|
|
|
5,391 |
|
|
|
9,087 |
|
|
|
14,478 |
|
|
|
25.7 |
% |
|
|
87.8 |
% |
|
|
|
|
|
|
|
|
|
|
|
|
|
|
|
|
|
|
|
|
|
|
|
|
|
|
|
|
|
|
2023 |
Q1 |
|
|
— |
|
|
|
— |
|
|
|
— |
|
|
|
— |
|
|
|
|
9 |
|
|
|
1,677 |
|
|
|
1,686 |
|
|
|
3.0 |
% |
|
|
90.8 |
% |
|
Q2 |
|
|
— |
|
|
|
— |
|
|
|
— |
|
|
|
— |
|
|
|
|
10 |
|
|
|
476 |
|
|
|
486 |
|
|
|
0.9 |
% |
|
|
91.7 |
% |
|
Q3 |
|
|
— |
|
|
|
— |
|
|
|
— |
|
|
|
— |
|
|
|
|
— |
|
|
|
476 |
|
|
|
476 |
|
|
|
0.8 |
% |
|
|
92.5 |
% |
|
Q4 |
|
|
— |
|
|
|
— |
|
|
|
— |
|
|
|
— |
|
|
|
|
— |
|
|
|
476 |
|
|
|
476 |
|
|
|
0.8 |
% |
|
|
93.3 |
% |
|
|
|
|
— |
|
|
|
— |
|
|
|
— |
|
|
|
— |
|
|
|
|
19 |
|
|
|
3,105 |
|
|
|
3,124 |
|
|
|
5.5 |
% |
|
|
93.3 |
% |
|
|
|
|
|
|
|
|
|
|
|
|
|
|
|
|
|
|
|
|
|
|
|
|
|
|
|
|
|
|
2024 |
Q1 |
|
|
— |
|
|
|
— |
|
|
|
— |
|
|
|
— |
|
|
|
|
— |
|
|
|
476 |
|
|
|
476 |
|
|
|
0.8 |
% |
|
|
94.1 |
% |
|
Q2 |
|
|
— |
|
|
|
— |
|
|
|
— |
|
|
|
— |
|
|
|
|
— |
|
|
|
476 |
|
|
|
476 |
|
|
|
0.8 |
% |
|
|
94.9 |
% |
|
Q3 |
|
|
— |
|
|
|
— |
|
|
|
— |
|
|
|
— |
|
|
|
|
— |
|
|
|
476 |
|
|
|
476 |
|
|
|
0.8 |
% |
|
|
95.7 |
% |
|
Q4 |
|
|
— |
|
|
|
— |
|
|
|
— |
|
|
|
— |
|
|
|
|
— |
|
|
|
476 |
|
|
|
476 |
|
|
|
0.9 |
% |
|
|
96.6 |
% |
|
|
|
|
— |
|
|
|
— |
|
|
|
— |
|
|
|
— |
|
|
|
|
— |
|
|
|
1,904 |
|
|
|
1,904 |
|
|
|
3.3 |
% |
|
|
96.6 |
% |
|
|
|
|
|
|
|
|
|
|
|
|
|
|
|
|
|
|
|
|
|
|
|
|
|
|
|
|
|
|
2025 |
|
|
|
— |
|
|
|
— |
|
|
|
— |
|
|
|
— |
|
|
|
|
— |
|
|
|
1,904 |
|
|
|
1,904 |
|
|
|
3.4 |
% |
|
|
100.0 |
% |
|
|
|
|
|
|
|
|
|
|
|
|
|
|
|
|
|
|
|
|
|
|
|
|
|
|
|
|
|
|
|
|
|
$ |
34,584 |
|
|
$ |
21,861 |
|
|
$ |
56,445 |
|
|
|
100.0 |
% |
|
|
$ |
34,584 |
|
|
$ |
21,861 |
|
|
$ |
56,445 |
|
|
|
100.0 |
% |
|
|
|
20
|
RENT DEFERRAL LEASE AMENDMENTS (continued) |
Adjusted Results
The following table outlines the adjusted effects of excluding the scheduled repayments of the COVID-19 rent deferral lease amendments executed as of December 31, 2023:
|
|
|
|
|
|
|
|
|
|
|
|
|
|
|
|
|
|
|
|
|
|
|
|
|
|
|
Quarter Ended December 31, |
|
|
Year Ended December 31, |
|
|
|
2023 |
|
|
2022 |
|
|
% Change |
|
|
2023 |
|
|
2022 |
|
|
% Change |
|
Core FFO per common share: |
|
|
|
|
|
|
|
|
|
|
|
|
|
|
|
|
|
|
As reported |
|
$ |
0.85 |
|
|
$ |
0.80 |
|
|
|
6.3 |
% |
|
$ |
3.26 |
|
|
$ |
3.14 |
|
|
|
3.8 |
% |
Adjusted(1) |
|
$ |
0.85 |
|
|
$ |
0.78 |
|
|
|
9.0 |
% |
|
$ |
3.24 |
|
|
$ |
3.09 |
|
|
|
4.9 |
% |
Adjusted(2) |
|
$ |
0.81 |
|
|
$ |
0.78 |
|
|
|
3.8 |
% |
|
$ |
3.21 |
|
|
$ |
3.09 |
|
|
|
3.9 |
% |
|
|
|
|
|
|
|
|
|
|
|
|
|
|
|
|
|
|
|
AFFO per common share: |
|
|
|
|
|
|
|
|
|
|
|
|
|
|
|
|
|
|
As reported |
|
$ |
0.82 |
|
|
$ |
0.81 |
|
|
|
1.2 |
% |
|
$ |
3.26 |
|
|
$ |
3.21 |
|
|
|
1.6 |
% |
Adjusted(3) |
|
$ |
0.82 |
|
|
$ |
0.79 |
|
|
|
3.8 |
% |
|
$ |
3.24 |
|
|
$ |
3.13 |
|
|
|
3.5 |
% |
|
|
(1) |
Excludes the cash basis rent repayments from the Rent Deferral Lease Amendments table above. |
(2) |
During the quarter ended December 31, 2023, one tenant was reclassified to accrual basis for accounting purposes due to their improved qualitative and/or quantitative credit factors, which resulted in an increase of accrued rent in the amount of $5,573. Adjusted figures exclude both the effects of the cash basis rent repayments from the Rent Deferral Lease Amendments table above and the accrued rent of $5,573. |
(2) |
Excludes the cash and accrual basis rent repayments from the Rent Deferral Lease Amendments table above. |
21
v3.24.0.1
Cover
|
Feb. 08, 2024 |
| Entity Information [Line Items] |
|
| Document Type |
8-K
|
| Amendment Flag |
false
|
| Document Period End Date |
Feb. 08, 2024
|
| Entity File Number |
001-11290
|
| Entity Registrant Name |
NNN REIT, INC.
|
| Entity Central Index Key |
0000751364
|
| Entity Incorporation, State or Country Code |
MD
|
| Entity Tax Identification Number |
56-1431377
|
| Entity Address, Address Line One |
450 South Orange Avenue
|
| Entity Address, Address Line Two |
Suite 900
|
| Entity Address, City or Town |
Orlando
|
| Entity Address, State or Province |
FL
|
| Entity Address, Postal Zip Code |
32801
|
| City Area Code |
407
|
| Local Phone Number |
265-7348
|
| Title of 12(b) Security |
Common Stock, $0.01 par value
|
| Trading Symbol |
NNN
|
| Security Exchange Name |
NYSE
|
| Entity Emerging Growth Company |
false
|
| Written Communications |
false
|
| Soliciting Material |
false
|
| Pre-commencement Tender Offer |
false
|
| Pre-commencement Issuer Tender Offer |
false
|
| X |
- DefinitionBoolean flag that is true when the XBRL content amends previously-filed or accepted submission.
| Name: |
dei_AmendmentFlag |
| Namespace Prefix: |
dei_ |
| Data Type: |
xbrli:booleanItemType |
| Balance Type: |
na |
| Period Type: |
duration |
|
| X |
- DefinitionFor the EDGAR submission types of Form 8-K: the date of the report, the date of the earliest event reported; for the EDGAR submission types of Form N-1A: the filing date; for all other submission types: the end of the reporting or transition period. The format of the date is YYYY-MM-DD.
| Name: |
dei_DocumentPeriodEndDate |
| Namespace Prefix: |
dei_ |
| Data Type: |
xbrli:dateItemType |
| Balance Type: |
na |
| Period Type: |
duration |
|
| X |
- DefinitionThe type of document being provided (such as 10-K, 10-Q, 485BPOS, etc). The document type is limited to the same value as the supporting SEC submission type, or the word 'Other'.
| Name: |
dei_DocumentType |
| Namespace Prefix: |
dei_ |
| Data Type: |
dei:submissionTypeItemType |
| Balance Type: |
na |
| Period Type: |
duration |
|
| X |
- DefinitionAddress Line 1 such as Attn, Building Name, Street Name
| Name: |
dei_EntityAddressAddressLine1 |
| Namespace Prefix: |
dei_ |
| Data Type: |
xbrli:normalizedStringItemType |
| Balance Type: |
na |
| Period Type: |
duration |
|
| X |
- DefinitionAddress Line 2 such as Street or Suite number
| Name: |
dei_EntityAddressAddressLine2 |
| Namespace Prefix: |
dei_ |
| Data Type: |
xbrli:normalizedStringItemType |
| Balance Type: |
na |
| Period Type: |
duration |
|
| X |
- Definition
+ References
+ Details
| Name: |
dei_EntityAddressCityOrTown |
| Namespace Prefix: |
dei_ |
| Data Type: |
xbrli:normalizedStringItemType |
| Balance Type: |
na |
| Period Type: |
duration |
|
| X |
- DefinitionCode for the postal or zip code
| Name: |
dei_EntityAddressPostalZipCode |
| Namespace Prefix: |
dei_ |
| Data Type: |
xbrli:normalizedStringItemType |
| Balance Type: |
na |
| Period Type: |
duration |
|
| X |
- DefinitionName of the state or province.
| Name: |
dei_EntityAddressStateOrProvince |
| Namespace Prefix: |
dei_ |
| Data Type: |
dei:stateOrProvinceItemType |
| Balance Type: |
na |
| Period Type: |
duration |
|
| X |
- DefinitionA unique 10-digit SEC-issued value to identify entities that have filed disclosures with the SEC. It is commonly abbreviated as CIK. Reference 1: http://www.xbrl.org/2003/role/presentationRef
-Publisher SEC
-Name Exchange Act
-Number 240
-Section 12
-Subsection b-2
| Name: |
dei_EntityCentralIndexKey |
| Namespace Prefix: |
dei_ |
| Data Type: |
dei:centralIndexKeyItemType |
| Balance Type: |
na |
| Period Type: |
duration |
|
| X |
- DefinitionIndicate if registrant meets the emerging growth company criteria. Reference 1: http://www.xbrl.org/2003/role/presentationRef
-Publisher SEC
-Name Exchange Act
-Number 240
-Section 12
-Subsection b-2
| Name: |
dei_EntityEmergingGrowthCompany |
| Namespace Prefix: |
dei_ |
| Data Type: |
xbrli:booleanItemType |
| Balance Type: |
na |
| Period Type: |
duration |
|
| X |
- DefinitionCommission file number. The field allows up to 17 characters. The prefix may contain 1-3 digits, the sequence number may contain 1-8 digits, the optional suffix may contain 1-4 characters, and the fields are separated with a hyphen.
| Name: |
dei_EntityFileNumber |
| Namespace Prefix: |
dei_ |
| Data Type: |
dei:fileNumberItemType |
| Balance Type: |
na |
| Period Type: |
duration |
|
| X |
- DefinitionTwo-character EDGAR code representing the state or country of incorporation.
| Name: |
dei_EntityIncorporationStateCountryCode |
| Namespace Prefix: |
dei_ |
| Data Type: |
dei:edgarStateCountryItemType |
| Balance Type: |
na |
| Period Type: |
duration |
|
| X |
- DefinitionThe exact name of the entity filing the report as specified in its charter, which is required by forms filed with the SEC. Reference 1: http://www.xbrl.org/2003/role/presentationRef
-Publisher SEC
-Name Exchange Act
-Number 240
-Section 12
-Subsection b-2
| Name: |
dei_EntityRegistrantName |
| Namespace Prefix: |
dei_ |
| Data Type: |
xbrli:normalizedStringItemType |
| Balance Type: |
na |
| Period Type: |
duration |
|
| X |
- DefinitionThe Tax Identification Number (TIN), also known as an Employer Identification Number (EIN), is a unique 9-digit value assigned by the IRS. Reference 1: http://www.xbrl.org/2003/role/presentationRef
-Publisher SEC
-Name Exchange Act
-Number 240
-Section 12
-Subsection b-2
| Name: |
dei_EntityTaxIdentificationNumber |
| Namespace Prefix: |
dei_ |
| Data Type: |
dei:employerIdItemType |
| Balance Type: |
na |
| Period Type: |
duration |
|
| X |
- DefinitionLocal phone number for entity.
| Name: |
dei_LocalPhoneNumber |
| Namespace Prefix: |
dei_ |
| Data Type: |
xbrli:normalizedStringItemType |
| Balance Type: |
na |
| Period Type: |
duration |
|
| X |
- DefinitionBoolean flag that is true when the Form 8-K filing is intended to satisfy the filing obligation of the registrant as pre-commencement communications pursuant to Rule 13e-4(c) under the Exchange Act. Reference 1: http://www.xbrl.org/2003/role/presentationRef
-Publisher SEC
-Name Exchange Act
-Number 240
-Section 13e
-Subsection 4c
| Name: |
dei_PreCommencementIssuerTenderOffer |
| Namespace Prefix: |
dei_ |
| Data Type: |
xbrli:booleanItemType |
| Balance Type: |
na |
| Period Type: |
duration |
|
| X |
- DefinitionBoolean flag that is true when the Form 8-K filing is intended to satisfy the filing obligation of the registrant as pre-commencement communications pursuant to Rule 14d-2(b) under the Exchange Act. Reference 1: http://www.xbrl.org/2003/role/presentationRef
-Publisher SEC
-Name Exchange Act
-Number 240
-Section 14d
-Subsection 2b
| Name: |
dei_PreCommencementTenderOffer |
| Namespace Prefix: |
dei_ |
| Data Type: |
xbrli:booleanItemType |
| Balance Type: |
na |
| Period Type: |
duration |
|
| X |
- DefinitionTitle of a 12(b) registered security. Reference 1: http://www.xbrl.org/2003/role/presentationRef
-Publisher SEC
-Name Exchange Act
-Number 240
-Section 12
-Subsection b
| Name: |
dei_Security12bTitle |
| Namespace Prefix: |
dei_ |
| Data Type: |
dei:securityTitleItemType |
| Balance Type: |
na |
| Period Type: |
duration |
|
| X |
- DefinitionName of the Exchange on which a security is registered. Reference 1: http://www.xbrl.org/2003/role/presentationRef
-Publisher SEC
-Name Exchange Act
-Number 240
-Section 12
-Subsection d1-1
| Name: |
dei_SecurityExchangeName |
| Namespace Prefix: |
dei_ |
| Data Type: |
dei:edgarExchangeCodeItemType |
| Balance Type: |
na |
| Period Type: |
duration |
|
| X |
- DefinitionBoolean flag that is true when the Form 8-K filing is intended to satisfy the filing obligation of the registrant as soliciting material pursuant to Rule 14a-12 under the Exchange Act. Reference 1: http://www.xbrl.org/2003/role/presentationRef
-Publisher SEC
-Name Exchange Act
-Section 14a
-Number 240
-Subsection 12
| Name: |
dei_SolicitingMaterial |
| Namespace Prefix: |
dei_ |
| Data Type: |
xbrli:booleanItemType |
| Balance Type: |
na |
| Period Type: |
duration |
|
| X |
- DefinitionTrading symbol of an instrument as listed on an exchange.
| Name: |
dei_TradingSymbol |
| Namespace Prefix: |
dei_ |
| Data Type: |
dei:tradingSymbolItemType |
| Balance Type: |
na |
| Period Type: |
duration |
|
| X |
- DefinitionBoolean flag that is true when the Form 8-K filing is intended to satisfy the filing obligation of the registrant as written communications pursuant to Rule 425 under the Securities Act. Reference 1: http://www.xbrl.org/2003/role/presentationRef
-Publisher SEC
-Name Securities Act
-Number 230
-Section 425
| Name: |
dei_WrittenCommunications |
| Namespace Prefix: |
dei_ |
| Data Type: |
xbrli:booleanItemType |
| Balance Type: |
na |
| Period Type: |
duration |
|
NNN REIT (NYSE:NNN)
Historical Stock Chart
Von Apr 2024 bis Mai 2024

NNN REIT (NYSE:NNN)
Historical Stock Chart
Von Mai 2023 bis Mai 2024
