Form NPORT-P - Monthly Portfolio Investments Report on Form N-PORT (Public)
25 Oktober 2024 - 3:59PM
Edgar (US Regulatory)
|
Tortoise Energy Independence Fund
|
|
|
Schedule of Investments
|
|
|
August 31, 2024 (Unaudited)
|
|
| |
|
|
COMMON STOCKS - 93.9%
|
|
Shares
|
|
|
Value
|
|
|
Canada Crude Oil Pipelines - 1.4%
|
|
|
|
|
|
Enbridge, Inc. (c)
|
|
|
23,865
|
|
|
$
|
958,896
|
|
| |
|
|
|
|
|
|
|
|
|
Canada Natural Gas/Natural Gas Liquids Pipelines - 1.4%
|
|
|
|
|
|
|
TC Energy Corp.
|
|
|
19,745
|
|
|
|
914,983
|
|
| |
|
|
|
|
|
|
|
|
|
Canada Oil and Gas Production - 2.5%
|
|
|
|
|
|
|
Suncor Energy, Inc.
|
|
|
40,528
|
|
|
|
1,643,005
|
|
| |
|
|
|
|
|
|
|
|
|
United States Natural Gas Gathering/Processing - 3.7%
|
|
|
|
|
|
|
Kinetik Holdings, Inc. (c)
|
|
|
5,678
|
|
|
|
251,194
|
|
|
Kodiak Gas Services, Inc. (c)
|
|
|
79,293
|
|
|
|
2,200,381
|
|
| |
|
|
|
|
|
|
2,451,575
|
|
| |
|
|
|
|
|
|
|
|
|
United States Natural Gas/Natural Gas Liquids Pipelines - 26.4%
|
|
|
|
|
|
|
Cheniere Energy, Inc. (c)
|
|
|
37,456
|
|
|
|
6,939,098
|
|
|
Excelerate Energy, Inc. - Class A (c)
|
|
|
6,209
|
|
|
|
113,190
|
|
|
Kinder Morgan, Inc. (c)
|
|
|
56,165
|
|
|
|
1,211,479
|
|
|
NextDecade Corp. (a)
|
|
|
55,204
|
|
|
|
257,251
|
|
|
ONEOK, Inc.
|
|
|
19,585
|
|
|
|
1,808,871
|
|
|
Targa Resources Corp.
|
|
|
37,880
|
|
|
|
5,564,572
|
|
|
The Williams Companies, Inc.
|
|
|
36,175
|
|
|
|
1,655,730
|
|
| |
|
|
|
|
|
|
17,550,191
|
|
| |
|
|
|
|
|
|
|
|
|
United States Oil and Gas Production - 53.5%
|
|
|
|
|
|
|
Chevron Corp. (c)
|
|
|
18,828
|
|
|
|
2,785,602
|
|
|
ConocoPhillips (c)
|
|
|
21,747
|
|
|
|
2,474,591
|
|
|
Coterra Energy, Inc. (c)
|
|
|
50,396
|
|
|
|
1,226,135
|
|
|
Devon Energy Corp. (c)
|
|
|
71,583
|
|
|
|
3,205,487
|
|
|
Diamondback Energy, Inc.
|
|
|
37,179
|
|
|
|
7,253,995
|
|
|
EOG Resources, Inc. (c)
|
|
|
23,070
|
|
|
|
2,971,877
|
|
|
EQT Corp. (c)
|
|
|
117,402
|
|
|
|
3,934,141
|
|
|
Exxon Mobil Corp. (c)
|
|
|
58,830
|
|
|
|
6,938,410
|
|
|
Marathon Oil Corp. (c)
|
|
|
81,694
|
|
|
|
2,340,533
|
|
|
Occidental Petroleum Corp.
|
|
|
43,302
|
|
|
|
2,467,348
|
|
| |
|
|
|
|
|
|
35,598,119
|
|
| |
|
|
|
|
|
|
|
|
|
United States Other - 2.2%
|
|
|
|
|
|
|
Baker Hughes Co. (c)
|
|
|
38,763
|
|
|
|
1,363,295
|
|
|
Darling Ingredients, Inc. (a) (c)
|
|
|
1,957
|
|
|
|
81,665
|
|
| |
|
|
|
|
|
|
1,444,960
|
|
| |
|
|
|
|
|
|
|
|
|
United States Renewables and Power Infrastructure - 2.8%
|
|
|
|
|
|
|
American Electric Power Co., Inc. (c)
|
|
|
2,921
|
|
|
|
292,918
|
|
|
Constellation Energy Corp. (c)
|
|
|
8,071
|
|
|
|
1,587,566
|
|
| |
|
|
|
|
|
|
1,880,484
|
|
|
TOTAL COMMON STOCKS (Cost $33,502,712)
|
|
|
|
62,442,213
|
|
| |
|
|
|
|
|
|
|
|
|
MASTER LIMITED PARTNERSHIPS - 21.8%
|
|
Units
|
|
|
Value
|
|
|
United States Natural Gas Gathering/Processing - 4.2%
|
|
|
|
|
|
|
Western Midstream Partners LP
|
|
|
72,535
|
|
|
|
2,798,400
|
|
| |
|
|
|
|
|
|
|
|
|
United States Natural Gas/Natural Gas Liquids Pipelines - 11.0%
|
|
|
|
|
|
|
Energy Transfer LP (c)
|
|
|
293,256
|
|
|
|
4,721,422
|
|
|
Enterprise Products Partners LP (c)
|
|
|
89,274
|
|
|
|
2,619,299
|
|
| |
|
|
|
|
|
|
7,340,721
|
|
| |
|
|
|
|
|
|
|
|
|
United States Oil and Gas Production - 2.3%
|
|
|
|
|
|
|
Mach Natural Resources LP (c)
|
|
|
26,315
|
|
|
|
508,406
|
|
|
TXO Partners LP
|
|
|
50,000
|
|
|
|
1,000,000
|
|
| |
|
|
|
|
|
|
1,508,406
|
|
| |
|
|
|
|
|
|
|
|
|
United States Refined Product Pipelines - 4.3%
|
|
|
|
|
|
|
MPLX LP (c)
|
|
|
66,440
|
|
|
|
2,848,947
|
|
|
TOTAL MASTER LIMITED PARTNERSHIPS (Cost $8,667,405)
|
|
|
|
14,496,474
|
|
| |
|
|
|
|
|
|
|
|
|
SHORT-TERM INVESTMENTS - 0.6%
|
|
|
|
|
|
|
|
|
|
Money Market Funds - 0.6%
|
|
Shares
|
|
|
|
|
|
|
Invesco Government & Agency Portfolio - Class Institutional, 5.19% (b)
|
|
|
370,650
|
|
|
|
370,650
|
|
|
TOTAL SHORT-TERM INVESTMENTS
(Cost $370,650)
|
|
|
|
370,650
|
|
| |
|
|
|
|
|
|
|
|
|
TOTAL INVESTMENTS - 116.3% (Cost
$42,540,767)
|
|
|
|
77,309,337
|
|
|
Other Assets in Excess of Liabilities - 0.1%
Credit Facility Borrowings – (16.4)%
|
|
|
|
43,849
(10,900,000
|
)
|
|
TOTAL NET ASSETS - 100.0%
|
|
|
|
|
|
$
|
66,453,186
|
|
| |
|
|
|
|
|
|
|
|
|
Percentages are stated as a percent of net assets.
|
|
|
|
|
|
|
(a)
|
Non-income producing security.
|
|
(b)
(c)
|
The rate shown represents the 7-day annualized effective yield as of August 31, 2024.
All or a portion of the security is segregated as collateral for the margin borrowing facility.
|
Summary of Fair Value Disclosure as of August 31, 2024 (Unaudited)
Tortoise Energy Independence Fund has adopted authoritative fair value accounting standards which establish an authoritative definition of
fair value and set out a hierarchy for measuring fair value. These standards require additional disclosures about the various inputs and valuation techniques used to develop the measurements of fair value, a discussion of changes in valuation
techniques and related inputs during the period, and expanded disclosure of valuation levels for major security types. These inputs are summarized in the three broad levels listed below. The inputs or methodology used for valuing securities are not
an indication of the risk associated with investing in those securities.
Level 1 - Unadjusted quoted prices in active markets for identical assets or liabilities that the Fund has the ability to access.
Level 2 - Observable inputs other than quoted prices included in Level 1 that are observable for the asset or liability, either directly or
indirectly. These inputs may include quoted prices for the identical instrument on an inactive market, prices for similar instruments, interest rates, prepayment speeds, credit risk, yield curves, default rates and similar data.
Level 3 - Unobservable inputs for the asset or liability, to the extent relevant observable inputs are not available, representing the
Fund’s own assumptions about the assumptions a market participant would use in valuing the asset or liability, and would be based on the best information available.
The following is a summary of the fair valuation hierarchy of the Fund’s securities as of August 31, 2024:
| |
|
Level 1
|
|
|
Level 2
|
|
|
Level 3
|
|
|
Total
|
|
|
Investments:
|
|
|
|
|
|
|
|
|
|
|
|
|
|
Common Stocks
|
|
$
|
62,442,213
|
|
|
$
|
–
|
|
|
$
|
–
|
|
|
$
|
62,442,213
|
|
|
Master Limited Partnerships
|
|
|
14,496,474
|
|
|
|
–
|
|
|
|
–
|
|
|
|
14,496,474
|
|
|
Money Market Funds
|
|
|
370,650
|
|
|
|
–
|
|
|
|
–
|
|
|
|
370,650
|
|
|
Total Investments
|
|
$
|
77,309,337
|
|
|
$
|
–
|
|
|
$
|
–
|
|
|
$
|
77,309,337
|
|
| |
|
|
Refer to the Schedule of Investments for further disaggregation of investment categories.
|
|
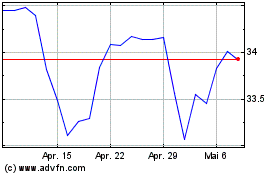
Tortoise Energy Independ... (NYSE:NDP)
Historical Stock Chart
Von Dez 2024 bis Jan 2025

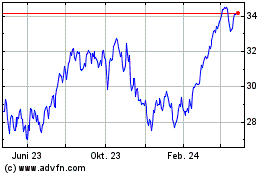
Tortoise Energy Independ... (NYSE:NDP)
Historical Stock Chart
Von Jan 2024 bis Jan 2025
