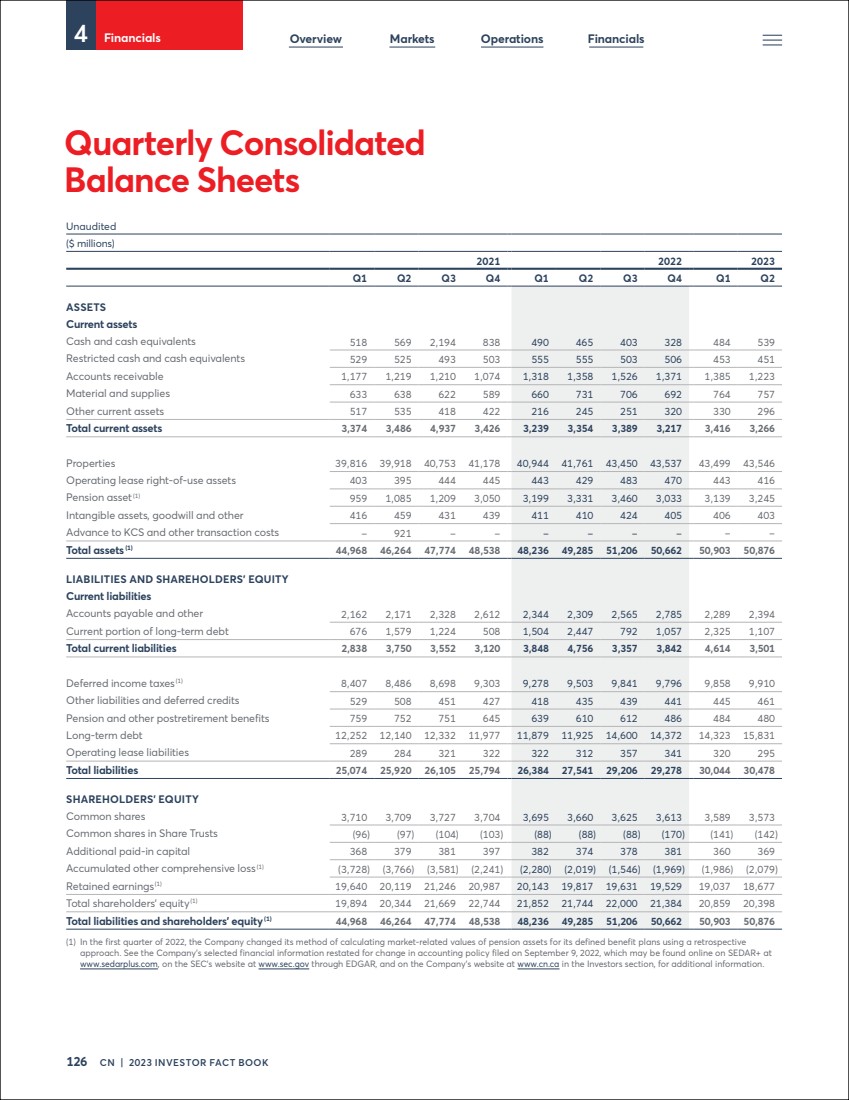
| Quarterly Consolidated
Balance Sheets
Unaudited
($ millions)
2021 2022 2023
Q1 Q2 Q3 Q4 Q1 Q2 Q3 Q4 Q1 Q2
ASSETS
Current assets
Cash and cash equivalents 518 569 2,194 838 490 465 403 328 484 539
Restricted cash and cash equivalents 529 525 493 503 555 555 503 506 453 451
Accounts receivable 1,177 1,219 1,210 1,074 1,318 1,358 1,526 1,371 1,385 1,223
Material and supplies 633 638 622 589 660 731 706 692 764 757
Other current assets 517 535 418 422 216 245 251 320 330 296
Total current assets 3,374 3,486 4,937 3,426 3,239 3,354 3,389 3,217 3,416 3,266
Properties 39,816 39,918 40,753 41,178 40,944 41,761 43,450 43,537 43,499 43,546
Operating lease right-of-use assets 403 395 444 445 443 429 483 470 443 416
Pension asset(1) 959 1,085 1,209 3,050 3,199 3,331 3,460 3,033 3,139 3,245
Intangible assets, goodwill and other 416 459 431 439 411 410 424 405 406 403
Advance to KCS and other transaction costs - 921 - - - - - - – –
Total assets (1) 44,968 46,264 47,774 48,538 48,236 49,285 51,206 50,662 50,903 50,876
LIABILITIES AND SHAREHOLDERS’ EQUITY
Current liabilities
Accounts payable and other 2,162 2,171 2,328 2,612 2,344 2,309 2,565 2,785 2,289 2,394
Current portion of long-term debt 676 1,579 1,224 508 1,504 2,447 792 1,057 2,325 1,107
Total current liabilities 2,838 3,750 3,552 3,120 3,848 4,756 3,357 3,842 4,614 3,501
Deferred income taxes(1) 8,407 8,486 8,698 9,303 9,278 9,503 9,841 9,796 9,858 9,910
Other liabilities and deferred credits 529 508 451 427 418 435 439 441 445 461
Pension and other postretirement benefits 759 752 751 645 639 610 612 486 484 480
Long-term debt 12,252 12,140 12,332 11,977 11,879 11,925 14,600 14,372 14,323 15,831
Operating lease liabilities 289 284 321 322 322 312 357 341 320 295
Total liabilities 25,074 25,920 26,105 25,794 26,384 27,541 29,206 29,278 30,044 30,478
SHAREHOLDERS’ EQUITY
Common shares 3,710 3,709 3,727 3,704 3,695 3,660 3,625 3,613 3,589 3,573
Common shares in Share Trusts (96) (97) (104) (103) (88) (88) (88) (170) (141) (142)
Additional paid-in capital 368 379 381 397 382 374 378 381 360 369
Accumulated other comprehensive loss(1) (3,728) (3,766) (3,581) (2,241) (2,280) (2,019) (1,546) (1,969) (1,986) (2,079)
Retained earnings(1) 19,640 20,119 21,246 20,987 20,143 19,817 19,631 19,529 19,037 18,677
Total shareholders’ equity(1) 19,894 20,344 21,669 22,744 21,852 21,744 22,000 21,384 20,859 20,398
Total liabilities and shareholders' equity (1) 44,968 46,264 47,774 48,538 48,236 49,285 51,206 50,662 50,903 50,876
(1) In the first quarter of 2022, the Company changed its method of calculating market-related values of pension assets for its defined benefit plans using a retrospective
approach. See the Company’s selected financial information restated for change in accounting policy filed on September 9, 2022, which may be found online on SEDAR+ at
www.sedarplus.com, on the SEC’s website at www.sec.gov through EDGAR, and on the Company’s website at www.cn.ca in the Investors section, for additional information.
4 Financials Overview Markets Operations Financials
126 CN | 2023 INVESTOR FACT BOOK |