Filed by Apollo Tactical Income Fund Inc.
pursuant to Rule 425 under the Securities Act of 1933
Subject Company: Apollo Tactical Income Fund Inc.
Commission File No. 811-22591
Date: March 4, 2024

MidCap Financial Investment Corporation Investor Presentation March 2024
Unless otherwise noted, information as of December 31, 2023. Confidential and Proprietary - Not for distribution, in whole or in part, without the express written consent of Apollo Global Management, Inc. It should not be assumed that investments
made in the future will be profitable or will equal the performance of the investments shown in this document.

Disclaimers, Definitions and Important Notes Forward-Looking Statements
statements, whether as a result of new information, future events or otherwise, you are advised to consult any additional disclosures that they may make directly to you or through reports that MFIC, AFT, and/or AIF Some of the statements in this
presentation constitute forward-looking statements because they relate to in the future may file with the Securities and Exchange Commission (“SEC”), including the Joint Proxy future events, future performance or financial condition. The
forward-looking statements may include Statement and the Registration Statement (in each case, as defined below), annual reports on Form 10-K, statements as to: future operating results of MidCap Financial Investment Corporation (the
“Corporation”, the annual reports on Form N-CSR, quarterly reports on Form 10-Q, semi-annual reports on Form N-CSRS and “Company” or “MFIC”, Apollo Senior Floating Rate Fund Inc. (“AFT”), and Apollo
Tactical Income Fund Inc. current reports on Form 8-K. (“AIF”), and distribution projections; business prospects of MFIC, AFT, and AIF, and the prospects of their portfolio companies, if applicable; and the impact of the investments that
MFIC, AFT, and AIF expect to make. In addition, words such as “anticipate,” “believe,” “expect,” “seek,” “plan,” “should,” “estimate,” “project” and Past
Performance “intend” indicate forward-looking statements, although not all forward-looking statements include these words. The forward-looking statements contained in this presentation involve risks and uncertainties. Certain Past
performance is not indicative nor a guarantee of future returns, the realization of which is dependent on many factors, many of which are beyond the control of Apollo Global Management, Inc., MFIC Adviser, Apollo factors could cause actual results
and conditions to differ materially from those projected, including the Credit Management LLC, MFIC, AFT, and AIF. There can be no assurances that future dividends will match or uncertainties associated with (i) the ability of the parties to
consummate one or both of the Mergers (as exceed historic ones, or that they will be made at all. Net returns give effect to all fees and expenses. Unless defined below) contemplated by the Merger Agreement among MFIC, AFT and certain other parties
thereto otherwise noted, information included herein is presented as of the date indicated on the cover page and and the Merger Agreement among MFIC, AIF and certain other parties thereto on the expected timeline, or at all; (ii) the expected
synergies and savings associated with the Mergers; (iii) the ability to realize the may change at any time without notice. MFIC, AFT and AIF are subject to certain significant risks relating to their businesses and investment objectives. For more
detailed information on risks relating to MFIC, AFT and anticipated benefits of the Mergers, including the expected elimination of certain expenses and costs due to AIF, see the latest annual reports on Form 10-K, annual reports on Form N-CSR,
quarterly reports on Form the Mergers; (iv) the percentage of the stockholders of MFIC, AFT, and AIF voting in favor of the applicable 10-Q, semi-annual reports on Form N-CSRS and current reports on Form 8-K, as applicable. Proposals (as defined
below); (v) the possibility that competing offers or acquisition proposals will be made; (vi) the possibility that any or all of the various conditions to the consummation of the Mergers may not be satisfied or waived; (vii) risks related to
diverting management’s attention from ongoing business operations; Financial Data (viii) the combined company’s plans, expectations, objectives and intentions, as a result of the Mergers; (ix) any potential termination of one or both
merger agreements; (x) the future operating results and net Financial data used in this presentation for the periods shown is from MFIC's, AFT's and AIF's Form 10-K, investment income projections of MFIC, AIF, AFT or, following the closing of one or
both of the Mergers, the Form N-CSR, Form 10-Q and Form N-CSRS filings, as applicable, with the SEC during such periods. Unless combined company; (xi) the ability of Apollo Investment Management L.P. (“MFIC Adviser”) to implement
otherwise indicated, the numbers shown herein are rounded and unaudited. Quarterly, semi-annual, and MFIC Adviser’s future plans with respect to the combined company; (xii) the ability of MFIC Adviser and its annual financial information for
MFIC, AFT, and AIF refers to fiscal periods. All share and per share data affiliates to attract and retain highly talented professionals; (xiii) the business prospects of MFIC, AIF, AFT or, shown herein is adjusted for the one-for-three reverse
stock split of MFIC’s common stock which took effect following the closing of one or both of the Mergers, the combined company and the prospects of their at the close of business on November 30, 2018. portfolio companies; (xiv) the impact of
the investments that MFIC, AIF, AFT or, following the closing of one or both of the Mergers, the combined company expect to make; (xv) the ability of the portfolio companies of MFIC, AIF, AFT or, following the closing of one or both of the Mergers,
the combined company to achieve Additional Important Disclosure their objectives; (xvi) the expected financings and investments and additional leverage that MFIC, AIF, AFT or, This presentation is confidential and may not be distributed, transmitted
or otherwise communicated to following the closing of one or both of the Mergers, the combined company may seek to incur in the future; others, in whole or in part, without the express written consent of Apollo Global Management, Inc. (together
(xvii) the adequacy of the cash resources and working capital of MFIC, AIF, AFT or, following the closing of with its subsidiaries, “Apollo”) and is intended solely for the use of the persons to whom it has been one or both of the
Mergers, the combined company; (xviii) the timing of cash flows, if any, from the delivered. This presentation does not constitute an offer to sell, or the solicitation of an offer to buy, any operations of the portfolio companies of MFIC, AIF, AFT
or, following the closing of one or both of the security, product or service. This presentation and the transactions, investments, products, services, securities Mergers, the combined company; (xix) future changes in laws or regulations (including
the interpretation of or other financial instruments referred to in this presentation are not directed to, or intended for distribution these laws and regulations by regulatory authorities); and (xx) the risk that stockholder litigation in to or use
by, any person or entity who is a citizen or resident of or located in any locality, state, country or connection with one or both of the Mergers may result in significant costs of defense and liability. MFIC, AFT, other jurisdiction where such
distribution, publication, availability or use would be contrary to any laws or and AIF have based the forward-looking statements included in this press release on information available to regulations. Recipients may only use this presentation to
the extent permitted by the applicable laws and them on the date hereof, and they assume no obligation to update any such forward-looking statements. 2 regulations and should be aware of and observe all such applicable laws and regulations. Although
MFIC, AFT, and AIF undertake no obligation to revise or update any forward-looking
Disclaimers, Definitions and Important Notes “Assets Under
Management”, or “AUM”, refers to the assets of the funds, partnerships and accounts to No Offer or Solicitation which Apollo provides investment management, advisory, or certain other investment-related services, This Presentation
is not, and under no circumstances is it to be construed as, a prospectus or an including, without limitation, capital that such funds, partnerships and accounts have the right to call from advertisement and the communication of this Presentation is
not, and under no circumstances is it to be investors pursuant to capital commitments. AUM equals the sum of: construed as, an offer to sell or a solicitation of an offer to purchase any securities in MFIC, AFT or AIF or in 1. The net asset value
(“NAV”), plus used or available leverage and/or capital commitments, or gross assets any fund or other investment vehicle managed by Apollo or any of its affiliates. plus capital commitments, of the yield and certain hybrid funds,
partnerships and accounts for which we Additional Information and Where to Find It provide investment management or advisory services, other than certain collateralized loan obligations (“CLOs”), collateralized debt obligations
(“CDOs”), and certain perpetual capital vehicles, which have a fee- This presentation relates to the proposed Mergers (as defined below) and certain related matters (the generating basis other than the mark-to-market value of the
underlying assets; for certain perpetual “Proposals”). In connection with the Proposals, MFIC, AFT, and AIF will file with the SEC and mail to their capital vehicles in yield, gross asset value plus available financing capacity;
respective stockholders a joint proxy statement on Schedule 14A (the “Joint Proxy Statement”), and MFIC will file with the SEC a registration statement that includes the Joint Proxy Statement and a prospectus of MFIC 2. The fair value of
the investments of equity and certain hybrid funds, partnerships and accounts Apollo manages or advise, plus the capital that such funds, partnerships and accounts are entitled to call from (the “Registration Statement”). The Joint Proxy
Statement and the Registration Statement will each contain investors pursuant to capital commitments, plus portfolio level financings; important information about MFIC, AFT, AIF and the Proposals. This communication does not constitute an offer to
sell or the solicitation of an offer to buy any securities or a solicitation of any vote or approval. No 3. The gross asset value associated with the reinsurance investments of the portfolio company assets Apollo offer of securities shall be made
except by means of a prospectus meeting the requirements of Section 10 of manages or advises; and the Securities Act. STOCKHOLDERS OF MFIC, AFT, and AIF ARE URGED TO READ THE JOINT PROXY 4. The fair value of any other assets that Apollo manages or
advises for the funds, partnerships and accounts STATEMENT AND REGISTRATION STATEMENT, AND OTHER DOCUMENTS THAT ARE FILED OR WILL to which Apollo provides investment management, advisory, or certain other investment-related services, BE FILED WITH
THE SEC, AS WELL AS ANY AMENDMENTS OR SUPPLEMENTS TO THESE DOCUMENTS, plus unused credit facilities, including capital commitments to such funds, partnerships and accounts for CAREFULLY AND IN THEIR ENTIRETY WHEN THEY BECOME AVAILABLE BECAUSE THEY
WILL CONTAIN investments that may require pre-qualification or other conditions before investment plus any other IMPORTANT INFORMATION ABOUT MFIC, AFT, and AIF AND THE PROPOSALS. Investors and security capital commitments to such funds, partnerships
and accounts available for investment that are not holders will be able to obtain the documents filed with the SEC free of charge at the SEC’s website, otherwise included in the clauses above. http://www.sec.gov or, for documents filed by
MFIC, from MFIC’s website at https://www.midcapfinancialic.com, and, for documents filed by AFT, from AFT’s website at Apollo’s AUM measure includes Assets Under Management for which Apollo charges either nominal or zero
https://www.apollofunds.com/apollo-senior-floating-rate-fund, and, for documents filed by AIF, from AIF’s fees. Apollo’s AUM measure also includes assets for which Apollo does not have investment discretion, website at
https://www.apollofunds.com/apollo-tactical-income-fund#shareholders. including certain assets for which Apollo earns only investment-related service fees, rather than management or advisory fees. Apollo’s definition of AUM is not based on any
definition of Assets Under Management contained in its governing documents or in any management agreements of the funds Apollo manages. Participants in the Solicitation Apollo considers multiple factors for determining what should be included in its
definition of AUM. Such factors include but are not limited to (1) Apollo’s ability to influence the investment decisions for existing and MFIC, its directors, certain of its executive officers and certain employees and officers of MFIC
Adviser and its available assets; (2) Apollo’s ability to generate income from the underlying assets in funds it manages; and affiliates may be deemed to be participants in the solicitation of proxies in connection with the Proposals. (3) the
AUM measures that Apollo uses internally or believe are used by other investment managers. Given Information about the directors and executive officers of MFIC is set forth in its proxy statement for its 2023 the differences in the investment
strategies and structures among other alternative investment managers, Annual Meeting of Stockholders, which was filed with the SEC on May 1, 2023. AFT, AIF, their directors, Apollo’s calculation of AUM may differ from the calculations
employed by other investment managers and, as certain of their executive officers and certain employees and officers of Apollo Credit Management, LLC and a result, this measure may not be directly comparable to similar measures presented by other
investment its affiliates may be deemed to be participants in the solicitation of proxies in connection with the Proposals. managers. Apollo’s calculation also differs from the manner in which its affiliates registered with the SEC Information
about the directors and executive officers of AFT and AIF is set forth in the proxy statement for report “Regulatory Assets Under Management” on Form ADV Part I and Form PF in various ways. Apollo uses their 2023 Annual Meeting of
Stockholders, which was filed with the SEC on April 21, 2023. Information AUM, Gross capital deployed and Dry powder as performance measurements of its investment activities, as regarding the persons who may, under the rules of the SEC, be
considered participants in the solicitation of well as to monitor fund size in relation to professional resource and infrastructure needs. the MFIC, AFT, and AIF stockholders in connection with the Proposals is contained in the Joint Proxy
Statement. These documents may be obtained free of charge from the sources indicated above. 3
Introduction MFIC Investment Highlights Table of Contents MFIC
Accomplishment and Portfolio Review Proposed Mergers of MFIC, AFT, and AIF Conclusion Appendix 4

Introduction 5

INTRODUCTION MidCap Financial Investment Corporation (“MFIC”)
Positioned to be a Pure Play Senior Secured Middle Market BDC MFIC is a publicly traded (NASDAQ: Apollo is a high growth MFIC) business development company 1 MidCap Financial is a global alternative asset (“BDC”) treated as a regulated
investment leading lender to middle manager with approximately company (“RIC”) for tax purposes focused market companies 2 $651 billion of AUM and on investing primarily in senior secured manages both MidCap loans to middle market
companies 3 Financial and MFIC sourced from MidCap Financial’s portfolio and investments Strong Alignment of Interest % Equity Ownership in MFIC ü Apollo Global Management 3.8% 2 ü MidCap Financial 3.0% 4 ü MFIC Directors and
Officers 1.2% 1. MidCap Financial refers to MidCap FinCo Designated Activity Company, a designated activity company limited by shares incorporated under the laws of Ireland, and its subsidiaries, including MidCap Financial Services, LLC. MidCap
Financial is managed by Apollo Capital Management, L.P., a subsidiary of Apollo Global Management, Inc., pursuant to an investment management agreement between Apollo Capital Management, L.P. and MidCap FinCo Designated Activity Company. MidCap
Financial is not an investment adviser, subadviser or fiduciary to the Corporation or to the Corporation's Investment Adviser. MidCap Financial is not obligated to take into account the Corporation’s interests (or those of other potential
participants in assets sourced) when sourcing loans across its platform. 2. As of December 31, 2023. Please refer to the beginning of the presentation for the definition of AUM. 3. MidCap Financial is managed by Apollo Capital Management, L.P., a
subsidiary of Apollo Global Management, Inc. MidCap Financial Investment Corporation (“MFIC”) is managed by Apollo Investment Management, L.P., an affiliate of Apollo Global Management, Inc. 4. 6 Not Ee xc : N lud o g es u uar nves antte
ed e r thes att rtia cr ted ge s tst w ocill k b ue n a itsc.hieved.

INTRODUCTION MFIC Snapshot General Corporate Information Investment
Portfolio MFIC $2.33 billion Ticker Investment Portfolio NASDAQ Global Select 152 Exchange # of Portfolio Companies Net Assets $1.01 billion # of Industries 23 2 1 Kroll Bond Rating Agency BBB- / Stable Corporate Lending and Other % 92% Note: Past
performance is not indicative nor a guarantee of future results. Information as of December 31, 2023. At fair value, unless otherwise noted. 1. Kroll Bond Rating Agency rating affirmed in June 2023. 2. Corporate lending includes leveraged lending,
life sciences, franchise finance, asset based and lender finance. Excludes Merx Aviation and other select investments. 7
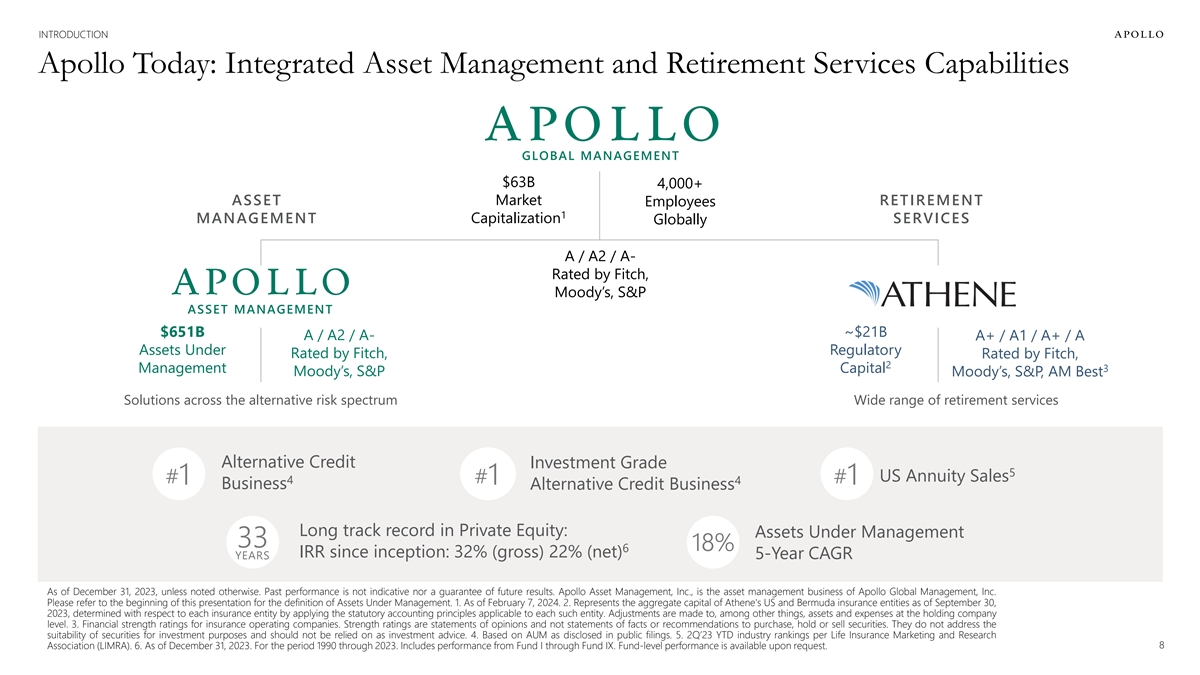
INTRODUCTION Apollo Today: Integrated Asset Management and Retirement
Services Capabilities GLOBAL MANAGEMENT $63B 4,000+ ASSET Market RETIREMENT Employees 1 MANAGEMENT Capitalization SERVICES Globally A / A2 / A- Rated by Fitch, Moody’s, S&P ASSET MANAGEMENT $651B ~$21B A / A2 / A- A+ / A1 / A+ / A Assets
Under Regulatory Rated by Fitch, Rated by Fitch, 2 Management Capital 3 Moody’s, S&P Moody’s, S&P, AM Best Solutions across the alternative risk spectrum Wide range of retirement services Alternative Credit Investment Grade 5 US
Annuity Sales 4 #1 #1 4 #1 Business Alternative Credit Business Long track record in Private Equity: Assets Under Management 33 18% 6 IRR since inception: 32% (gross) 22% (net) 5-Year CAGR YEARS As of December 31, 2023, unless noted otherwise. Past
performance is not indicative nor a guarantee of future results. Apollo Asset Management, Inc., is the asset management business of Apollo Global Management, Inc. Please refer to the beginning of this presentation for the definition of Assets Under
Management. 1. As of February 7, 2024. 2. Represents the aggregate capital of Athene's US and Bermuda insurance entities as of September 30, 2023, determined with respect to each insurance entity by applying the statutory accounting principles
applicable to each such entity. Adjustments are made to, among other things, assets and expenses at the holding company level. 3. Financial strength ratings for insurance operating companies. Strength ratings are statements of opinions and not
statements of facts or recommendations to purchase, hold or sell securities. They do not address the suitability of securities for investment purposes and should not be relied on as investment advice. 4. Based on AUM as disclosed in public filings.
5. 2Q’23 YTD industry rankings per Life Insurance Marketing and Research Association (LIMRA). 6. As of December 31, 2023. For the period 1990 through 2023. Includes performance from Fund I through Fund IX. Fund-level performance is available
upon request. 8

INTRODUCTION 1 MidCap Financial is a Leading Middle Market Lender Key
Members of Management Team Working Together Full-Service Finance Company Scaled Platform with Strong Credit Track Record 25+ Years • Founded in 2008 • Well-established provider of senior debt • Focused on senior debt solutions to
middle 2 Annual Originations solutions to middle market companies and market companies across multiple industries has what we believe to be an exceptionally • Extensive coverage of middle market strong track record through multiple ~ $15 Bn
sponsors economic cycles • Lead / sole lender on most transactions 3 • Privately-held by institutional investors and Commitments Managed / Serviced managed by a subsidiary of Apollo ~ $50 Bn Experienced Leadership Team Managed by Apollo
Employees • Headquartered in Bethesda, MD • Hub of Apollo’s private middle market credit ~ 300 business • Senior leadership of MidCap Financial has • Sources assets for its own balance sheet and deep industry expertise
-MidCap Financial & other blue chip lenders including Merrill for other Apollo-managed capital, including Global Offices MFIC Lynch Capital, GE Capital, and Heller Financial 12 Information as of December 31, 2023. 1. MidCap Financial refers to
MidCap FinCo Designated Activity Company, a designated activity company limited by shares incorporated under the laws of Ireland, and its subsidiaries, including MidCap Financial Services, LLC. MidCap Financial is managed by Apollo Capital
Management, L.P., a subsidiary of Apollo Global Management, Inc., pursuant to an investment management agreement between Apollo Capital Management, L.P. and MidCap FinCo Designated Activity Company. MidCap Financial is not an investment adviser,
subadviser or fiduciary to the Corporation or to the Corporation's Investment Adviser. MidCap Financial is not obligated to take into account the Corporation’s interests (or those of other potential participants in assets sourced) when
sourcing loans across its platform. 2. Based on last twelve months through December 31, 2023. 3. Includes commitments managed by MidCap Financial Services Capital 9 9 Management LLC, a registered investment adviser, as reported under Item 5.F on
Part 1 of its Form ADV. For more information about MidCap Financial, please visit http://www.midcapfinancial.com.

MFIC Investment Highlights 10

MFIC INVESTMENT HIGHLIGHTS MFIC Investment Highlights § Bank
retrenchment from lending expands opportunity set for non-bank lenders resulting in attractive environment for private credit origination Secular Tailwinds 1 § Value proposition for direct lending in terms of flexibility and reliability have
continued to drive increased market share for direct lending 1 1 § Primarily focused on senior secured middle market loans sourced from Midcap Financial’s portfolio and investments; MidCap Financial is a leading middle market lender with
a broad suite of financing solutions Robust Origination 2 Capabilities § Affiliation with Apollo provides significant benefits; Ability to co-invest with broader Apollo platform enhances ability to win deals on the 2 basis of size and certainty
of execution § Emphasis on first lien, cash pay, and diversification by sponsor, industry and end market Prudent Portfolio 3 Construction § Ability to participate in large commitments while maintaining granular positions
Shareholder-Friendly § Industry leading fee structure among listed BDCs supports MFIC’s senior secured investment strategy 4 Fee Structure 1. MidCap Financial refers to MidCap FinCo Designated Activity Company, a designated activity
company limited by shares incorporated under the laws of Ireland, and its subsidiaries, including MidCap Financial Services, LLC. MidCap Financial is managed by Apollo Capital Management, L.P., a subsidiary of Apollo Global Management, Inc.,
pursuant to an investment management agreement between Apollo Capital Management, L.P. and MidCap FinCo Designated Activity Company. MidCap Financial is not an investment adviser, subadviser or fiduciary to the Corporation or to the
Corporation’s Investment Adviser. MidCap Financial is not obligated to take into account the Corporation’s interests (or those of other potential participants in assets sourced) when sourcing loans across its platform. 2. On December 29,
2021, the Corporation received an exemptive order from the SEC, which was amended on January 10, 2023 (the “Order”), permitting greater flexibility to participate in co-investment transactions with certain of its affiliates where terms
other than price and quantity are negotiated, subject to the conditions included therein. The Order superseded a prior exemptive order received from the SEC on March 29, 2016. 11

MFIC INVESTMENT HIGHLIGHTS: SECULAR TAILWINDS Bank Continued Retrenchment
from Middle Market Lending Expands the 1 Opportunity for Non-Bank Lenders 1 2, 3 Total Number of U.S. Banks Continues to Decline Banks’ Reduced Participation in Loan Market 12,000 100% ~ 65%+ reduction in bank share of the loan market since
1994 50%+ decline since 2000 90% 10,000 80% 72% 70% 75% 8,000 60% 50% 6,000 40% 30% 25% 4,000 28% 20% 10% 2,000 0% 0 Banks & Securities Firms Non-banks 1. Source: FDIC as of September 30, 2023. FDIC-Insured commercial banks and savings
institutions. 2. Source: PitchBook LCD Quarterly Leveraged Lending Review 4Q 2023. Due to a significant decline in loan issuance in the last 12 months, LCD did not track enough observations to compile meaningful averages for investor analysis for
2023. 3. Non-banks includes institutional investors and finance companies. 12 2000 2001 2002 2003 2004 2005 2006 2007 2008 2009 2010 2011 2012 2013 2014 2015 2016 2017 2018 2019 2020 2021 2022 2023 1994 1995 1996 1997 1998 1999 2000 2001 2002 2003
2004 2005 2006 2007 2008 2009 2010 2011 2012 2013 2014 2015 2016 2017 2018 2019 2020 2021 2022
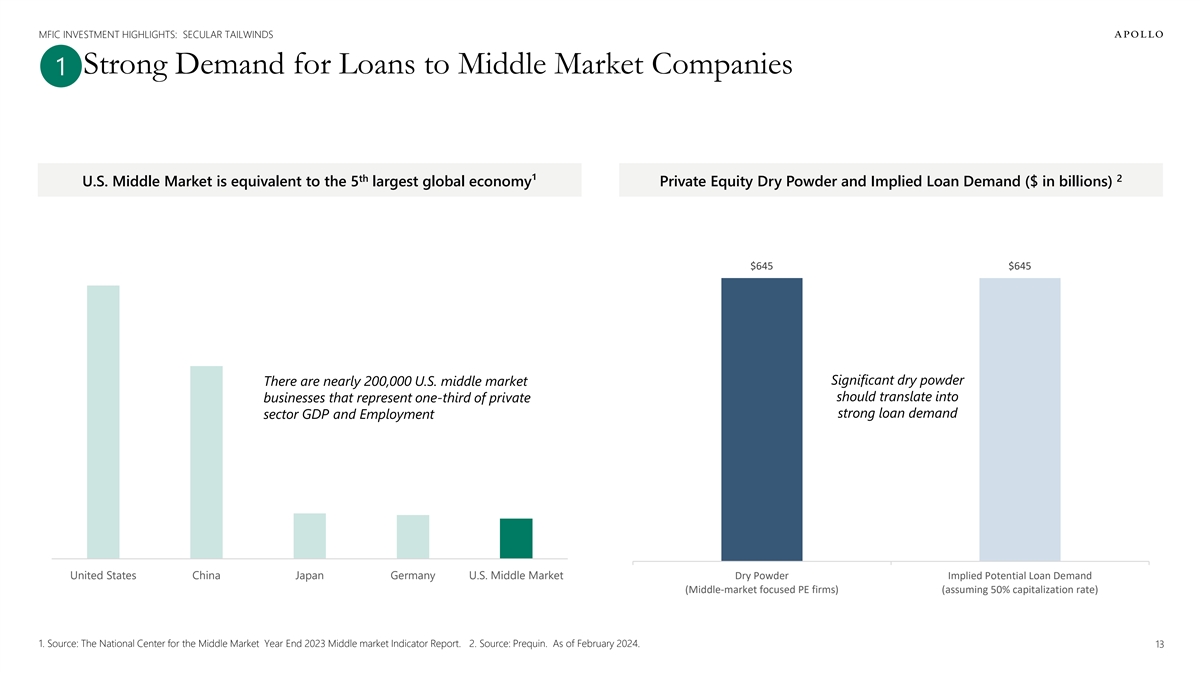
MFIC INVESTMENT HIGHLIGHTS: SECULAR TAILWINDS Strong Demand for Loans to
Middle Market Companies 1 th 2 U.S. Middle Market is equivalent to the 5 largest global economy¹ Private Equity Dry Powder and Implied Loan Demand ($ in billions) $645 $645 Significant dry powder Significant dry powder should translate into
Significant dry powder There are nearly 200,000 U.S. middle market should translate into strong loan demand should translate into businesses that represent one-third of private strong loan demand strong loan demand sector GDP and Employment United
States China Japan Germany U.S. Middle Market Dry Powder Implied Potential Loan Demand (Middle-market focused PE firms) (assuming 50% capitalization rate) 1. Source: The National Center for the Middle Market Year End 2023 Middle market Indicator
Report. 2. Source: Prequin. As of February 2024. 13

MFIC INVESTMENT HIGHLIGHTS: SECULAR TAILWINDS How Private Credit Produces
Better Outcomes for Lenders 1 Broadly Syndicated Direct Origination Loans Credit Documentation Control Due Diligence Access Partial Full Relationship with Borrower Limited Comprehensive Origination and Spread Economics Syndication Control Recurring
Flow and Allocation Control Direct origination makes it possible to control the structure, the process and documentation Reflects the views and opinions of Apollo Analysts. Subject to change at any time without notice. 14
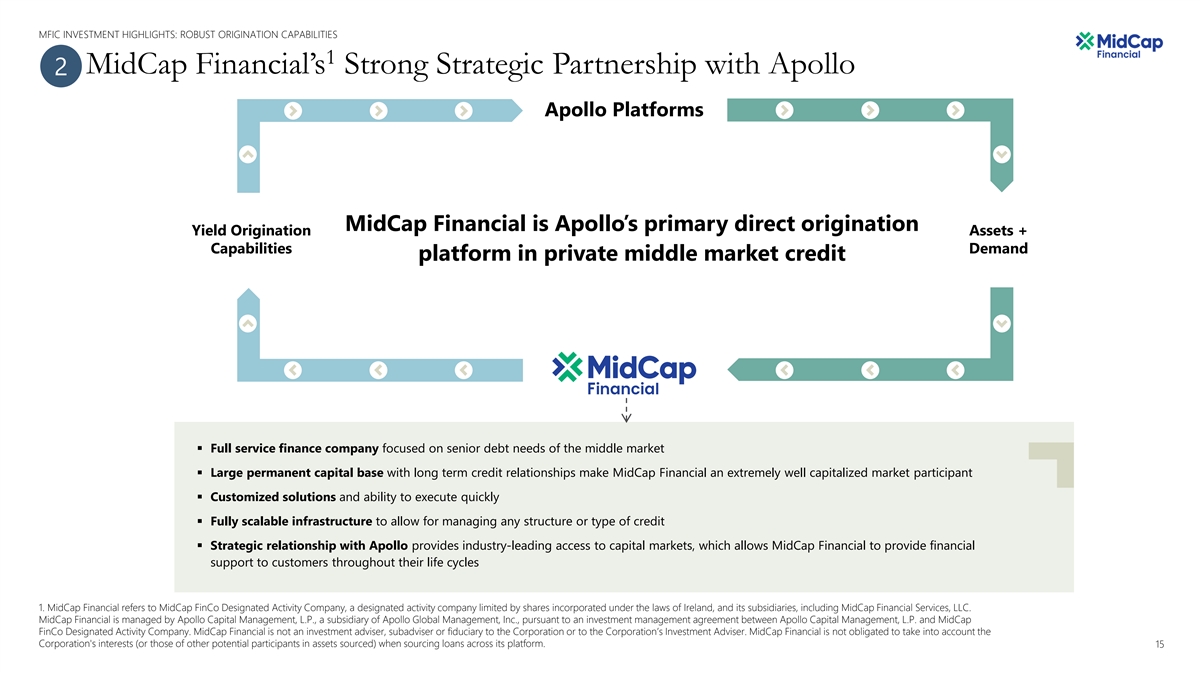
MFIC INVESTMENT HIGHLIGHTS: ROBUST ORIGINATION CAPABILITIES 1 MidCap
Financial’s Strong Strategic Partnership with Apollo 2 Apollo Platforms MidCap Financial is Apollo’s primary direct origination Yield Origination Assets + Capabilities Demand platform in private middle market credit § Full service
finance company focused on senior debt needs of the middle market § Large permanent capital base with long term credit relationships make MidCap Financial an extremely well capitalized market participant § Customized solutions and ability
to execute quickly § Fully scalable infrastructure to allow for managing any structure or type of credit § Strategic relationship with Apollo provides industry-leading access to capital markets, which allows MidCap Financial to provide
financial support to customers throughout their life cycles 1. MidCap Financial refers to MidCap FinCo Designated Activity Company, a designated activity company limited by shares incorporated under the laws of Ireland, and its subsidiaries,
including MidCap Financial Services, LLC. MidCap Financial is managed by Apollo Capital Management, L.P., a subsidiary of Apollo Global Management, Inc., pursuant to an investment management agreement between Apollo Capital Management, L.P. and
MidCap FinCo Designated Activity Company. MidCap Financial is not an investment adviser, subadviser or fiduciary to the Corporation or to the Corporation’s Investment Adviser. MidCap Financial is not obligated to take into account the
Corporation's interests (or those of other potential participants in assets sourced) when sourcing loans across its platform. 15

MFIC INVESTMENT HIGHLIGHTS: ROBUST ORIGINATION CAPABILITIES 1 MidCap
Financial Offers a Broad Suite of Products, Providing Solutions to 2 Nearly All Financing Needs of Middle Market Clients Business Segments Leveraged Asset Based Real Estate Lender Life Sciences and Franchise Lending Lending Lending Finance
Technology Lending Lending Product Capabilities Senior First Senior Senior Cash Senior Asset Franchise Mortgage Venture Based Debt Flow Debt Debt Debt Debt Middle Market 1. MidCap Financial refers to MidCap FinCo Designated Activity Company, a
designated activity company limited by shares incorporated under the laws of Ireland, and its subsidiaries, including MidCap Financial Services, LLC. MidCap Financial is managed by Apollo Capital Management, L.P., a subsidiary of Apollo Global
Management, Inc., pursuant to an investment management agreement between Apollo Capital Management, L.P. and MidCap FinCo Designated Activity Company. MidCap Financial is not an investment adviser, subadviser or fiduciary to the Corporation or to
the Corporation’s Investment Adviser. MidCap Financial is not obligated to take into account the Corporation's interests (or those of other potential participants in assets sourced) when sourcing loans across its platform. 16

MFIC INVESTMENT HIGHLIGHTS: ROBUST ORIGINATION CAPABILITIES 1 MidCap
Financial Proven Leadership in Industry 2 2 Middle Market Lending League Table Rank Lender # Deals 1 Antares Capital 183 MIDCAP FINANCIAL 159 2 3 TPG Twin Brook 138 Churchill 124 4 Ares Capital Corp 107 5 6 Crescent Capital 89 Apogem Capital (fka
Madison Capital) 70 7 8 Monroe Capital 66 Morgan Stanley Private Credit 66 8 Barings 65 9 10 Deerpath Capital 58 1. MidCap Financial refers to MidCap FinCo Designated Activity Company, a designated activity company limited by shares incorporated
under the laws of Ireland, and its subsidiaries, including MidCap Financial Services, LLC. MidCap Financial is managed by Apollo Capital Management, L.P., a subsidiary of Apollo Global Management, Inc., pursuant to an investment management agreement
between Apollo Capital Management, L.P. and MidCap FinCo Designated Activity Company. MidCap Financial is not an investment adviser, subadviser or fiduciary to the Corporation or to the Corporation’s Investment Adviser. MidCap Financial is not
obligated to take into account the Corporation's interests (or those of other potential participants in assets sourced) when sourcing loans across its platform. 2. Source: KBRA DLD’s rankings for full year 2023. Reflects lenders serving as
lead/co-lead. 17

MFIC INVESTMENT HIGHLIGHTS: PRUDENT PORTFOLIO CONSTRUCTION Investment
Strategy 3 Focused on First Lien Loans to Middle Market Companies Focused on true first lien assets, top of the capital structure, with flexibility to invest across the capital structure 1 Assets Primarily Sourced by MidCap Financial’s
Portfolio and Investments Primarily focused on senior secured middle market loans sourced by Midcap Financial, a leading middle market lender with a broad product suite and significant expertise in niche asset classes Ability to co-invest with
MidCap Financial and the broader Apollo platform enhances ability MFIC positioned 2 to be a pure play to win deals on the basis of size and certainty of execution senior secured middle market Prudent Portfolio Construction BDC Prudent portfolio
construction including granular position sizes and emphasis on diversification - by sponsor, industry, and end market 1. MidCap Financial refers to MidCap FinCo Designated Activity Company, a designated activity company limited by shares
incorporated under the laws of Ireland, and its subsidiaries, including MidCap Financial Services, LLC. MidCap Financial is managed by Apollo Capital Management, L.P., a subsidiary of Apollo Global Management, Inc., pursuant to an investment
management agreement between Apollo Capital Management, L.P. and MidCap FinCo Designated Activity Company. MidCap Financial is not an investment adviser, subadviser or fiduciary to the Corporation or to the Corporation’s Investment Adviser.
MidCap Financial is not obligated to take into account the Corporation's interests (or those of other potential participants in assets sourced) when sourcing loans across its platform. 2. On December 29, 2021, the Corporation received an exemptive
order from the SEC, which was amended on January 10, 2023 (the “Order”), permitting greater flexibility to participate in co-investment transactions with certain of its affiliates where terms other than price and quantity are negotiated,
subject to the conditions included therein. The Order superseded a prior exemptive order received from the SEC on March 29, 2016. 18 18

MFIC INVESTMENT HIGHLIGHTS: PRUDENT PORTFOLIO CONSTRUCTION MFIC Compares
Favorably to BDC Averages on Select Key Metrics 3 We believe MFIC’s revenue We believe MFIC’s portfolio is We believe MFIC’s relatively quality is higher compared to more senior when compared to high exposure to floating rate peers
with far less contribution BDC peers which should loans helps lower mitigate some of the credit risks from non-cash sources of interest rate risk in a more challenging operating income environment 1 2 1, 3 First Lien Exposure PIK Income % Total
Income Floating Rate Exposure 7% 87% 86% 83% 75% 1% MFIC BDC Average MFIC BDC Average MFIC BDC Average Note: Past performance is not indicative nor a guarantee of future results. 1. Source: Raymond James Business Development Company Weekly, January
22, 2024. 2. Source: Calculated based on data from Wells Fargo 1Q24 BDC Scorecard, January 29, 2024. Based on TTM data as of September 30, 2023. 3. MFIC’s corporate lending portfolio is 100% floating rate. Corporate lending includes leveraged
lending, life sciences, franchise finance, asset based and lender finance. Excludes Merx Aviation and other select investments. 19

MFIC INVESTMENT HIGHLIGHTS: SHAREHOLDER FRIENDLY FEE STRUCTURE MFIC Has
the Lowest Fee Structure, Among Listed BDCs 4 MFIC charges a management fee of 1.75% on net assets (i.e., equity) (equates to ~0.75% on gross assets) while all comparable listed BDCs charge on gross assets at a higher comparable rate. 2.0% 1.90%
1.75% 32.0% 1.70% 1.5% 1.5% 1.5% 1.5% 1.5% 1.5% 1.5% 1.5% 1.5% 1.5% 1.5% 1.50% 1.4% 27.0% 1.25% 1.30% 1.10% 1.0% 1.0% 1.0% 1.0% 1.0% 1.0% 22.0% 0.90% 0.75% 20% 20.0% 20% 20% 20% 20% 20% 20% 0.70% 17.0% 17.5% 17.5% 17.5% 17.5% 17.5% 17.5% 17.5% 17.5%
17.5% 17.5% 17.5% 17.5% 0.50% 15.0% 15.0% 12.0% 0.30% MFIC BXSL GBDC GSBD MSDL NCDL PFLT BBDC NMFC ARCC BCSF TCPC CGBD CION FSK OCSL OBDC OBDE PNNT TSLX SLRC PSEC Total Return Yes Yes Yes Yes Yes Yes No Yes No No Yes Yes No No No No No No No No No
No Hurdle Management Fee on Assets Incentive Fee Rate Source: Company filings. All BDC data shown as of December 31, 2023. Peer set is defined as largest externally managed, diversified BDCs and excludes one BDC which does not have a comparable
investment strategy. There can be no assurance that the BDCs presented will continue to have the BDC fee structures presented. Fee structure comparison includes managements fees and incentive in income and capital gains. Certain BDCs may not charge
management fees on cash and / or have tiered fee structures. MFIC’s new fee structure became effective on January 1, 2023. Prior to this reduction, MFIC’s base management fee was 1.5% on gross assets financed using leverage up to 1.0x
debt-to-equity and 1.0% on gross assets financed using leverage over 1.0x debt-to equity. 20

MFIC 2023 Accomplishments and Portfolio Review 21

MFIC 2023 ACCOMPLISHMENTS AND PORTFOLIO REVIEW 2023 Key Accomplishments
• Net Investment Income ROE of 11.7% benefitted from elevated base rates, solid fee and prepayment income, and MFIC’s industry leading fee structure Generated ü 1 Solid ROE’s • Net Income ROE of 11.9% aided by modest
portfolio appreciation given stable performance of our borrowers Demonstrated • NAV per share rose $0.31 (from $15.10 as of 12/31/22 to $15.41 as of 12/31/23) or 2.1% as net investment income outpaced distributions by 17% NAV Stability and
ü • Approach to dividends seeks to provide shareholders with an attractive current yield, while also retaining some earnings for NAV stability and growth Growth • Amended Senior Secured Revolving Credit Facility including extending
final maturity by over 2 years and achieving a slight reduction in pricing Enhanced • Closed inaugural CLO (MFIC Bethesda CLO 1 LLC), a $402 million CLO secured by middle market loans, with the issuance of $230 million of AAA notes with a
ü Liability Structure spread of 240 bps over SOFR • Issued $80 million of 8.0% unsecured notes due 2028 in December 2023 2 • Reaping the rewards of our multi-year focus on investing in true first lien middle market loans sourced by
MidCap Financial Corporate Lending 3 • Investments on non-accrual status remain very low- $5.7 million or 0.2% of the total portfolio Portfolio Demonstrated ü Resilience Despite • Portfolio company weighted average net leverage
improved to 5.27x as of 12/31/23, compared to 5.49x as of 12/31/22 Headwinds • Portfolio company weighted average attachment point improved to 0.1x as of 12/31/23, compared to 0.2x as of 12/31/22 Significant Progress • Sold 26 aircraft
reducing owned fleet from 57 to 31 Reducing Exposure to ü • Reduced MFIC’s investment in Merx by 27% which reflects a $76 million return of capital Merx Note: Information on this slide is for the calendar year ended December 31,
2023. Past performance is not indicative nor a guarantee of future results. 1. NII ROE defined as net investment income dividend by average net assets. Net Income ROE defined as net increase (decrease) in net assets resulting form operations divided
by average net assets. 2. MidCap Financial refers to MidCap FinCo Designated Activity Company, a designated activity company limited by shares incorporated under the laws of Ireland, and its subsidiaries, including MidCap Financial Services, LLC.
MidCap Financial is managed by Apollo Capital Management, L.P., a subsidiary of Apollo Global Management, Inc., pursuant to an investment management agreement between Apollo Capital Management, L.P. and MidCap FinCo Designated Activity Company.
MidCap Financial is not an investment adviser, subadviser or fiduciary to the Corporation or to the Corporation's Investment Adviser. MidCap Financial is not obligated to take into account the Corporation’s interests (or those of other
potential participants in assets sourced) when sourcing loans across its platform. 3. As of December 31, 2023. At fair value. 22

MFIC Senior Secured Diversified Investment Portfolio Portfolio Snapshot
Portfolio by Strategy Portfolio by Industry Portfolio $2.33 bn # of Portfolio Companies 152 # of Industries 23 8% 17.8% 19.3% 1 Corporate Lending and Other % Total Portfolio 92% 9% Non-Accrual % Total Portfolio 0.2% 2.6% 7% 2.9% Corporate Lending
Portfolio Statistics 3.1% 2 Weighted Average Yield 12.2% 17.5% 3.6% Weighted Average Spread over SOFR 623 bps 4.8% First Lien 96% 77% Floating Rate 100% 8.1% 11.9% Sponsored 88% 8.4% 3 Pursuant to co-investment order 86% High Tech Industries Average
exposure $14.7 mn Healthcare & Pharmaceuticals 4 Leveraged Lending Business Services % with financial covenants 98% 11 Aviation and Consumer Transport 5 Corporate Lending Median EBITDA $47 mn Life Sciences Consumer Services and Other 5, 6, 7, 8
Weighted Avg Net Leverage 5.27 x Beverage, Food & Tobacco Lender Finance, Asset Based, Consumer Goods – Non-durable 5, 6, 7, 8 Franchise Finance and Other Weighted Avg Attachment Point 0.1 x 11 Transportation – Cargo, Distribution
Aviation 5, 6, 8, 9 Weighted Avg Interest Coverage 1.9 x Manufacturing, Capital Equipment Automotive 10 Other Note: As of December 31, 2023. At fair value, unless otherwise noted. Subject to change at any time. without notice. Past performance is
not indicative nor a guarantee of future results. There is no guarantee that similar allocations or investments will be available in the future. Diversification does not ensure profit or protect against loss. 1. Corporate lending includes leveraged
lending, life sciences, franchise finance, asset based and lender finance. Excludes Merx Aviation and other select investments. 2. Weighted average yield on debt investments. On a cost basis. Exclusive of investment on non-accrual status. Based on
average of beginning of period and end of period portfolio yield. 3. On December 29, 2021, the Corporation received an exemptive order from the SEC, which was amended on January 10, 2023 (the “Order”), permitting greater flexibility to
participate in co-investment transactions with certain of its affiliates where terms other than price and quantity are negotiated, subject to the conditions included therein. The Order superseded a prior exemptive order received from the SEC on
March 29, 2016. 4. On a cost basis. 5. Source: Company data. 6. Through MFIC position based on corporate lending portfolio. 7. Excludes select investments where metric is not relevant or appropriate or data is not available. 8. Weighted average by
cost. Current metric. 9. The weighted average interest coverage ratio of the corporate lending portfolio was 1.8x based on TTM EBITDA through September 2023 and estimated annualized interest expense assuming December 31, 2023 base rates. 10. Other
includes: Diversified Investment Vehicles, Banking, Finance, Real Estate; Insurance; Chemicals, Plastics & Rubber; Wholesale; Advertising, 23 Printing& Publishing; Construction & Building; Retail; Hotel, Gaming, Leisure, Restaurants;
Consumer Goods –Durable; Utilities –Electric; Telecommunications; Energy –Electricity and Energy –Oil & Gas. 11. As of December 31, 2023, Merx owned 31 aircraft with weighted average age ~13.2 years and weighted average
lease maturity of ~3.5 years.

MFIC 2023 ACCOMPLISHMENTS AND PORTFOLIO REVIEW MFIC Credit Quality Remains
Resilient 1 2 Median LTM EBITDA Net Leverage and Attachment Point Net Leverage Attachment Point $55 $54 5.49 x 5.45 x 5.45 x 5.44 x 5.27 x $50 $48 $47 0.2 x 0.1 x 0.1 x 0.1 x 0.1 x Dec-22 Mar-23 Jun-23 Sep-23 Dec-23 Dec-22 Mar-23 Jun-23 Sep-23
Dec-23 3 4 Cash Interest Coverage Investments on Non-Accrual Status $50.0 0.8% $45.0 0.7% $40.0 2.5 x 0.6% 0.5% 2.3 x $35.0 2.1 x 1.9 x 1.9 x 0.5% $30.0 0.4% 0.4% $25.0 0.4% 0.3% $20.0 0.3% 0.2% $12 $15.0 $10 $9 0.2% $7 $10.0 $6 0.1% $5.0 $0.0 0.0%
2 Dec-22 Mar-23 Jun-23 Sep-23 Dec-23 Dec-22 Mar-23 Jun-23 Sep-23 Dec-23 Investments on non-accrual $ % total portfolio Note: Past performance is not indicative nor a guarantee of future results. Source: Company data. 1. Based on corporate lending
portfolio. Excludes select investments where metric is not relevant or appropriate or data is not available. 2. Weighed average by cost. Current metric. Through MFIC position. 3. The weighted average interest coverage ratio of the corporate lending
portfolio was 1.8x based on TTM EBITDA through September 2023 and estimated annualized interest expense assuming December 31, 2023 base rates. 4. At fair value. 24

Proposed Mergers of MFIC, AFT, and AIF 25

PROPOSED MERGERS OF MFIC, AFT, AND AIF We Believe the Proposed Mergers of
AFT and AIF with MFIC 1 are in the Best Interests of All Shareholders & MFIC AFT & AIF 2 2 P Expected to be accretive to return on equity and net investment income per share ü Expected to be accretive to return on equity and net
investment income per share P Special cash dividendü Special cash payment and additional special cash dividend ü Increased scaleü Increased scale ü Expected to result in greater stock liquidityü Expected to result in
greater stock liquidity ü Potentially expands MFIC’s research analyst coverageü Gains benefit of research analyst coverage ü Expected to improve access to capitalü Expected to improve access to capital ü Potential
operational synergiesü Potential operational synergies ü Expected to improve portfolio metrics Proposed Mergers Create a Larger, More Scaled BDC Focused on Middle Market Direct Lending 1. In connection with the consideration of the
transactions, the boards of directors of MFIC, AFT, and AIF each established a special committee, consisting only of certain independent directors (the “MFIC Special Committee” and the “CEF Special Committees”). The boards of
directors of MFIC, AFT and AIF unanimously approved their respective mergers in consideration of the unanimous recommendations of the MFIC Special Committee and respective CEF Special Committees. 2. ROE denotes return on equity and NII denotes net
investment income. 26

PROPOSED MERGERS OF MFIC, AFT, AND AIF Significant Shareholder Financial
Benefits Related to the Transactions Special Cash Payment to • An affiliate of Apollo will make a special cash payment of $0.25 per share to each AFT or AIF shareholder of record as of the closing 1 AFT and AIF Shareholders date of the
applicable transaction, following the closing of the applicable merger. • Following the closing of the Merger(s), as applicable, MFIC will pay a cash dividend of $0.20 per share. The exact record date for the Special Cash Dividend $0.20 per
share special dividend will be determined by the MFIC Board of Directors based upon the timing of the closings of the to Shareholders 2 Merger(s). • All merger-related expenses will be reimbursed by an affiliate of Apollo for each successful
transaction. • A portion of the merger-related expenses of AFT or AIF, as applicable, will be reimbursed by an affiliate of Apollo, if the respective Transaction Expense transaction is not successful; the remainder will be borne by AFT or AIF,
as applicable. Reimbursement • In addition, a portion of the merger-related expenses of MFIC will be reimbursed by an affiliate of Apollo if neither transaction is successful; the remainder will be borne by MFIC. 1. The exact record date will
be the closing date of the applicable transaction. The specific tax characteristics of the $0.25 per share special cash payment have not yet been determined. Apollo and its affiliates make no assurances regarding the tax treatment to stockholders of
the receipt of this special cash payment. 2. The specific tax characteristics of the $0.20 per share special dividend have not yet been determined and will be reported to stockholders on Form 1099 after the end of the calendar year in which it is
paid. Apollo and its affiliates make no assurances regarding the tax treatment to stockholders of the receipt of this special dividend. 27

PROPOSED MERGERS OF MFIC, AFT, AND AIF Overview of MFIC, AFT, and AIF
MidCap Financial Apollo Senior Apollo Tactical Investment Corporation Floating Rate Fund Inc. Income Fund Inc. NASDAQ: MFIC NYSE: AFT NYSE: AIF Listed Business Development Company (“BDC”) Listed Closed End Fund (“CEF”) Listed
Closed End Fund (“CEF”) Structure Regulated under the 1940 Act Registered under the 1940 Act Registered under the 1940 Act Seek current income and preservation of capital Primary objective is to seek current income with by investing
primarily in senior, secured loans a secondary objective of preservation of capital Investment Generate current income and, to a lesser extent made to companies whose debt is rated below by investing in a portfolio of senior loans, Objective
long-term capital appreciation investment grade and investments with similar corporate bonds and other credit instruments of economic characteristics. varying maturities Inception Date April 8, 2004 February 23, 2011 February 25, 2013 Tax Structure
Regulated investment company (“RIC”) Regulated investment company (“RIC”) Regulated investment company (“RIC”) 1, 2 Portfolio Size / Direct Origination % $2.37 billion / 92% $346 million / 23% $311 million / 33% 2
Net Asset Value $997 million $234 million $212 million 2 Net Asset Value Per Share $15.28 $15.05 $14.63 2 Shares Outstanding 65,253,275 15,573,575 14,464,026 Regulatory Minimum 3 3 150% 300% 300% Asset Coverage Ratio Apollo Investment Management,
L.P., Apollo Credit Management, LLC. Apollo Credit Management, LLC. Investment Adviser an affiliate of Apollo Global Management, Inc. an affiliate of Apollo Global Management, Inc. an affiliate of Apollo Global Management, Inc. 1. At fair value. 2.
As of September 30, 2023. 3. On debt. 28

PROPOSED MERGERS OF MFIC, AFT, AND AIF 1 Summary of Key Terms of the
Transactions 2 • MFIC to acquire 100% of AFT and AIF in two parallel stock-for-stock transactions, with shares to be exchanged on a NAV-for-NAV basis • The Mergers will result in an ownership split of the combined company proportional to
each of MFIC’s, AFT’s, and AIF’s respective net asset values Structure of the Mergers • MFIC will be the surviving entity in both mergers and will continue to operate as a BDC and trade under the ticker symbol
“MFIC” on the NASDAQ Global Select Exchange • The Transactions are intended to be treated as tax-free reorganizations • Cash payment of $0.25 per share from an affiliate of Apollo Global Management, Inc.
(“Apollo”) to each AFT or AIF shareholder of record as of the closing of the applicable transaction, following the closing of the 3 Special Cash Payment applicable transaction • Following the closing of the Merger(s), as
applicable, MFIC will pay a cash dividend of $0.20 per share. The exact record date for the $0.20 per share special dividend will be determined by the MFIC Board of Directors 4 Special Cash Dividend based upon the timing of the closings of the
Merger(s) 5 • Combined company will have approximately $3.4 billion of investments and $1.4 billion of net assets 6 • No change to MFIC’s investment strategy which will remain focused on first lien floating rate loans to middle
market companies, primarily sourced by MidCap Financial 6 Pro Forma Balance Sheet • AFT’s and AIF’s liquid assets will be rotated in the ordinary course into first lien floating rate loans to middle market companies, primarily
sourced by MidCap Financial 7 • The mergers unlock approximately $330 million of incremental asset capacity due to MFIC’s lower minimum asset coverage • AFT’s and AIF’s existing indebtedness will be repaid by MFIC
contemporaneous to the closing of each transaction Merger Contingency • The mergers are not contingent on each other; i.e., MFIC can acquire one fund if shareholder approval is not obtained for both funds • All merger-related expenses
will be reimbursed by an affiliate of Apollo for each successful transaction Transaction Expenses • A portion of the merger-related expenses of AFT or AIF, as applicable, will be reimbursed by an affiliate of Apollo, if the respective
transaction is not successful; the remainder will be borne by AFT or AIF, as applicable • In addition, a portion of the merger-related expenses of MFIC will be reimbursed by an affiliate of Apollo if neither transaction is successful; the
remainder will be borne by MFIC • Apollo Investment Management, L.P., an affiliate of Apollo will continue to serve as the investment adviser of the combined company Post-Merger Governance • All current MFIC officers and directors will
remain in their current positions • MFIC Affirmative vote of a majority of votes cast • AFT Affirmative vote of majority of outstanding shares Closing Conditions • AIF Affirmative vote of majority of outstanding shares •
Other customary closing conditions • Filed a registration statement and preliminary joint proxy statement / prospectus Expected Timing • Anticipated closing in the first half of 2024, subject to shareholder approvals and other customary
closing conditions 1. The descriptions set forth above are a summary of certain terms and are not intended to be complete. Please refer to the Merger Agreements for complete descriptions of the key terms of each merger. 2. The NAV’s used in
determining the exchange ratios will include any distributions declared prior to each closing and will be determined within 48 hours prior to closing of the applicable merger. 3. The exact record date will be the closing date of the applicable
transaction. The specific tax characteristics of the $0.25 per share special cash payment have not yet been determined. Apollo and its affiliates make no assurances regarding the tax treatment to stockholders of the receipt of this special cash
payment 4. The specific tax characteristics of the $0.20 per share special dividend have not yet been determined and will be reported to stockholders on Form 1099 after the end of the calendar year in which it is paid. Apollo and its affiliates make
no assurances regarding the tax treatment to stockholders of the receipt of this special dividend. 5. Based on net assets as of September 30, 2023 for MFIC, AFT, and AIF. Includes the impact of the special cash dividend of $0.20 per share from the
combined company, payable after the closings to each MFIC share, including existing MFIC shares and the newly issued MFIC shares. Based on MFIC’s net leverage ratio of 1.40x. The net leverage ratio is defined as debt outstanding plus payable
for investments purchased, less receivable for investments sold, less cash and cash equivalents, less foreign currencies, divided by net assets. 6. MidCap Financial refers to MidCap FinCo Designated Activity Company, a designated activity company
limited by shares incorporated under the laws of Ireland, and its subsidiaries, including MidCap Financial Services, LLC. MidCap Financial is managed by Apollo Capital Management, L.P., a subsidiary of Apollo Global Management, Inc., pursuant to an
investment management agreement between Apollo Capital Management, L.P. and MidCap FinCo Designated Activity Company. MidCap Financial is not an investment adviser, subadviser or fiduciary to MFIC or MFIC’s Investment Adviser. MidCap Financial
is not obligated to take into account MFIC’s interests (or those of other potential participants in assets sourced) when sourcing loans across its platform. 7. MFIC is subject to a 150% minimum asset coverage requirement pursuant to Section
61(a)(2) of the 1940 Act, as amended by The Small Business Credit Availability Act (“SBCAA”). AFT and AIF are both subject to a 300% minimum asset coverage requirement on debt pursuant to Section 18 of the 1940 Act. 29

PROPOSED MERGERS OF MFIC, AFT, AND AIF Illustrative Exchange Ratios and
MFIC Pro Forma Ownership 1 Illustrative Exchange Ratios Pro Forma Ownership AFT AIF $15.05 $14.63 AFT NAV Per Share AIF NAV Per Share $15.28 $15.28 AIF MFIC NAV Per Share MFIC NAV Per Share 15% 0.9849 x 0.9577 x Exchange Ratio Exchange Ratio AFT Pro
Forma 16% 2 15.6 14.5 Net Assets AFT Shares Outstanding AIF Shares Outstanding $1,424 MFIC 15.3 13.9 69% MFIC Shares Issued MFIC Shares Issued to AFT Shareholders to AIF Shareholders 29.2 Total MFIC Shares Issued 1. Illustrative exchange ratios
based on NAV per share for MFIC, AFT, and AIF as of September 30, 2023. Under the terms of each merger agreement, AFT and AIF shareholders will receive an amount of new MFIC shares based upon the net asset values of each company at the time each
closing. The NAV’s used in determining the exchange ratios will include any distributions declared prior to each closing and will be determined within 48 hours prior to closing of the applicable merger. Changes in the NAV per share of MFIC,
AFT, and AIF before the consummation of the mergers may impact the exchange ratios. 2. Pro forma net assets includes the impact of the special cash dividend of $0.20 per share from the combined company, payable by MFIC after the closing of the
Merger(s). 30

PROPOSED MERGERS OF MFIC, AFT, AND AIF 1 Total Consideration to AFT and
AIF (Illustrative ) 2 MFIC to acquire 100% of AFT and AIF in two parallel stock-for-stock transactions, with shares to be exchanged on a NAV-for-NAV basis. In addition, an affiliate of Apollo will make a special cash payment of $0.25 per share to
each AFT or AIF shareholder of record as of the closing date 3 of the applicable transaction, following the closing of the applicable transaction. AFT AIF $15.30 $15.05 $0.25 $14.88 $14.63 $0.25 0.9849x share of 1 share of AFT 0.9577x share of MFIC
1 share of AIF NAV-for-NAV $15.05 MFIC $15.05 $14.63 NAV-for-NAV $14.63 Pre Merger Total Consideration Pre Merger Total Consideration Value Per Share Value Per Share NAV Cash payment from Apollo NAV Cash payment from Apollo 1. Illustrative exchange
ratio based on MFIC, AFT, and AIF NAV per share as of September 30, 2023. 2. Under the terms of each merger agreement, AFT and AIF shareholders will receive an amount of new MFIC shares based upon the net asset values of each company at the time of
each closing. The NAV’s used in determining the exchange ratios will include any distributions declared prior to each closing and will be determined within 48 hours prior to the closing of the applicable merger. Changes in the NAV per share of
MFIC, AFT, and AIF before the consummation of the mergers may impact the exchange ratios. 3. The exact record date will be the closing date of the applicable transaction. The specific tax characteristics of the $0.25 per share special cash payment
have not yet been determined. Apollo and its affiliates make no assurances regarding the tax treatment to stockholders of the receipt of this special cash payment. 31
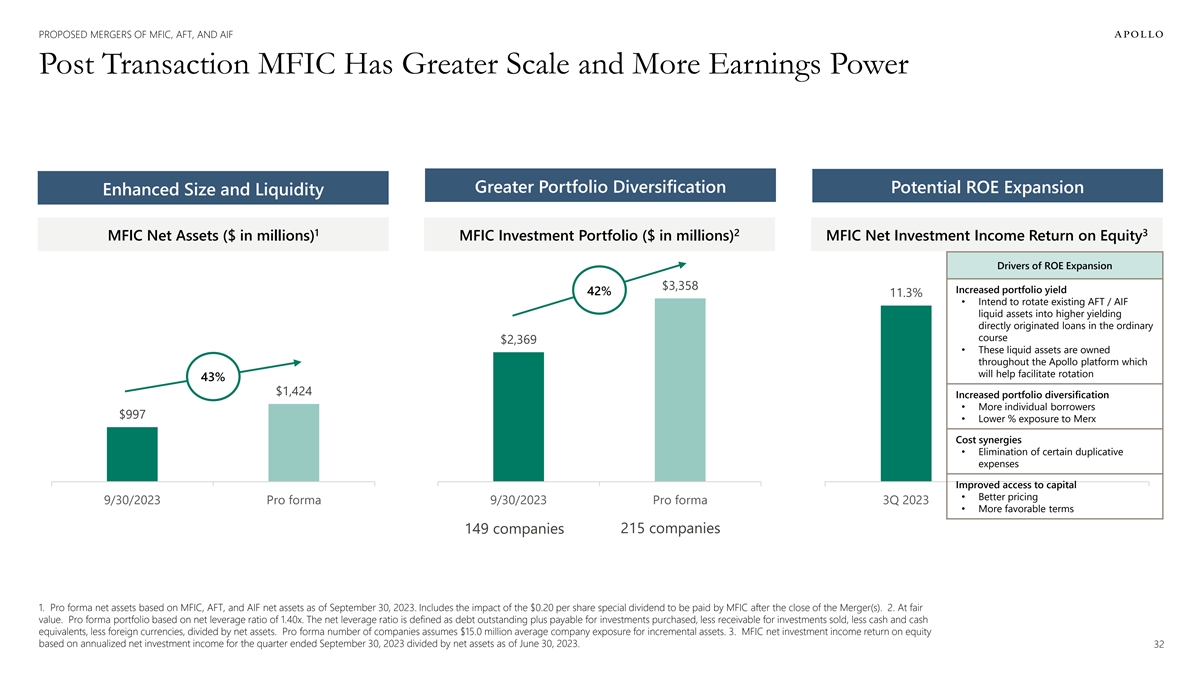
PROPOSED MERGERS OF MFIC, AFT, AND AIF Post Transaction MFIC Has Greater
Scale and More Earnings Power Greater Portfolio Diversification Potential ROE Expansion Enhanced Size and Liquidity 1 2 3 MFIC Net Assets ($ in millions) MFIC Investment Portfolio ($ in millions) MFIC Net Investment Income Return on Equity Drivers
of ROE Expansion $3,358 Increased portfolio yield 42% 11.3% • Intend to rotate existing AFT / AIF liquid assets into higher yielding directly originated loans in the ordinary course $2,369 • These liquid assets are owned throughout the
Apollo platform which will help facilitate rotation 43% $1,424 Increased portfolio diversification • More individual borrowers $997 • Lower % exposure to Merx Cost synergies • Elimination of certain duplicative expenses Improved
access to capital • Better pricing 9/30/2023 Pro forma 9/30/2023 Pro forma 3Q 2023 • More favorable terms 149 companies 215 companies 1. Pro forma net assets based on MFIC, AFT, and AIF net assets as of September 30, 2023. Includes the
impact of the $0.20 per share special dividend to be paid by MFIC after the close of the Merger(s). 2. At fair value. Pro forma portfolio based on net leverage ratio of 1.40x. The net leverage ratio is defined as debt outstanding plus payable for
investments purchased, less receivable for investments sold, less cash and cash equivalents, less foreign currencies, divided by net assets. Pro forma number of companies assumes $15.0 million average company exposure for incremental assets. 3. MFIC
net investment income return on equity based on annualized net investment income for the quarter ended September 30, 2023 divided by net assets as of June 30, 2023. 32

PROPOSED MERGERS OF MFIC, AFT, AND AIF Expense Synergies The proposed
mergers of AFT and AIF with MFIC are expected to be accretive to net investment income in part due to the opportunity for operating synergies by eliminating certain duplicative corporate expenses 1 Category Potential Savings Annual G&A Expenses
($ in millions) • Administrative fees ~$3.1 m potential $19.1 • Insurance Administrative savings $16.0 • Listing fees • Regulatory fees • Legal expenses • Audit fees Other • Board of Directors professional
services • Internal audit fees MFIC + AFT + AIF Pro forma (current expenses) expenses • Tax related expenses 3 • Printing and mailing expenses Pre-Merger Pro forma 2 Expense ratio 0.60% 0.47% 1. Current expenses reflect general and
administrative expenses for last twelve months as of September 30, 2023. 2. Expense ratio defined as general and administrative expense for last twelve months as of September 30, 2023 divided by average quarterly total assets from September 30, 2022
through September 30, 2023. 3. Pro forma expense ratio reflects potential general and administrative savings of $3.1 million and pro forma balance sheet of approximately $3.4 billion. 33

Average Daily Valued Traded 3 Month PROPOSED MERGERS OF MFIC, AFT, AND AIF
Increased Scale and Secondary Market Liquidity Potential for increased stock liquidity could lead to increased institutional ownership 2 1 Market Cap, Trading Volume & Research Coverage ($ in millions) Net Asset Value ($ in millions) $1,600
Market Capitalization Average Daily Value Traded 3 Months ($19) $212 $1,424 $1,600 $10.0 $1,400 $234 $9.0 $1,400 $1,200 $1,279 $997 $8.0 $1,000 $1,200 $7.0 $800 $1,000 $882 $6.0 $600 $800 $5.0 $4.0 $400 $600 $3.0 $200 $400 $2.0 $2.5 $206 $191 $0
$200 $1.0 MFIC AFT AIF Special $0.20 MFIC $1.3 $0.8 Per Share Pro forma $0 $- Dividend MFIC AFT AIF MFIC Pro forma Potentially 10 0 0 The combination of MFIC, AFT, and AIF would result in a Research expands MFIC’s analysts analysts analysts
larger, more scaled BDC Coverage analyst coverage 1. Net asset value for MFIC, AFT, and AIF as of September 30, 2023. MFIC pro forma net assets includes the impact of the $0.20 per share special dividend, payable by MFIC after the closing of the
Merger(s). 2. Market capitalization and average daily value traded 3 months as of November 3, 2023. Combined market capitalization does not include the impact of the $0.20 per share special dividend. 34 Market Capitalization

PROPOSED MERGERS OF MFIC, AFT, AND AIF Investment Portfolios Affiliates of
Apollo manage MFIC, AFT, and AIF, which mitigates the diligence concerns typically associated with mergers of unaffiliated entities. The CEFs’ portfolios primarily include liquid assets that are owned throughout the Apollo platform, which will
help facilitate a seamless rotation in the ordinary course into directly originated assets that align with MFIC’s investment strategy. MFIC AFT AIF 8% 5% 0% 8% Structured Credit and High Yield Other Merx Other 14% Bonds High Yield 40% 32%
Bonds Direct Direct Origination Origination $2.33 92% $317 $336 billion Direct million million Origination 62% 38% Broadly Broadly Syndicated Loans Syndicated Loans On a fair value basis. As of December 31, 2023. May not sum to 100% due to rounding.
Private and Confidential 35

PROPOSED MERGERS OF MFIC, AFT, AND AIF Pro Forma Portfolio Metrics Improve
Once Rotated and Deployed Portfolio Rotation, at Fair Value ($ in millions) 215 companies Deploy into direct origination Ø Portfolio increases by ~$1.0 billion $3,358 6%, $195 Ø Merx decreases to <6% $656 $332 149 companies 3 Rotate
into direct origination $474 $2,369 Retain $183 8%, $195 94% Ø Direct origination increases to 94% $3,162 92% $2,174 MFIC AFT + AIF Incremental Assets MFIC (9/30/23) (9/30/23) Pro Forma 1, 2 Direct Origination Merx Aviation, LLC Liquid Assets
(BSL, high yield bonds) Incremental Asset Capacity 1. Incremental asset capacity based on MFIC net leverage ratio of 1.40x. The net leverage ratio is defined as debt outstanding plus payable for investments purchased, less receivable for investments
sold, less cash and cash equivalents, less foreign currencies, divided by net assets. 2. MFIC is subject to a 150% minimum asset coverage requirement pursuant to Section 61(a)(2) of the 1940 Act, as amended by The Small Business Credit Availability
Act (“SBCAA”). AFT and AIF are both subject to a 300% minimum asset coverage requirement on debt pursuant to Section 18 of the 1940 Act. 3. Rotation will occur in the ordinary course. 36

PROPOSED MERGERS OF MFIC, AFT, AND AIF Existing Sources of Financing in
Place to Execute the Mergers MFIC Debt ($ in millions) $2,500 $2,500 $2,412 $2,412 $2,180 $374 $2,000 $2,000 Debt Outstanding $974 $2,038 $742 $600 $1,500 $1,500 Debt Outstanding Debt Outstanding $1,438 $1,438 $731 $731 $1,000 $1,000 $963 $232 $232
$500 $500 $125 $125 $125 $350 $350 $350 $- $- 9/30/2023 9/30/2023 Pro forma 1 Pro forma for CLO for Proposed Mergers 2 2025 Notes 2026 Notes MFIC Bethesda CLO 1 Revolver Outstanding Revolver Draw for the Proposed Mergers Undrawn Revolver Commitments
Note: The closed-end funds’ existing indebtedness will be repaid by MFIC contemporaneous to the closing of each transaction. 1. On November 2, 2023, MFIC completed a $402.36 million collateralized loan obligation (“CLO”)
transaction. Proceeds from the CLO transaction were used to repay borrowings under the Company’s multi-currency revolving credit facility (the “Revolver”). 2. Undrawn revolver commitments based on $1.705 billion of lender
commitments. Lender commitments under the Revolver will decrease to $1.550 billion on December 22, 2024. 37
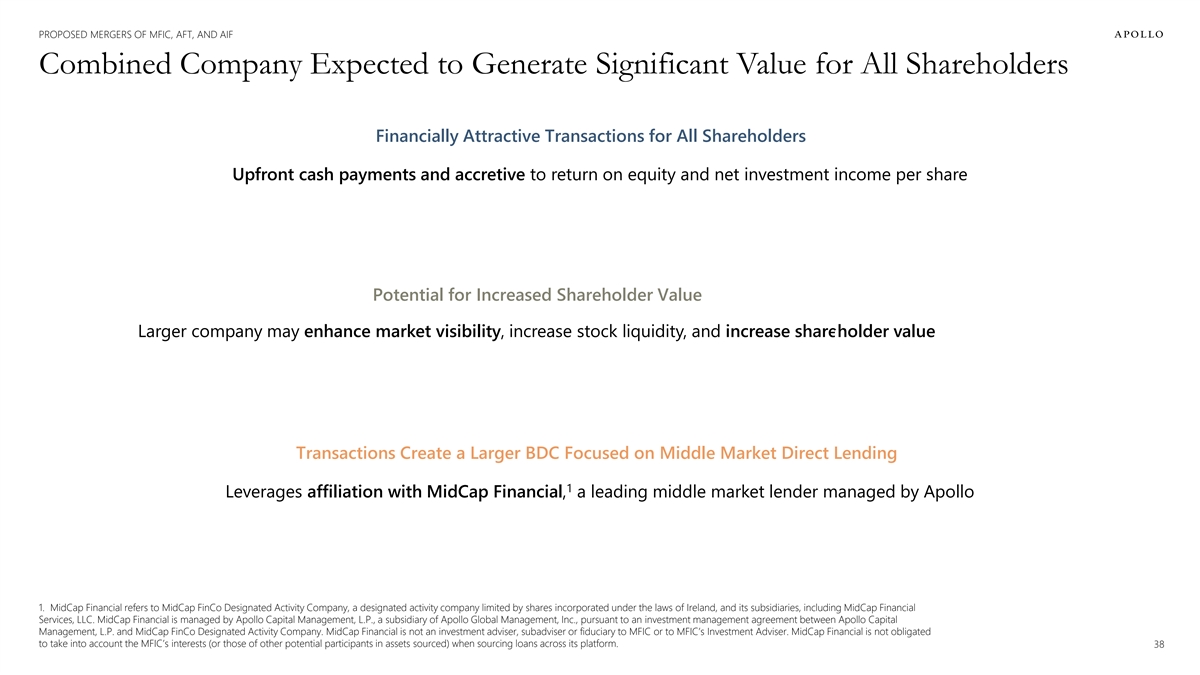
PROPOSED MERGERS OF MFIC, AFT, AND AIF Combined Company Expected to
Generate Significant Value for All Shareholders Financially Attractive Transactions for All Shareholders Upfront cash payments and accretive to return on equity and net investment income per share Potential for Increased Shareholder Value Larger
company may enhance market visibility, increase stock liquidity, and increase shareholder value + Growth mindset Transactions Create a Larger BDC Focused on Middle Market Direct Lending 1 Leverages affiliation with MidCap Financial, a leading middle
market lender managed by Apollo 1. MidCap Financial refers to MidCap FinCo Designated Activity Company, a designated activity company limited by shares incorporated under the laws of Ireland, and its subsidiaries, including MidCap Financial
Services, LLC. MidCap Financial is managed by Apollo Capital Management, L.P., a subsidiary of Apollo Global Management, Inc., pursuant to an investment management agreement between Apollo Capital Management, L.P. and MidCap FinCo Designated
Activity Company. MidCap Financial is not an investment adviser, subadviser or fiduciary to MFIC or to MFIC’s Investment Adviser. MidCap Financial is not obligated to take into account the MFIC’s interests (or those of other potential
participants in assets sourced) when sourcing loans across its platform. 38

PROPOSED MERGERS OF MFIC, AFT, AND AIF Apollo Senior Floating Rate Fund
Inc. (NYSE: AFT) at a Glance Objective and Strategy 1 Portfolio Characteristics AFT is a diversified, closed-end management investment company. AFT’s investment objective Weighted Average Floating Rate Spread / % Floating Rate 4.96% / 92.3% is
to seek current income and preservation of capital by investing primarily in senior, secured loans made to companies whose debt is rated below investment grade and investments with Weighted Average Fixed Rate Coupon / % Fixed Rate 7.53% / 7.7%
similar economic characteristics. Weighted Average Maturity (in years) (floating assets) 4.24 Weighted Average Maturity (in years) (fixed assets) 5.07 Fund Facts and Data 2 Average Position Size by Issuer $3.8 million Symbol NYSE- AFT 2 Number of
Issuers 93 Inception Date 2/23/11 3 Weighted Average S&P Rating B Capital Structure 3 Weighted Average Rating Factor (Moody’s) 3,229 Shares Outstanding 15.6 million 4 Credit Quality Net Asset Value $234.1 million BB 4.4% Leverage $130.0
million B 54.8% Total Managed Assets $364.1 million CCC+ or Lower 9.6% Portfolio, at Fair Value $336.2 million Not Rated 31.2% Debt-to-Net Asset Value Ratio 0.56x 5 Top 5 Industries (% Market Value) Portfolio Composition (% Market Value) Services:
Business 18.3% Broadly Syndicated Loans 62.3% Healthcare & Pharmaceuticals 15.1% Direct Origination 32.0% High Tech Industries 15.0% High Yield Bonds 5.2% Banking, Finance, Insurance & Real Estate 9.2% Equity / Other 0.4% Telecommunications
6.0% Total 63.6% Information as of December 31, 2023. 1. Averages based on par value of investment securities, except for the % floating and fixed rate, which are based on market value. 2. Excludes equity investments. 3. Excludes securities with no
rating or non-performing defaulted securities as of December 31, 2023. Credit quality is calculated as a percentage of fair value of investment securities at December 31, 2023. The quality ratings reflected were issued by S&P Global Ratings
(“S&P”), an internationally recognized statistical rating organization. 4. Credit quality ratings reflect the rating agency’s opinion of the credit quality of the underlying positions in the Fund’s portfolio and not that
of the Fund itself. Credit quality ratings are subject to change. 5. The industry classifications reported are from widely recognized market indexes or rating group indexes, and/or as defined by Fund management, with the primary source being
Moody’s Investors Service (“Moody’s”), an internationally recognized statistical rating organization. 39

PROPOSED MERGERS OF MFIC, AFT, AND AIF Apollo Tactical Income Fund Inc.
(NYSE: AIF) at a Glance 1 Portfolio Characteristics Objective and Strategy AIF is a diversified, closed-end management investment company. The Fund’s primary Weighted Average Floating Rate Spread / % Floating Rate 5.57% / 84.3% investment
objective is to seek current income with a secondary objective of preservation of Weighted Average Fixed Rate Coupon / % Fixed Rate 6.73% / 15.7% capital by investing in a portfolio of senior loans, corporate bonds and other credit Weighted Average
Maturity (in years) (floating assets) 4.78 instruments of varying maturities. The Fund seeks to generate current income and preservation of capital primarily by allocating assets among different types of credit Weighted Average Maturity (in years)
(fixed assets) 4.95 instruments based on absolute and relative value considerations. 2 Average Position Size by Issuer $3.4 million Fund Facts and Data 2 Number of Issuers 100 Symbol NYSE- AIF 3 Weighted Average S&P Rating B Inception Date
2/25/13 3 Weighted Average Rating Factor (Moody’s) 3,205 Capital Structure 4 Credit Quality Shares Outstanding 14.5 million BB 10.2% Net Asset Value $213.6 million B 37.7% Leverage $121.0 million CCC+ or Lower 11.0% Total Managed Assets $334.6
million Not Rated 41.1% Portfolio, at Fair Value $316.7 million 5 Top 5 Industries (% Market Value) Debt-to-Net Asset Value Ratio 0.57x Healthcare & Pharmaceuticals 16.6% Portfolio Composition (% Market Value) High Tech Industries 14.2% Broadly
Syndicated Loans 38.3% Services: Businesses 9.6% Direct Origination 40.5% Banking, Finance, Insurance & Real Estate 8.4% High Yield Bonds 13.5% Media: Advertising, Printing, & Publishing 7.3% Structured Products 7.4% Total 56.1% Equity /
Other 0.3% Information as of December 31, 2023. 1. Averages based on par value of investment securities, except for the % floating and fixed rate, which are based on market value. 2. Excludes equity investments. 3. Excludes securities with no rating
or non-performing defaulted securities as of December 31, 2023. Credit quality is calculated as a percentage of fair value of investment securities at December 31, 2023. The quality ratings reflected were issued by S&P Global Ratings
(“S&P”), an internationally recognized statistical rating organization. 4. Credit quality ratings reflect the rating agency’s opinion of the credit quality of the underlying positions in the Fund’s portfolio and not that
of the Fund itself. Credit quality ratings are subject to change. 5. The industry classifications reported are from widely recognized market indexes or rating group indexes, and/or as defined by Fund management, with the primary source being
Moody’s Investors Service (“Moody’s”), an internationally recognized statistical rating organization. Excludes Structured Products, which represent 7.4% of the fair value of the portfolio at December 31, 2023. 40

Conclusion 41

CONCLUSION Reasons to Own MFIC SECULAR TAILWINDS AND RECENT VOLATILITY
CREATE ATTRACTIVE ENVIRONMENT FOR PRIVATE CREDIT 1 1 ROBUST ORIGINATION CAPABILITIES OF MIDCAP FINANCIAL / APOLLO PROVIDE ATTRACTIVE AND SIGNIFICANT 2 DEAL FLOW PRUDENT PORTFOLIO CONSTRUCTION WITH FOCUS ON FIRST LIEN, CASH PAY, FLOATING RATE LOANS
TO MIDDLE 3 MARKET COMPANIES INDUSTRY-LEADING, SHAREHOLDER-FRIENDLY FEE STRUCTURE 4 1. MidCap Financial refers to MidCap FinCo Designated Activity Company, a designated activity company limited by shares incorporated under the laws of Ireland, and
its subsidiaries, including MidCap Financial Services, LLC. MidCap Financial is managed by Apollo Capital Management, L.P., a subsidiary of Apollo Global Management, Inc., pursuant to an investment management agreement between Apollo Capital
Management, L.P. and MidCap FinCo Designated Activity Company. MidCap Financial is not an investment adviser, subadviser or fiduciary to the Corporation or to the Corporation’s Investment Adviser. MidCap Financial is not obligated to take into
account the Corporation's interests (or those of other potential participants in assets sourced) when sourcing loans across its platform. 42

Appendix 43

MFIC Senior Leadership Team Howard T. Widra Executive Chairman Mr. Widra
has been with Apollo and/or its affiliates since 2013 and serves as Apollo’s Head of Direct Origination. He was appointed Executive Chairman in August 2022. He served as the Company’s Chief Executive Officer from May 2018 to August 2022
and as President from June 2016 to May 2018. He has also been a Director since May 2018. Mr. Widra was a co-founder of MidCap Financial, a middle-market specialty finance firm with $21.3 billion of annual originations1 and was formerly its Chief
Executive Officer. Prior to MidCap Financial, Mr. Widra was the founder and President of Merrill Lynch Capital Healthcare Finance. Prior to Merrill Lynch, Mr. Widra was President of GE Capital Healthcare Commercial Finance and held senior roles in
its predecessor entities including President of Heller Healthcare Finance, and COO of Healthcare Financial Partners. Mr. Widra holds a J.D., Cum Laude, from the Harvard Law School and a BA from the University of Michigan. Tanner Powell Chief
Executive Officer Mr. Powell joined Apollo in 2006. Mr. Powell was appointed Chief Executive Officer of the Company in August 2022. He served as President of the Company from May 2018 to August 2022 and served as Chief Investment Officer for the
Company’s investment adviser from June 2016 to August 2022. Mr. Powell is a Managing Director and Portfolio Manager in Apollo’s Direct Origination business. He holds leadership roles in Apollo’s Credit Business, including its
aircraft leasing and lending businesses. From 2004 to 2006, he served as an analyst in Goldman Sachs’ Principal Investment Area (PIA). From 2002 to 2004, Mr. Powell was an Analyst in the Industrials group at Deutsche Bank. He graduated from
Princeton University with a BA in political economy. Ted McNulty President and Chief Investment Officer, AIM Mr. McNulty joined Apollo in 2014. He is a is Managing Director in Apollo’s Credit business. He was appointed President of the Company
and Chief Investment Officer for the Company’s investment adviser in August 2022. Prior to joining Apollo, Mr. McNulty ran the mezzanine and later merchant banking business for a subsidiary of Mitsubishi UFJ, and was a director at Haland
before that. Previously, he held various roles at JPMorgan and its predecessor institutions, primarily in leveraged finance. Mr. McNulty received an MBA from the Kellogg School of Management and a BA in Government from Harvard University. Greg Hunt
Chief Financial Officer Mr. Hunt is a Managing Director of Finance at Apollo Global Management, Inc. He began his term as Chief Financial Officer and Treasurer of the Company in May 2012. Mr. Hunt also currently serves as Interim Chief Financial
Officer for Apollo Debt Solutions BDC. Previously, Mr. Hunt was Executive Vice President and Chief Financial Officer for Yankee Candle which he joined in April 2010. Prior to joining Yankee Candle, Mr. Hunt served as the Executive Vice President of
Strategic and Commercial Development for Norwegian Cruise Lines from 2007 to 2009. Prior to joining Norwegian Cruise Lines, Mr. Hunt served as Chief Financial Officer and Chief Restructuring Officer of Tweeter Home Entertainment Group, Inc. from
2006 to 2007 and Chief Financial Officer and Co-Chief Executive of Syratech Corporation from 2001 to 2006. Prior to Syratech, Mr. Hunt held several senior financial leadership positions including Chief Financial Officer of NRT Inc., Culligan Water
Technologies, Inc. and Samsonite `Corporation. Mr. Hunt has also served as a Director and Chairman of the Audit Committee of Kymera International, a global manufacturer and supplier of metal products, since January 2020; and as Director and Chairman
of the Audit Committee of Danimer Scientific (DNMR/NYSE), a leading developer and manufacturer of biodegradable plastic products, since June 2019. He is also the Co- Chair on the Board of Advisors for the University of Vermont School of Business.
Mr. Hunt earned a bachelor’s degree in accounting and finance from the University of Vermont and is a Certified Public Accountant. 44

MFIC Senior Leadership Team (continued) Kristin Hester Chief Legal Officer
and Secretary Ms. Hester joined Apollo in 2015 and currently serves as Senior Counsel for Apollo. She was promoted to Chief Legal Officer for the Company in August 2022 and served as General Counsel for the Company from May 2020 to August 2022. Ms.
Hester also serves as General Counsel for Apollo Debt Solutions BDC, Apollo Senior Floating Rate Fund Inc., and Apollo Tactical Income Fund Inc. Prior to joining Apollo, Ms. Hester was associated with the law firms of Dechert LLP from 2009-2015 and
Clifford Chance US LLP from 2006-2009. In each case she primarily advised U.S. registered investment companies, their investment advisers, and boards of directors on various matters under the Investment Company Act of 1940. Ms. Hester received her
JD from Duke University School of Law and graduated cum laude from Bucknell University with a BS in Business Administration.. Ryan Del Giudice Chief Compliance Officer Mr. Del Giudice joined Apollo in 2022 and serves as the Chief Compliance Officer
for the Apollo Diversified Real Estate Fund, Apollo Diversified Credit Fund, Apollo Debt Solutions BDC, MidCap Financial Investment Corporation, Apollo Senior Floating Rate Fund Inc., and Apollo Tactical Income Fund, Inc. Before joining Apollo, Mr.
Del Giudice was the Chief Compliance Officer and SVP of Operations for Griffin Capital's interval fund platform and registered investment advisers subsidiaries from 2017 to 2022. Prior to that, Mr. Del Giudice was a Vice President at Cipperman
Compliance Services (acquired by Foreside), a boutique compliance consulting firm, where he served as the Chief Compliance Officer and/or consultant for registered investment companies, business development companies and alternative asset managers.
Mr. Del Giudice graduated from St. Joseph’s University with a BS in Business Administration and Finance. Patrick Ryan Chief Credit Officer, AIM Mr. Ryan joined Apollo Capital Management, L.P. in 2015 as Managing Director and Chief Credit
Officer. Prior to joining Apollo, Mr. Ryan was at Citibank since 1996 in various Senior Credit Officer roles across all of Citi’s asset classes and geographies, including most recently serving as Chief Credit Officer for Citi’s $600
billion corporate credit portfolio and Chief Risk Officer overseeing risk governance and risk management for Citibank N.A.’s $1.3 trillion balance sheet. Mr. Ryan co-founded Staten Island ACHIEVE Dollars for Scholars, a charitable foundation
providing college scholarships to students on Staten Island. Mr. Ryan co-founded the Cardinal Scholarships and is a Member of the Wesleyan University Athletic Advisory Council. Mr. Ryan has a B.A. in American History from Wesleyan University and a
M.B.A. from Columbia Business School. 45

1 MFIC Top Corporate Lending Issuers as of December 31, 2023 Fair Value %
of Total ($ in millions) Portfolio 2 1 ChyronHego Corporation $ 129 5.5% 2 Lending Point $ 44 1.9% 3 LashCo $ 43 1.9% Top 10 4 Beacon Mobility $ 37 1.6% 19.2% Corporate Lending 5 PSI Services, LLC $ 36 1.5% 6 UpStack $ 32 1.4% 3 Average Funded
Position $14.7 m 7 Activ $ 32 1.4% 8 Rise Baking $ 32 1.4% Average New Commitment Made in 2023 $6.5 m 9 Truck-Lite Co., LLC $ 31 1.3% 10 Thomas Scientific $ 31 1.3% 11 New Era Technology, Inc. $ 31 1.3% 12 Medical Guardian $ 31 1.3% 13 IPS $ 31 1.3%
14 Englert $ 31 1.3% 15 Heniff and Superior $ 31 1.3% 16 AML Rightsource $ 31 1.3% 17 US Auto $ 31 1.3% 18 Berner Foods $ 30 1.3% 19 Turkey Hill $ 29 1.3% 20 High Street Insurance $ 29 1.2% 21 Club Car Wash $ 28 1.2% 22 Modern Campus $ 27 1.1% 23
AVAD, LLC $ 27 1.1% 24 US Legal Support $ 25 1.1% 25 PHS $ 25 1.1% 26 FingerPaint Marketing $ 25 1.1% 27 NSi Industries $ 25 1.1% 28 Jacent $ 23 1.0% 29 Westfall Technik, Inc. $ 23 1.0% 30 Pro Vigil $ 23 1.0% Other (120 companies) $ 1,332 57.1%
Total Portfolio (150 companies) $ 2,334 100.0% 1. Corporate lending includes leveraged lending, life sciences, franchise finance, asset based and lender finance. Excludes Merx Aviation and other select investments. Top portfolio companies based on
fair value as of December 31, 2023. 2. The ChyronHego Corporation exposure includes $108 million first lien secured debt and $21 million preferred equity. 3. At fair value. 46

Financial Highlights ($ in thousands, except per share data) Dec-23 Sep-23
Jun-23 Mar-23 Dec-22 Financial Highlights Net investment income per share $0.46 $0.43 $0.44 $0.45 $0.43 Net realized and change in unrealized gains (losses) from investments and $0.05 $0.03 ($0.05) $0.01 ($0.41) foreign currencies per share Earnings
(loss) per share $0.51 $0.46 $0.39 $0.46 $0.02 Net asset value per share $15.41 $15.28 $15.20 $15.18 $15.10 Distribution recorded per common share $0.38 $0.38 $0.38 $0.38 $0.37 1 Net leverage ratio 1.34 x 1.40 x 1.45 x 1.41 x 1.41 x Investment
Activity Commitments Gross commitments made $174,939 $19,745 $78,733 $110,331 $73,269 Exits of commitments (178,112) (75,053) (63,809) (131,921) (93,482) Net investment commitments made ($3,173) ($55,307) $14,925 ($21,590) ($20,214) Funded
Investment Activity Gross fundings, excluding Merx Aviation and revolvers $113,518 $16,188 $72,828 $105,792 $104,551 Net fundings, including Merx Aviation and revolvers ($46,536) (42,581) $22,366 ($20,471) ($47,706) Notes: Numbers may not sum due to
rounding. 1. The Company’s net leverage ratio is defined as debt outstanding plus payable for investments purchased, less receivable for investments sold, less cash and cash equivalents, less foreign currencies, divided by net assets.
47

Portfolio Highlights ($ in thousands) Dec-23 Sep-23 Jun-23 Mar-23 Dec-22
Portfolio by Strategy, at fair value ($) Leveraged lending $1,788,586 $1,788,540 $1,830,834 $1,803,762 $1,733,659 Life sciences 153,666 187,698 189,687 204,036 213,278 Asset based, franchise finance and lender finance 155,000 150,617 147,661 128,119
137,776 Other 45,829 46,856 48,215 52,080 51,962 1 $2,143,081 $2,173,711 $2,216,396 $2,187,997 $2,136,674 Corporate lending and other portfolio Merx Aviation 191,118 195,397 192,891 197,214 261,446 Total investment portfolio $2,334,199 $2,369,108
$2,409,287 $2,385,211 $2,398,120 Portfolio by Strategy, at fair value (%) Leveraged lending 76% 76% 76% 76% 72% Life sciences 7% 8% 8% 9% 9% Asset based, franchise finance and lender finance 7% 6% 6% 5% 6% Other 2% 2% 2% 2% 2% 1 Corporate lending
and other portfolio 92% 92% 92% 92% 89% Merx Aviation 8% 8% 8% 8% 11% Total investment portfolio 100% 100% 100% 100% 100% 2 Weighted Average Yield on Debt Investments, average 1 12.2% 12.0% 11.7% 11.3% 10.3% Corporate lending portfolio 3 Merx
Aviation 9.8% 9.7% 9.9% 10.0% 10.0% Core portfolio 12.1% 11.9% 11.6% 11.2% 10.3% Number of portfolio companies, at period end 152 149 150 141 135 1. Corporate lending includes leveraged lending, life sciences, franchise finance, asset based and
lender finance. Excludes Merx Aviation and select other assets. 2. Based on average of beginning of period and end of period portfolio yield. On a cost basis. Exclusive of investments on non-accrual status. 3. Based on yield on $74 million debt
investment out of a total investment of $191 million on a fair value basis. 48

1 Corporate Lending Portfolio Detail ($ in thousands) Dec-23 Sep-23 Jun-23
Mar-23 Dec-22 Portfolio by Asset Class, measured at fair value ($) First Lien $2,016,930 $2,010,175 $2,050,105 $2,015,709 $1,965,800 Second lien 31,886 $66,558 $68,441 69,357 70,919 Other 48,435 $50,122 $49,636 50,852 47,994 Total corporate lending
portfolio $2,097,252 $2,126,855 $2,168,182 $2,135,917 $2,084,712 Portfolio by Asset Class, measured at fair value (%) First Lien 96% 95% 95% 94% 94% Second lien 2% 3% 3% 4% 4% Other 2% 2% 2% 2% 2% Total corporate lending portfolio 100% 100% 100%
100% 100% Weighted Average Spread over SOFR of Floating Rate Assets (in bps) First Lien 620 614 607 606 602 Second lien 796 846 846 846 846 Weighted average spread 623 621 614 613 610 2, 3, 4, 5 Weighted Average Net Leverage First Lien 5.26 x 5.47 x
5.47 x 5.46 x 5.51 x Second lien 5.90 x 4.83 x 4.96 x 5.07 x 5.04 x Weighted average net leverage 5.27 x 5.44 x 5.45 x 5.45 x 5.49 x Interest Rate Type, measured at fair value Fixed rate % 0% 0% 0% 0% 0% Floating rate % 100% 100% 100% 100% 100%
Sponsored / Non-sponsored, measured at fair value Sponsored % 88% 86% 86% 86% 86% Non-sponsored % 12% 14% 14% 14% 14% Other Metrics Pursuant to co-investment order % 86% 86% 86% 86% 86% Average borrower exposure $14,666 $15,192 $15,377 $16,181
$16,545 6 2, 4, 5 1.9 x 1.9 x 2.1 x 2.3 x 2.5 x Interest coverage 2, 4, 5 0.1 x 0.1 x 0.1 x 0.1 x 0.2 x Attachment point 1. Corporate lending includes leveraged lending, life sciences, franchise finance, asset based and lender finance. Excludes Merx
Aviation and select other assets. 2. Source: Company data. 3. Through MFIC position. 4. Excludes select investments where metric is not relevant or appropriate or data is not available. 5. Weighted average by cost. Current metric. 6. The weighted
average interest coverage ratio of the corporate lending portfolio was 1.8x based on TTM EBITDA through September 2023 and estimated 49 annualized interest expense assuming December 31, 2023 base rates.

1 Corporate Lending Commitments ($ in thousands) Dec-23 Sep-23 Jun-23
Mar-23 Dec-22 Gross Commitments Made by Asset Class First lien $174,923 $19,745 $78,733 $110,020 $73,178 Second lien and Other 16 - - 311 90 Gross commitments made $174,939 $19,745 $78,733 $110,331 $73,269 Gross Commitments Made Information Number
of portfolio companies 20 9 15 15 9 Average commitment size $8,747 $2,194 $5,249 $7,355 $8,141 Floating Rate % 96% 100% 100% 100% 100% Pursuant to co-investment order % 100% 100% 94% 100% 97% Weighted Average Spread over LIBOR of New Floating Rate
Commitments (in bps) First lien 625 672 681 665 680 Second lien N/A N/A N/A N/A N/A Weighted average spread 625 672 681 665 680 2 Weighted Average Net Leverage of New Commitments First lien 3.6 x 2.7 x 3.7 x 4.2 x 4.8 x Second lien N/A N/A N/A N/A
N/A Weighted average net leverage 3.6 x 2.7 x 3.7 x 4.2 x 4.8 x Exits of Commitments by Asset Class First lien ($143,876) ($75,025) ($63,803) ($108,139) ($93,482) Second lien and Other ($34,235) (27) (6) (23,782) (0) Exits of commitments ($178,112)
($75,053) ($63,809) ($131,921) ($93,482) 1. Corporate lending includes leveraged lending, life sciences, franchise finance, asset based and lender finance. Excludes Merx Aviation and select other investments. 2. Source: Company data. through MFIC
position. Excludes select investments where debt-to-EBITDA is not a relevant or appropriate metric, or data is not available. Weighted average by cost. Current metric. 50

Funded Investment Activity ($ in thousands) Dec-23 Sep-23 Jun-23 Mar-23
Dec-22 Fundings, excluding Merx Aviation and Revolvers Gross fundings $113,518 $16,188 $72,828 $105,792 $104,551 Sales and syndications - - - - (27,500) Repayments (152,086) (58,552) (57,666) (54,151) (113,460) Net fundings, excluding Merx Aviation
and revolvers ($38,568) ($42,364) $15,163 $51,640 ($36,409) Merx Aviation Gross Fundings $- $- $- $- $- Repayments (7,000) - (3,500) (65,425) - Net fundings, Merx Aviation ($7,000) $- ($3,500) ($65,425) $- Revolvers, excluding Merx Aviation Gross
Fundings $20,602 $14,157 $28,773 $45,266 $54,345 Sales and Syndications - - - - - Repayments (21,570) (14,373) (18,069) (51,953) (65,642) Net fundings, revolvers ($968) ($217) $10,703 ($6,686) ($11,297) Total Funded Investment Activity Gross
Fundings $134,120 $30,345 $101,601 $151,058 $158,896 Sales and Syndications - - - - (27,500) Repayments (180,657) (72,925) (79,235) (171,529) (179,102) Net fundings, including Merx Aviation and revolvers ($46,536) ($42,581) $22,366 ($20,471)
($47,706) Number of Portfolio Companies Number of portfolio companies, at beginning of period 149 150 141 135 136 Number of new portfolio companies 10 2 12 8 5 Number of exited portfolio companies (7) (3) (3) (2) (6) Number of portfolio companies,
at period end 152 149 150 141 135 51

Credit Quality As of December 31, 2023, 1.2% of total investments at
amortized cost, or 0.2% of total investments at fair value, were on non-accrual status ($ in thousands) Dec-23 Sep-23 Jun-23 Mar-23 Dec-22 Investments on Non-Accrual Status Non-accrual investments at amortized cost $31,568 $33,065 $25,822 $25,822
$49,443 Non-accrual investments/total portfolio, at amortized cost 1.2% 1.3% 1.0% 1.0% 1.9% Non-accrual investments at fair value $5,706 $11,637 $7,462 $8,731 $10,437 Non-accrual investments/total portfolio, at fair value 0.2% 0.5% 0.3% 0.4% 0.4%
Investments on Non-Accrual Status as of December 31, 2023 Industry Cost Fair Value Ambrosia Buyer Corp. $15,201 $2,207 Business Services Crowne Automotive 1,284 398 Automotive Sequential Brands Group, Inc. - 238 Consumer Goods – Non-durable
Solarplicity Group Limited (f/k/a AMP Solar UK) 7,231 2,146 Energy – Electricity ViewRay 7,852 716 Healthcare & Pharmaceuticals Total $31,568 $5,706 Note: Numbers may not sum due to rounding. 52
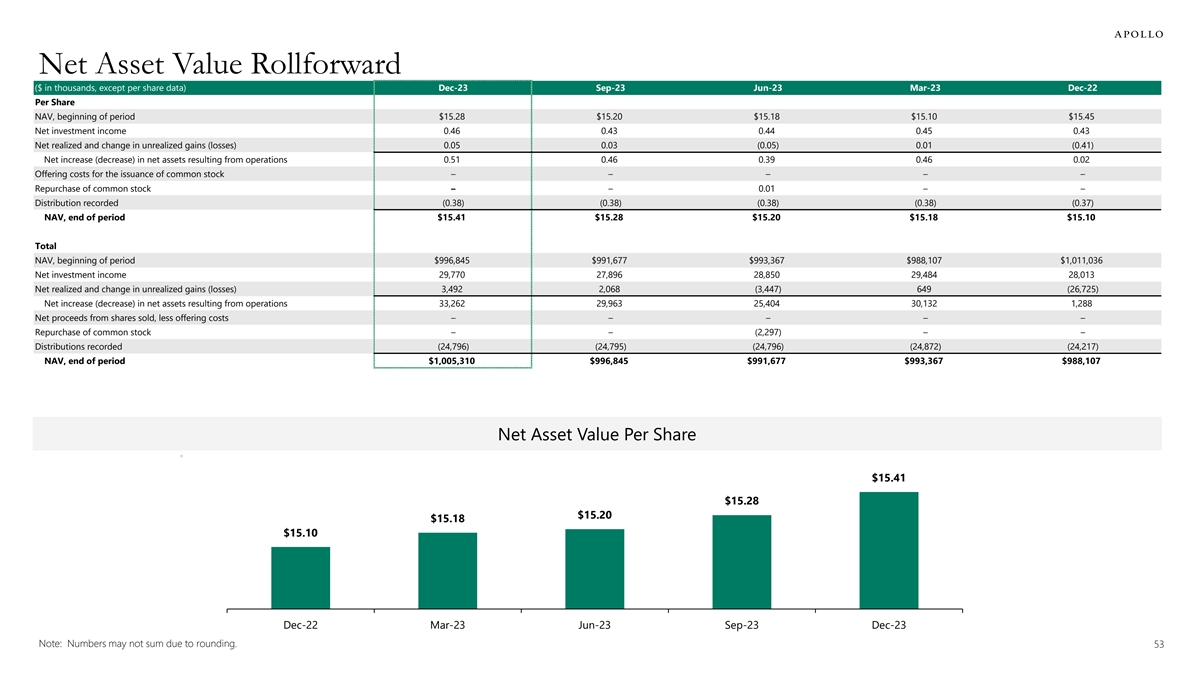
Net Asset Value Rollforward ($ in thousands, except per share data) Dec-23
Sep-23 Jun-23 Mar-23 Dec-22 Per Share NAV, beginning of period $15.28 $15.20 $15.18 $15.10 $15.45 Net investment income 0.46 0.43 0.44 0.45 0.43 Net realized and change in unrealized gains (losses) 0.05 0.03 (0.05) 0.01 (0.41) Net increase
(decrease) in net assets resulting from operations 0.51 0.46 0.39 0.46 0.02 Offering costs for the issuance of common stock – – – – – Repurchase of common stock – – 0.01 – – Distribution recorded
(0.38) (0.38) (0.38) (0.38) (0.37) NAV, end of period $15.41 $15.28 $15.20 $15.18 $15.10 Total NAV, beginning of period $996,845 $991,677 $993,367 $988,107 $1,011,036 Net investment income 29,770 27,896 28,850 29,484 28,013 Net realized and change
in unrealized gains (losses) 3,492 2,068 (3,447) 649 (26,725) Net increase (decrease) in net assets resulting from operations 33,262 29,963 25,404 30,132 1,288 Net proceeds from shares sold, less offering costs – – – –
– Repurchase of common stock – – (2,297) – – Distributions recorded (24,796) (24,795) (24,796) (24,872) (24,217) NAV, end of period $1,005,310 $996,845 $991,677 $993,367 $988,107 Net Asset Value Per Share $16 $15.41
$15.28 $15.20 $15.18 $15 $15.10 $15 $15 Dec-22 Mar-23 Jun-23 Sep-23 Dec-23 Note: Numbers may not sum due to rounding. 53

Quarterly Operating Results ($ in thousands, except per share data) Dec-23
Sep-23 Jun-23 Mar-23 Dec-22 Total investment income Interest income (excluding PIK) $70,065 $66,681 $66,655 $64,787 $61,543 Dividend income 473 740 115 23 191 PIK interest income 930 479 812 784 851 Other income 484 275 1,034 2,184 735 Total
investment income $71,951 $68,175 $68,617 $67,778 $63,320 Expenses Management fees $4,397 $4,374 $4,334 $4,264 $8,758 Performance-based incentive fees 6,332 5,917 6,120 6,196 318 Interest and other debt expenses 27,155 26,275 26,002 24,766 22,760
Administrative services expense 1,371 1,621 1,425 1,422 1,601 Other general and administrative expenses 3,144 2,494 2,236 2,256 2,169 Total expenses 42,399 40,682 40,117 38,904 35,605 Management and performance-based incentive fees waived and offset
- - - (274) (16) Expense reimbursements (218) (403) (351) (335) (282) Net expenses $42,182 $40,279 $39,767 $38,295 $35,307 Net investment income $29,770 $27,896 $28,850 $29,484 $28,013 Net realized gains (losses) 1,400 ($200) ($166) ($834) ($69,363)
Net change in unrealized gains (losses) 2,092 2,267 (3,280) 1,483 42,638 Net realized and change in unrealized gains (losses) 3,492 2,068 (3,447) 649 (26,725) Net increase (decrease) in net assets resulting from operations $33,262 $29,963 $25,404
$30,132 $1,288 Additional Data Net investment income per share $0.46 $0.43 $0.44 $0.45 $0.43 Earnings (loss) per share $0.51 $0.46 $0.39 $0.46 $0.02 Distribution recorded per common share $0.38 $0.38 $0.38 $0.38 $0.37 Weighted average shares
outstanding 65,253,275 65,253,275 65,366,516 65,451,359 65,451,359 Shares outstanding, end of period 65,253,275 65,253,275 65,253,275 65,451,359 65,451,359 Note: Numbers may not sum due to rounding. 54
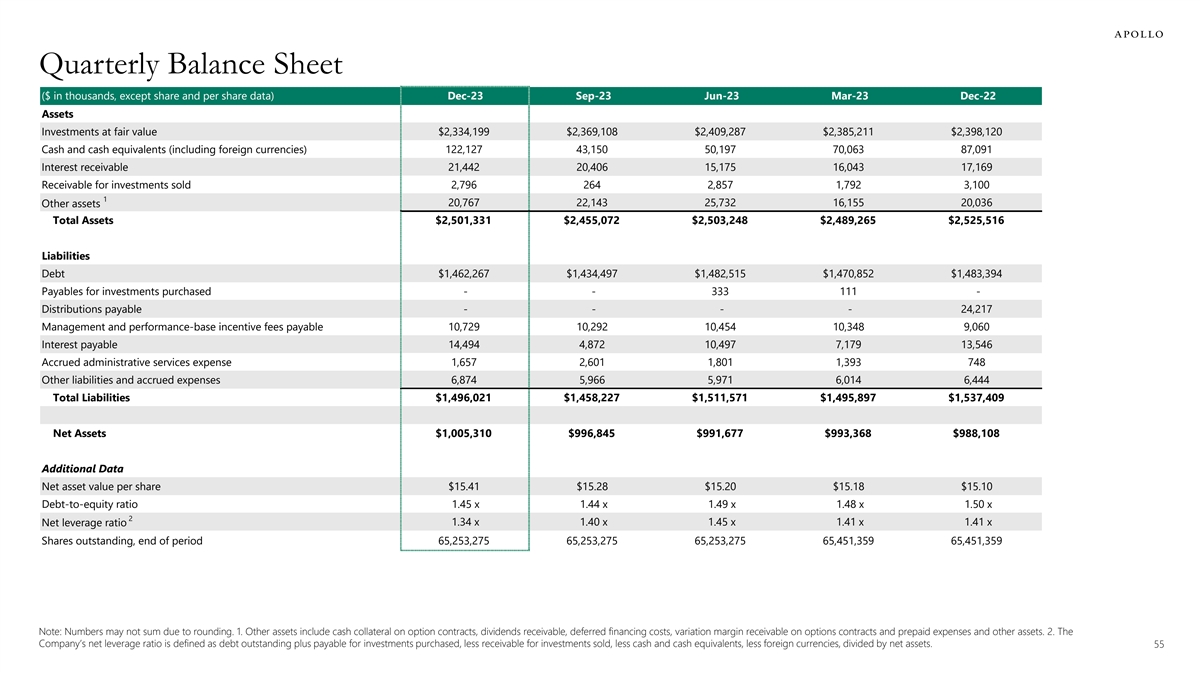
Quarterly Balance Sheet ($ in thousands, except share and per share data)
Dec-23 Sep-23 Jun-23 Mar-23 Dec-22 Assets Investments at fair value $2,334,199 $2,369,108 $2,409,287 $2,385,211 $2,398,120 Cash and cash equivalents (including foreign currencies) 122,127 43,150 50,197 70,063 87,091 Interest receivable 21,442 20,406
15,175 16,043 17,169 Receivable for investments sold 2,796 264 2,857 1,792 3,100 1 20,767 22,143 25,732 16,155 20,036 Other assets Total Assets $2,501,331 $2,455,072 $2,503,248 $2,489,265 $2,525,516 Liabilities Debt $1,462,267 $1,434,497 $1,482,515
$1,470,852 $1,483,394 Payables for investments purchased - - 333 111 - Distributions payable - - - - 24,217 Management and performance-base incentive fees payable 10,729 10,292 10,454 10,348 9,060 Interest payable 14,494 4,872 10,497 7,179 13,546
Accrued administrative services expense 1,657 2,601 1,801 1,393 748 Other liabilities and accrued expenses 6,874 5,966 5,971 6,014 6,444 Total Liabilities $1,496,021 $1,458,227 $1,511,571 $1,495,897 $1,537,409 Net Assets $1,005,310 $996,845 $991,677
$993,368 $988,108 Additional Data Net asset value per share $15.41 $15.28 $15.20 $15.18 $15.10 Debt-to-equity ratio 1.45 x 1.44 x 1.49 x 1.48 x 1.50 x 2 Net leverage ratio 1.34 x 1.40 x 1.45 x 1.41 x 1.41 x Shares outstanding, end of period
65,253,275 65,253,275 65,253,275 65,451,359 65,451,359 Note: Numbers may not sum due to rounding. 1. Other assets include cash collateral on option contracts, dividends receivable, deferred financing costs, variation margin receivable on options
contracts and prepaid expenses and other assets. 2. The Company’s net leverage ratio is defined as debt outstanding plus payable for investments purchased, less receivable for investments sold, less cash and cash equivalents, less foreign
currencies, divided by net assets. 55

Funding Sources as of December 31, 2023 Debt Facilities ($ in thousands)
Debt Issued/ Final Maturity Interest Principal Amount Amended Date Rate Outstanding Secured Facilities: 1 4 Senior Secured Facility ($1.705 billion) 4/19/2023 4/19/2028 SOFR + 187.5 +10bps $ 682, 977 6 5 MFIC Bethesda CLO 1 LLC Class A-1 Notes
11/2/2023 10/23/2035 SOFR + 240bps 232, 000 Subtotal 914, 977 Unsecured Notes: 2025 Notes 3/3/2015 3/3/2025 5.250% 350, 000 2026 Notes 7/16/2021 7/16/2026 4.500% 125, 000 7 2028 Notes 12/13/2023 12/15/2028 8.000% 80, 000 Subtotal 555, 000 2 3
Weighted Average Annualized Interest Cost & Total Debt Obligations 6.938% 1, 469,977 Deferred Financing Cost and Debt Discount ( 7,710) Total Debt Obligations, Net of Deferred Financing Cost and Debt Discount $ 1, 462,267 1. Lender commitments
under the Facility will remain $1.705 billion until December 22, 2024 and will decrease to $1.550 billion thereafter. 2. Includes the stated interest expense and commitment fees on the unused portion of the Senior Secured Facility. Excludes
amortized debt issuance costs. For the three months ended December 31, 2023. Based on average debt obligations outstanding. 3. There was an increase in interest rate of 18 bps quarter-over-quarter; from 6.76% to 6.94% due to increase in SOFR. 4.
Interest Rate for all lender commitments, excluding Special Non-Extending Lenders ($50 million commitment) is SOFR + 187.5 + 10bps for USD facilities and SONIA +187.5 + 10bps for GBP facilities. Interest Rate for Special Non-Extending Lenders ($50
million commitment) is SOFR + 200 + 10bps for USD facilities and SONIA + 200 + 10bps for GBP facilities. 5 Class A-1 Senior Secured Floating Rate Notes bear interest at the three-month SOFR plus 2.40% 6. On November 2, 2023, the Company completed a
$402.36 million middle market collateralized loan obligation transaction. The Company sold the AAA Class A-1 Notes ($232.00 million par with a coupon of three-month SOFR plus 2.40%) and retained all Class A-2 Notes and all Subordinated Notes.
Proceeds from the CLO transaction were used to repay borrowings under the Company’s Senior Secured Facility. 7. On December 13, 2023, the Company issued $86.25 million aggregate principal amount of 8.00% Notes due 2028 (inclusive of $11.25
million aggregate principal amount pursuant to the underwriters’ overallotment option to purchase additional Notes). 56

Interest Rate Exposure as of December 31, 2023 1 Investment Portfolio by
Interest Rate Type Funding Sources by Interest Rate Type Variable rate assets Fixed rate debt 2% Fixed rate assets 22% 4% Non yielding and non-accrual assets 8% Common equity 41% Floating rate debt Floating rate 37% assets 86% Floating Rate Asset
Floor Net Investment Income Interest Rate Sensitivity Annual Net Investment Par or Cost Annual Net Investment % of Floating Rate Portfolio Income (in millions) Income Per Share (in millions) Interest Rate Floors Basis Point Change No Floor $58 3% Up
150 basis points $14.0 $0.214 < 1.00% 160 8% Up 100 basis points $9.3 $0.143 1.00% to 1.24% 1,633 80% Up 50 basis points $4.7 $0.071 1.25% to 1.49% 0 0% Down 50 basis points ($4.7) ($0.071) 1.50% to 1.74% 39 2% Down 100 basis points ($9.3)
($0.143) > = 1.75% 152 7% Down 150 basis points ($14.0) ($0.214) Note: Numbers may not sum due to rounding. 1. Total investment portfolio. On a fair value basis. 57

Realized and Change in Unrealized Gains (Losses) by Strategy ($ in
millions) Dec-23 Sep-23 Jun-23 Mar-23 Dec-22 Leveraged lending $4.5 $0.0 ($0.5) $1.0 ($13.6) Life sciences ($3.3) ($2.2) ($2.0) $0.1 $1.3 Franchise Finance $0.0 $0.1 $0.1 ($0.1) ($0.1) Asset based and Lender finance $2.7 $0.2 $1.8 $0.2 ($0.4) Fx
gain (loss) on corporate lending ($2.0) $2.2 ($1.6) ($0.9) ($3.5) Corporate lending portfolio $1.9 $0.4 ($2.3) $0.2 ($16.3) Merx Aviation $2.7 $2.5 ($0.8) $1.2 ($4.2) Other ($1.1) ($0.8) ($0.3) ($0.8) ($6.3) Total investment portfolio $3.5 $2.1
($3.4) $0.6 ($26.7) Corporate Lending Gain (Loss) by Lien Type 1st lien corporate lending $4.1 ($0.3) $0.0 ($0.8) ($2.3) 2nd lien corporate Lending ($2.2) $0.7 ($2.3) $1.0 ($14.0) Corporate lending portfolio $1.9 $0.4 ($2.3) $0.2 ($16.3) per share
Dec-23 Sep-23 Jun-23 Mar-23 Dec-22 Leveraged lending $0.07 $0.00 ($0.01) $0.01 ($0.21) Life sciences ($0.05) ($0.03) ($0.03) $0.00 $0.02 Franchise Finance $0.00 $0.00 $0.00 ($0.00) ($0.00) Asset based and Lender finance $0.04 $0.00 $0.03 $0.00
($0.01) Fx gain (loss) on corporate lending ($0.03) $0.03 ($0.02) ($0.01) ($0.05) Corporate lending portfolio $0.03 $0.01 ($0.04) $0.00 ($0.25) Merx Aviation $0.04 $0.04 ($0.01) $0.02 ($0.06) Other ($0.02) ($0.01) ($0.00) ($0.01) ($0.10) Total
investment portfolio $0.05 $0.03 ($0.05) $0.01 ($0.41) Corporate Lending Gain (Loss) by Lien Type 1st lien corporate lending $0.06 ($0.01) $0.00 ($0.01) ($0.04) 2nd lien corporate Lending ($0.03) $0.01 ($0.04) $0.02 ($0.21) Corporate lending
portfolio $0.03 $0.01 ($0.04) $0.00 ($0.25) Note: Numbers may not sum due to rounding. 58

Outstanding Commitments ($ in thousands) Dec-23 Sep-23 Jun-23 Mar-23
Dec-22 Revolver Obligations and Bridge Loans 1 $89,089 $89,691 $88,357 $100,566 $106,919 Funded 1, 2 Unfunded 176,723 175,720 181,088 182,462 196,408 Par $265,811 $265,411 $269,445 $283,029 $303,327 3 Unfunded Revolver and Bridge Loan Availability
Unavailable $2,336 $1,588 $2,479 $1,926 $3,694 Available 174,387 174,132 178,609 180,536 192,714 Total Unfunded $176,723 $175,720 $181,088 $182,462 $196,408 4 Delayed Draw Term Loans Par $167,756 $142,575 $154,550 $176,702 $198,750 Number of
borrowers 37 37 40 39 34 See Note 9 (Commitments and Contingencies) in the Company's Form 10-K for the year ended December 31, 2023 for additional information. 1. The funded revolver obligations include standby letters of credit issued and
outstanding under the Senior Secured Facility. The unfunded revolver obligations include all other standby letters of credit issued and outstanding. 2. The unfunded revolver obligations relate to loans with various maturity dates. 3. Revolver
availability is determined based on each loan’s respective credit agreement which includes covenants that need to be met prior to funding and / or collateral availability for asset-based revolver obligations. 4. The delayed draw term loans
include conditionality for the use of proceeds and are generally only accessible for acquisitions and also require lender approval. In addition, the delayed draw term loans require the satisfaction of certain pre-negotiated terms and conditions
which can include covenants to maintain specified leverage levels and other related borrowing base covenants. 59

Portfolio by Strategy and Lien Type $ in 000's First Lien Second Lien
Other Total Corporate lending $ 2,018,751 $ 31,887 $ 48,435 $ 2,099,072 Merx Aviation 74,075 - 117,043 191,118 Other 14,646 - 31,183 45,829 Total Potfolio $ 2,107,472 $ 31,887 $ 196,660 $ 2,336,019 % Total Portfolio First Lien Second Lien Other
Total Corporate lending 86% 1% 2% 90% Merx Aviation 3% 0% 5% 8% Other 1% 0% 1% 2% Total Potfolio 90% 1% 8% 100% % Corporate Lending First Lien Second Lien Other Total Corporate lending 96% 2% 2% 100% At fair value. As of December 31, 2023.
60

Contact Information Elizabeth Besen Gregory W. Hunt Investor Relations
Manager Chief Financial Officer and Treasurer Phone: (212) 822-0625 Phone: (212) 822-0655 Email: ebesen@apollo.com Email: ghunt@apollo.com 61
Apollo Tactical Income (NYSE:AIF)
Historical Stock Chart
Von Mär 2024 bis Apr 2024

Apollo Tactical Income (NYSE:AIF)
Historical Stock Chart
Von Apr 2023 bis Apr 2024
