false
0000917251
0000917251
2024-03-01
2024-03-01
0000917251
us-gaap:CommonStockMember
2024-03-01
2024-03-01
0000917251
adc:DepositarySharesMember
2024-03-01
2024-03-01
iso4217:USD
xbrli:shares
iso4217:USD
xbrli:shares
UNITED STATES
SECURITIES AND EXCHANGE COMMISSION
WASHINGTON, D.C. 20549
______________
FORM 8-K
CURRENT REPORT
PURSUANT TO SECTION 13 OR 15(d) OF THE
SECURITIES EXCHANGE ACT OF 1934
Date of report (Date
of earliest event reported): March 1, 2024
AGREE REALTY CORPORATION
(Exact name of registrant as specified in
its charter)
Maryland
(State or other jurisdiction of incorporation)
|
1-12928
(Commission file number) |
38-3148187
(I.R.S. Employer Identification No.) |
| |
|
|
32301 Woodward Avenue
Royal Oak, Michigan
(Address of principal
executive offices)
|
48073
(Zip code) |
(Registrant’s telephone number, including
area code) (248) 737-4190
Not applicable
(Former name or former address, if changed
since last report)
Check the appropriate box below if the Form 8-K filing is intended
to simultaneously satisfy the filing obligation of the registrant under any of the following provisions:
| ¨ |
Written communications pursuant to Rule 425
under the Securities Act (17 CFR 230.425) |
| ¨ |
Soliciting material pursuant to Rule 14a-12
under the Exchange Act (17 CFR 240.14a-12) |
| ¨ |
Pre-commencement communications pursuant to
Rule 14d-2(b) under the Exchange Act (17 CFR 240.14d-2(b)) |
| ¨ |
Pre-commencement communications pursuant to
Rule 13e-4(c) under the Exchange Act (17 CFR 240.13e-4(c)) |
Securities registered pursuant
to Section 12(b) of the Act:
| Title of each class |
Trading
Symbol(s) |
Name of each exchange on which registered |
| Common Stock, $0.0001 par value |
ADC |
New York Stock Exchange |
| Depositary Shares, each representing one-thousandth of a share of 4.25% Series A Cumulative Redeemable Preferred Stock, $0.0001 par value |
ADCPrA |
New York Stock Exchange |
Indicate by check mark whether the registrant is an
emerging growth company as defined in Rule 405 of the Securities Act of 1933 (§230.405 of this chapter) or Rule 12b-2 of the
Securities Exchange Act of 1934 (§240.12b-2 of this chapter).
Emerging growth company ¨
If an emerging growth company, indicate by check mark
if the registrant has elected not to use the extended transition period for complying with any new or revised financial accounting
standards provided pursuant to Section 13(a) of the Exchange Act. ¨
|
Item 7.01. |
Regulation FD Disclosure. |
On March 1, 2024,
the Company posted an updated investor presentation to its website at www.agreerealty.com,
which provides information on the Company’s year-to-date acquisition and development activity. The
Company disclosed that it has approximately $200 million of acquisitions that are closed, under contract or under letter of intent year-to-date.
In addition, the Company has commenced four development or Developer Funding Platform (“DFP”) projects year-to-date, with
total anticipated costs of approximately $18 million. Including the 16 projects that were ongoing at year end, the Company has 20 development
or DFP projects completed or under construction during the first quarter of 2024, totaling approximately $81 million of committed capital.
Potential acquisitions are subject to customary closing conditions, including the completion of
due diligence, and, in the case of properties subject to letters of intent, negotiation of definitive purchase and sale agreements, and
there can be no assurance that these acquisitions will be completed on the terms described above or at all.
The presentation is furnished as Exhibit 99.1
to this report and is hereby incorporated by reference. The information in this Section 7.01, including Exhibit 99.1 attached hereto,
is being furnished and shall not be deemed “filed” for the purposes of Section 18 of the Securities Exchange Act of 1934,
as amended (the “Exchange Act”), nor incorporated by reference in any filing under the Securities Act of 1933, as amended,
or the Exchange Act except as shall be expressly stated by specific reference in such filing. The furnishing of this information hereby
shall not be deemed an admission as to the materiality of any such information.
| |
Item 9.01. |
Financial Statements and Exhibits. |
(d) Exhibits
SIGNATURES
Pursuant to the requirements
of the Securities Exchange Act of 1934, the registrant has duly caused this report to be signed on its behalf by the undersigned hereunto
duly authorized.
| |
AGREE REALTY CORPORATION |
|
| |
|
|
|
|
| |
|
|
|
|
| |
By: |
/s/ Peter Coughenour |
|
| |
|
Name: |
Peter Coughenour |
|
| |
|
Title: |
Chief Financial Officer and Secretary |
|
Date: March 1, 2024
Exhibit 99.1

MARCH 2024

1 © 20 24 AGREE REALTY CORPORATION . ALL RIGHTS RESERVED. CONFIDENTIAL. Agree Realty Overview (NYSE: ADC) OUR COMPANY NET LEASE REIT FOCUSED ON THE ACQUISITION & DEVELOPMENT OF HIGH - QUALITY RETAIL PROPERTIES Founded in 1971 by Executive Chairman, Richard Agree Public on the NYSE since 1994 $ 8.2 billion (1) retail net lease REIT headquartered in Royal Oak, Michigan 2,135 retail properties totaling over 44 million square feet in 49 states Investment grade issuer ratings of Baa1 from Moody’s and BBB from S&P RE THINK RETAIL Capitalize on distinct market positioning in the retail net lease space Focus on industry - leading retailers through our three unique external growth platforms Leverage our real estate acumen and relationships to identify superior risk - adjusted opportunities Maintain a conservative and flexible capital structure that enables our growth trajectory Provide consistent, high - quality earnings growth and a well - covered, growing dividend As of December 31, 2023 , unless otherwise noted. (1) As of February 28, 2024

2 © 20 24 AGREE REALTY CORPORATION . ALL RIGHTS RESERVED. CONFIDENTIAL. consistency noun steadfast adherence to the same principles, course, or form [ kuh n - sis - tuh n - see ]

3 © 20 24 AGREE REALTY CORPORATION . ALL RIGHTS RESERVED. CONFIDENTIAL. As of December 31, 2023, unless otherwise noted. (1) As of February 28, 2024. (2) Includes capital committed to acquisitions, de velopment and Developer Funding Platform projects completed or under construction during the twelve months ended December 31, 2023. (3) As of February 9, 2024. (4) Refer to footnote 1 on s lid e 17 for the Company’s definition of Investment Grade. (5) Proforma for the settlement of the Company’s outstanding forward equity as of December 31, 2023. (6) Declared by the Company on Februa ry 8, 2024. (7) Ms. He joined the Company’s Board of Directors effective January 1, 2024. Recent Highlights Declared a monthly cash dividend of $ 0.247 per common share for February , representing a 2.9 % year - over - year increase (6) Acquired $187 million of high - quality retail net lease assets in Q4 2023 at a weighted average cap rate of 7.2% Approximately 70.5% of base rents acquired in Q4 2023 derived from investment grade retailers (4) ~$200 million of acquisitions closed, under contract or under letter of intent year - to - date (1) Approximately $236 million of forward equity raised during Q4 2023 at a net forward price of ~$61.50 per share Fortress - like balance sheet with over $1.0 billion of total liquidity as of December 31 st(5) Announced the appointment of Linglong He to the Company’s Board of Directors (7) 4.3x Proforma Net Debt to Recurring EBITDA as of December 31 st(5 ) Positive outlook placed on BBB credit rating by S&P Global Ratings (3) Announced 2023 investment activity of $1.34 billion of high - quality retail net lease assets (2) Commenced four development or DFP projects year - to - date; 20 projects representing $81 million of committed capital in Q1 2024 (1)

4 © 20 24 AGREE REALTY CORPORATION . ALL RIGHTS RESERVED. CONFIDENTIAL. ADC’s Retail Thought Leadership x Launched acquisition platform in 2010 with a focus on e - commerce resistance x Launched RE THINK RETAIL campaign to challenge misperceptions about the future of brick & mortar x Published proprietary ADC White Papers highlighting omnichannel retail trends x Avoided or actively disposed of troubled retail sectors including theaters, health & fitness and entertainment retail pre - pandemic x Early identification of promising retailers:

5 © 20 24 AGREE REALTY CORPORATION . ALL RIGHTS RESERVED. CONFIDENTIAL. Omni - Channel Vision IDENTIFIED CRITICAL ROLE OF NET LEASE IN DRIVING OMNI - CHANNEL STRATEGY “The strongest and most resilient retailers in today’s omni - channel world have embraced a comprehensive approach that blurs the historical lines between e - commerce distribution and brick & mortar operations.” - Agree Knowledge Base: Omni - Channel 101 “E very retailer in the country is going to [have to ] have billions of dollars, national retailers, to experiment, to test and eventually effectuate a true omni - channel experience because you can't be an e - commerce - based retailer or just a brick - and - mortar - based retailer today, it doesn't work.” - Joey Agree “So, I think as retailers look forward in 2016 and beyond and they're looking in the omni - channel world, how is their e - commerce presence, online ordering, physical pick up , more and more retailers are going to realize the benefit of net leased retail.” - Joey Agree Q1 2016 Earnings Call “ COVID reaffirmed our belief that, one, we're heading toward a world where all retailers are omni - channel. Brick - and - mortar is an integral part of that omnichannel overall experience. ” - Joey Agree 2022 Citi Conference

6 © 20 24 AGREE REALTY CORPORATION . ALL RIGHTS RESERVED. CONFIDENTIAL. October 2020 Rated BBB by S&P Rated Baa1 by Moody’s Q 2 2016 “While neither Tractor Supply Company nor Hobby Lobby maintains a public credit rating, both possess investment - grade quality financials with very strong balance sheets .” Q1 2017 “…it's a great company, it's got a fantastic balance sheet. …and we have a great relationship and respect for them.” Q3 2018 “ We have a fantastic relationship with their real estate team. The business is really thriving. They have no national competition. They also have the highest - rated e - commerce website of any retailer.” Investment Foresight A DEEPER DIVE ON ADC’S THOUGHT LEADERSHIP & TRACK RECORD OF EXECUTION As of December 31, 2023. Exposure measured as a percentage of ABR. The quotes above reflect statements made by ADC management on the Company’s quarterly earnings calls. The chart reflects Trac tor Supply’s market capitalization from 12/31/2012 to 12/31/2023. ADC has acquired over 100 locations since 2013 and today TSCO is our 2 nd largest tenant. Q3 2013 Acquired first Tractor Supply

7 © 20 24 AGREE REALTY CORPORATION . ALL RIGHTS RESERVED. CONFIDENTIAL. Investment Foresight A DEEPER DIVE ON ADC’S THOUGHT LEADERSHIP & TRACK RECORD OF EXECUTION Q3 2017 Acquired first Gerber Collision Q4 2018 “…We think they're the premier auto collision operator in the United States… We'll continue to work with them on all types of opportunities through all 3 external growth platforms …” Q1 2022 “…identifying early on a retailer that we thought was in a tremendous position to access a fragmented space and had the balance sheet capabilities to do so .” ADC built preferred development relationship with Gerber Collision, developing over 20 locations to help spearhead organic growth. They are now our 15 th largest tenant with over 70 locations. As of December 31, 2023. Exposure measured as a percentage of ABR. The quotes above reflect statements made by ADC management on the Company’s quarterly earnings calls. The chart reflects The Boy d Group’s market capitalization from 12/31/2014 to 12/31/2023. Q1 2018 “Now you see Gerber Collision in the collision space. Again, a company that's owned by Boyd Group of Canada, conservative, disciplined leaders in the collision space .” 2014 Identified and met with The Boyd Group for the first time

8 © 20 24 AGREE REALTY CORPORATION . ALL RIGHTS RESERVED. CONFIDENTIAL. Investment Foresight A DEEPER DIVE ON ADC’S THOUGHT LEADERSHIP & TRACK RECORD OF EXECUTION Leveraged all three external growth platforms to make Sunbelt Rentals our 14 th largest tenant today with 50 locations. As of December 31, 2023. Exposure measured as a percentage of ABR. The quotes above reflect statements made by ADC management on the Company’s quarterly earnings calls. The chart reflects Asht ead Group’s market capitalization from 12/31/2014 to 12/31/2023. Q4 2015 Acquired first Sunbelt Rentals Q4 2019 “… the only investment - grade operator in the country . If you look at the equipment ownership versus rental in this country…. it is very, very low relative to Western Europe. And so, there's a big opportunity in this country for equipment rental rather than ownership.” April 2019 Rated BBB - by S&P August 2018 Rated Baa3 by Moody’s Q1 2022 “Our decision to invest in Sunbelt Rentals was recently reinforced by their upgraded BBB rating by Fitch.”

9 © 20 24 AGREE REALTY CORPORATION . ALL RIGHTS RESERVED. CONFIDENTIAL. Investment Foresight A DEEPER DIVE ON ADC’S THOUGHT LEADERSHIP & TRACK RECORD OF EXECUTION Since 2012, ADC has acquired 50 TJX locations, and TJX is now our 6 th largest tenant. As of December 31, 2023. Exposure measured as a percentage of ABR. The quotes above reflect statements made by ADC management on the Company’s quarterly earnings calls. The chart reflects The TJX Companies market capitalization from 12/30/2011 to 12/31/2023. Q3 2012 Developed first TJ Maxx Q4 2023 “the off - price retailers, it's all the TJX concepts… These operators have the desire to continue to expand across all of their different flags .” August 2015 Upgraded to A2 by Moody’s Q2 2017 “At the same time, in terms of women's apparel, you look at T.J. Maxx…the off - price retailers have thrived. ” Q4 2017 “the TJX Companies …is now our #5 tenant. We have a strong bias towards off - price retail and the experience and value proposition that it provides for consumers . We enjoy a strong working relationship with TJX.. . ” January 2015 Jerry Rossi, former EVP and Group President of The TJX Companies, joins Agree Realty’s Board of Directors

10 © 20 24 AGREE REALTY CORPORATION . ALL RIGHTS RESERVED. CONFIDENTIAL. Investment Foresight A DEEPER DIVE ON ADC’S THOUGHT LEADERSHIP & TRACK RECORD OF EXECUTION 2012 2013 2014 2015 2016 2017 2018 2019 2020 2021 2022 2023 30% 27% 22% 17% 12% 8% 5% 3% 2% 1% 1% 1% Q2 2017 “our Walgreens concentration was down to 8.8% at quarter end, below our goal of sub - 10% by year - end..” Q1 2021 “With this transaction, CVS has surpassed Walgreens as our largest pharmacy tenant… we continue to favor CVS as the sector leader, given their innovation and adaptation to consumer preferences and overall market dynamics in the pharmacy space.” Q1 2019 “ I think the pharmacy space, in general, really has some work to do on the front end predominantly of those stores. And we'd like to see some ingenuity and creativity driving traffic into those stores and driving margin as well as top line revenue to the front end of those stores.” ADC reduced Walgreens exposure from 30% in 2012 to approximately 1% today and reduced overall Pharmacy exposure to ~4%. As of December 31, 2023. Exposure is as of year - end 2012 through year - end 2023 and is measured as a percentage of ABR. The quotes above reflect statements made by ADC management on the Company’s quarterly earnings calls. 2023 Downgraded to Baa3 by Moody’s in January. Downgraded to BBB - by S&P in October. Downgraded to Ba2 by Moody’s in December.

11 © 20 24 AGREE REALTY CORPORATION . ALL RIGHTS RESERVED. CONFIDENTIAL. Restaurants Convenience & Gas Dollar Stores Manufacturing Convenience Stores Retail Stores Car Washes Grocery Grocery Auto Service Car Wash Grocery Distribution & Warehouse Automotive Services Consumer Services Early Childhood Education Convenience Stores Home Improvement Medical Retail Legacy Gas & Repair Drug Stores & Pharmacy Food Processing Restaurants - Full Service Beverage & Food Quick Service Dollar Stores Tire & Auto Service FCPT GTY NTST BNL NNN WPC EPRT O ADC Maintaining Our Discipline LEADING PORTFOLIO WITH DIVERSE SECTORS As of December 31, 2023. Data is from S&P Capital IQ and company filings. Top 3 Sector Concentration shown as a percentage of annualized base rent. Top 3 Sector Concentration 96% 94% 46% 42% 41% 41% 37% 29% 27%

12 © 20 24 AGREE REALTY CORPORATION . ALL RIGHTS RESERVED. CONFIDENTIAL. Capital Markets Leader INNOVATIVE BALANCE SHEET MANAGEMENT “ We view the forward equity offering as a prudent way to further fortify our balance sheet and lock in an accretive cost of capital while mitigating external risks and market volatility. ” - JOEY AGREE Q3 2018 EARNINGS CALL x A x A x A x A ADC was the first net lease REIT to issue forward equity in March 2018 Since 2018, $27B of forward equity has been raised in the net lease space Lowest cost preferred equity issuance in net lease REIT history at 4.25% Closed market - leading 5.5 - year term loan at a fixed rate of 4.52% inclusive of prior hedging activity Forward equity accounted for ~85% of all net lease issuance over the past two years

13 © 20 24 AGREE REALTY CORPORATION . ALL RIGHTS RESERVED. CONFIDENTIAL. Disciplined Capital Allocator CONSERVATIVE WACC CALCULATION DRIVES CONSISTENT & SUPERIOR EARNINGS GROWTH ADC WACC CALCULATION WEIGHTING FORM OF CAPITAL COST 75% Equity (1) 6.7% 25% Long - Term Debt (2) 5.7% WACC 6.4% PEER WACC CALCULATION WEIGHTING FORM OF CAPITAL COST 60% Equity (1) 6.7% 20% Five - Year Term Loan 5.0% 20% (3) Free Cash Flow After Dividend 0.0% WACC 5.0% 150+ bps – Pedal to the Metal! 100 - 150 bps – Investments Generate Healthy Accretion 75 - 100 bps – Investments Generate Sufficient Accretion <75 bps – Investments Not Sufficiently Accretive (1) The cost of equity is calculated using the net forward price of the Company’s outstanding forward equity as of December 31, 2023, compared to consensus forward 12 - month AFFO per share. (2) Long - term debt reflects anticipated rate for 10 - year unsecured bond offering. (3) Assumes $100MM of fr ee cash flow after the dividend and $500MM of investment activity. Any differences are the result of rounding. x Cost of equity is based on forward 12 - month consensus AFFO per share x Cost of debt reflects anticipated rate for 10 - year unsecured bond offering WACC CALCULATION COMPARISON NET LEASE INVESTMENT SPREADS x Using short - term debt and adding unburdened free cash flow artificially improves cost of capital by ~140 bps
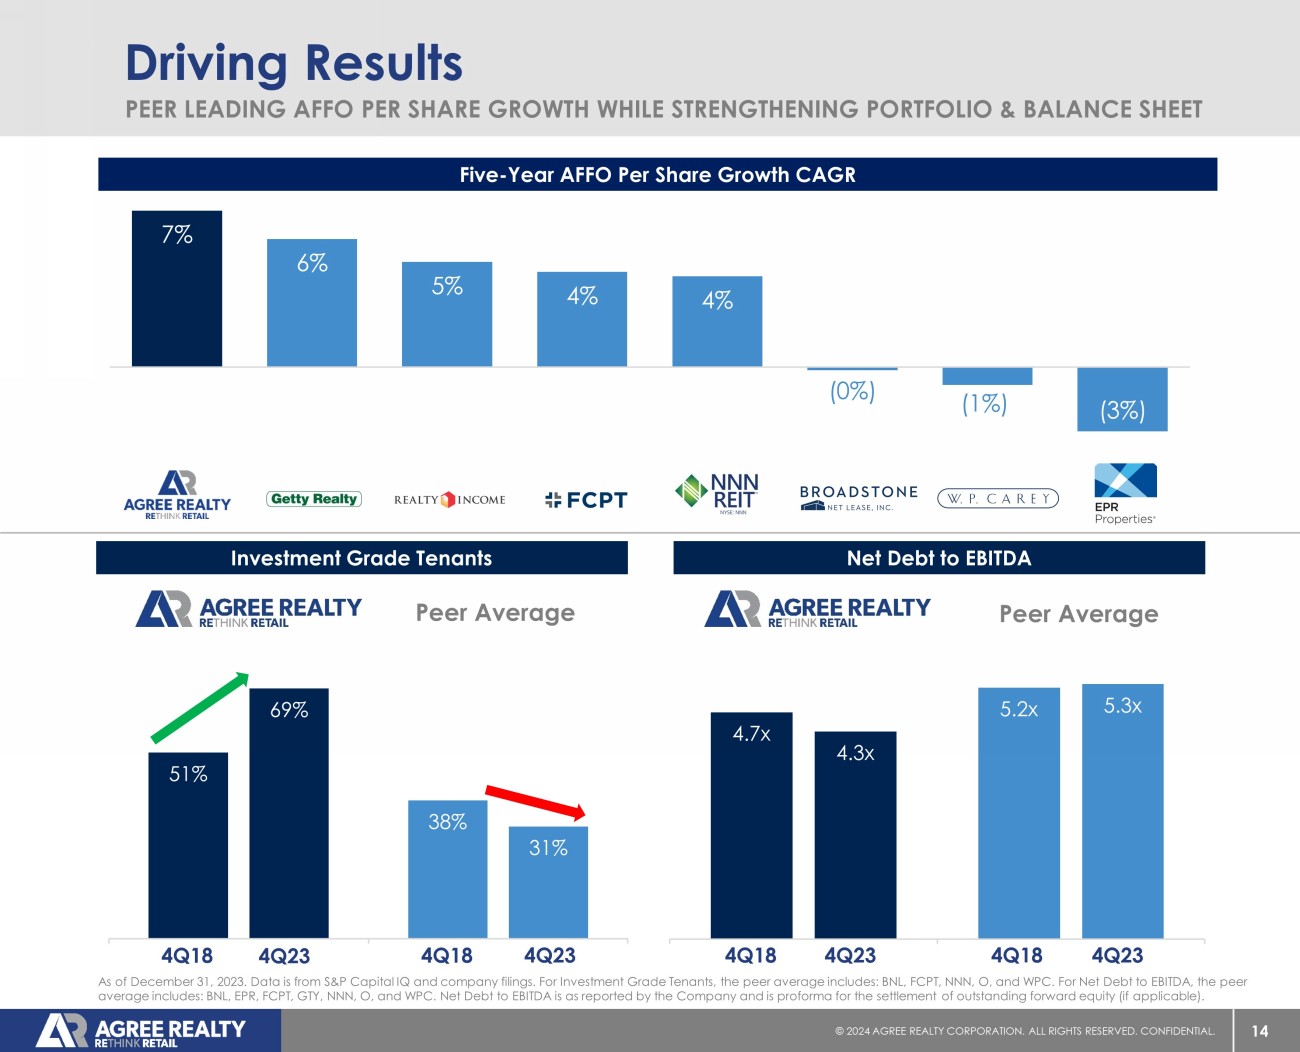
14 © 20 24 AGREE REALTY CORPORATION . ALL RIGHTS RESERVED. CONFIDENTIAL. 4.7x 5.2x 4.3x 5.3x 4Q18 4Q23 51% 38% 69% 31% 4Q18 4Q23 7% 6% 5% 4% 4% (0%) (1%) (3%) ADC GTY O FCPT NNN BNL WPC EPR Driving Results As of December 31, 2023. Data is from S&P Capital IQ and company filings. For Investment Grade Tenants, the peer average incl ude s: BNL, FCPT, NNN, O, and WPC. For Net Debt to EBITDA, the peer average includes: BNL, EPR, FCPT, GTY, NNN, O, and WPC. Net Debt to EBITDA is as reported by the Company and is proforma for the settlement of outstanding forward equity (if applicable). Net Debt to EBITDA Investment Grade Tenants Peer Average Peer Average 4Q18 4Q23 4Q18 4Q23 4Q18 4Q23 4Q18 4Q23 Five - Year AFFO Per Share Growth CAGR PEER LEADING AFFO PER SHARE GROWTH WHILE STRENGTHENING PORTFOLIO & BALANCE SHEET

The Country’s Leading Retail Portfolio

16 © 20 24 AGREE REALTY CORPORATION . ALL RIGHTS RESERVED. CONFIDENTIAL. TENANT / CONCEPT ANNUALIZED BASE RENT % OF TOTAL $33.9 6.1% 28.2 5.1% 26.8 4.8% 19.5 3.5% 17.3 3.1% 17.0 3.1% 17.0 3.1% 16.3 2.9% 16.1 2.9% 14.6 2.6% 14.0 2.5% 13.8 2.5% 12.4 2.2% 12.4 2.2% 11.9 2.1% 11.4 2.1% 10.2 1.8% 8.9 1.6% 8.7 1.6% Other 246.0 44.2% Total $556.4 100.0% Agree Realty Snapshot TENANT SECTOR ANNUALIZED BASE RENT % OF TOTAL Grocery Stores $53.2 9.6% Home Improvement 48.1 8.7% Tire & Auto Service 47.7 8.6% Convenience Stores 46.1 8.3% Dollar Stores 42.3 7.6% Off - Price Retail 34.9 6.3% General Merchandise 32.3 5.8% Auto Parts 31.6 5.7% Farm & Rural Supply 29.9 5.4% Pharmacy 23.7 4.3% Other 166.6 29.7% Total $556.4 100.0% Share Price (1) $55.31 Equity Market Capitalization (1)(2) $5.6 Billion Property Count 2,135 properties Net Debt to EBITDA 4.7x / 4.3x (3) Investment Grade % (4) 69.1% Company Overview Top Tenants ($ in millions) Top Retail Sectors ($ in millions) As of December 31, 2023, unless otherwise noted. Any differences are a result of rounding. (1) As of February 28, 2024. (2) R efl ects common shares and OP units outstanding multiplied by the closing price as of February 28, 2024. (3) Proforma for the settlement of the Company’s outstanding forward equity as of December 31, 2023. (4) R efe r to footnote 1 on slide 17 for the Company’s definition of Investment Grade.

17 © 20 24 AGREE REALTY CORPORATION . ALL RIGHTS RESERVED. CONFIDENTIAL. BEST - IN - CLASS RETAILERS WITH CONSERVATIVE BALANCE SHEETS Strong Investment Grade Portfolio 16% SUB - INVESTMENT GRADE 15% NOT RATED 69% INVESTMENT GRADE (1) As of December 31, 2023. Any differences are a result of rounding. (1) Based on ABR derived from tenants, or parent entities the reof, with an investment grade credit rating from S&P Global Ratings, Moody’s Investors Service, Fitch Ratings, or the National Association of Insurance Commissioners. Retail Credit Type (%ABR)

18 © 20 24 AGREE REALTY CORPORATION . ALL RIGHTS RESERVED. CONFIDENTIAL. INDUSTRY - LEADERS OPERATING IN E - COMMERCE RESISTANT SECTORS National and Super - Regional Retailers 1% FRANCHISE 11% SUPER - REGIONAL 88% NATIONAL As of December 31, 2023. Any differences are a result of rounding. Retail Tenant Type (%ABR)

19 © 20 24 AGREE REALTY CORPORATION . ALL RIGHTS RESERVED. CONFIDENTIAL. 14% 12% 12% 6% 6% 6% 3% 3% 3% 2% As of December 31, 2023. (1) Refer to footnote 1 on slide 17 for the Company’s definition of Investment Grade. Any differences are a result of rounding. FEE SIMPLE OWNERSHIP + SIGNIFICANT TENANT INVESTMENT Ground Lease Portfolio Breakdown Ground Lease Credit Overview (%ABR) 88% INVESTMENT GRADE (1) 8% NOT RATED 4% SUB - INVESTMENT GRADE Ground Lease Portfolio Overview 224 Leases 11.7% of total portfolio ABR 10.5 years weighted - average lease term Top Ground Lease Tenants (% ABR)

20 © 20 24 AGREE REALTY CORPORATION . ALL RIGHTS RESERVED. CONFIDENTIAL. FIRST EXPIRATION HIGHLIGHTS EMBEDDED VALUE WITH 159% RECAPTURE RATE Ground Lease Value Creation Chase Bank - Stockbridge, GA New Lease Rent Per Square Foot $46.54 New Lease Term 15 Years Rental Increases 10% Every 5 Years Options 3 x 5 Years x 10% Annualized Base Rent $193,083 Prior Lease Rent Per Square Foot $29.26 Remaining Lease Term (1) 0.1 years Rental Increases None Remaining Options None Remaining Annualized Base Rent $110,007 Note: Recapture rate reflects current rent per square foot vs. prior rent per square foot. (1) Reflects remaining lease term at the time the lease extension was executed.

Disciplined Investment Strategy & Active Portfolio Management

22 © 20 24 AGREE REALTY CORPORATION . ALL RIGHTS RESERVED. CONFIDENTIAL. Engage in consistent dialogue to understand store performance and tenant sustainability Leverage relationships to identify the best risk - adjusted opportunities Our Investment Strategy Agree leverages its three distinct investment platforms to target industry - leading retailers in e - commerce and recession resistant sectors THREE - PRONGED GROWTH STRATEGY COMPREHENSIVE REAL ESTATE SOLUTIONS FOR LEADING RETAILERS ACQUISITIONS DEVELOPMENT DEVELOPER FUNDING PLATFORM RETAILER RELATIONSHIPS

23 © 20 24 AGREE REALTY CORPORATION . ALL RIGHTS RESERVED. CONFIDENTIAL. What Has ADC Been Investing In? The retail landscape continues to dynamically evolve as market forces cause disruption and change. To mitigate risk in a period of continued disruption, the Company adheres to a number of investment criteria, with a focus on four core principles : Focus on leading operators that have matured in omni - channel structure or those in e - commerce resistant sectors OMNI - CHANNEL CRITICAL (E - COMMERCE RESISTANCE) Emphasize a balanced portfolio with exposure to counter - cyclical sectors and retailers with strong credit profiles RECESSION RESISTANCE Strong emphasis on leading operators with strong balance sheets and avoidance of private equity sponsored retailers AVOIDANCE OF PRIVATE EQUITY SPONSORSHIP Protects against unforeseen changes to our top - down investment philosophy STRONG REAL ESTATE FUNDAMENTALS & FUNGIBLE BUILDINGS

24 © 20 24 AGREE REALTY CORPORATION . ALL RIGHTS RESERVED. CONFIDENTIAL. TOP - DOWN FOCUS ON LEADING RETAILERS IN THE U.S. PAIRED WITH A BOTTOMS - UP REAL ESTATE ANALYSIS Large & Fragmented Opportunity Set REAL ESTATE FUNDAMENTALS • Rents ≤ market • Fungibility of building MARKET RENTS • Limited competition • Strong market presence COMPETITION • Access • Visibility • Demographics • Major retail corridor • Strong traffic drivers RETAIL SYNERGY ADC reviewed over $82 billion of opportunities since 2018 $6.8 BILLION acquired since 2018 As of December 31, 2023.

25 © 20 24 AGREE REALTY CORPORATION . ALL RIGHTS RESERVED. CONFIDENTIAL. As of February 8, 2023. Store counts include both leased and owned locations and were obtained from company filings and third - pa rty sources including CS News, CSP Daily News, CT Insider, and Progressive Grocer. Table is representative and does not include all retailers. 164,000+ NET LEASE OPPORTUNITIES AND GROWING WITH BEST - IN - CLASS RETAILERS Sandbox Offers Runway for Growth Auto Parts Stores 23,500+ Farm & Rural Supply Stores 2,400+ Crafts & Novelties Stores 1,000+ Quick - Service Restaurants 32,900+ Equipment Rental Stores 1,100+ Warehouse Clubs 1,400+ Home Improvement Stores 8,600+ Consumer Electronics Stores 1,200+ Grocery Stores 10,800+ Dealerships 400+ Convenience Stores 24,000+ Off - Price Retail Stores 6,300+ Tire & Auto Service Stores 7,100+ Dollar Stores 36,300+ General Merchandise Stores 7,000+

26 © 20 24 AGREE REALTY CORPORATION . ALL RIGHTS RESERVED. CONFIDENTIAL. ADC HAS INVESTED $8.7 BILLION IN HIGH - QUALITY RETAIL NET LEASE PROPERTIES SINCE 2010 Robust Investment Activity DEVELOPMENT & DFP (1) ACQUISITIONS Investment Activity ($ in millions) As of December 31, 2023. (1) Represents development & Developer Funding Platform (“DFP”) activity, completed or commenced. $ $295.8 $336.8 $607.0 $701.4 $1.31B $1.39B $1.59B $1.19B $38.0 $62.7 $74.4 $32.4 $43.2 $40.0 $118.5 $149.9 0 200 400 600 800 1,000 1,200 1,400 1,600 1,800 2,000 2016 2017 2018 2019 2020 2021 2022 2023

27 © 20 24 AGREE REALTY CORPORATION . ALL RIGHTS RESERVED. CONFIDENTIAL. $29.7M $45.8M $67.6M $67.2M $49.4M $58.0M $45.8M $9.7M 2016 2017 2018 2019 2020 2021 2022 2023 BERLIN, NJ HOUSTON, TX PORTAGE, MI CANTON, MI FOCUSED ON NON - CORE ASSET SALES & CAPITAL RECYCLING Active Portfolio Management As of December 31, 2023. Graph is representative and does not include all dispositions. Total Dispositions 2010 - 2023: $459 million STALLINGS, NC MICHIGAN (3) OSCODA, MI FLORIDA (2) NORTH DAKOTA (3) MINNESOTA (3) ATLANTIC BEACH, FL MT (1) & VA (1) WICHITA FALLS, TX SPRINGFIELD, IL UPLAND, CA APOPKA, FL LA (1) & PA (1) MN (2) & ND (2) MICHIGAN (3) FORT WORTH, TX OH (2) & PA (2) FLOWOOD, MS MAPLEWOOD, MN TYLER, TX BELTON, MO MI (2), NY & FL VA (3) MIDLAND, MI UT (2), ND & MT PENSACOLA, FL OH (3), WV, & VA TOPEKA, KS INDIANAPOLIS, IN KIRKLAND, WA JACKSONVILLE BEACH, FL IL (1), ND (1) & OH (1) MICHIGAN (2) ST. GEORGE, UT SC (2) & TX (1) AUSTIN, TX JACKSONVILLE, FL SC (1) & MN (1) AURORA, CO PORT ST. JOHN, FL RANCHO CORDOVA, CA MACOMB TOWNSHIP, MI OCALA, FL WYLIE, TX

Fortified Balance Sheet

29 © 20 24 AGREE REALTY CORPORATION . ALL RIGHTS RESERVED. CONFIDENTIAL. Leading With Our “Fortress” Balance Sheet CAPITALIZATION STATISTICS Equity Market Capitalization (2) $5.6 Billion Enterprise Value (2)(3) $8.2 Billion Total Debt to Enterprise Value 27.2% CREDIT METRICS Fixed Charge Coverage Ratio 5.0x Net Debt to Recurring EBITDA (4) 4.7x / 4.3x (5) Issuer Ratings Baa1 / BBB Ratings Outlooks Stable / Positive (6) As of December 31, 2023, unless otherwise noted. (1) Excludes $227.0 million of outstanding borrowings on the Company’s $1.0 bil lion Revolving Credit Facility as of December 31, 2023; assumes two 6 - month extension options are exercised. (2) As of February 28, 2024. (3) Enterprise value is calculated as the sum of net debt , t he liquidation value of preferred equity and equity market capitalization. (4) Reflects net debt to annualized Q4 2023 recurring EBITDA. (5) Proforma for the settlement of the Company's outstanding fo rwa rd equity as of December 31, 2023. (6) As of February 9, 2024. Debt Maturities ($ in millions) SECURED UNSECURED 1 c NO MATERIAL DEBT MATURITIES UNTIL 2028 & WEIGHTED - AVERAGE DEBT MATURITY OF ALMOST 7 YEARS (1) $3 $42 $0 $50 $0 $50 $410 $450 $475 $125 $300 $300 $0 $100 $200 $300 $400 $500 $600 2024 2025 2026 2027 2028 2029 2030 2031 2032 2033

30 © 20 24 AGREE REALTY CORPORATION . ALL RIGHTS RESERVED. CONFIDENTIAL. $100 $100 $225 $125 $350 $650 $300 $350 $237 $229 $531 $433 $988 $1,095 $1,322 $371 $42 $175 $0 $250 $500 $750 $1,000 $1,250 $1,500 $1,750 $2,000 2016 2017 2018 2019 2020 2021 2022 2023 STRONG CAPITAL MARKETS EXECUTION HAS PROVIDED AMPLE LIQUIDITY; $8.2 BILLION OF ACTIVITY SINCE 2010 Capital Markets Track Record Reflects gross proceeds for equity and long - term debt raised through December 31, 2023. Forward equity offerings are shown in th e year they were raised, rather than settled. Capital Markets Activity ($ in millions) COMMON EQUITY UNSECURED DEBT SECURED DEBT PREFERRED EQUITY

31 © 20 24 AGREE REALTY CORPORATION . ALL RIGHTS RESERVED. CONFIDENTIAL. (includes outstanding forward equity offerings) ADC HAS BEEN AT OR BELOW 4.5X PROFORMA NET DEBT TO RECURRING EBITDA SINCE 2018 Low Leverage = Strong Positioning As of December 31, 2023. Proforma Net Debt to Recurring EBTIDA deducts the Company’s outstanding forward equity offerings for ea ch period from the Company’s net debt for each period. PROFORMA NET DEBT TO RECURRING EBITDA NET DEBT TO RECURRING EBITDA Q2 2023 Q3 2023 Q4 2023 Q1 2021 Q2 2021 Q3 2021 Q4 2021 Q1 2022 Q2 2022 Q3 2022 Q4 2022 Q1 2023 Q4 2020 4.8x 4.0x 4.9x 4.2x 4.5x 3.6x 4.4x 3.7x 4.9x 3.4x 5.0x 4.3x 5.0x 3.8x 4.0x 3.1x 4.4x 3.1x 4.5x 3.7x 4.5x 4.1x 4.5x 4.5x 4.7x 4.3x

32 © 20 24 AGREE REALTY CORPORATION . ALL RIGHTS RESERVED. CONFIDENTIAL. $1.50 $1.70 $1.90 $2.10 $2.30 $2.50 $2.70 $2.90 $3.10 2013 2014 2015 2016 2017 2018 2019 2020 2021 2022 2023 Annual Dividends Declared Per Share 144 CONSECUTIVE COMMON DIVIDENDS PAID; AVERAGE AFFO PAYOUT RATIO OF 76% OVER PAST 10 YEARS Growing, Well - Covered Monthly Dividend As of February 28, 2024. Reflects common dividends per share declared in each year, rounded to two decimals.

33 © 20 24 AGREE REALTY CORPORATION . ALL RIGHTS RESERVED. CONFIDENTIAL. The Agree Wellness program focuses on Health Wellness & Financial Wellness to enhance employee well - being Ongoing professional development is offered to help all team members advance their careers The Company has recently sponsored charities including CARE House of Oakland County, Michigan Veteran's Foundation and Leader Dogs for the Blind ADC has received awards from Globe St, Crain’s Detroit Business, and Best and Brightest in Wellness recognizing its outstanding corporate culture and wellness initiatives SOCIAL RESPONSIBILITY DEDICATED TO SUSTAINABILITY AND GOOD CORPORATE CITIZENSHIP Agree Realty’s ESG Practices Focus on industry leading, national & super - regional retailers provides for a relationship with some of the most environmentally conscientious retailers in the world The Company anticipates its new headquarters will achieve LEED certification, with features including EV charging stations, motion activated lighting and high - quality building materials Executed several green leases with tenants, resulting in the achievement of Gold Level recognition from the Green Lease Leaders organization ENVIRONMENTAL PRACTICES ADC’s Board has 10 directors, eight of whom are independent; six new independent directors added since 2018 The Board recently added a third female Director, appointing Linglong He effective January 1 st The Nominating & Governance Committee has formal oversight responsibility for the Company’s ESG program The Company adopted the Sustainability Accounting Standards Board and the Task Force on Climate - related Financial Disclosures frameworks to align our disclosures with the issues most relevant to our stakeholders CORPORATE GOVERNANCE As of January 1, 2024.

34 © 20 24 AGREE REALTY CORPORATION . ALL RIGHTS RESERVED. CONFIDENTIAL. Investment Summary Highlights FORTIFIED BALANCE SHEET HIGHEST - QUALITY RETAIL REAL ESTATE INVESTMENT GRADE ISSUER RATINGS Robust growth trajectory MULTI - YEAR TRACK RECORD OF EXECUTION Well - covered & consistent dividend

35 © 20 24 AGREE REALTY CORPORATION . ALL RIGHTS RESERVED. CONFIDENTIAL. APPENDIX

36 © 20 24 AGREE REALTY CORPORATION . ALL RIGHTS RESERVED. CONFIDENTIAL. Forward - Looking Statements This presentation contains forward - looking statements within the meaning of Section 27A of the Securities Act of 1933, as amended (the “Securities Act”) and Section 21E of the Securities Exchange Act of 1934, as amended (the “Exchange Act”). The Company intends such forward - looking statements to be covered by the safe harbor provisions for forward - looking statements contained in the Private Securities Litigation Reform Act of 1995 and includes this statement for purposes of complying with these safe harbor provisions. Forward - looking statements are generally identifiable by use of forward - looking terminology such as “may,” “will,” “should,” “potential,” “intend,” “expect,” “seek,” “anticipate,” “estimate,” “approximately,” “believe,” “could,” “project,” “predict,” “forecast,” “continue,” “assume,” “plan,” references to “outlook” or other similar words or expressions. Forward - looking statements are based on certain assumptions and can include future expectations, future plans and strategies, financial and operating projections and forecasts and other forward - looking information and estimates. These forward - looking statements are subject to various risks and uncertainties, many of which are beyond the Company’s control, which could cause actual results to differ materially from such statements. Certain factors could occur that might cause actual results to vary, including the potential adverse effect of ongoing worldwide economic uncertainties, disruptions in the banking system and financial markets, and increased inflation on the financial condition, results of operations, cash flows and performance of the Company and its tenants, the real estate market and the global economy and financial markets, the general deterioration in national economic conditions, weakening of real estate markets, decreases in the availability of credit, increases in interest rates, adverse changes in the retail industry, the Company’s continuing ability to qualify as a REIT and other risks and uncertainties as described in greater detail in the Company’s filings with the Securities and Exchange Commission (the “SEC”), including, without limitation, the Company’s Annual Report on Form 10 - K and subsequent quarterly reports. Except as required by law, the Company disclaims any obligation to update any forward - looking statements, whether as a result of new information, future events or otherwise. For further information about the Company’s business and financial results, please refer to the “Management’s Discussion and Analysis of Financial Condition and Results of Operations” and “Risk Factors” sections of the Company’s SEC filings, including, but not limited to, its Annual Report on Form 10 - K and Quarterly Reports on Form 10 - Q, copies of which may be obtained at the Investors section of the Company’s website at www.agreerealty.com . All information in this presentation is as of December 31 , 2023 , unless otherwise noted . The Company undertakes no duty to update the statements in this presentation to conform the statements to actual results or changes in the Company’s expectations .

37 © 20 24 AGREE REALTY CORPORATION . ALL RIGHTS RESERVED. CONFIDENTIAL. Non - GAAP Financial Measures This presentation includes a non - GAAP financial measure, Net Debt to Recurring EBITDA, which is presented on an actual and profo rma basis. A reconciliation of this non - GAAP financial measure to the most directly comparable GAAP measure is included in the follo wing pages. The components of this ratio and their use and utility to management are described further in the section below. Components of Net Debt to Recurring EBITDA EBITDAre is defined by Nareit to mean net income computed in accordance with GAAP, plus interest expense, income tax expense, depreciation and amortization, any gains (or losses) from sales of real estate assets and/or changes in control, any impairme nt charges on depreciable real estate assets, and after adjustments for unconsolidated partnerships and joint ventures. The Company conside rs the non - GAAP measure of EBITDAre to be a key supplemental measure of the Company's performance and should be considered along with, but not as an alternative to, net income or loss as a measure of the Company's operating performance. The Company considers EBITDAre a key supplemental measure of the Company's operating performance because it provides an additional supplemental measure of the Company's performance and operating cash flow that is widely known by industry analysts, lenders and investors. The Company’s calculation of EBITDAre may not be comparable to EBITDAre reported by other REITs that interpret the Nareit definition differently than the Company. Recurring EBITDA The Company defines Recurring EBITDA as EBITDAre with the addback of noncash amortization of above - and below - market lease intangibles, and after adjustments for the run - rate impact of the Company's investment and disposition activity for the period presented, as well as adjustments for non - recurring benefits or expenses. The Company considers the non - GAAP measure of Recurrin g EBITDA to be a key supplemental measure of the Company's performance and should be considered along with, but not as an alter nat ive to, net income or loss as a measure of the Company's operating performance. The Company considers Recurring EBITDA a key supplemental measure of the Company's operating performance because it represents the Company's earnings run rate for the per iod presented and because it is widely followed by industry analysts, lenders and investors. Our Recurring EBITDA may not be com par able to Recurring EBITDA reported by other companies that have a different interpretation of the definition of Recurring EBITDA. Our rat io of net debt to Recurring EBITDA is used by management as a measure of leverage and may be useful to investors in understanding the Company’s ability to service its debt, as well as assess the borrowing capacity of the Company. Our ratio of net debt to Rec urr ing EBITDA is calculated by taking annualized Recurring EBITDA and dividing it by our net debt per the consolidated balance sheet. Net Debt The Company defines Net Debt as total debt less cash, cash equivalents and cash held in escrows. The Company considers the non - GAAP measure of Net Debt to be a key supplemental measure of the Company's overall liquidity, capital structure and leverage . The Company considers Net Debt a key supplemental measure because it provides industry analysts, lenders and investors useful inf orm ation in understanding our financial condition. The Company’s calculation of Net Debt may not be comparable to Net Debt reported by ot her REITs that interpret the definition differently than the Company. The Company presents Net Debt on both an actual and proforma basis, assuming the Anticipated Net Proceeds from Outstanding Forwards are used to pay down debt. The Company believes the proforma measure may be useful to investors in understanding the potential effect of the Anticipated Net Proceeds from Outstanding For war ds on the Company’s capital structure, its future borrowing capacity, and its ability to service its debt. Anticipated Net Proceeds from Outstanding Forwards Since the first quarter of 2018, the Company has utilized forward sale agreements to sell shares of common stock. Selling common stock through forward sale agreements enables the Company to set the price of suc h s hares upon pricing the offering (subject to certain adjustments) while delaying the issuance of such shares and the receipt of the net proceeds by the Company. Given the Company’s frequent use of forward sale agreements, the Company considers the non - GAAP measure of Anticipated Net Proceeds from Outstanding Forwards to be a key supplemental measure of the Company's overall liquidity, capit al structure and leverage. The Company defines Anticipated Net Proceeds from Outstanding Forwards as the number of shares outsta ndi ng under forward sale agreements at the end of each quarter, multiplied by the applicable forward sale price for each agreement, respectively.

38 © 20 24 AGREE REALTY CORPORATION . ALL RIGHTS RESERVED. CONFIDENTIAL. Non - GAAP Financial Measures This presentation also includes the non - GAAP measures of Annualized Base Rent (“ABR”), Funds From Operations (“FFO” or “ Nareit FFO”), Core Funds From Operations (“Core FFO”) and Adjusted Funds From Operations (“AFFO”). ABR represents the annualized amount of contractual minimum rent required by tenant lease agreements, computed on a straight - line basis. ABR is not, and is not intended to be, a presentation in accordance with GAAP. The Company believes annualized contractual minimum rent is useful to management, inves tor s, and other interested parties in analyzing concentrations and leasing activity. FFO, Core FFO and AFFO are reconciled to the m ost directly comparable GAAP measure in the following pages and are described in further detail below. Components of Funds from Operations, Core Funds from Operations, and Adjusted Funds from Operations Funds from Operations (“FFO” or “ Nareit FFO”) is defined by the National Association of Real Estate Investment Trusts, Inc. (“ Nareit ”) to mean net income computed in accordance with GAAP, excluding gains (or losses) from sales of real estate assets and/or changes in control, plus real estate related depreciation and amortization and any impairment charges on depreciable real estate assets, an d after adjustments for unconsolidated partnerships and joint ventures. Historical cost accounting for real estate assets in accordan ce with GAAP implicitly assumes that the value of real estate assets diminishes predictably over time. Since real estate values instead ha ve historically risen or fallen with market conditions, most real estate industry investors consider FFO to be helpful in evaluating a real e sta te company’s operations. FFO should not be considered an alternative to net income as the primary indicator of the Company’s operating per for mance, or as an alternative to cash flow as a measure of liquidity. Further, while the Company adheres to the Nareit definition of FFO, its presentation of FFO is not necessarily comparable to similarly titled measures of other REITs due to the fact that all REITs may not use the same definition. Core Funds from Operations (“Core FFO”) The Company defines Core FFO as Nareit FFO with the addback of ( i ) noncash amortization of acquisition purchase price related to above - and below - market lease intangibles and discount on assumed debt and (ii) certain infrequently occurring items that reduce or increase net income in accordance with GAAP. Management believes that its measure of Core FFO facilitates useful comparison of performance to its peers who predominantly transact in sale - leaseback transactions and are thereby not required by GAAP to allocate purchase price to lease intangibles. Unlike many of its peers, the Company has acqu ire d the substantial majority of its net - leased properties through acquisitions of properties from third parties or in connection with th e acquisitions of ground leases from third parties. Core FFO should not be considered an alternative to net income as the primary indicator of the Company’s operating performance, or as an alternative to cash flow as a measure of liquidity. Further, the Company’s presenta tio n of Core FFO is not necessarily comparable to similarly titled measures of other REITs due to the fact that all REITs may not use th e same definition. Adjusted Funds from Operations (“AFFO”) is a non - GAAP financial measure of operating performance used by many companies in the REIT industry. AFFO further adjusts FFO and Core FFO for certain non - cash items that reduce or increase net income computed in accord ance with GAAP. Management considers AFFO a useful supplemental measure of the Company’s performance, however, AFFO should not be considered an alternative to net income as an indication of its performance, or to cash flow as a measure of liquidity or abi lit y to make distributions. The Company’s computation of AFFO may differ from the methodology for calculating AFFO used by other equity RE ITs , and therefore may not be comparable to such other REITs.

39 © 20 24 AGREE REALTY CORPORATION . ALL RIGHTS RESERVED. CONFIDENTIAL. Reconciliation of Net Debt to Recurring EBITDA Q4 2020 Q1 2021 Q2 2021 Q3 2021 Q4 2021 Q1 2022 Q2 2022 Q3 2022 Q4 2022 Q1 2023 Q2 2023 Q3 2023 Q4 2023 Net Income $23,760 $30,278 $22,461 $36,830 $33,306 $36,289 $36,130 $39,577 $41,039 $41,774 $41,015 $41,657 $46,101 Interest expense, net 11,791 11,653 12,549 13,066 13,111 13,931 15,512 17,149 16,843 17,998 19,948 20,803 22,371 Income tax expense 260 1,009 485 390 517 719 698 720 723 783 709 709 709 Depreciation of rental real estate assets 13,980 15,292 16,127 17,019 18,293 19,470 21,299 23,073 24,843 26,584 28,145 29,769 31,119 Amortization of lease intangibles - in - place leases and leasing costs 5,567 6,050 6,905 7,310 8,116 8,924 10,550 11,836 12,800 13,770 14,328 15,258 15,611 Non - real estate depreciation 144 147 156 159 156 167 101 248 261 292 277 598 527 Provision for impairment 141 0 0 0 1,919 1,015 0 0 0 0 1,315 3,195 2,665 (Gain) loss on sale of assets, net (437) (3,062) (6,753) (3,470) (1,826) (2,285) 8 (2,885) (97) 0 (319) 20 (1,550) EBITDAre $55,206 $61,367 $51,930 $71,304 $73,592 $78,230 $84,298 $89,718 $96,412 $101,201 $105,418 $112,009 $117,553 Run - Rate Impact of Investment, Disposition & Leasing Activity $3,973 $4,175 $3,939 $3,491 $3,372 $4,654 $4,104 $4,217 $4,742 $4,147 $4,259 $5,207 $2,344 Amortization of above (below) market lease intangibles, net 4,333 4,756 5,260 6,615 7,654 8,178 8,311 8,374 8,474 8,611 8,711 8,293 7,481 Other expense (income) 0 0 14,614 0 0 0 0 0 0 0 0 0 0 Recurring EBITDA $63,512 $70,298 75,743 $81,410 $84,618 $91,062 $96,713 $102,309 $109,628 $113,959 $118,388 $125,509 $127,378 Annualized Recurring EBITDA $254,048 $281,192 302,972 $325,640 $338,472 $364,248 $386,852 $409,236 $438,512 $455,836 $473,552 $502,036 $509,512 Total Debt $1,225,433 $1,371,238 $1,543,040 $1,542,839 $1,702,635 $1,862,428 $1,954,467 $1,884,253 $1,960,395 $2,056,173 $2,162,949 $2,254,099 $2,431,868 Cash, cash equivalents and cash held in escrows (7,955) (7,369) (188,381) (102,808) (45,250) (25,766) (27,107) (251,514) (28,909) (12,940) (12,247) (6,387) (14,524) Net Debt $1,217,478 $1,363,869 $1,354,659 $1,440,031 $1,657,385 $1,836,662 $1,927,360 $1,632,738 $1,931,486 $2,043,233 $2,150,702 $2,247,712 $2,417,344 Net Debt to Recurring EBITDA 4.8x 4.9x 4.5x 4.4X 4.9X 5.0X 5.0x 4.0x 4.4x 4.5x 4.5x 4.5x 4.7x Anticipated Net Proceeds from Outstanding Forwards $203,211 $189,577 $258,749 $226,455 $519,183 $262,940 $475,768 $381,708 $557,364 $362,125 $202,026 $0 $235,619 Proforma Net Debt $1,014,267 $1,174,291 $1,095,909 $1,213,576 $1,138,202 $1,573,722 $1,451,592 1,251,030 $1,374,122 $1,681,108 $1,948,676 $2,247,712 $2,181,725 Proforma Net Debt to Recurring EBITDA 4.0x 4.2x 3.6x 3.7X 3.4X 4.3X 3.8x 3.1x 3.1x 3.7x 4.1x 4.5x 4.3x

40 © 20 24 AGREE REALTY CORPORATION . ALL RIGHTS RESERVED. CONFIDENTIAL. 2013 2014 2015 2016 2017 2018 2019 2020 2021 2022 2023 Net Income $20,190 $18,913 $39,762 $45,797 $58,790 $58,798 $80,763 $91,972 $122,876 $153,035 $170,547 Series A Preferred Stock Dividends 0 0 0 0 0 0 0 0 (2,148) (7,437) (7,437) Net Income attributable to OP Common Unitholders $20,190 $18,913 $39,762 $45,797 $58,790 $58,798 $80,763 $91,972 $120,728 $145,598 $163,110 Depreciation of rental real estate assets $6,930 $8,362 $11,466 $15,200 $19,507 $24,553 $34,349 $48,367 $66,732 $88,685 $115,617 Amortization of lease intangibles - in - place leases and leasing costs 1,747 2,616 4,957 8,135 7,076 8,271 11,071 17,882 28,379 44,107 58,967 Provision for impairment 450 3,020 0 0 0 2,319 1,609 4,137 1,919 1,015 7,175 (Gain) loss on sale or involuntary conversion of assets, net (946) 405 (12,135) (9,964) (14,193) (11,180) (13,306) (8,004) (15,111) (5,258) (1,849) Funds from Operations - OP Common Unitholders $28,370 $33,316 $44,050 $59,168 $71,180 $82,761 $114,486 $154,354 $202,647 $274,147 $343,020 Loss on extinguishment of debt & settlement of related hedges $0 $0 $0 $0 $0 $0 $0 $0 $14,614 $0 $0 Amortization of above (below) market lease intangibles 0 0 0 0 5,091 10,668 13,501 15,885 24,284 33,563 33,430 Core Funds from Operations - OP Common Unitholders $28,370 $33,316 $44,050 $59,168 $76,271 $93,429 $127,987 $170,239 $241,545 $307,710 $376,450 Straight - line accrued rent ($1,148) ($1,416) ($2,450) ($3,582) ($3,548) ($4,648) ($7,093) ($7,818) ($11,857) ($13,176) ($12,142) Stock based compensation expense 1,813 1,987 1,992 2,441 2,589 3,227 4,106 4,995 5,467 6,464 8,338 Amortization of financing costs 326 398 494 516 574 578 706 826 1,197 3,141 4,403 Loss on extinguishment of debt 0 0 180 333 0 0 0 0 0 0 0 Non - real estate depreciation 67 123 62 72 78 146 283 509 618 778 1,693 Other (463) (463) (463) (541) (230) 0 (475) 0 0 0 0 Adjusted Funds from Operations - OP Common Unitholders $28,964 $33,945 $43,865 $58,407 $75,734 $92,732 $125,514 $168,751 $236,970 $304,917 $378,742 FFO Per Common Share and OP Unit - Diluted $2.10 $2.18 $2.39 $2.54 $2.54 $2.53 $2.75 $2.93 $3.00 $3.45 $3.58 Core FFO Per Common Share and OP Unit - Diluted $2.10 $2.18 $2.39 $2.54 $2.72 $2.85 $3.08 $3.23 $3.58 $3.87 $3.93 Adjusted FFO Per Common Share and OP Unit - Diluted $2.14 $2.22 $2.38 $2.51 $2.70 $2.83 $3.02 $3.20 $3.51 $3.83 $3.95 Weighted Average Number of Common Shares and OP Units Outstanding - Diluted 13,505,124 15,314,514 18,413,034 23,307,418 28,047,966 32,748,741 41,571,233 52,744,353 67,486,698 79,512,005 95,785,031 Reconciliation of Net Income to FFO, Core FFO and AFFO Note: The Company began reporting Core FFO in 2018.

41 © 20 24 AGREE REALTY CORPORATION . ALL RIGHTS RESERVED. CONFIDENTIAL. CONTACT PETER COUGHENOUR Chief Financial Officer (248) 737 - 4190 investors@agreerealty.com
v3.24.0.1
Cover
|
Mar. 01, 2024 |
| Document Type |
8-K
|
| Amendment Flag |
false
|
| Document Period End Date |
Mar. 01, 2024
|
| Entity File Number |
1-12928
|
| Entity Registrant Name |
AGREE REALTY CORPORATION
|
| Entity Central Index Key |
0000917251
|
| Entity Tax Identification Number |
38-3148187
|
| Entity Incorporation, State or Country Code |
MD
|
| Entity Address, Address Line One |
32301 Woodward Avenue
|
| Entity Address, City or Town |
Royal Oak
|
| Entity Address, State or Province |
MI
|
| Entity Address, Postal Zip Code |
48073
|
| City Area Code |
248
|
| Local Phone Number |
737-4190
|
| Written Communications |
false
|
| Soliciting Material |
false
|
| Pre-commencement Tender Offer |
false
|
| Pre-commencement Issuer Tender Offer |
false
|
| Entity Emerging Growth Company |
false
|
| Common Stock [Member] |
|
| Title of 12(b) Security |
Common Stock, $0.0001 par value
|
| Trading Symbol |
ADC
|
| Security Exchange Name |
NYSE
|
| Depositary Shares [Member] |
|
| Title of 12(b) Security |
Depositary Shares, each representing one-thousandth of a share of 4.25% Series A Cumulative Redeemable Preferred Stock, $0.0001 par value
|
| Trading Symbol |
ADCPrA
|
| Security Exchange Name |
NYSE
|
| X |
- DefinitionBoolean flag that is true when the XBRL content amends previously-filed or accepted submission.
| Name: |
dei_AmendmentFlag |
| Namespace Prefix: |
dei_ |
| Data Type: |
xbrli:booleanItemType |
| Balance Type: |
na |
| Period Type: |
duration |
|
| X |
- DefinitionFor the EDGAR submission types of Form 8-K: the date of the report, the date of the earliest event reported; for the EDGAR submission types of Form N-1A: the filing date; for all other submission types: the end of the reporting or transition period. The format of the date is YYYY-MM-DD.
| Name: |
dei_DocumentPeriodEndDate |
| Namespace Prefix: |
dei_ |
| Data Type: |
xbrli:dateItemType |
| Balance Type: |
na |
| Period Type: |
duration |
|
| X |
- DefinitionThe type of document being provided (such as 10-K, 10-Q, 485BPOS, etc). The document type is limited to the same value as the supporting SEC submission type, or the word 'Other'.
| Name: |
dei_DocumentType |
| Namespace Prefix: |
dei_ |
| Data Type: |
dei:submissionTypeItemType |
| Balance Type: |
na |
| Period Type: |
duration |
|
| X |
- DefinitionAddress Line 1 such as Attn, Building Name, Street Name
| Name: |
dei_EntityAddressAddressLine1 |
| Namespace Prefix: |
dei_ |
| Data Type: |
xbrli:normalizedStringItemType |
| Balance Type: |
na |
| Period Type: |
duration |
|
| X |
- Definition
+ References
+ Details
| Name: |
dei_EntityAddressCityOrTown |
| Namespace Prefix: |
dei_ |
| Data Type: |
xbrli:normalizedStringItemType |
| Balance Type: |
na |
| Period Type: |
duration |
|
| X |
- DefinitionCode for the postal or zip code
| Name: |
dei_EntityAddressPostalZipCode |
| Namespace Prefix: |
dei_ |
| Data Type: |
xbrli:normalizedStringItemType |
| Balance Type: |
na |
| Period Type: |
duration |
|
| X |
- DefinitionName of the state or province.
| Name: |
dei_EntityAddressStateOrProvince |
| Namespace Prefix: |
dei_ |
| Data Type: |
dei:stateOrProvinceItemType |
| Balance Type: |
na |
| Period Type: |
duration |
|
| X |
- DefinitionA unique 10-digit SEC-issued value to identify entities that have filed disclosures with the SEC. It is commonly abbreviated as CIK. Reference 1: http://www.xbrl.org/2003/role/presentationRef
-Publisher SEC
-Name Exchange Act
-Number 240
-Section 12
-Subsection b-2
| Name: |
dei_EntityCentralIndexKey |
| Namespace Prefix: |
dei_ |
| Data Type: |
dei:centralIndexKeyItemType |
| Balance Type: |
na |
| Period Type: |
duration |
|
| X |
- DefinitionIndicate if registrant meets the emerging growth company criteria. Reference 1: http://www.xbrl.org/2003/role/presentationRef
-Publisher SEC
-Name Exchange Act
-Number 240
-Section 12
-Subsection b-2
| Name: |
dei_EntityEmergingGrowthCompany |
| Namespace Prefix: |
dei_ |
| Data Type: |
xbrli:booleanItemType |
| Balance Type: |
na |
| Period Type: |
duration |
|
| X |
- DefinitionCommission file number. The field allows up to 17 characters. The prefix may contain 1-3 digits, the sequence number may contain 1-8 digits, the optional suffix may contain 1-4 characters, and the fields are separated with a hyphen.
| Name: |
dei_EntityFileNumber |
| Namespace Prefix: |
dei_ |
| Data Type: |
dei:fileNumberItemType |
| Balance Type: |
na |
| Period Type: |
duration |
|
| X |
- DefinitionTwo-character EDGAR code representing the state or country of incorporation.
| Name: |
dei_EntityIncorporationStateCountryCode |
| Namespace Prefix: |
dei_ |
| Data Type: |
dei:edgarStateCountryItemType |
| Balance Type: |
na |
| Period Type: |
duration |
|
| X |
- DefinitionThe exact name of the entity filing the report as specified in its charter, which is required by forms filed with the SEC. Reference 1: http://www.xbrl.org/2003/role/presentationRef
-Publisher SEC
-Name Exchange Act
-Number 240
-Section 12
-Subsection b-2
| Name: |
dei_EntityRegistrantName |
| Namespace Prefix: |
dei_ |
| Data Type: |
xbrli:normalizedStringItemType |
| Balance Type: |
na |
| Period Type: |
duration |
|
| X |
- DefinitionThe Tax Identification Number (TIN), also known as an Employer Identification Number (EIN), is a unique 9-digit value assigned by the IRS. Reference 1: http://www.xbrl.org/2003/role/presentationRef
-Publisher SEC
-Name Exchange Act
-Number 240
-Section 12
-Subsection b-2
| Name: |
dei_EntityTaxIdentificationNumber |
| Namespace Prefix: |
dei_ |
| Data Type: |
dei:employerIdItemType |
| Balance Type: |
na |
| Period Type: |
duration |
|
| X |
- DefinitionLocal phone number for entity.
| Name: |
dei_LocalPhoneNumber |
| Namespace Prefix: |
dei_ |
| Data Type: |
xbrli:normalizedStringItemType |
| Balance Type: |
na |
| Period Type: |
duration |
|
| X |
- DefinitionBoolean flag that is true when the Form 8-K filing is intended to satisfy the filing obligation of the registrant as pre-commencement communications pursuant to Rule 13e-4(c) under the Exchange Act. Reference 1: http://www.xbrl.org/2003/role/presentationRef
-Publisher SEC
-Name Exchange Act
-Number 240
-Section 13e
-Subsection 4c
| Name: |
dei_PreCommencementIssuerTenderOffer |
| Namespace Prefix: |
dei_ |
| Data Type: |
xbrli:booleanItemType |
| Balance Type: |
na |
| Period Type: |
duration |
|
| X |
- DefinitionBoolean flag that is true when the Form 8-K filing is intended to satisfy the filing obligation of the registrant as pre-commencement communications pursuant to Rule 14d-2(b) under the Exchange Act. Reference 1: http://www.xbrl.org/2003/role/presentationRef
-Publisher SEC
-Name Exchange Act
-Number 240
-Section 14d
-Subsection 2b
| Name: |
dei_PreCommencementTenderOffer |
| Namespace Prefix: |
dei_ |
| Data Type: |
xbrli:booleanItemType |
| Balance Type: |
na |
| Period Type: |
duration |
|
| X |
- DefinitionTitle of a 12(b) registered security. Reference 1: http://www.xbrl.org/2003/role/presentationRef
-Publisher SEC
-Name Exchange Act
-Number 240
-Section 12
-Subsection b
| Name: |
dei_Security12bTitle |
| Namespace Prefix: |
dei_ |
| Data Type: |
dei:securityTitleItemType |
| Balance Type: |
na |
| Period Type: |
duration |
|
| X |
- DefinitionName of the Exchange on which a security is registered. Reference 1: http://www.xbrl.org/2003/role/presentationRef
-Publisher SEC
-Name Exchange Act
-Number 240
-Section 12
-Subsection d1-1
| Name: |
dei_SecurityExchangeName |
| Namespace Prefix: |
dei_ |
| Data Type: |
dei:edgarExchangeCodeItemType |
| Balance Type: |
na |
| Period Type: |
duration |
|
| X |
- DefinitionBoolean flag that is true when the Form 8-K filing is intended to satisfy the filing obligation of the registrant as soliciting material pursuant to Rule 14a-12 under the Exchange Act. Reference 1: http://www.xbrl.org/2003/role/presentationRef
-Publisher SEC
-Name Exchange Act
-Section 14a
-Number 240
-Subsection 12
| Name: |
dei_SolicitingMaterial |
| Namespace Prefix: |
dei_ |
| Data Type: |
xbrli:booleanItemType |
| Balance Type: |
na |
| Period Type: |
duration |
|
| X |
- DefinitionTrading symbol of an instrument as listed on an exchange.
| Name: |
dei_TradingSymbol |
| Namespace Prefix: |
dei_ |
| Data Type: |
dei:tradingSymbolItemType |
| Balance Type: |
na |
| Period Type: |
duration |
|
| X |
- DefinitionBoolean flag that is true when the Form 8-K filing is intended to satisfy the filing obligation of the registrant as written communications pursuant to Rule 425 under the Securities Act. Reference 1: http://www.xbrl.org/2003/role/presentationRef
-Publisher SEC
-Name Securities Act
-Number 230
-Section 425
| Name: |
dei_WrittenCommunications |
| Namespace Prefix: |
dei_ |
| Data Type: |
xbrli:booleanItemType |
| Balance Type: |
na |
| Period Type: |
duration |
|
| X |
- Details
| Name: |
us-gaap_StatementClassOfStockAxis=us-gaap_CommonStockMember |
| Namespace Prefix: |
|
| Data Type: |
na |
| Balance Type: |
|
| Period Type: |
|
|
| X |
- Details
| Name: |
us-gaap_StatementClassOfStockAxis=adc_DepositarySharesMember |
| Namespace Prefix: |
|
| Data Type: |
na |
| Balance Type: |
|
| Period Type: |
|
|
Agree Realty (NYSE:ADC-A)
Historical Stock Chart
Von Mär 2024 bis Apr 2024

Agree Realty (NYSE:ADC-A)
Historical Stock Chart
Von Apr 2023 bis Apr 2024
