 Directors' fees                                          56,922      40,000
 Audit fees                                               21,120      20,251
 Performance fees                                              -   1,319,179
                                                    ------------  ----------
                                                       7,605,134   2,343,113
                                                    ------------  ----------
 Profit/(loss) for the period                        (5,485,000)   7,049,778

 Tax incurred on dividend received                     (104,758)       (663)
                                                    ------------  ----------
                                                     (5,589,758)   7,049,778
 Other comprehensive income                                    -           -
                                                    ------------  ----------

 Total comprehensive income/(loss) for
  the period                                         (5,589,758)   7,049,778
                                                    ============  ==========

 Attributable to:
 Equity holders                                      (5,559,277)   6,985,000
 Non-controlling interest                               (30,481)      64,778

                                                     (5,589,758)   7,049,778
                                                    ------------  ----------


 Basic gains/(loss) per share for gain
  attributable to the equity holders              see note
  of the Company during the period          10          10     0.1639
AFRICA OPPORTUNITY FUND LIMITED
CONSOLIDATED STATEMENT OF FINANCIAL POSITION
AS AT 30 JUNE 2014
 Notes           As at      As at
          30 June 2014    30 June
                             2013
        --------------  ---------
                   USD        USD


 ASSETS

 Financial assets at fair value
  through profit or loss                   5(a)    65,669,485   51,038,216
 Trade and other receivables                6       1,691,088    1,160,571
 Cash and cash equivalents                         22,818,766    3,031,033
                                                  -----------  -----------

 Total assets                                      90,179,339   55,229,820
                                                  ===========  ===========

 EQUITY AND LIABILITIES

 Liabilities

 Financial liabilities at fair value
  through profit or loss                    5(b)   11,684,689    5,479,421
 Trade and other payables                   8       2,506,619    1,520,732

 Total liabilities                                 14,191,308    7,000,153
                                                  -----------  -----------

 Equity

 Ordinary share capital                    7(a)       426,303      426,303
 Ordinary share premium                            37,844,593   38,092,003
 C share capital                           7(b)     2,920,000            -
 C share premium                                   26,280,000            -
 Retained earnings                                  8,141,919    9,352,924
                                                  -----------  -----------

 Equity attributable to equity holders
  of the parent                                    75,612,815   47,871,230
 Non-controlling interest                             375,216      358,437


 Total equity                                      75,988,031   48,229,667
                                                  -----------  -----------

 Total equity and liabilities                      90,179,339   55,229,820
                                                  ===========  ===========
AFRICA OPPORTUNITY FUND LIMITED
CONSOLIDATED STATEMENT OF CHANGES IN EQUITY
FOR THE PERIOD FROM 1 JANUARY 2014 TO 30 JUNE 2014
                  Ordinary        Share     C Share      C Share        Retained           Total           Non    Total equity
                     Share      premium      Issued      premium        earnings                   controlling
                    Issued                  capital                                                   interest
                   capital
                 ---------  -----------  ----------  -----------  --------------  --------------  ------------  --------------
                       USD          USD         USD          USD             USD             USD           USD             USD
 At 1 January
  2014             426,303   37,921,452           -            -      13,701,196      52,048,951       405,697      52,454,648

 C Share
  Placing                -            -   2,920,000   26,280,000               -      29,200,000             -      29,200,000

 Total
  comprehensive
  income for
  the period             -            -           -            -     (5,559,277)     (5,559,277)      (30,481)     (5,589,758)

 Dividend                -     (76,859)           -            -               -        (76,859)             -        (76,859)


 At 30 June
  2014             426,303   37,844,593   2,920,000   26,280,000       8,141,919      75,612,815       375,216      75,988,031
                 =========  ===========  ==========  ===========  ==============  ==============  ============  ==============


 At 1 January 2013         426,303   38,262,525     -     -     2,367,924    41,056,752    293,659    41,350,411

 Total comprehensive
  income for the period          -            -     -     -     6,985,000     6,985,000     64,778     7,049,778

 Dividend                        -    (170,522)     -     -             -     (170,522)          -     (170,522)


 At 30 June 2013           426,303   38,092,003     -     -     9,352,924    47,871,230    358,437    48,229,667
                          ========  ===========  ====  ====  ============  ============  =========  ============
AFRICA OPPORTUNITY FUND LIMITED
CONSOLIDATED STATEMENT OF CASH FLOWS
FOR THE PERIOD FROM 1 JANUARY 2014 TO 30 JUNE 2014
 Notes   For the Period    For the Period
               Ended 30          Ended 30
              June 2014         June 2013
        ---------------  ----------------
                    USD               USD


 Cash flows from operating activities
 Comprehensive income/ (loss) for the
  period                                                  (5,589,758)      7,049,777

 Adjustment for:
 Interest income                                            (722,152)      (337,420)
 Dividend income                                            (995,397)      (932,097)
 (Gain)/ loss on financial assets at fair
  value through profit or loss                              5,068,917    (7,391,461)
 (Gain)/ loss on financial liabilities
  at fair value through profit or loss                       (71,392)      (246,236)


 Operating losses before working capital
  changes                                                 (2,309,782)    (1,857,437)

 Increase in other receivables and prepayments               (83,777)       (54,077)
 Increase in other payables and accrued
  expenses                                                      9,385      1,023,984
                                                        -------------  -------------

 Net cash used in operating activities                    (2,384,174)      (887,530)
                                                        -------------  -------------

 Investing activities
 Purchase of financial assets at fair
  value through profit or loss                    5(a)   (16,679,578)   (16,106,663)
 Disposal of financial assets at fair
  value through profit or loss                    5(a)      1,415,107     14,619,208
 Purchase of financial liabilities at
  fair value through profit or loss               5(b)      6,792,217    (2,304,319)
 Disposal of financial liabilities at
  fair value through profit or loss               5(b)              -      3,484,092
 Interest received                                            453,743        239,099
 Dividend received                                            770,496        524,081
                                                                       -------------

 Net cash generated from investing activities             (7,248,015)        455,498
                                                        -------------  -------------

 Financing activities
 Dividend paid                                              (162,149)      (170,522)
 C Share Placing                                           29,200,000              -
                                                        -------------  -------------

 Net cash flow used in financing activities                29,037,851      (170,522)
                                                        -------------  -------------

 Net increase/ (decrease) in cash and
  cash equivalents                                         19,405,662      (602,554)

 Cash and cash equivalents at 1 January                     3,413,104      3,633,587
                                                                       -------------

 Cash and cash equivalents at 30 June                      22,818,766      3,031,033
                                                        =============  =============

   1.      GENERAL INFORMATION
Africa Opportunity Fund Limited (the "Company") was launched and
admitted to trading on the London Stock Exchange AIM market ("AIM")
in July 2007. On 17 April 2014, AOF closed a placing of 29.2
million C shares. The Ordinary shares and the C shares of the
Company were admitted to trading on the London Stock Exchange's
Specialist Fund Market ("SFM"). Concurrent with the listing on the
SFM, the ordinary shares were cancelled from admission to trading
on AIM.
Africa Opportunity Fund Limited is a closed-ended fund
incorporated with limited liability and registered in Cayman
Islands under the Companies Law on 21 June 2007 and with registered
number MC-188243.
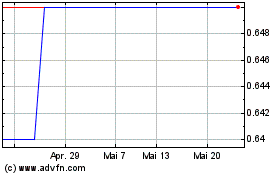
Africa Opportunity (LSE:AOF)
Historical Stock Chart
Von Jun 2024 bis Jul 2024

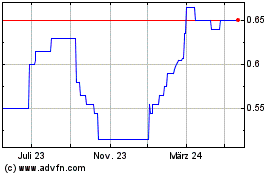
Africa Opportunity (LSE:AOF)
Historical Stock Chart
Von Jul 2023 bis Jul 2024
