Global Stocks Slip as Investors Look Ahead to Earnings
29 Oktober 2019 - 11:55AM
Dow Jones News
By Anna Isaac
Stocks ticked lower as investors look ahead to corporate
earnings and fresh U.S. data for cues on the health of the global
economy.
U.S. stock futures linked to the S&P 500 index drifted down
0.1% a day after the gauge hit a record. Major U.S. businesses
reporting Tuesday will include private-equity giant KKR, drugmaker
Pfizer, food-manufacturer Kellogg, auto maker General Motors and
financial-services firm Mastercard.
Shares in Google's parent company, Alphabet, dropped 1.3% in
offhours trading after the technology giant reported mixed
third-quarter progress. Climbing online advertising sales were
juxtaposed with rising costs and poor performance in its investment
portfolio.
The Stoxx Europe 600 index declined 0.5%, led by losses in
financial services and the oil and gas sectors.
Fresenius Medical Care and its parent, Fresenius SE, led gains
in European stocks. Shares in the Fresenius Medical rose 5.4% after
the maker of products for treating kidney disease posted higher
third-quarter profit and revenue. It's German parent climbed 4.4%
after the health care company also reporter stronger figures.
Investors with interests in U.K. assets will be watching
Parliament closely again for Brexit developments Tuesday. Prime
Minister Boris Johnson is poised to try once more to secure an
early general election on Dec. 12 to break the parliamentary
deadlock over his divorce deal with the European Union.
The pound dropped 0.4% against the U.S. dollar, while the FTSE
250 index declined 0.4%.
Across Asian markets, the picture was more mixed, with the
Nikkei 225 index up 0.5% while the Shanghai Composite gauge was
down 0.9%.
Brent crude, the global oil benchmark, fell 0.6% to $60.88 a
barrel following data showing rising U.S. inventories Monday.
Investors will look at American Petroleum Institute data due out
later Tuesday.
Write to Anna Isaac at anna.isaac@wsj.com
(END) Dow Jones Newswires
October 29, 2019 06:40 ET (10:40 GMT)
Copyright (c) 2019 Dow Jones & Company, Inc.
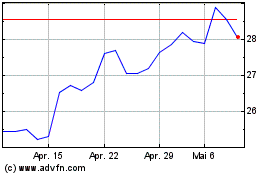
Fresenius SE & Co KGaA (TG:FRE)
Historical Stock Chart
Von Mär 2024 bis Apr 2024

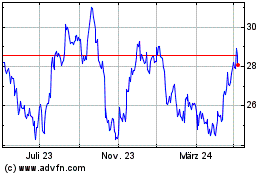
Fresenius SE & Co KGaA (TG:FRE)
Historical Stock Chart
Von Apr 2023 bis Apr 2024
