UNITED STATES
SECURITIES AND EXCHANGE COMMISSION
Washington, D.C. 20549
Form 6-K
REPORT OF
FOREIGN PRIVATE ISSUER
PURSUANT TO RULE 13a-16 OR
15d-16
UNDER THE SECURITIES EXCHANGE ACT OF 1934
For the month of August 2023
Commission File Number 1-14926
KT Corporation
(Translation of registrant’s name into English)
90, Buljeong-ro,
Bundang-gu,
Seongnam-si,
Gyeonggi-do,
Korea
(Address of
principal executive offices)
Indicate by check mark whether the registrant files or will file annual reports under cover of Form
20-F or Form 40-F:
Form
20-F ☑ Form 40-F ☐
SIGNATURES
Pursuant to the requirements of the Securities Exchange Act of 1934, the registrant has duly caused this report to be signed on its behalf by
the undersigned, thereunto duly authorized.
|
|
|
| Dated: August 7, 2023 |
| KT Corporation |
|
|
| By: |
|
/s/ Seunghoon Chi |
| Name: Seunghoon Chi |
| Title: Vice President |
|
|
| By: |
|
/s/ Sanghyun Cho |
| Name: Sanghyun Cho |
| Title: Director |

KT 2Q23 Earnings Release

Disclaimer This presentation has been prepared by KT Corp.(the
“Company”) in accordance with K-IFRS. This presentation contains forward-looking statements, which are subject to risks, uncertainties, and assumptions. This presentation is being presented solely for your information and is subject to
change without notice. No presentation or warranty, expressed or implied, is made and no reliance should be placed on the accuracy, actuality, fairness, or completeness of the information presented. st The Company has applied new accounting standard
of K-IFRS 1115 as of Jan 1 , 2018 and K-IFRS 1116 ‘Leases’ as st of Jan 1 , 2019. There are no obligation to apply the new standard to previous financial statements. The Company, its affiliates or representatives accept no liability
whatsoever for any losses arising from any information contained in the presentation. This presentation does not constitute an offer or invitation to purchase or subscribe for any shares of the Company, and no part of this presentation shall form
the Basis of or be relied upon in connection with any contract or commitment. Any decision to purchase shares of the Company could be made solely on the Basis of information, which has been publicly filed with the Securities and Exchange Commission
or the Korea Stock Exchange and distributed to all investors. The contents of this presentation may not be reproduced, redistributed or passed on, directly or indirectly, to any other person or published, in whole or in part, for any purpose. If you
have any questions related to this material, please contact the IR department. Tel: +82-2-3495-3254, 3262, 3265, 3557, 3558, 3564, 3595, 5339, 5341, 5344 Fax: +82-2-3495-5917 2
2 Financial Highlights 3 Business Overview 4 Appendix 3
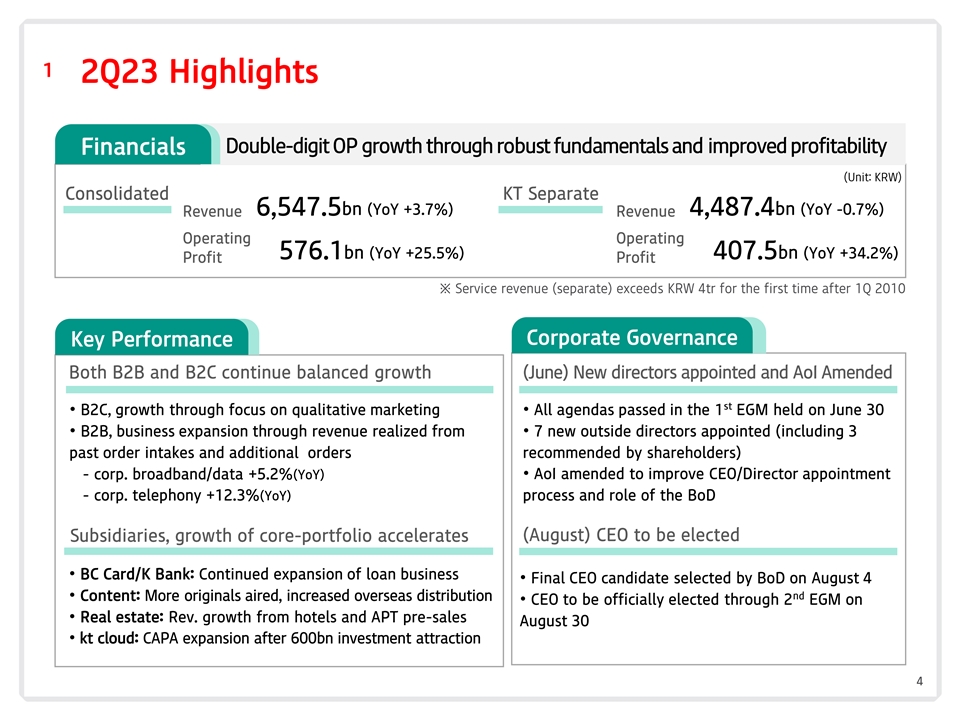
1 2Q23 Highlights Double-digit OP growth through robust fundamentals and
improved profitability Financials (Unit: KRW) Consolidated KT Separate 6,547.5bn (YoY +3.7%) 4,487.4bn (YoY -0.7%) Revenue Revenue Operating Operating 576.1bn (YoY +25.5%) 407.5bn (YoY +34.2%) Profit Profit ※ Service revenue (separate) exceeds
KRW 4tr for the first time after 1Q 2010 Corporate Governance Key Performance Both B2B and B2C continue balanced growth (June) New directors appointed and AoI Amended st • B2C, growth through focus on qualitative marketing• All agendas
passed in the 1 EGM held on June 30 • B2B, business expansion through revenue realized from • 7 new outside directors appointed (including 3 past order intakes and additional orders recommended by shareholders) - corp. broadband/data
+5.2%(YoY)• AoI amended to improve CEO/Director appointment - corp. telephony +12.3%(YoY) process and role of the BoD Subsidiaries, growth of core-portfolio accelerates (August) CEO to be elected • BC Card/K Bank: Continued expansion of
loan business • Final CEO candidate selected by BoD on August 4 nd • Content: More originals aired, increased overseas distribution • CEO to be officially elected through 2 EGM on • Real estate: Rev. growth from hotels and
APT pre-sales August 30 • kt cloud: CAPA expansion after 600bn investment attraction 4

1 2Q23 Highlights 2 Financial Highlights 3 Business Overview 4 Appendix
5
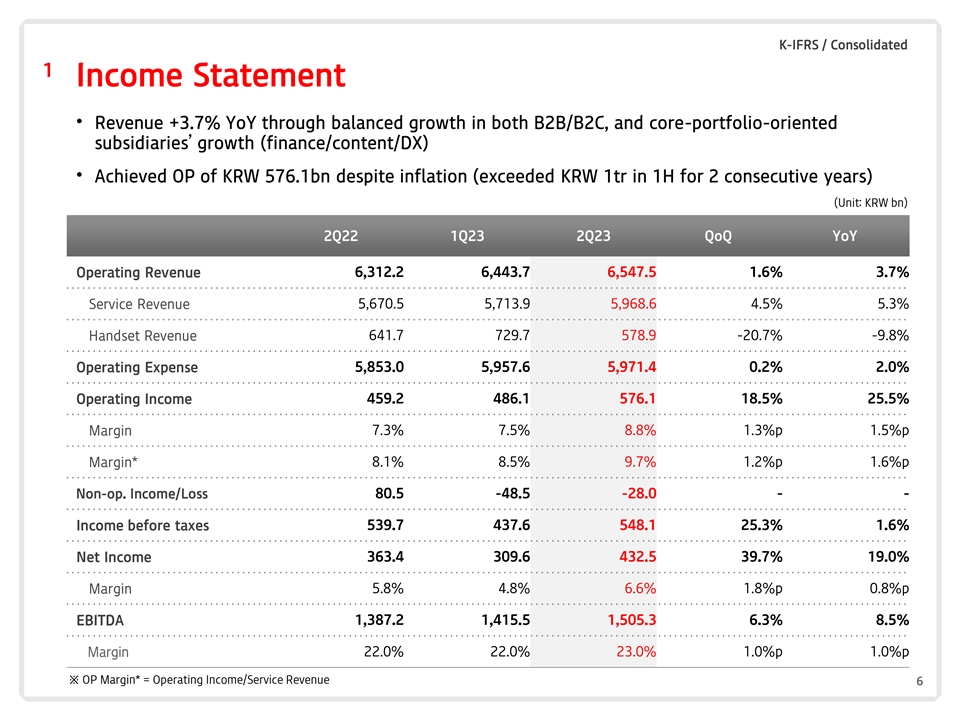
K-IFRS / Consolidated 1 Income Statement • Revenue +3.7% YoY through
balanced growth in both B2B/B2C, and core-portfolio-oriented subsidiaries’ growth (finance/content/DX) • Achieved OP of KRW 576.1bn despite inflation (exceeded KRW 1tr in 1H for 2 consecutive years) (Unit: KRW bn) 2Q22 1Q23 2Q23 QoQ YoY
Operating Revenue 6,312.2 6,443.7 6,547.5 1.6% 3.7% Service Revenue 5,670.5 5,713.9 5,968.6 4.5% 5.3% 641.7 729.7 578.9 -20.7% -9.8% Handset Revenue 5,853.0 5,957.6 5,971.4 0.2% 2.0% Operating Expense Operating Income 459.2 486.1 576.1 18.5% 25.5%
Margin 7.3% 7.5% 8.8% 1.3%p 1.5%p 8.1% 8.5% 9.7% 1.2%p 1.6%p Margin* Non-op. Income/Loss 80.5 -48.5 -28.0 - - Income before taxes 539.7 437.6 548.1 25.3% 1.6% 363.4 309.6 432.5 39.7% 19.0% Net Income 5.8% 4.8% 6.6% 1.8%p 0.8%p Margin EBITDA 1,387.2
1,415.5 1,505.3 6.3% 8.5% Margin 22.0% 22.0% 23.0% 1.0%p 1.0%p ※ OP Margin* = Operating Income/Service Revenue 6

K-IFRS / Consolidated 2 Operating Expenses (Unit: KRW bn) 2Q22 1Q23 2Q23 QoQ
YoY Operating Expenses 5,853.0 5,957.6 5,971.4 0.2% 2.0% Labor Cost 1,120.9 1,069.1 1,131.5 5.8% 0.9% General Expense 2,560.2 2,604.0 2,690.6 3.3% 5.1% - Depreciation 928.0 929.4 929.2 0.0% 0.1% Cost of Service Provided 863.0 830.2 813.2 -2.1% -5.8%
606.0 600.9 633.9 5.5% 4.6% Selling Expense Cost of Handset sold 703.0 853.3 702.3 -17.7% -0.1% § Selling Expense (KT Separate) (Unit: KRW bn) 2Q22 1Q23 2Q23 QoQ YoY Selling Expense 657.4 626.1 637.0 1.7% -3.1% 7
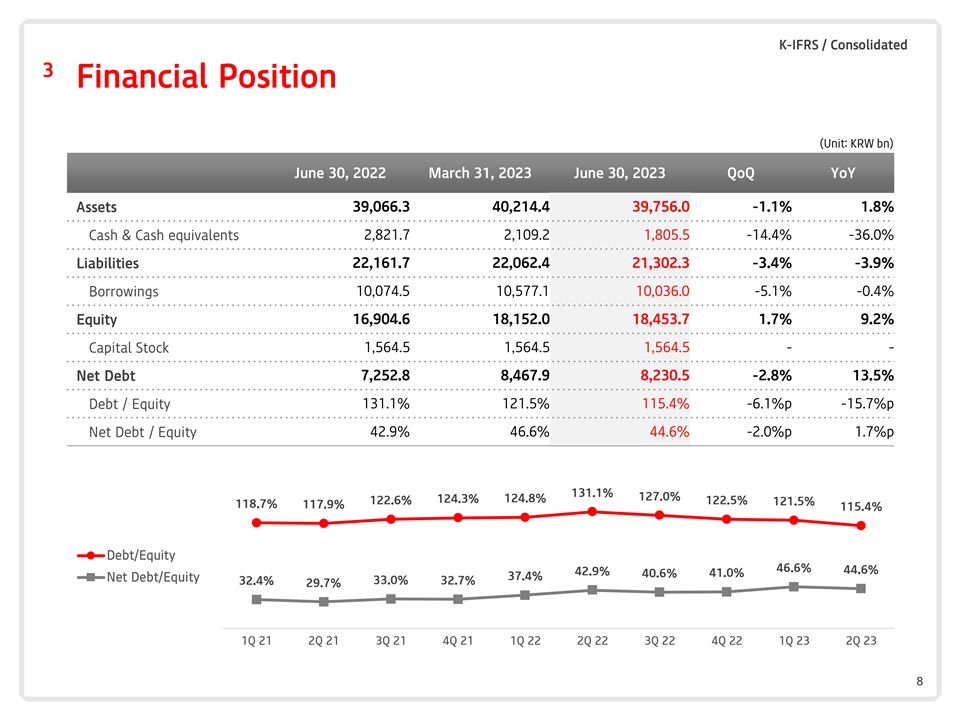
K-IFRS / Consolidated 3 Financial Position (Unit: KRW bn) June 30, 2022
March 31, 2023 June 30, 2023 QoQ YoY Assets 39,066.3 40,214.4 39,756.0 -1.1% 1.8% Cash & Cash equivalents 2,821.7 2,109.2 1,805.5 -14.4% -36.0% 22,161.7 22,062.4 21,302.3 -3.4% -3.9% Liabilities 10,074.5 10,577.1 10,036.0 -5.1% -0.4% Borrowings
16,904.6 18,152.0 18,453.7 1.7% 9.2% Equity 1,564.5 1,564.5 1,564.5 - - Capital Stock Net Debt 7,252.8 8,467.9 8,230.5 -2.8% 13.5% Debt / Equity 131.1% 121.5% 115.4% -6.1%p -15.7%p Net Debt / Equity 42.9% 46.6% 44.6% -2.0%p 1.7%p 131.1% 131.1%
127.0% 124.8% 124.3% 127.0% 122.6% 124.8% 122.5% 124.3% 121.5% 122.6% 122.5% 121.5% 118.7% 117.9% 118.7% 117.9% 115.4% Debt/Equity 44 66 .6 .6 % % 42.9% 44.6% 42.9% 4 40 0..6 6% % 44 11 .0 .0 % % 37.4% 37.4% Net Debt/Equity 32.4% 33.0% 32.7% 32.4%
33.0% 32.7% 29.7% 29.7% 1Q 1Q 21 21 2Q 2Q 21 21 3Q 3Q 21 21 4Q 4Q 21 21 1Q 1Q 22 22 2Q 2Q 22 22 3Q 3Q 22 22 4Q 4Q 22 22 1Q 1Q 23 23 2Q 23 8

K-IFRS / Separate and major subsidiaries 4 CAPEX • 1H23 CAPEX
execution : KRW 998.5bn(KT separate), KRW 385.3bn(major subsidiaries) (Unit: KRW bn) ■ Major subsidiaries CAPEX 3,502 Finance, Media·Content, Cloud/IDC, 3,452 3,127 Real Estate and etc. 782 692 462 ■ KT separate CAPEX Access
network, Backbone Network, B2B and etc. 1,384 2,760 2,721 2,666 385 999 2020 2021 2022 1H 2023 2020년 2021년 2022년 2023년상반기 ※ Cloud/IDC related investment in 2020 and 2021 are retroactively
reflected in subsidiaries’ CAPEX 9

1 2Q23 Highlights 2 Financial Highlights 3 Business Overview 4 Appendix
10

K-IFRS / Separate 1 KT – Telco B2C • Revenue +0.8% YoY due to
premium mobile/broadband subs acq and growth in roaming service • 5G penetration ratio reached 68% among handset subs, and GiGA subs proportion reached 68% (Unit: KRW bn) 2Q22 1Q23 2Q23 QoQ YoY Telco B2C 2,371.9 2,381.1 2,390.2 0.4% 0.8%
Wireless 1,550.3 1,554.8 1,562.0 0.5% 0.8% Broadband 596.3 607.9 612.4 0.7% 2.7% Telephony 225.3 218.4 215.8 -1.2% -4.2% (Unit: Thousands) (Unit: Thousands) Wireless Subscribers Broadband Subscribers (% of GiGA) 9,812 9,774 9,727 9,679 9,609 24,332
24,621 24,062 23,827 23,409 7,945 8,882 9,213 7,467 8,449 67.6% 67.3% 66.9% 66.6% 66.1% 4,432 5,297 4,836 5,973 6,486 3,998 3,788 3,754 3,652 3,481 6,978 6,827 6,257 6,562 5,974 2Q 22 3Q 22 4Q 22 1Q 23 2Q 23 2Q 22 3Q 22 4Q 22 1Q 23 2Q23 MVNO 2nd
device & IoT Ha Han nd dss eet t(e (x 5 cG . 5외 G)) Handset(5G) 11

K-IFRS / Separate 2 KT – DIGICO B2C • DIGICO B2C revenue +3.8%
YoY based on balanced growth of media and mobile platform businesses • IPTV revenue +1.2% YoY through expansion of premium subscriber base (Unit: KRW bn) 2Q22 1Q23 2Q23 QoQ YoY DIGICO B2C 554.4 566.1 575.6 1.7% 3.8% Media 500.8 506.9 518.0
2.2% 3.4% Mobile Platform 53.7 59.1 57.7 -2.4% 7.5% (Unit: Thousands) IPTV DIGICO B2C 9,470 IPTV 9,451 Media 9,432 Media and etc. 9,399 *Finance Platform Mobile **Contents Market 9,329 Platform IoT * Finance Platform : Mobile payment,
Authentification, Fintech and etc. ** Contents Market : App market payment, One-store, Contents distribution and etc. 2Q 22 3Q 22 4Q 22 1Q 23 2Q 23 ※ Number of IPTV subscribers above differs from MSIT figures that follow the IPTV law - Number
of KT pay TV subscribers is 8,783,984 in 2H 2022 (6 month average) 12

K-IFRS / Separate 3 KT – TELCO B2B • Corporate broadband/data
revenue +5.2% YoY, due to increase in CCTV lines, small & medium CP orders • Corporate telephony revenue +12.3% YoY centered on high growth of post-paid subscribers of MVNO (Unit: KRW bn) 2Q22 1Q23 2Q23 QoQ YoY Telco B2B 508.0 540.8 546.9
1.1% 7.6% Corp. BB/data 334.5 352.9 352.0 -0.3% 5.2% Corp. telephony 173.5 187.9 194.9 3.7% 12.3% MVNO Subscribers (Unit: Thousands) TELCO B2B 6,978 6,827 Leased Line, KORNET, VPN Corporate 6,562 Global Data, Wholesale Broadband/Data Internet
Exchange 6,257 MVNO 5,974 Corporate Corporate Telephony Telephony Corporate Intelligent Network 2Q 22 3Q 22 4Q 22 1Q 23 2Q23 13

K-IFRS / Separate 4 KT – DIGICO B2B • Revenue +0.6% YoY through
revenue from projects such as M-BcN* and real estate business • Strong hotel business due to newly opened hotels (Le Méridien & Moxy) and increased tourists *M-BcN: Military Broadband Convergence Network (Unit: KRW bn) 2Q22 1Q23 2Q23
QoQ YoY DIGICO B2B 502.9 464.6 505.9 8.9% 0.6% Enterprise DX 304.3 263.9 308.3 16.9% 1.3% Cloud/IDC 45.4 38.8 47.5 22.5% 4.6% AI/New Biz 108.5 112.1 99.4 -11.3% -8.4% Real Estate 44.7 49.9 50.7 1.5% 13.4% DIGICO B2B Enterprise Messaging AICC, AI
Robot Managed, Enterprise IoT Smart Mobility Enterprise DX Global ICT AI/ New Biz Smart Space solution Other ICT Blockchain, Energy, Video Security Cloud Other New Biz Cloud/IDC IDC Real Estate 14
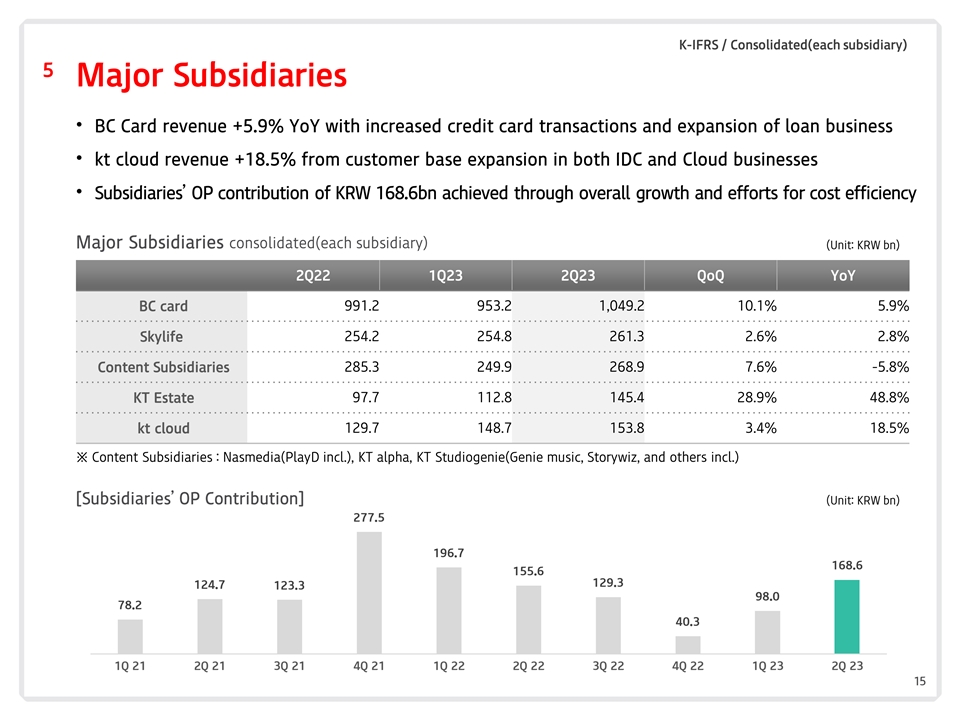
K-IFRS / Consolidated(each subsidiary) 5 Major Subsidiaries • BC Card
revenue +5.9% YoY with increased credit card transactions and expansion of loan business • kt cloud revenue +18.5% from customer base expansion in both IDC and Cloud businesses • Subsidiaries’ OP contribution of KRW 168.6bn
achieved through overall growth and efforts for cost efficiency Major Subsidiaries consolidated(each subsidiary) (Unit: KRW bn) 2Q22 1Q23 2Q23 QoQ YoY 991.2 953.2 1,049.2 10.1% 5.9% BC card 254.2 254.8 261.3 2.6% 2.8% Skylife Content Subsidiaries
285.3 249.9 268.9 7.6% -5.8% KT Estate 97.7 112.8 145.4 28.9% 48.8% kt cloud 129.7 148.7 153.8 3.4% 18.5% ※ Content Subsidiaries : Nasmedia(PlayD incl.), KT alpha, KT Studiogenie(Genie music, Storywiz, and others incl.) [Subsidiaries’ OP
Contribution] (Unit: KRW bn) 277.5 196.7 168.6 155.6 129.3 124.7 123.3 98.0 78.2 40.3 1Q 21 2Q 21 3Q 21 4Q 21 1Q 22 2Q 22 3Q 22 4Q 22 1Q 23 2Q 23 15

1 2Q23 Highlights 2 Financial Highlights 3 Business Overview 4 Appendix
16

1 K-IFRS Income Statement (Unit: KRW bn) Consolidated 2Q 22 3Q 22 4Q22 1Q
23 2Q 23 KT Separate 2Q 22 3Q 22 4Q 22 1Q 23 2Q 23 6,312.2 6,477.2 6,583.0 6,443.7 6,547.5 4,517.8 4,572.8 4,619.0 4,487.4 Operating revenue Operating revenue 4,590.2 Service revenue 5,670.5 5,744.8 5,705.0 5,713.9 5,968.6 Service revenue 3,937.3
3,944.4 3,923.3 3,952.6 4,018.6 Handset revenue 641.7 732.4 878.0 729.7 578.9 Handset revenue 580.5 645.8 649.5 666.4 468.8 Operating expense 5,853.0 6,024.3 6,431.5 5,957.6 5,971.4 Operating expense 4,214.3 4,266.6 4,461.7 4,230.9 4,080.0 Service
expense 5,150.1 5,197.3 5,558.1 5,104.2 5,269.1 Service expense 3,655.4 3,607.9 3,783.7 3,491.5 3,618.7 1,120.9 1,075.3 1,259.3 1,069.1 1,131.5 605.8 535.8 689.7 530.2 583.2 Labor cost Labor cost General expense 2,560.2 2,586.0 2,771.2 2,604.0
2,690.6 General expense 1,719.4 1,743.6 1,824.0 1,720.5 1,745.5 Cost of svc provided 863.0 887.6 885.9 830.2 813.2 Cost of svc provided 660.2 666.7 605.1 601.6 638.7 Selling expense 606.0 648.4 641.7 600.9 633.9 Selling expense 670.0 661.8 664.9
639.3 651.3 Cost of device sold 703.0 827.0 873.5 853.3 702.3 Cost of device sold 558.9 658.7 678.0 739.4 461.3 Operating income 459.2 452.9 151.4 486.1 576.1 Operating income 303.5 323.6 111.1 388.1 407.5 N-OP income (loss) 80.5 -13.9 121.8 -48.5
-28.0 N-OP income (loss) 23.0 1.5 -21.1 39.6 -12.8 N-OP income 445.1 515.8 101.6 242.3 185.5 N-OP income 359.1 468.3 -110.8 265.1 161.2 N-OP expense 385.7 520.8 -46.1 287.0 219.5 N-OP expense 336.0 466.8 -89.7 225.5 174.0 Equity Method (G/L) 21.0
-8.9 -25.9 -3.8 6.0 Income bf tax 539.7 439.0 273.2 437.6 548.1 Income bf tax 326.5 325.1 90.1 427.7 394.7 Income tax 176.3 112.8 30.5 128.0 115.6 Income tax 302.1 84.9 -18.0 107.8 89.6 Net income 363.4 326.2 242.7 309.6 432.5 Net income 24.4 240.3
108.1 319.9 305.1 NI contribution to KT 313.1 297.6 242.0 296.6 394.5 EBITDA 1,387.2 1,359.7 1,080.8 1,415.5 1,505.3 1,070.9 1,096.5 889.4 1,167.4 1,190.0 EBITDA EBITDA Margin EBITDA Margin 22.0% 21.0% 16.4% 22.0% 23.0% 23.7% 23.9% 19.5% 25.3% 26.5%
17

2 K-IFRS Balance Sheet (Unit: KRW bn) Consolidated 2Q 22 3Q 22 4Q 22 1Q 23
2Q 23 KT Separate 2Q 22 3Q 22 4Q 22 1Q 23 2Q 23 39,066.3 40,651.5 40,980.7 40,214.4 39,756.0 30,169.5 31,055.2 30,417.8 30,386.9 29,592.2 Assets Assets 12,563.7 13,042.2 12,681.6 12,202.0 11,405.7 7,352.7 6,603.5 6,972.1 6,172.5 Current assets
Current assets 7,612.4 Cash & cash equi. 2,821.7 3,095.1 2,449.1 2,109.2 1,805.5 Cash & cash equi. 1,592.4 1,645.1 966.3 866.3 625.7 Trade & other rec 3,857.6 4,095.0 3,951.8 4,098.7 3,933.1 Trade & other rec 3,135.9 3,294.1 3,055.6
3,283.3 3,018.4 513.3 675.7 709.2 779.6 636.9 238.7 300.4 349.9 380.1 260.1 Inventories Inventories 5,371.2 5,176.5 5,571.5 5,214.5 5,030.3 2,385.7 2,372.9 2,231.7 2,442.4 2,268.4 Other current asset Other current asset 1,316.8 1,313.5 1,307.2
1,284.2 1,269.5 1,394.1 1,391.1 1,386.3 1,367.2 1,378.0 - Prepaid_Contract cost - Prepaid_Contract cost - Contract assets 551.9 565.8 565.8 560.0 565.8 - Contract assets 484.6 499.5 493.4 488.2 493.4 26,502.5 27,609.3 28,299.1 28,012.6 28,350.3
22,816.8 23,442.8 23,814.3 23,414.8 23,419.6 Non-current assets Non-current assets 670.3 578.0 609.4 473.9 490.7 595.2 485.8 527.0 399.4 402.8 Trade & other rec Trade & other rec Tangible assets 14,540.4 14,466.0 14,772.2 14,562.2 14,675.6
Tangible assets 11,405.0 11,209.0 11,540.2 11,240.4 11,276.3 11,291.8 12,565.2 12,917.5 12,976.5 13,184.0 9,781.6 10,745.3 10,764.1 10,793.7 10,775.2 Other current assets Other current assets - Prepaid_Contract cost 514.8 515.8 510.4 484.7 480.4 -
Prepaid_Contract cost 499.1 500.7 496.8 476.0 477.6 - Contract assets 242.8 249.3 236.4 232.7 236.8 - Contract assets 184.3 194.2 186.0 183.1 184.9 Liabilities 22,161.7 22,745.9 22,566.0 22,062.4 21,302.3 Liabilities 16,405.9 16,401.5 15,559.7
15,766.5 14,817.5 11,070.8 10,583.6 10,699.3 10,164.8 9,862.9 7,580.4 6,848.2 6,321.4 6,582.7 6,153.7 Current liabilities Current liabilities Trade & other payables 6,545.1 6,795.4 7,371.0 6,424.7 6,225.9 Trade & other payables 4,603.9
4,628.6 4,672.6 4,477.0 4,253.7 Short-term borrowings 2,773.7 2,052.0 1,827.0 2,224.2 2,105.6 Short-term borrowings 1,990.4 1,358.0 984.7 1,359.5 1,131.5 1,752.1 1,736.3 1,501.2 1,515.9 1,531.4 986.2 861.6 664.1 746.2 768.6 Others Others - Contract
liabilities 274.8 251.6 242.4 264.3 264.1 - Contract liabilities 266.2 249.7 241.0 256.4 235.1 11,090.9 12,162.3 11,866.7 11,897.7 11,439.4 8,825.5 9,238.2 9,183.8 8,663.8 Non-current liabilities Non-current liabilities 9,553.4 Trade & other
payables 1,070.6 1,087.9 1,064.1 833.6 818.5 Trade & other payables 1,651.9 1,644.0 1,620.6 1,342.5 1,331.9 Long-term borrowings 7,300.9 8,314.6 8,179.6 8,352.9 7,930.4 Long-term borrowings 6,048.3 6,850.7 6,510.8 6,675.8 6,205.6 2,719.4 2,759.8
2,622.9 2,711.2 2,690.5 1,125.2 1,058.7 1,106.8 1,165.5 1,126.3 Others Others - Contract liabilities 35.0 34.1 41.7 44.5 39.3 - Contract liabilities 34.2 33.1 40.4 43.1 33.8 16,904.6 17,905.6 18,414.7 18,152.0 18,453.7 13,763.6 14,653.7 14,858.1
14,620.4 14,774.7 Equity Equity Retained earnings 13,551.0 13,857.3 14,257.3 14,008.3 14,404.0 Retained earnings 11,882.2 12,121.9 12,347.4 12,123.3 12,429.0 18
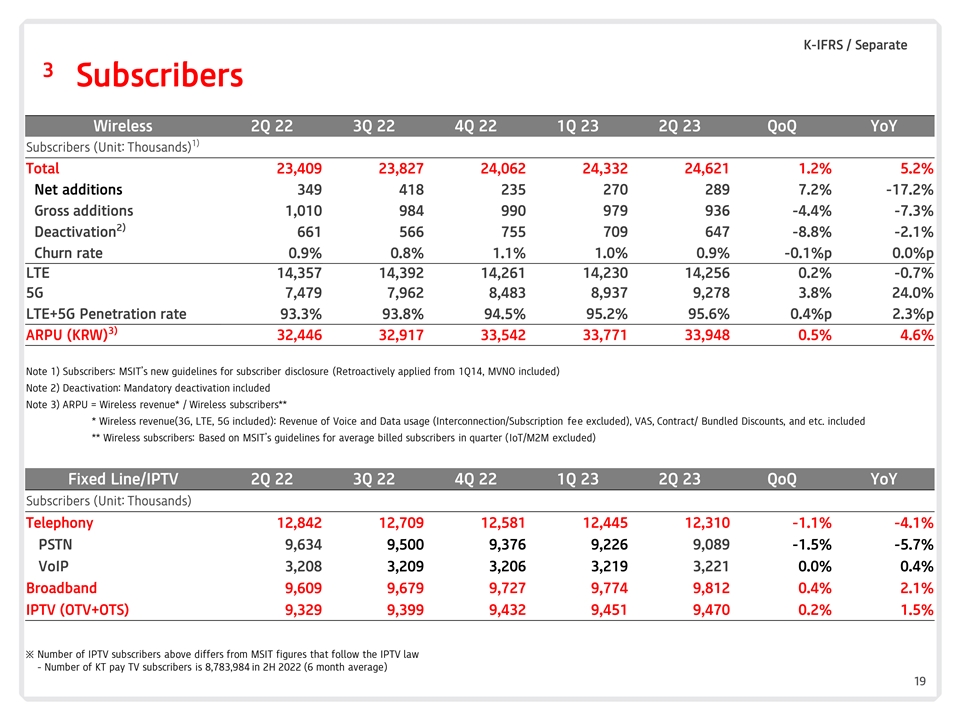
K-IFRS / Separate 3 Subscribers Wireless 2Q 22 3Q 22 4Q 22 1Q 23 2Q 23 QoQ
YoY 1) Subscribers (Unit: Thousands) Total 23,409 23,827 24,062 24,332 24,621 1.2% 5.2% Net additions 349 418 235 270 289 7.2% -17.2% Gross additions 1,010 984 990 979 936 -4.4% -7.3% 2) Deactivation 661 566 755 709 647 -8.8% -2.1% Churn rate 0.9%
0.8% 1.1% 1.0% 0.9% -0.1%p 0.0%p LTE 14,357 14,392 14,261 14,230 14,256 0.2% -0.7% 5G 7,479 7,962 8,483 8,937 9,278 3.8% 24.0% LTE+5G Penetration rate 95.2% 95.6% 0.4%p 2.3%p 93.3% 93.8% 94.5% 3) ARPU (KRW) 32,446 32,917 33,542 33,771 33,948 0.5%
4.6% Note 1) Subscribers: MSIT’s new guidelines for subscriber disclosure (Retroactively applied from 1Q14, MVNO included) Note 2) Deactivation: Mandatory deactivation included Note 3) ARPU = Wireless revenue* / Wireless subscribers** *
Wireless revenue(3G, LTE, 5G included): Revenue of Voice and Data usage (Interconnection/Subscription fee excluded), VAS, Contract/ Bundled Discounts, and etc. included ** Wireless subscribers: Based on MSIT’s guidelines for average billed
subscribers in quarter (IoT/M2M excluded) Fixed Line/IPTV 2Q 22 3Q 22 4Q 22 1Q 23 2Q 23 QoQ YoY Subscribers (Unit: Thousands) Telephony 12,842 12,709 12,581 12,445 12,310 -1.1% -4.1% PSTN 9,376 9,226 9,089 -1.5% -5.7% 9,634 9,500 VoIP 3,208 3,209
3,206 3,219 3,221 0.0% 0.4% Broadband 9,609 9,679 9,727 9,774 9,812 0.4% 2.1% IPTV (OTV+OTS) 9,432 9,451 9,470 0.2% 1.5% 9,329 9,399 ※ Number of IPTV subscribers above differs from MSIT figures that follow the IPTV law - Number of KT pay TV
subscribers is 8,783,984 in 2H 2022 (6 month average) 19

KT (NYSE:KT)
Historical Stock Chart
Von Apr 2024 bis Mai 2024

KT (NYSE:KT)
Historical Stock Chart
Von Mai 2023 bis Mai 2024
