Form NPORT-P - Monthly Portfolio Investments Report on Form N-PORT (Public)
29 November 2023 - 5:16PM
Edgar (US Regulatory)
The
Gabelli
Healthcare
&
Wellness
Rx
Trust
Schedule
of
Investments
—
September
30,
2023
(Unaudited)
Shares
Market
Value
COMMON
STOCKS
—
97.8%
Beverages
—
2.3%
60,000
China
Mengniu
Dairy
Co.
Ltd.
.........
$
201,125
28,743
Danone
SA
......................
1,588,105
40,000
ITO
EN
Ltd.
.....................
1,287,206
7,000
Morinaga
Milk
Industry
Co.
Ltd.
.......
263,577
5,000
PepsiCo
Inc.
.....................
847,200
30,000
Suntory
Beverage
&
Food
Ltd.
........
913,410
424,000
Vitasoy
International
Holdings
Ltd.
.....
513,286
5,613,909
Biotechnology
—
3.6%
7,500
Bio-Rad
Laboratories
Inc.,
Cl. A†
......
2,688,375
55,000
Catalent
Inc.†
....................
2,504,150
8,300
Charles
River
Laboratories
International
Inc.†
........................
1,626,634
3,000
Idorsia
Ltd.†
.....................
8,489
3,600
Illumina
Inc.†
....................
494,208
700
Incyte
Corp.†
....................
40,439
5,000
Invitae
Corp.†
....................
3,026
300
Natera
Inc.†
.....................
13,275
300
PhenomeX
Inc.†
..................
299
1,200
Regeneron
Pharmaceuticals
Inc.†
......
987,552
1,000
Waters
Corp.†
...................
274,210
8,640,657
Electronics
—
1.7%
8,150
Thermo
Fisher
Scientific
Inc.
.........
4,125,286
Equipment
and
Supplies
—
0.6%
90,000
Owens
&
Minor
Inc.†
..............
1,454,400
Food
—
19.6%
10,000
Calavo
Growers
Inc.
...............
252,300
40,000
Campbell
Soup
Co.
................
1,643,200
25,000
Conagra
Brands
Inc.
...............
685,500
52,500
Flowers
Foods
Inc.
................
1,164,450
25,000
General
Mills
Inc.
.................
1,599,750
27,200
Kellanova
.......................
1,618,672
34,000
Kerry
Group
plc,
Cl. A
..............
2,788,550
81,500
Kikkoman
Corp.
..................
4,277,877
15,000
Lamb
Weston
Holdings
Inc.
..........
1,386,900
10,000
Maple
Leaf
Foods
Inc.
..............
192,159
30,000
MEIJI
Holdings
Co.
Ltd.
.............
745,985
60,000
Mondelēz
International
Inc.,
Cl. A
......
4,164,000
63,000
Nestlé
SA
.......................
7,140,023
45,000
Nomad
Foods
Ltd.†
................
684,900
45,000
Post
Holdings
Inc.†
................
3,858,300
10,000
Sovos
Brands
Inc.†
................
225,500
2,000
The
Hain
Celestial
Group
Inc.†
........
20,740
28,000
The
J.M.
Smucker
Co.
..............
3,441,480
90,000
The
Kraft
Heinz
Co.
................
3,027,600
120,000
Tingyi
(Cayman
Islands)
Holding
Corp.
..
167,643
Shares
Market
Value
40,000
TreeHouse
Foods
Inc.†
.............
$
1,743,200
60,000
Unilever
plc,
ADR
.................
2,964,000
124,000
Yakult
Honsha
Co.
Ltd.
.............
3,014,534
46,807,263
Food
and
Staples
Retailing
—
7.9%
4,000
BARK
Inc.†
.....................
4,800
140,000
BellRing
Brands
Inc.†
..............
5,772,200
99,400
CVS
Health
Corp.
.................
6,940,108
30,000
Ingles
Markets
Inc.,
Cl. A
............
2,259,900
1,500
Petco
Health
&
Wellness
Co.
Inc.†
.....
6,135
13,000
Pets
at
Home
Group
plc
.............
53,104
20,000
Sprouts
Farmers
Market
Inc.†
........
856,000
60,000
The
Kroger
Co.
...................
2,685,000
6,000
United
Natural
Foods
Inc.†
...........
84,840
10,000
Walgreens
Boots
Alliance
Inc.
........
222,400
18,884,487
Health
Care
Equipment
and
Supplies
—
20.0%
500
Agilent
Technologies
Inc.
............
55,910
126,017
Bausch
+
Lomb
Corp.†
.............
2,135,988
55,000
Baxter
International
Inc.
.............
2,075,700
2,200
Becton
Dickinson
&
Co.
.............
568,766
16,000
Boston
Scientific
Corp.†
............
844,800
18,000
Cutera
Inc.†
.....................
108,360
75,000
DENTSPLY
SIRONA
Inc.
............
2,562,000
15,867
Electromed
Inc.†
..................
164,858
40
Embecta
Corp.
...................
602
800
Exact
Sciences
Corp.†
..............
54,576
7,000
Gerresheimer
AG
.................
736,004
26,613
Globus
Medical
Inc.,
Cl. A†
..........
1,321,348
51,919
Halozyme
Therapeutics
Inc.†
.........
1,983,306
45,000
Henry
Schein
Inc.†
................
3,341,250
800
Hologic
Inc.†
....................
55,520
8,000
Horizon
Therapeutics
plc†
...........
925,520
8,500
ICU
Medical
Inc.†
.................
1,011,585
182,000
InfuSystem
Holdings
Inc.†
...........
1,754,480
45,000
Integer
Holdings
Corp.†
.............
3,529,350
200
Intuitive
Surgical
Inc.†
..............
58,458
45,000
Lantheus
Holdings
Inc.†
............
3,126,600
25,000
Medtronic
plc
....................
1,959,000
15,000
Merit
Medical
Systems
Inc.†
.........
1,035,300
1,400
Neogen
Corp.†
...................
25,956
43,274
Neuronetics
Inc.†
.................
58,420
2,200
Patterson
Cos.
Inc.
................
65,208
23,500
QuidelOrtho
Corp.†
................
1,716,440
500
Revvity
Inc.
.....................
55,350
33,473
Semler
Scientific
Inc.†
..............
849,210
70,000
Silk
Road
Medical
Inc.†
.............
1,049,300
3,300
Smith
&
Nephew
plc,
ADR
...........
81,741
25,000
Stericycle
Inc.†
...................
1,117,750
14,000
Stryker
Corp.
....................
3,825,780
17,000
SurModics
Inc.†
..................
545,530
The
Gabelli
Healthcare
&
Wellness
Rx
Trust
Schedule
of
Investments
(Continued)
—
September
30,
2023
(Unaudited)
Shares
Market
Value
COMMON
STOCKS
(Continued)
Health
Care
Equipment
and
Supplies
(Continued)
4,000
Tandem
Diabetes
Care
Inc.†
..........
$
83,080
12,000
The
Cooper
Companies
Inc.
..........
3,816,120
110,000
Treace
Medical
Concepts
Inc.†
........
1,442,100
34,400
Zimmer
Biomet
Holdings
Inc.
.........
3,860,368
48,001,634
Health
Care
Providers
and
Services
—
21.7%
160,000
Avantor
Inc.†
....................
3,372,800
134,776
CareCloud
Inc.†
..................
154,993
35,000
Cencora
Inc.
.....................
6,298,950
6,000
Chemed
Corp.
...................
3,118,200
25,000
DaVita
Inc.†
.....................
2,363,250
19,084
DLH
Holdings
Corp.†
..............
222,710
9,200
Elevance
Health
Inc.
...............
4,005,864
192,500
Evolent
Health
Inc.,
Cl. A†
...........
5,241,775
16,385
Fortrea
Holdings
Inc.†
..............
468,447
24,200
HCA
Healthcare
Inc.
...............
5,952,716
500
IQVIA
Holdings
Inc.†
...............
98,375
16,385
Laboratory
Corp.
of
America
Holdings
...
3,294,204
8,000
McKesson
Corp.
..................
3,478,800
600
Medpace
Holdings
Inc.†
............
145,278
170,603
Option
Care
Health
Inc.†
............
5,519,007
10,000
Orthofix
Medical
Inc.†
..............
128,600
55,053
PetIQ
Inc.†
......................
1,084,544
500
Quest
Diagnostics
Inc.
..............
60,930
96,000
Tenet
Healthcare
Corp.†
.............
6,325,440
1,035
UnitedHealth
Group
Inc.
............
521,837
51,856,720
Household
and
Personal
Products
—
2.6%
12,000
Church
&
Dwight
Co.
Inc.
...........
1,099,560
15,000
Colgate-Palmolive
Co.
..............
1,066,650
60,000
Edgewell
Personal
Care
Co.
..........
2,217,600
12,000
The
Procter
&
Gamble
Co.
...........
1,750,320
6,134,130
Pharmaceuticals
—
17.8%
21,900
Abbott
Laboratories
...............
2,121,015
47,400
AbbVie
Inc.
.....................
7,065,444
25,000
Achaogen
Inc.†(a)
.................
0
35,611
AstraZeneca
plc,
ADR
..............
2,411,577
24,000
Bausch
Health
Cos.
Inc.†
............
197,280
66,800
Bristol-Myers
Squibb
Co.
............
3,877,072
75,000
Elanco
Animal
Health
Inc.†
...........
843,000
43,400
Johnson
&
Johnson
...............
6,759,550
20,000
Merck
&
Co.
Inc.
..................
2,059,000
67,500
Perrigo
Co.
plc
...................
2,156,625
92,125
Pfizer
Inc.
......................
3,055,786
12,000
Roche
Holding
AG,
ADR
............
407,160
25,000
Teva
Pharmaceutical
Industries
Ltd.,
ADR†
255,000
20,400
The
Cigna
Group
..................
5,835,828
Shares
Market
Value
7,808
Vertex
Pharmaceuticals
Inc.†
.........
$
2,715,154
12,000
Viatris
Inc.
......................
118,320
2,040
Zimvie
Inc.†
.....................
19,196
15,200
Zoetis
Inc.
......................
2,644,496
42,541,503
Specialty
Chemicals
—
0.0%
1,000
International
Flavors
&
Fragrances
Inc.
..
68,170
TOTAL
COMMON
STOCKS
.........
234,128,159
PREFERRED
STOCKS
—
0.1%
Biotechnology
—
0.1%
5,600
XOMA
Corp.,
Ser.
A,
8.625%
.........
133,280
RIGHTS
—
0.0%
Biotechnology
—
0.0%
6,907
Tobira
Therapeutics
Inc.,
CVR†(a)
......
0
Health
Care
Providers
and
Services
—
0.0%
38,284
Chinook
Therapeutics
Inc.,
CVR†
......
15,314
Pharmaceuticals
—
0.0%
3,500
Ipsen
SA/Clementia,
CVR†(a)
.........
0
13,000
Paratek
Pharmaceuticals
Inc.,
CVR†
....
260
260
TOTAL
RIGHTS
................
15,574
WARRANTS
—
0.0%
Health
Care
Providers
and
Services
—
0.0%
420
Option
Care
Health
Inc.,
Cl. A,
expire
07/27/25†
.....................
1,429
420
Option
Care
Health
Inc.,
Cl. B,
expire
07/27/25†
.....................
971
2,400
Principal
Amount
U.S.
GOVERNMENT
OBLIGATIONS
—
2.1%
$
5,145,000
U.S.
Treasury
Bills,
5.338%
to
5.414%††,
11/09/23
to
01/11/24
......................
5,104,446
TOTAL
INVESTMENTS
—
100.0%
....
(Cost
$174,923,333)
.............
$
239,383,859
The
Gabelli
Healthcare
&
Wellness
Rx
Trust
Schedule
of
Investments
(Continued)
—
September
30,
2023
(Unaudited)
(a)
Security
is
valued
using
significant
unobservable
inputs
and
is
classified
as
Level
3
in
the
fair
value
hierarchy.
†
Non-income
producing
security.
††
Represents
annualized
yields
at
dates
of
purchase.
ADR
American
Depositary
Receipt
CVR
Contingent
Value
Right
Geographic
Diversification
%
of
Total
Investments
Market
Value
North
America
......................
85.5
%
$
204,764,938
Europe
..............................
9.7
23,234,277
Japan
...............................
4.4
10,502,590
Asia/Pacific
.........................
0.4
882,054
Total
Investments
...................
100.0%
$
239,383,859
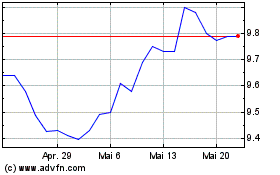
Gabelli Healthcare and W... (NYSE:GRX)
Historical Stock Chart
Von Dez 2024 bis Jan 2025

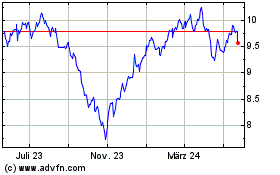
Gabelli Healthcare and W... (NYSE:GRX)
Historical Stock Chart
Von Jan 2024 bis Jan 2025
