0001093691
false
0001093691
2023-10-11
2023-10-11
iso4217:USD
xbrli:shares
iso4217:USD
xbrli:shares
UNITED STATES
SECURITIES AND EXCHANGE COMMISSION
WASHINGTON, D.C. 20549
FORM 8-K
CURRENT REPORT
Pursuant to Section 13 or 15(d) of
the Securities Exchange Act of 1934
Date of Report (Date of earliest event reported):
October 11, 2023
Plug Power Inc.
(Exact name of registrant as specified in its
charter)
| Delaware |
|
1-34392 |
|
22-3672377 |
| (State or other jurisdiction |
|
(Commission File |
|
(IRS Employer |
| of incorporation) |
|
Number) |
|
Identification No.) |
| |
|
|
|
|
968 Albany Shaker Road,
Latham, New York |
|
12110 |
| (Address of principal executive offices) |
|
(Zip Code) |
Registrant’s telephone number, including
area code: (518) 782-7700
N/A
(Former name or former address, if changed
since last report.)
Check the appropriate box below if the Form 8-K filing is intended
to simultaneously satisfy the filing obligation of the registrant under any of the following provisions (see General Instruction
A.2. below):
| ¨ | Written communications pursuant to Rule 425 under the Securities
Act (17 CFR 230.425) |
| ¨ | Soliciting material pursuant to Rule 14a-12 under the Exchange
Act (17 CFR 240.14a-12) |
| ¨ | Pre-commencement communications pursuant to Rule 14d-2(b) under
the Exchange Act (17 CFR 240.14d-2(b)) |
| ¨ | Pre-commencement communications pursuant to Rule 13e-4(c) under
the Exchange Act (17 CFR 240.13e-4(c)) |
Securities registered pursuant to 12(b) of the Act:
| Title of each class |
|
Trading Symbol(s) |
|
Name of each exchange on which
registered |
| Common Stock, par value $0.01 per share |
|
PLUG |
|
The Nasdaq Capital Market |
Indicate by check mark whether the registrant is an emerging growth
company as defined in Rule 405 of the Securities Act of 1933 (§ 230.405 of this chapter) or Rule 12b-2 of the Securities Exchange
Act of 1934 (§ 240.12b-2 of this chapter).
Emerging growth
company ¨
If an emerging growth
company, indicate by check mark if the registrant has elected not to use the extended transition period for complying with any new or
revised financial accounting standards provided pursuant to Section 13(a) of the Exchange Act. ¨
| Item 7.01 |
Regulation FD Disclosure |
On October 11, 2023, Plug Power Inc., a Delaware corporation (the
“Company”), will host its fifth annual symposium in person at its Vista manufacturing facility in Slingerlands, New York
starting at 8:30 a.m. Eastern Time. The symposium will also be made available to the public via
webcast at https://event.on24.com/wcc/r/4314727/2414AADF6F3CCEF63D0AF4A96F378ABA?partnerref=PR. During
the symposium, certain of the Company’s officers will provide a highlight of the Company’s business and certain of the Company’s
officers and outside guest speakers will provide an overview of the hydrogen economy and the state of the industry.
A copy of the presentation that will be used at the symposium is furnished
herewith as Exhibit 99.1 to this Current Report on Form 8-K and incorporated herein by reference. A recording of the webcast and corresponding
slides will be available on the Company's website for a period of time following the call. Replays from the breakout room sessions will
be available at Plug Power - YouTube.
The information included in this Item 7.01, including Exhibit 99.1,
of this Current Report on Form 8-K is not deemed to be “filed” for purposes of Section 18 of the Securities Exchange
Act of 1934, as amended (the “Exchange Act”), nor shall it be incorporated by reference into the Company’s filings under
the Securities Act of 1933, as amended (the “Securities Act”), or the Exchange Act, except as expressly set forth by specific
reference in such future filing.
| Item 9.01. |
Financial Statements and Exhibits. |
(d) Exhibits
SIGNATURE
Pursuant to the requirements of the Securities
Exchange Act of 1934, the registrant has duly caused this report to be signed on its behalf by the undersigned hereunto duly authorized.
| |
Plug Power Inc. |
| |
|
| Date: October 11, 2023 |
By: |
/s/ Paul Middleton |
| |
Name: |
Paul Middleton |
| |
Title: |
Chief Financial Officer |
Exhibit 99.1

Copyright 2023, Plug Power Inc. October 11, 2023 Andy Marsh, President and CEO Plug Symposium Welcome

This presentation includes “forward - looking statements” about Plug Power Inc . (“Plug”) . These forward - looking statements contain projections of Plug’s future results of operations, or of Plug’s business or financial position, or other forward - looking statements . Plug intends these forward - looking statements to be covered by the safe harbor provisions for forward - looking statements contained in Section 27 A of the Securities Act of 1933 , as amended, and Section 21 E of the Securities Exchange Act of 1934 , as amended . These forward - looking statements are based upon the current expectations, estimates, forecasts and projections as well as the current beliefs and assumptions of Plug’s management and are subject to significant risks and uncertainties and include, but are not limited to, statements about : Plug’s ability to achieve profitability ; Plug’s projections regarding its future financial and market outlook, including its ability to achieve forecasted revenue, gross margin, annual sales, operating income, operating cash flows and OPEX leverage targets ; Plug’s ability to achieve its strategic forecast and target business model ; Plugs ability to drive down capital expenditure and achieve cost savings ; Plug’s expectation that substantial growth will continue and its expectation regarding the underlying drivers of the company’s growth ; Plug’s expectation regarding the total addressable market, serviceable available market, serviceable obtainable market and the number and size of potential market opportunities ; Plug’s belief that the success of its pilot programs will lead to future sales or demand for its products ; Plug’s belief that its growth strategies will have the intended benefits ; Plug’s ability to realize growth across multiple business units ; Plug’s belief that newly implemented regulations, business expansion, margin enhancement and non - dilutive funding will accelerate revenue growth ; the expected benefits of Plug’s planned equipment improvements, service improvements, and fuel improvements ; Plug’s ability to obtain financing and project capital in amounts that are sufficient for Plug’s working capital needs and on terms that are favorable as well as its ability to obtain DOE loans ; Plug’s expectation regarding its capital structure and ability to obtain project finance debt ; Plug’s expectation regarding its liquidity and potential for investments and Plug’s ability to leverage its investments to capture market opportunities ; the ability of joint venture and MOU partners to complement Plug’s growth and to accelerate hydrogen ecosystems ; Plug’s expectation that favorable government policy initiatives will continue ; the anticipated impact of the Inflation Reduction Act of 2022 (IRA) and the Bipartisan Infrastructure Law (BIL) on the hydrogen industry and Plug’s ability to benefit from the provisions of such legislation, including the tax credits and incentives included in the IRA and the H 2 Hubs initiative contemplated by the BIL ; Plug’s expectation that the joint effort with Energy Vault will accelerate the deployment of energy storage solutions ; Plug’s expectations regarding the development of the microgrid and mobile generation markets ; the anticipated benefits, capacity, capabilities, and output of Plug’s green hydrogen network, including those located in North American and Europe and those under development in Belgium, Finland, Denmark and France ; the societal value placed upon, and the potential for global adoption of, hydrogen power ; Plug’s projections with respect to, among other things, hydrogen output, demand and use of its HyVia vans, stationary products, electrolyzers , liquefier products, liquid hydrogen distribution products, fuel cell powered forklift trucks, fuel cells for peaking applications, port logistics solutions and manufacturing capabilities, and the planned expansion of Plug’s hydrogen network ; Plug’s ability to execute its strategy for ELX system assembly and fabrication ; Plug’s ability to capitalize on demand from electric vehicle and new home power generation ; Plug’s ability to achieve each of its supply chain goals and execute its supply chain improvement strategy ; Plug’s ability to continue to deliver on expanding its green hydrogen network and capacity ; the scalability of Plug’s products, services, and hydrogen plants ; Plug’s expectations for expanding its manufacturing facilities and for automating parts of the production process ; Plug’s expectations for cost savings based on future labor models and increased scale ; Plug’s expectations for future innovations and improvements that it believes will help decease costs and improve performance ; Plug’s belief that it can extend the life of its materials by repairing them ; Plug’s belief that it can increase its service offerings and that those offerings can be profitable ; and Plug’s belief that datacenter’s demand for its products will grow and that Plug will be able to capitalize on such demand . You can identify forward - looking statements by forward - looking words such as “anticipate,” “believe,” “could,” “continue,” “estimate,” “expect,” “forecast,” “intend,” “may,” “should,” “will,” “would,” “plan,” “projected,” “target” or the negative of such words or other similar words or phrases . Plug believes that it is important to communicate its future expectations to investors . However, such statements should not be read as a guarantee of future performance or results . Such statements are subject to risks and uncertainties that could cause actual performance or results to differ materially from those expressed in these statements, including that Plug continues to incur losses and might never achieve or maintain profitability, that Plug will need to raise additional capital to fund its operations and such capital may not be available to the company, that global economic and political uncertainty, including inflationary pressures, fluctuating interest rates, bank failures, and supply chain disruptions, material availability, volatility in commodity pricing, labor shortages and competition may adversely affect Plug’s business, and that Plug’s lack of experience in manufacturing and marketing of certain of its products may impact its ability to manufacture and market products on a profitable and large - scale commercial basis . For a further description of the risks and uncertainties that could cause actual results to differ from those expressed in these forward - looking statements, as well as risks relating to the business of Plug in general, see Plug’s public filings with the Securities and Exchange Commission (the “SEC”), including the “Risk Factors” section of Plug’s Annual Report on Form 10 - K for the year ended December 31 , 2022 , its Quarterly Reports on Form 10 - Q for the quarters ended March 31 , 2023 and June 30 , 2023 and any of its subsequent filings with the SEC . Readers are cautioned not to place undue reliance on these forward - looking statements . The forward - looking statements are made as of the date hereof and Plug undertakes no obligation to update such statements as a result of new information . Financial projections which are included in this presentation are based on assumptions and analyses made by management based on its experience and perception of historical trends, current conditions and expected future developments, as well as other factors it believes are appropriate under the circumstances . There is no assurance that the financial projections will be realized . Information provided in this presentation is solely as of the date it is provided and may change or be modified at any time without notice . Industry and market estimates, data and other statistical information included in this presentation are generally based on independent industry publications, reports by market research firms or other published independent sources . Such information involves a number of assumptions and limitations, and you are cautioned not to give undue weight to such information . Plug has not independently verified the industry and market information generated by such sources and, accordingly, Plug cannot guarantee their accuracy or completeness . In addition, certain information contained herein has been obtained from sources prepared by other third parties . None of Plug or any of its representatives shall have any liability with respect to any such industry, market or third - party information that is contained in this presentation . Certain portions of this presentation, given in collaboration with Plug customers such as Tyson Foods, United Rentals, Edge Cloud, and Energy Vault, contain information provided by such customers . Plug has not independently verified such customer information and, accordingly, Plug cannot guarantee their accuracy or completeness . None of Plug or any of its representatives shall have any liability with respect to such information that is contained in this presentation .
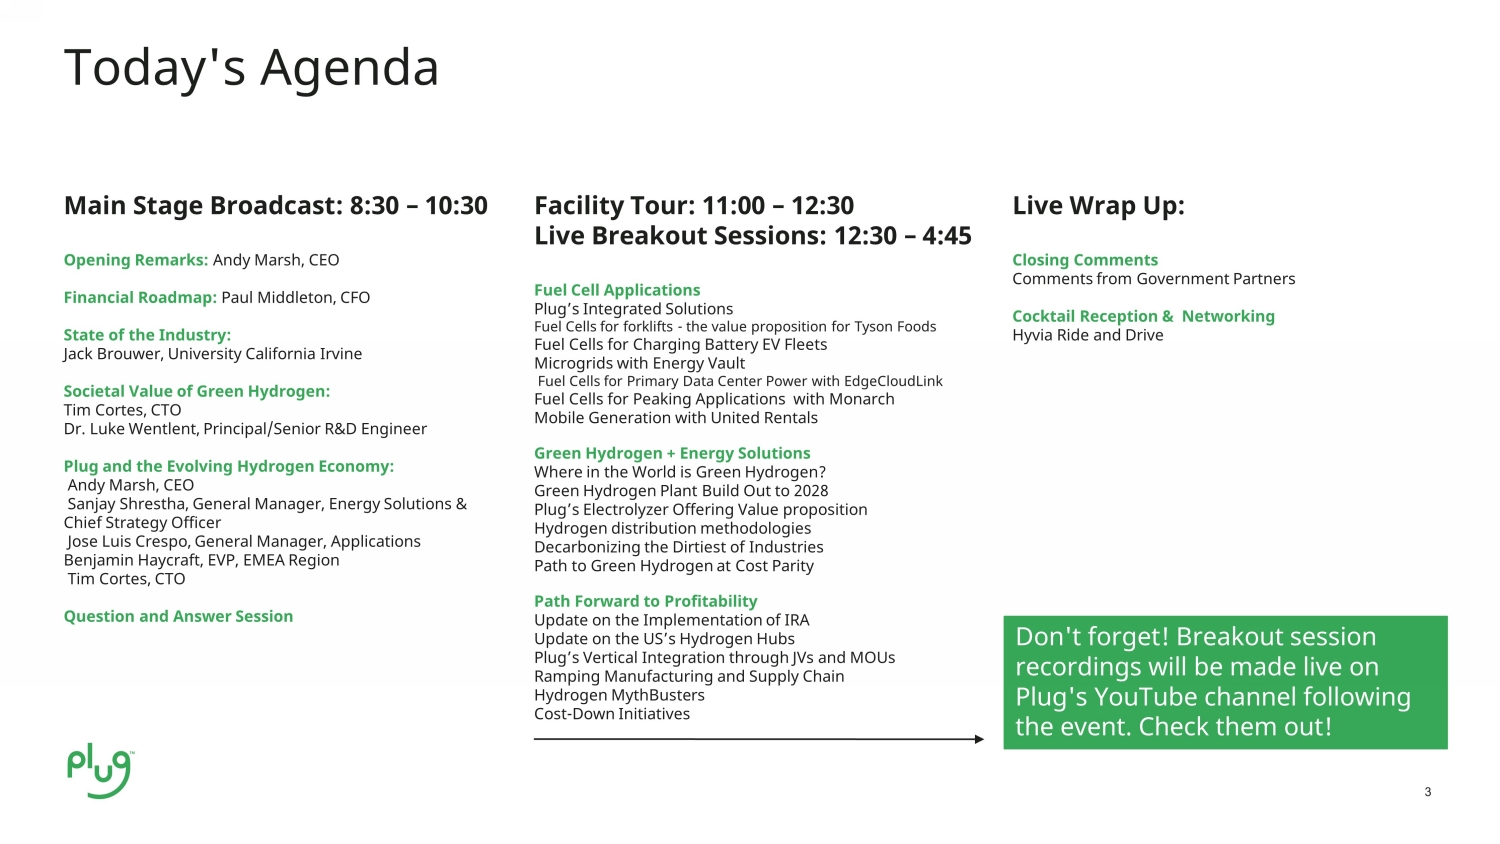
3 Main Stage Broadcast: 8:30 – 10:30 Opening Remarks: Andy Marsh, CEO Financial Roadmap: Paul Middleton, CFO State of the Industry: Jack Brouwer, University California Irvine Societal Value of Green Hydrogen: Tim Cortes, CTO Dr. Luke Wentlent , Principal/Senior R&D Engineer Plug and the Evolving Hydrogen Economy: Andy Marsh, CEO Sanjay Shrestha, General Manager, Energy Solutions & Chief Strategy Officer Jose Luis Crespo, General Manager, Applications Benjamin Haycraft, EVP, EMEA Region Tim Cortes, CTO Question and Answer Session Facility Tour: 11:00 – 12:30 Live Breakout Sessions: 12:30 – 4:45 Fuel Cell Applications Plug’s Integrated Solutions Fuel Cells for forklifts - the value proposition for Tyson Foods Fuel Cells for Charging Battery EV Fleets Microgrids with Energy Vault Fuel Cells for Primary Data Center Power with EdgeCloudLink Fuel Cells for Peaking Applications with Monarch Mobile Generation with United Rentals Green Hydrogen + Energy Solutions Where in the World is Green Hydrogen? Green Hydrogen Plant Build Out to 2028 Plug’s Electrolyzer Offering Value proposition Hydrogen distribution methodologies Decarbonizing the Dirtiest of Industries Path to Green Hydrogen at Cost Parity Path Forward to Profitability Update on the Implementation of IRA Update on the US’s Hydrogen Hubs Plug’s Vertical Integration through JVs and MOUs Ramping Manufacturing and Supply Chain Hydrogen MythBusters Cost - Down Initiatives Live Wrap Up: Closing Comments Comments from Government Partners Cocktail Reception & Networking Hyvia Ride and Drive Today's Agenda Don't forget! Breakout session recordings will be made live on Plug's YouTube channel following the event. Check them out!
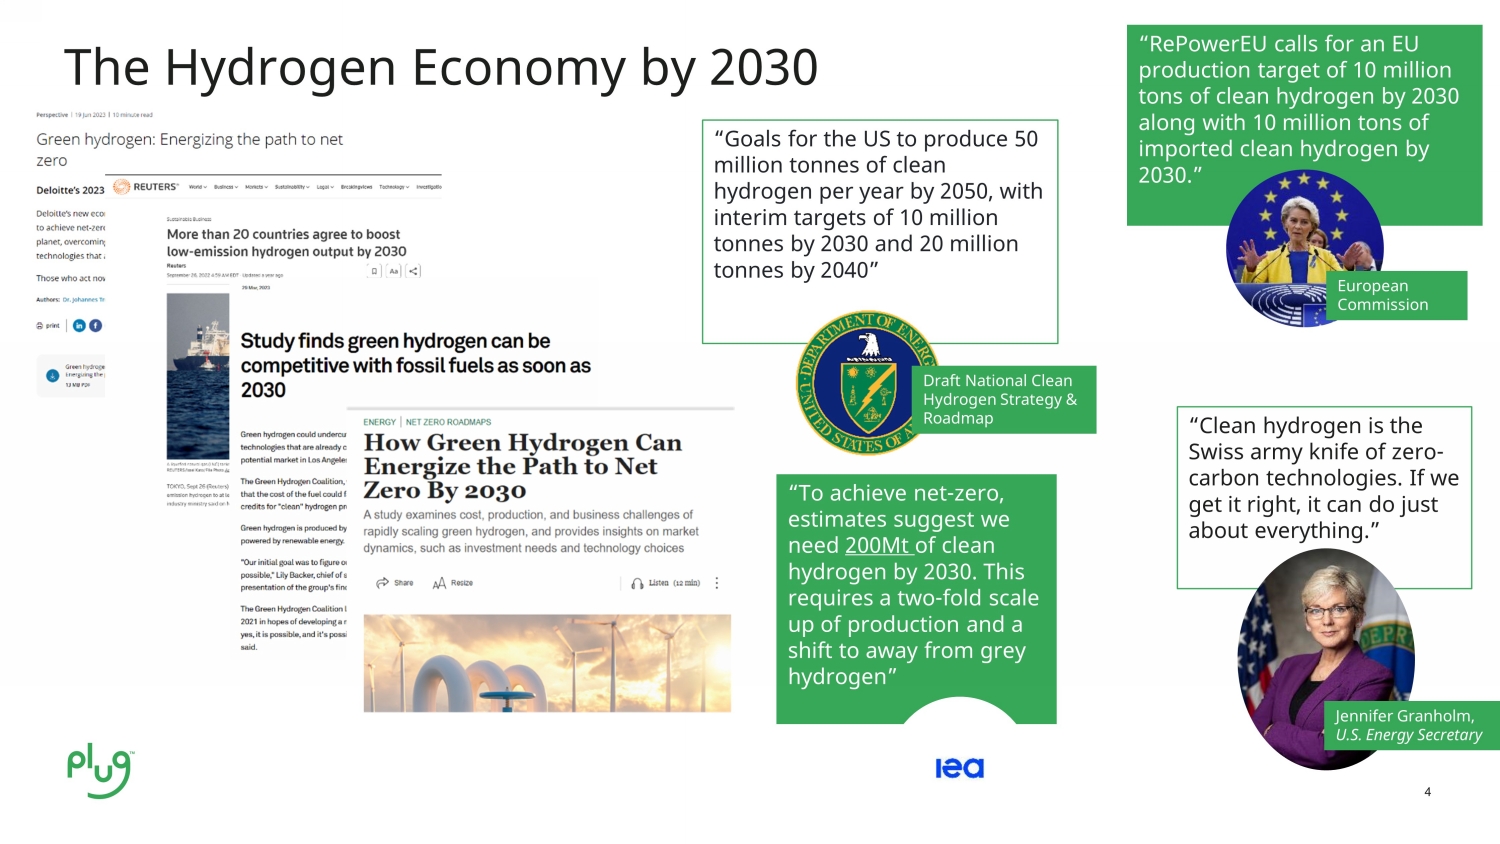
4 The Hydrogen Economy by 2030 “Clean hydrogen is the Swiss army knife of zero - carbon technologies. If we get it right, it can do just about everything.” “RePowerEU calls for an EU production target of 10 million tons of clean hydrogen by 2030 along with 10 million tons of imported clean hydrogen by 2030.” European Commission “G oals for the US to produce 50 million tonnes of clean hydrogen per year by 2050, with interim targets of 10 million tonnes by 2030 and 20 million tonnes by 2040” “To achieve net - zero, estimates suggest we need 200Mt of clean hydrogen by 2030. This requires a two - fold scale up of production and a shift to away from grey hydrogen” Draft National Clean Hydrogen Strategy & Roadmap Jennifer Granholm, U.S. Energy Secretary

5 The Plug Ecosystem

6 Plug has made the investments to capture the opportunity Production Plants 1MW Fuel Cell Power System LH 2 delivery network Renewable generation HyVia Van Hydrogen Infrastructure

7 Near Term Business Accelerators Regulations Business Expansion Margin Enhancement Non - dilutive Funding

8 Follow the law Key: Regionality The bigger the region, the better Inflation Reduction Act (IRA) Regulations

9 9 Business Expansion: Plug and Fortescue partnering to build out the Green Hydrogen Economy Both Plug and Fortescue share a common mission to build out and scale up a global green hydrogen ecosystem. Green hydrogen is critical to the decarbonization of hard - to - abate industries, such as long - haul transportation and heavy manufacturing of steel, chemicals, concrete and more. Plug is the preferred supplier for 550 MW PEM electrolyzer supply contract for Fortescue’s Gibson Island Project in Brisbane, Queensland, Australia MOU for supplying a range of capital equipment including electrolyzer , liquefier/other cryogenic equipment, and potential co - investments in US green hydrogen plants.
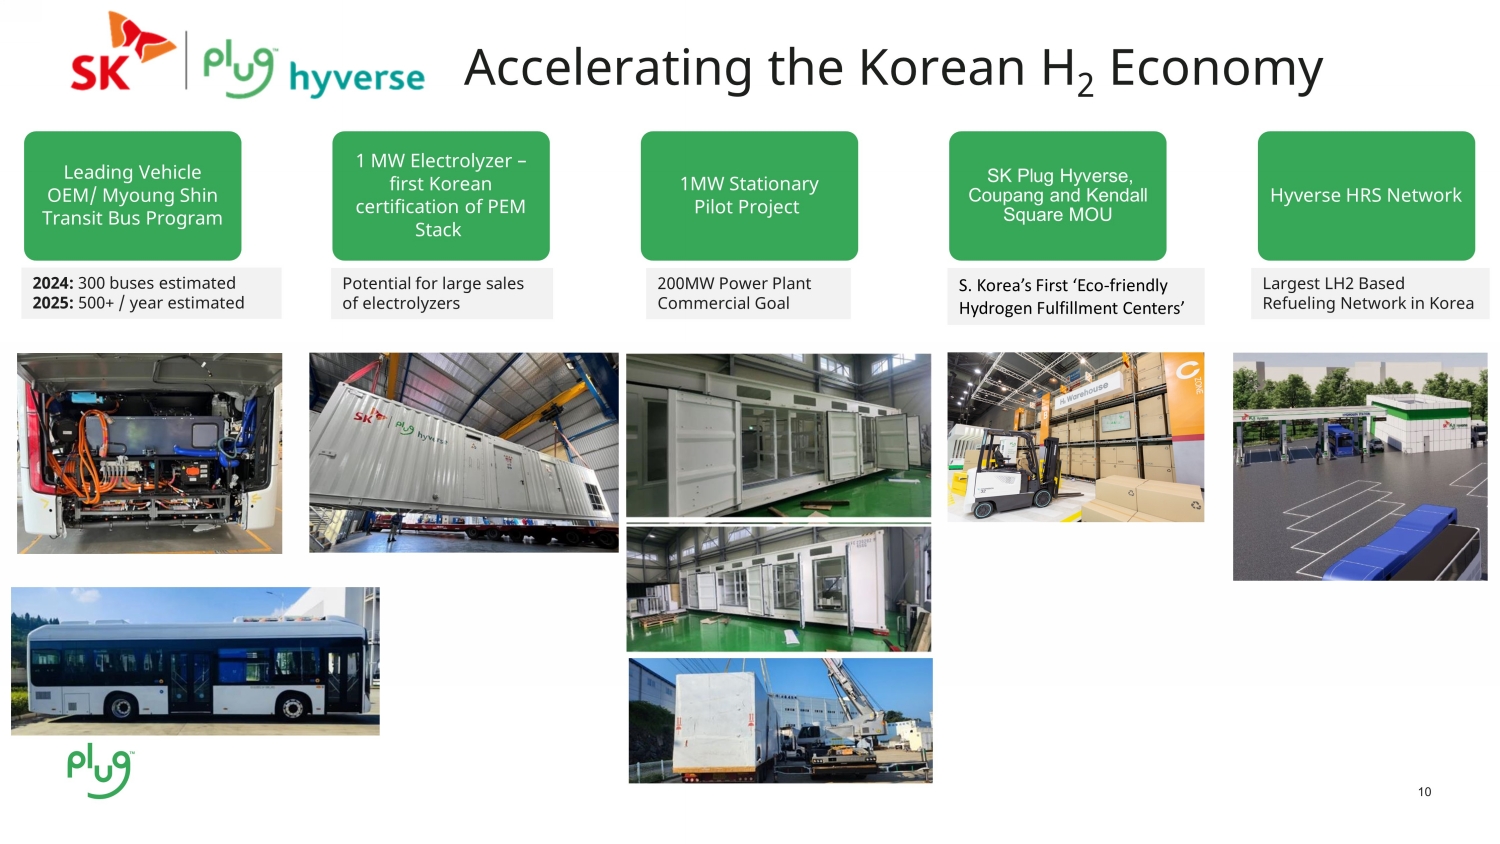
10 Leading Vehicle OEM/ Myoung Shin Transit Bus Program 1 MW Electrolyzer – first Korean certification of PEM Stack 1MW Stationary Pilot Project SK Plug Hyverse , Coupang and Kendall Square MOU Hyverse HRS Network Accelerating the Korean H 2 Economy 2024: 300 buses estimated 2025: 500+ / year estimated Potential for large sales of electrolyzers 200MW Power Plant Commercial Goal Largest LH2 Based Refueling Network in Korea S. Korea’s First ‘Eco - friendly Hydrogen Fulfillment Centers’
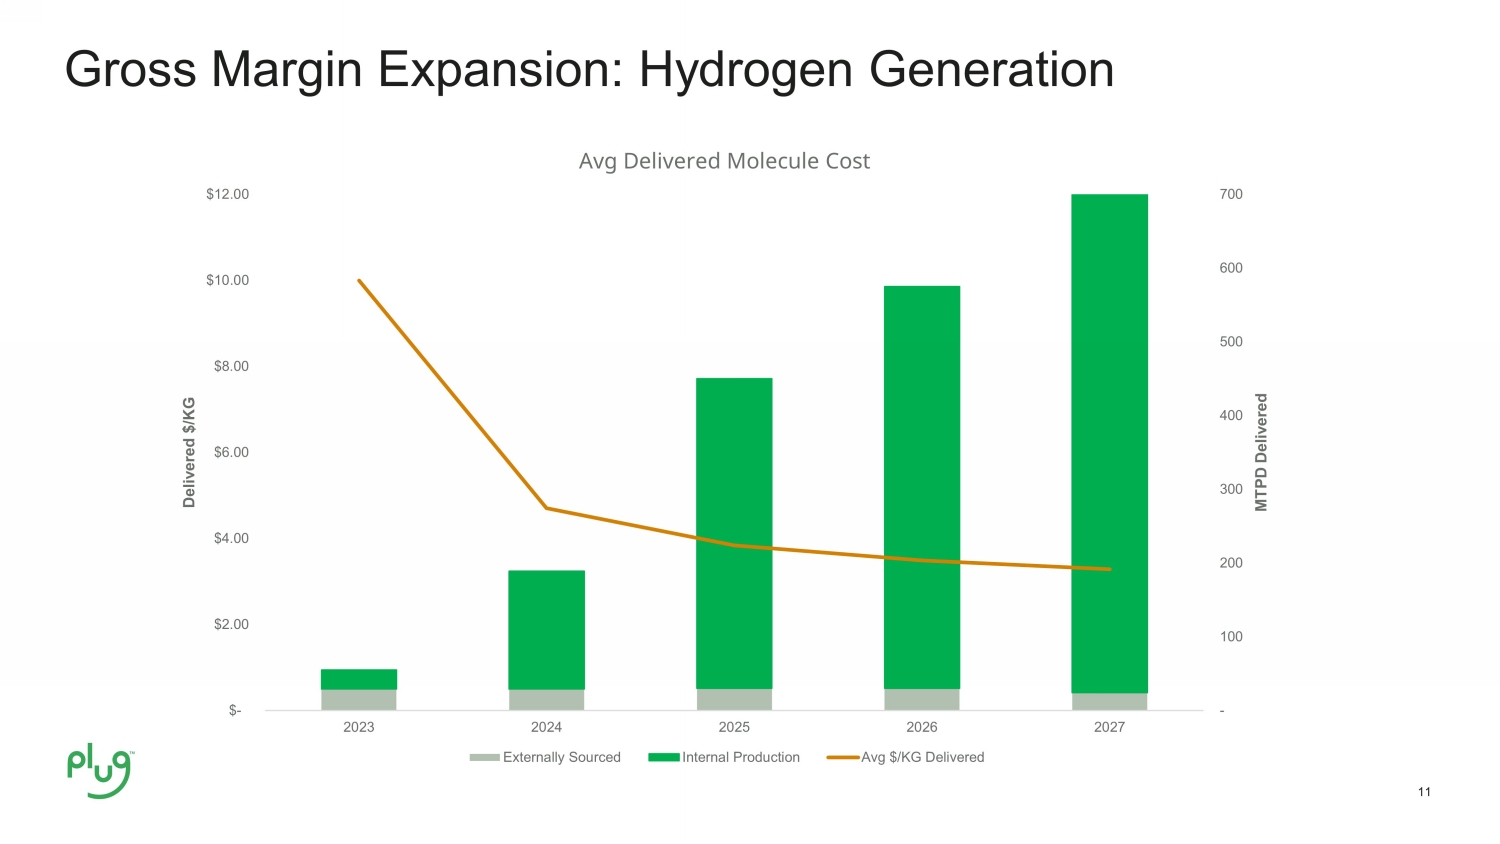
11 Gross Margin Expansion: Hydrogen Generation - 100 200 300 400 500 600 700 $- $2.00 $4.00 $6.00 $8.00 $10.00 $12.00 2023 2024 2025 2026 2027 MTPD Delivered Delivered $/KG Avg Delivered Molecule Cost Externally Sourced Internal Production Avg $/KG Delivered

WHY WE BELIEVE From 2020 to now… let’s look

13 ~3 Years and 150 Times More Power Class 1 10KW system 1MW Fuel Cell System Fuel Cell Products 2020 Today

14 ~3 Years and 1,900% More Capacity Manufacturing Capacity 2020 Today 50,000 Square feet Nearly 1M Square feet

15 Hydrogen Production Plants 2020 Today Operational Tennessee – 10TPD Final Commissioning Georgia – 15TPD Under Construction Louisiana – 15TPD Texas – 45TPD New York – 74TPD Under Development Antwerp – 35TPD Finland – 3 sites - 85TPD H2 + 70 kt ammonia - 2 mt DRI/HBI/100TPD H2 Denmark – 1 site France – 400TPD

16 Plug is the Global Green Hydrogen Leader We have a huge market opportunity We have unmatched market knowledge We have unmatched products We have unmatched infrastructure We have unmatched customer validation We have a clear vision of the future


Copyright 2023, Plug Power Inc. Plug Symposium Financial Roadmap Paul Middleton, CFO October 11, 2023

2 2023 ~$1.2B 2027 ~$6B 2030 ~$20B

3 Strong Differentiated Platform Broad foundation of technologies Deep relationships New investments Strong cost discipline

4 Electrolyzer Stationary power On - road Green hydrogen Material handling 2023 Revenue Outlook ~$1.2B 27% 73% 2nd Half ‘23 ~$730M Q3 Q4 45% 55% 1st Half ‘23 ~$470M Q1 Q2

5 5 2027 Forecast Rev ~$6B GM% ~32% 2030 Forecast Rev ~$20B GM% ~35% Strategic Forecast

6 6 ~ $1.20 B ~ $6 B ~ $20 B ~ $1.75 B ~ $5 B 2023 2027 2030 Plug Power, Inc. Non-consolidated JVs CAGR ~50% Hydrogen Investment Accelerating Revenue Growth (forecast in billions)

7 Revenue Roadmap Revenue Forecast Roadmap 2023 2027 2030

8 8 Projected Revenue by Region

9 2030 Target business model >35% gross margin ~13% OPEX leverage Continue innovation Vertical integration Supply chain leverage Policy OPEX leveraging

10 Equipment Improvements Fuel Improvements Service Improvements

11

12 Debt & Project Capital Solutions Corporate Debt Solutions Project Finance Project Equity Partners DOE Loan Program

13 2023 ~$1.2B 2027 ~$6B 2030 ~$20B


Copyright 2023, Plug Power Inc. Plug Symposium The Societal Value of Green Hydrogen Tim Cortes, CTO Dr. Luke Wentlent, Principal R&D Engineer In collaboration with Dr. Robert Flores and Dr. Jeffrey Reed, University of California, Irvine October 11, 2023

Given the significant market demand outpacing the scale up of hydrogen generation projects, there will be a limited amount of green hydrogen available to be deployed over the next 5 to 10 years.

3 Green Hydrogen Until the green hydrogen economy reaches maturity, there will be a limited supply available. During this maturation process, most large, hard - to - abate industries are expected to consume significant percentages of the green hydrogen produced, if not all of it. What is the best way to deploy green hydrogen? Market Potential? GHG abatement? Locality? Technology readiness? What is the societal value of green hydrogen in various applications? applications? Source: National Hydrogen Strategy & Roadmap (https://www.hydrogen.energy.gov/docs/hydrogenprogramlibraries/pdfs/us - national - cl ean - hydrogen - strategy - roadmap.pdf), DOE’s Pathways to Commercial Liftoff report, Hydrogen Council Global Hydrogen Flows report

4 Societal Value of Green Hydrogen The value of various decarbonization technologies can be quantified and the value to society calculated. Context In today’s market, green hydrogen is generally cheaper than fossil fuel when the environmental damage costs are considered. Various impact factors can be used to quantify and monetize the impact of different technologies and decarbonization methods. There are a variety of well - established methods to conduct a life cycle analysis and quantify impacts 1 . [1] Rosenbaum, R. K., Hauschild, M. Z., Boulay, A. M., Fantke , P., Laurent, A., Núñez, M., & Vieira, M. (2018). Life cycle impact assessment. In Life cycle assessment (pp. 167 - 270). Springer, Cham. International Life Cycle Data System used to define the LCA inputs and methodology (https://pre - sustainability.com/articles/the - normalisation - step - in - lcia/) EcoInvent LCI Database utilized (https://www.openlca.org/lca - data/)

5 Societal Value of Green Hydrogen The value of various decarbonization technologies can be quantified and the value to society calculated. Preliminary Assessment A PEM Fuel Cell Class 8 truck has a societal benefit of ~$12.31 per kg of H 2 deployed when compared to diesel. We looked at the cumulative life cycle impact of the incumbent technologies (i.e., diesel) as well as various decarbonization options.
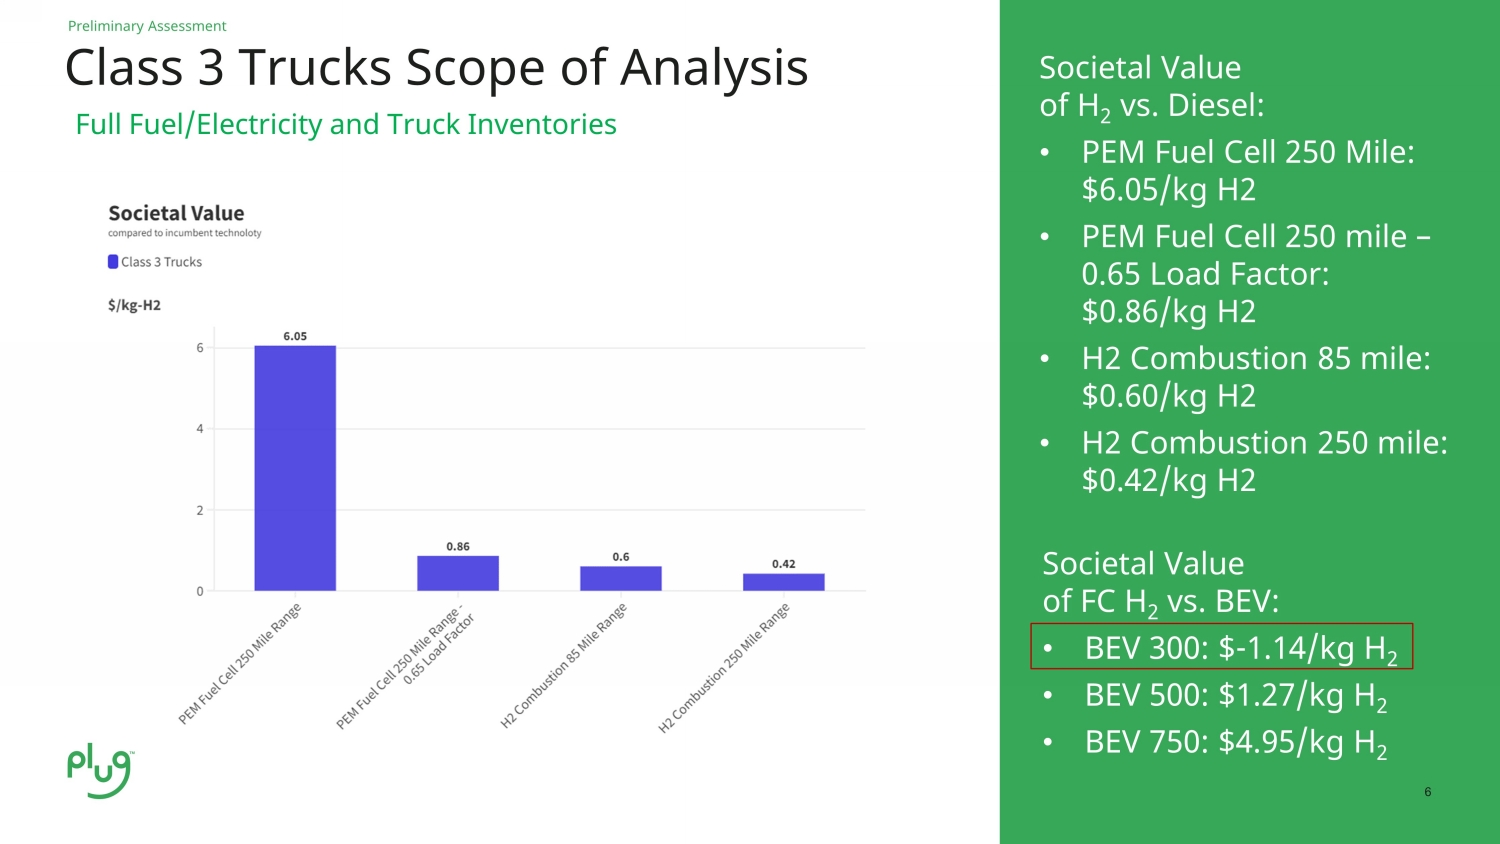
6 6 Class 3 Trucks Scope of Analysis Full Fuel/Electricity and Truck Inventories Societal Value of H 2 vs. Diesel: • PEM Fuel Cell 250 Mile: $6.05/kg H2 • PEM Fuel Cell 250 mile – 0.65 Load Factor: $0.86/kg H2 • H2 Combustion 85 mile: $0.60/kg H2 • H2 Combustion 250 mile: $0.42/kg H2 Societal Value of FC H 2 vs. BEV: • BEV 300: $ - 1.14/kg H 2 • BEV 500: $1.27/kg H 2 • BEV 750: $4.95/kg H 2 Preliminary Assessment

7 7 Hard - to - Abate Sectors: Societal Value Societal Value of the referenced technology vs the incumbent. In most applications, there is a large societal value of deploying green hydrogen. However, in some areas it can make an outsized impact. Plug is doing the work to carefully understand where, how, and when we should deploy green hydrogen to not only grow the business but have the biggest benefit to society. Preliminary Assessment


Copyright 2023, Plug Power Inc. Plug Symposium Breakout Room Ready Now: Integrated Hydrogen Solutions Preeti Pande , CMO Don Govel , Director of Market Strategy October 11, 2023

2 The Hydrogen End - to - End Integrated Solution Only from Plug MOLECULES DELIVERY SERVICE Support through every step of the ecosystem DEVICES STORAGE & DISPENSING

3 Pre 2013 2014 - 2019 2020 - Present Industry Contracts 3 rd Party Industry Contracts + MOLECULES DELIVERY DEVICES STORAGE & DISPENSING + + 3 rd Party 3 rd Party 3 rd Party

4 The Customer Voice Clear impact on customer operations “We move 40% more volume during a nine - hour shift with fuel cells than we did with batteries” Operations Manager, Refrigerated Warehouse “I could feel the difference just from driving the lift to the refueling station for the first time. I’ll tell you how it does in the morning... It did great” Forklift Operator, Food and Beverage “There has been an overall increase in employee job satisfaction. Right now, we have a mixed fleet of hydrogen fuel cells and lead - acid batteries, and employees literally rush to get to the Plug units before they are claimed by others” Operations Manager, Grocery Chain

5 Liquid Hydrogen Storage LH 2 Truck Loading Locally Stored Hydrogen LH 2 Tankers Hydrogen Generation Hydrogen Liquefaction Hydrogen Processing Dispense Hydrogen Use Hydrogen Plug’s Green Hydrogen Ecosystem

6 < 5 kg per day 15 – 45 kW PEM FUEL CELL STACK < 5 kW 3 – 10 kW 30 – 85 kW 85 - 250 kW 1MW – 50MW+ 500 – 5000 kg per day 15 – 60 tons per day Giga scale PEM ELECTROLYZER STACK Broad and Strong Technology Foundation

7 Logistics

8 HYDROGEN SUPPLY (5 Years) Hydrogen Supply HYVIA TRUCKS BACK - UP POWER BACK - UP POWER Microgrids (1 MW – 50 MW)

9 HYDROGEN SUPPLY (5 Years) Hydrogen Supply HYVIA TRUCKS BACK - UP POWER BACK - UP POWER Maritime Ports

10 Plug Growth One - stop - shop Integrated Solutions is Plug strategy Strong partnerships Core technology and hydrogen on - site key to making integrated solutions a reality Expandable Platform Leveraging hydrogen infrastructure for deeper decarbonization Catalyzing the Hydrogen Economy Building the market for hydrogen starts at Plug Dreaming Big!


Copyright 2023, Plug Power Inc. Plug Symposium Breakout Room: Tyson Customer Case Study - Fuel cells for forklifts - expanding the value proposition Tyson and Plug Partnership Jose Luis Crespo, General Manager, Applications, Plug Tim Terrill, VP, Sales & Logistics, P lug Matthew Portugal, Automation Engineer III, Distribution and Warehousing, Tyson Foods October 11, 2023

2 Join us on a journey to explore how Tyson and Plug have come together to revolutionize logistics while championing sustainability. Transforming Logistics for a Sustainable Future Tyson and Plug Partnership

3

4 From a Conversation to Commitment The Genesis of Partnership Matt Portugal , continuous improvement leader at Tyson Foods and a key catalyst for change, was looking to solve high value productivity and sustainability challenges at Tyson Foods (Matt’s brother - in - law made the introduction to Plug) It all started on September 7, 2022 , via video conference call with Plug Matt and Tyson Foods saw a potential for positive change – “Our journey started with a conversation, but it is transforming the future.”

5 Pioneering Success: Driving Productivity, Reducing Carbon Footprint How - Tyson Foods and Plug agreed on a month - long pilot and selected a Pilot site Where - Plug converted 4 battery powered forklifts to fuel cells at Tyson’s Pottsville, PA facility Results – Overwhelmingly positive business case • 13 - 15% productivity gain • 17M lbs. estimated Carbon footprint reduction across Tyson’s sites annually • 50,000 annual labor hours estimated to be saved across 8 sites

6 • Tyson’s speed of decision to roll out fuel cells to multi - site • Leveraging Plug’s hydrogen product offering and project management expertise Together, we are shaping a sustainable future Shaping the Future: Expanding Horizons and Sustainability Goals


Copyright 2023, Plug Power Inc. Plug Symposium Breakout Room: Fuel Cells for Charging Battery Electric Vehicle Fleets Jose Luis Crespo, General Manager, Applications Deepesh Goyal, VP and Amazon Account Executive October 11, 2023

2 Large commercial fleets have committed to EV adoption as part of Net Zero targets

3 Fleet EV Charging Up to 1:1 ratio of EV chargers to vehicles required for commercial fleets Typically 20kW - 50kW each for LCV’s, 150kW+ for HD vehicles. An EV charger pulls current from an outlet or the grid and delivers that electricity to the vehicle. Chargers can range from 5kW to 350kW 1 – 5 MW of additional power for site driving need for expensive distribution transformer upgrades, feeders, service panel upgrades, etc. 1MW = ~800 US homes
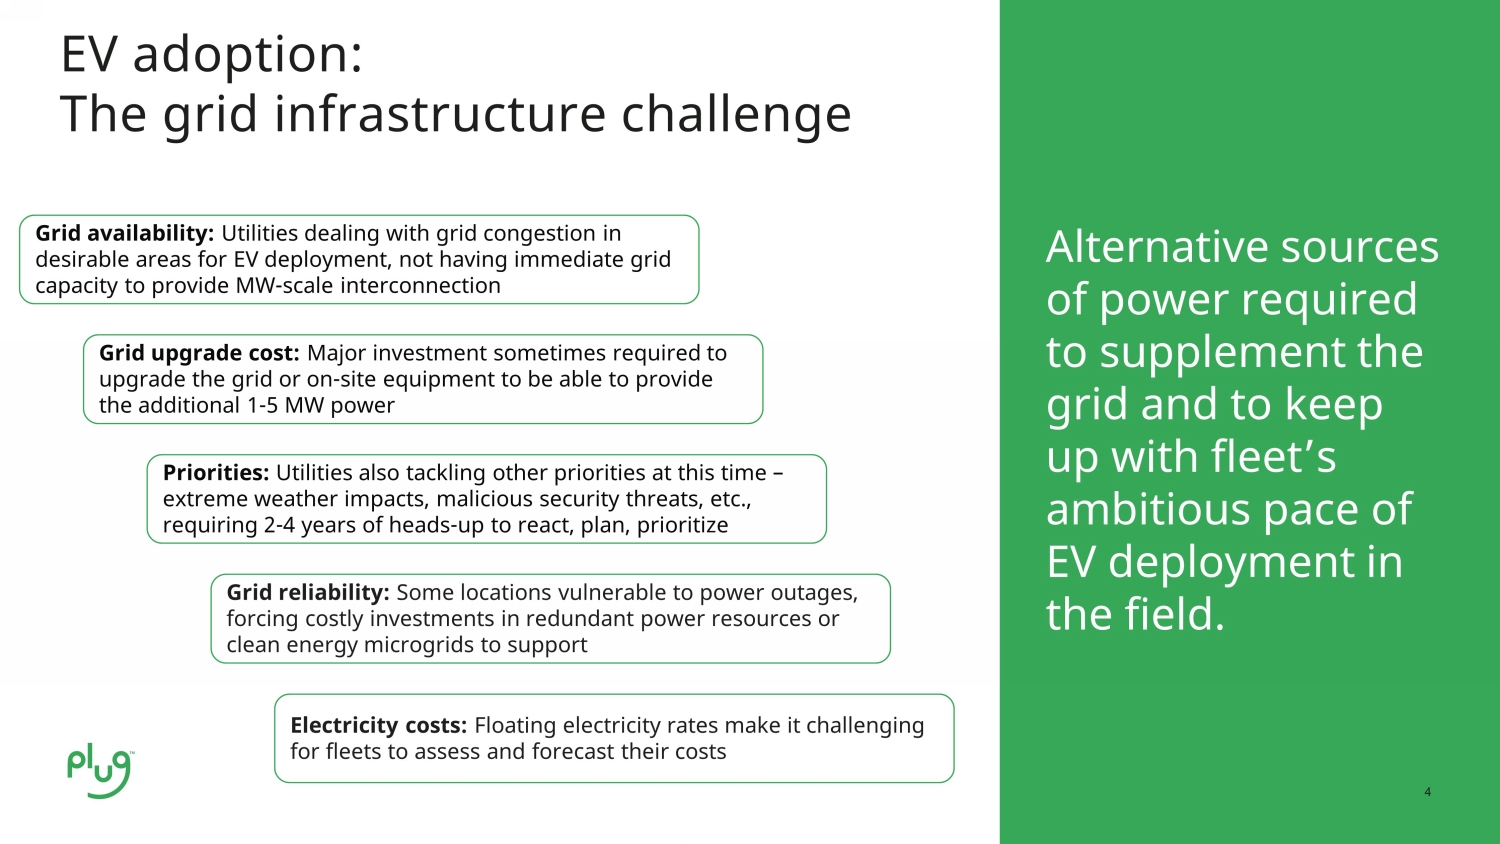
4 4 EV adoption: The grid infrastructure challenge Grid availability: Utilities dealing with grid congestion in desirable areas for EV deployment, not having immediate grid capacity to provide MW - scale interconnection Grid upgrade cost: Major investment sometimes required to upgrade the grid or on - site equipment to be able to provide the additional 1 - 5 MW power Priorities: Utilities also tackling other priorities at this time – extreme weather impacts, malicious security threats, etc., requiring 2 - 4 years of heads - up to react, plan, prioritize Grid reliability: Some locations vulnerable to power outages, forcing costly investments in redundant power resources or clean energy microgrids to support Electricity costs: Floating electricity rates make it challenging for fleets to assess and forecast their costs Alternative sources of power required to supplement the grid and to keep up with fleet’s ambitious pace of EV deployment in the field.

5 GenSure HP Systems


Copyright 2023, Plug Power Inc. Plug Symposium Breakout Room: United Rentals and Plug Mobile Generation Jose Luis Crespo, General Manager, Applications, Plug Rick Mason, VP, Product and Program Management, P lug Dan Gribbel , Sales and Marketing Director, United Rentals October 11, 2023
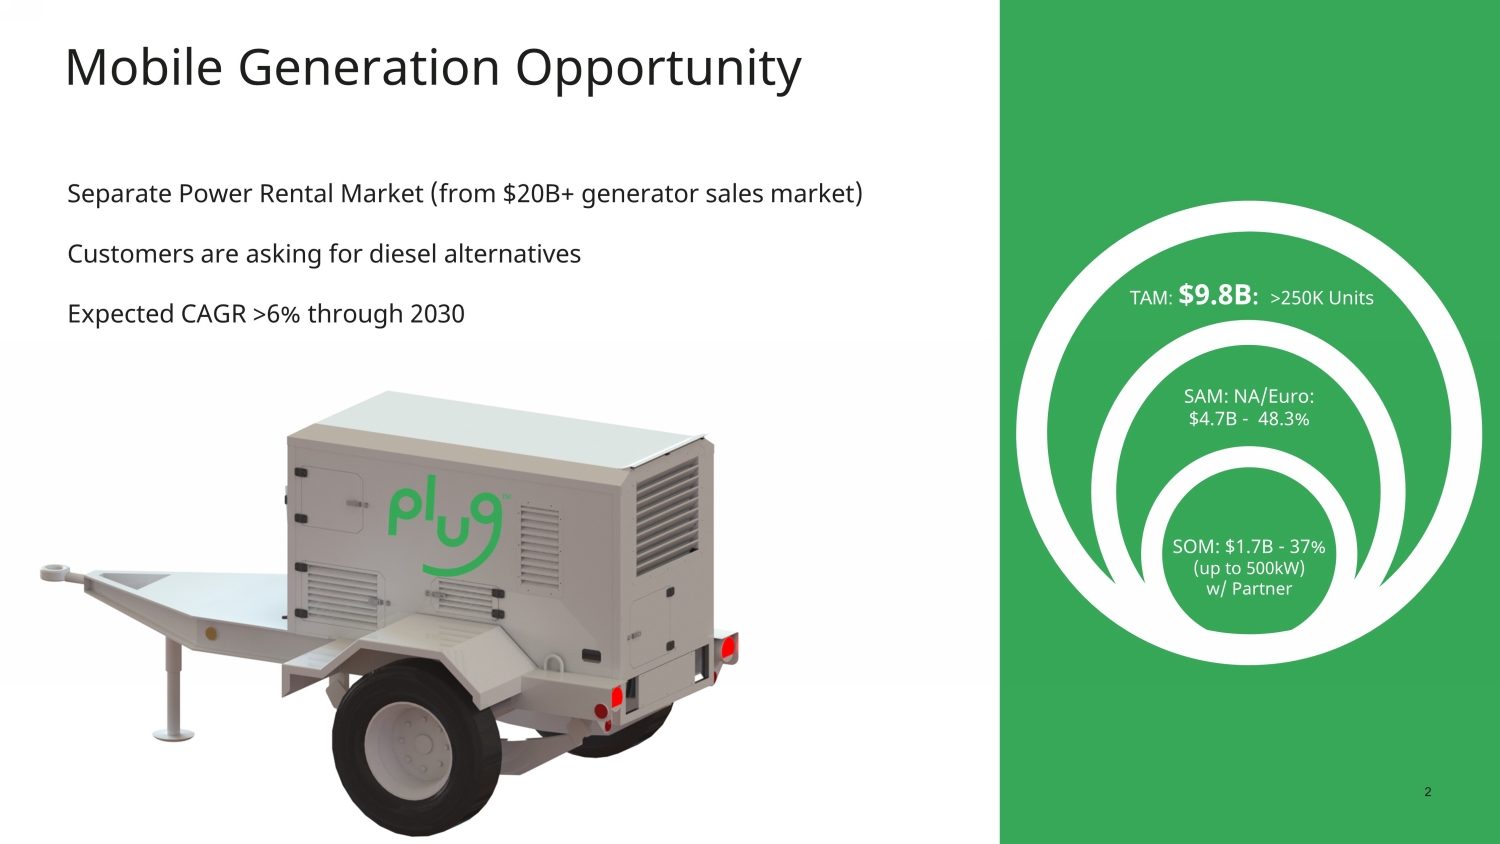
2 2 Separate Power Rental Market (from $20B+ generator sales market) Customers are asking for diesel alternatives Expected CAGR >6% through 2030 Mobile Generation Opportunity TAM: $9.8B : >250K Units SAM: NA/Euro: $4.7B - 48.3% SOM: $1.7B - 37% (up to 500kW) w/ Partner

3 Company Overview United Rentals is the North American equipment rental leader #1 Market Share (1) • 2021 total revenue $9.72 billion (+13.9% Y/Y) • 2021 adjusted EBITDA (2) $4.41 billion (+12.3% Y/Y; 45.4% margin) 1,331 locations across North America (3) • 1,188 branches in the U.S.; locations in 49 of 50 states • 143 branches in Canada; locations in all 10 provinces • 13 European branches in France, Germany, the United Kingdom, the Netherlands and Belgium • 28 branches in Australia • 18 branches in New Zealand $16.6B of fleet comprised of 845,000 units (4) Highly diversified product and end - market mix Team of approximately 21,600 employees (5) Other 71% United Rentals 15%

4 United Rentals Branch locations Largest, broadest and most diverse footprint in North America North American branch count 1,331 (1) • General Rentals: 861 locations • Specialty: 470 locations (2) Largest U.S. states by number of locations (1) • Texas: 164 • California: 117 • Florida: 80 • Louisiana: 51 • Georgia: 47

5 Core values provide the foundation of our culture Building a better future is our commitment to the people and communities we serve Visible Leadership Lead by example in every business decision and action, with a sense of humility and responsibility. A Passion for People Build a diverse workplace that challenges all employees to grow professionally and embrace teamwork. Customer - Driven Support the best interests of our customers and develop better ways for them to succeed at their jobs. Sustainability Engage in practices that lead to positive change by encouraging social accountability and environmental responsibility. Continuous Innovation Contribute to a culture of innovative thinking that empowers employees to improve quality, efficiency and customer service. Community - Minded Be an outstanding corporate citizen and a good neighbor in every sense by being helpful, respectful, law - abiding and friendly. Safety First Act, and require others to act, in a manner that puts the safety of our employees, customers and communities first. Absolute Integrity Always do the right thing, honor commitments and ensure appropriate corporate governance.
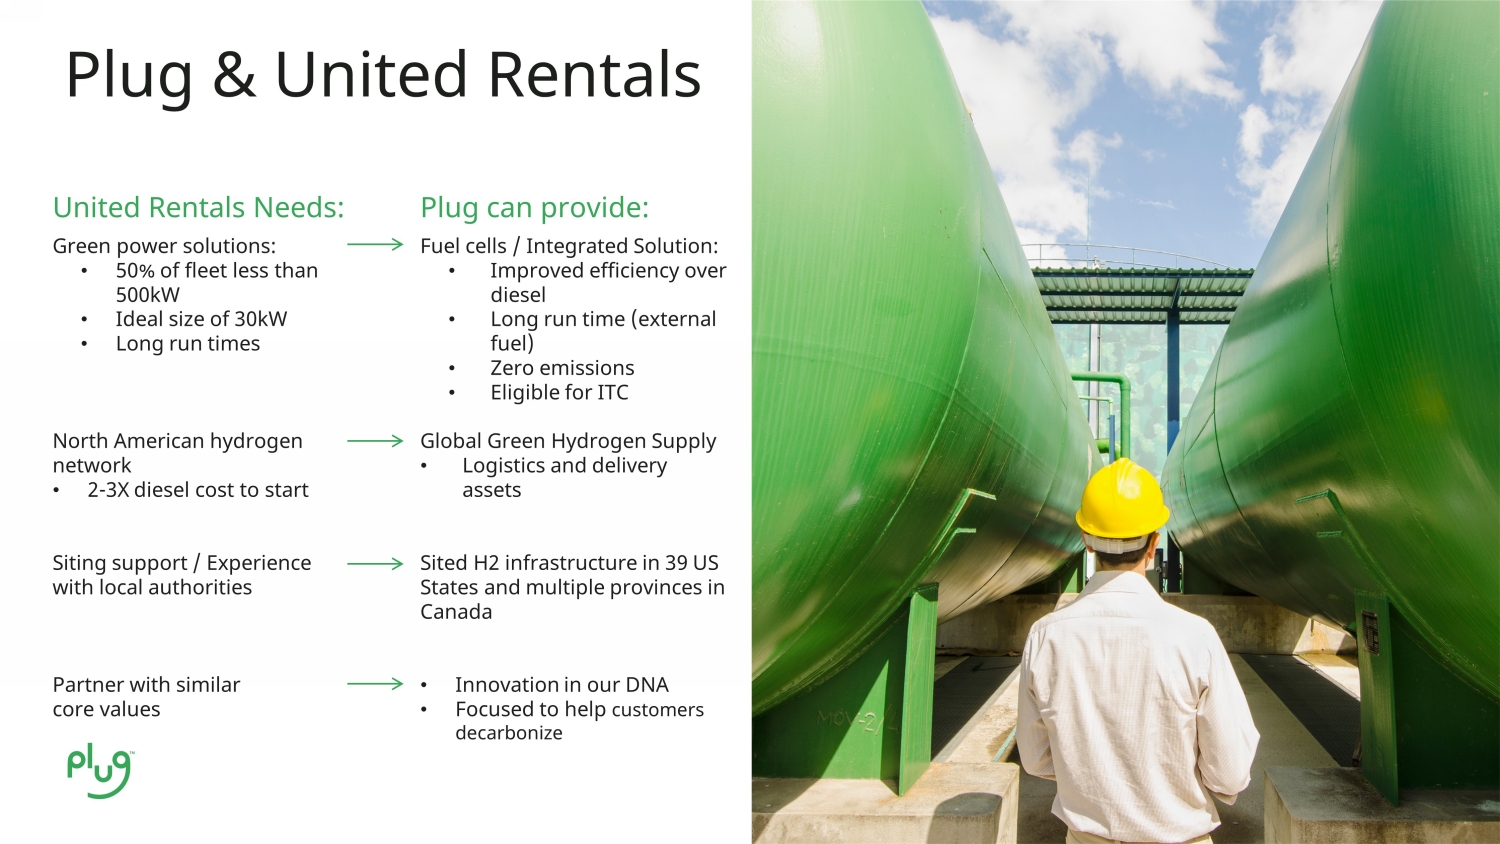
6 United Rentals Needs: Green power solutions: • 50% of fleet less than 500kW • Ideal size of 30kW • Long run times North American hydrogen network • 2 - 3X diesel cost to start Siting support / Experience with local authorities Partner with similar core values Plug can provide: Fuel cells / Integrated Solution: • Improved efficiency over diesel • Long run time (external fuel) • Zero emissions • Eligible for ITC Global Green Hydrogen Supply • Logistics and delivery assets Sited H2 infrastructure in 39 US States and multiple provinces in Canada • Innovation in our DNA • Focused to help customers decarbonize Plug & United Rentals

7 Targeting ~200 miles from Woodbine, GA Targeting 30kW Genset Prototype by YE 2023 Hydrogen Storage Options: • 150kg Single Pod (~10ft / >2.25MWh) • Large HPTT up to 800kg (>12MWh) Planned Initial Launch Future expansion to Texas, Louisiana, New York


Copyright 2023, Plug Power Inc. Plug Symposium Breakout Room: ECL Customer Case Study Fuel Cells for Primary Data Center Power Jose Luis Crespo, General Manager, Applications, Plug Darin Painter, VP, Stationary Sales Yuval Bachar, CEO, EdgeCloudLink October 11, 2023

DISCLAIMER Forward - looking Statements These materials contain forward - looking statements that are based on our management’s beliefs, assumptions and expectations, and on information currently available to our management . Generally, you can identify forward - looking statements by terms such as “may,” “will,” “should,” “could,” “would,” “expects,” “plans,” “anticipates,” “believes,” “estimates,” “projects,” “predicts,” “potential” and similar expressions intended to identify forward - looking statements, which generally are not historical in nature . All statements that address operating performance, events or developments that we expect or anticipate will occur in the future are forward - looking statements, including without limitation, our expectations regarding (a) the potential size of our target markets and our ability to access them ; (b) our capital requirements ; (c) functionality and performance of our existing and proposed products and services ; and (d) our cost structure ; and (e) other statements which are forward - looking or predictive in nature . The forward - looking statements reflect our management’s current view about future events and are subject to risks, uncertainties and assumptions. Accordingly, you should not place undue reliance on our forward - looking statements. We do not assume any obligation to update or revise any forward - looking statements, whether as a result of new information, future events or otherwise. We may not actually achieve the plans , p rojections or expectations disclosed in our forward - looking statements, and actual results, developments or events could differ materially fro m those disclosed in the forward - looking statements. Forward - looking statements are subject to a number of risks and uncertainties. For example, the fo llowing important factors could prevent us from achieving our goals, and cause the assumptions underlying the forward - looking statements and our a ctual results to differ materially from those expressed in or implied by those forward looking statements: (a) inability to fund ongoing operations, inc luding raising additional capital to support our research and development and our further growth; (b) inability to recruit, retain and motivate appropr iat ely qualified employees; (c) unsatisfactory or uncompetitive outcomes for our services; (d) legislative or regulatory developments in the jurisdiction s i n which we do business; or (e) lack of market acceptance of our services or greater relative market acceptance of the services of our competitors. The for egoing list is representative, but not complete or exhaustive; other factors known and unknown, expected and unexpected, may have an impact on our actual results as well.
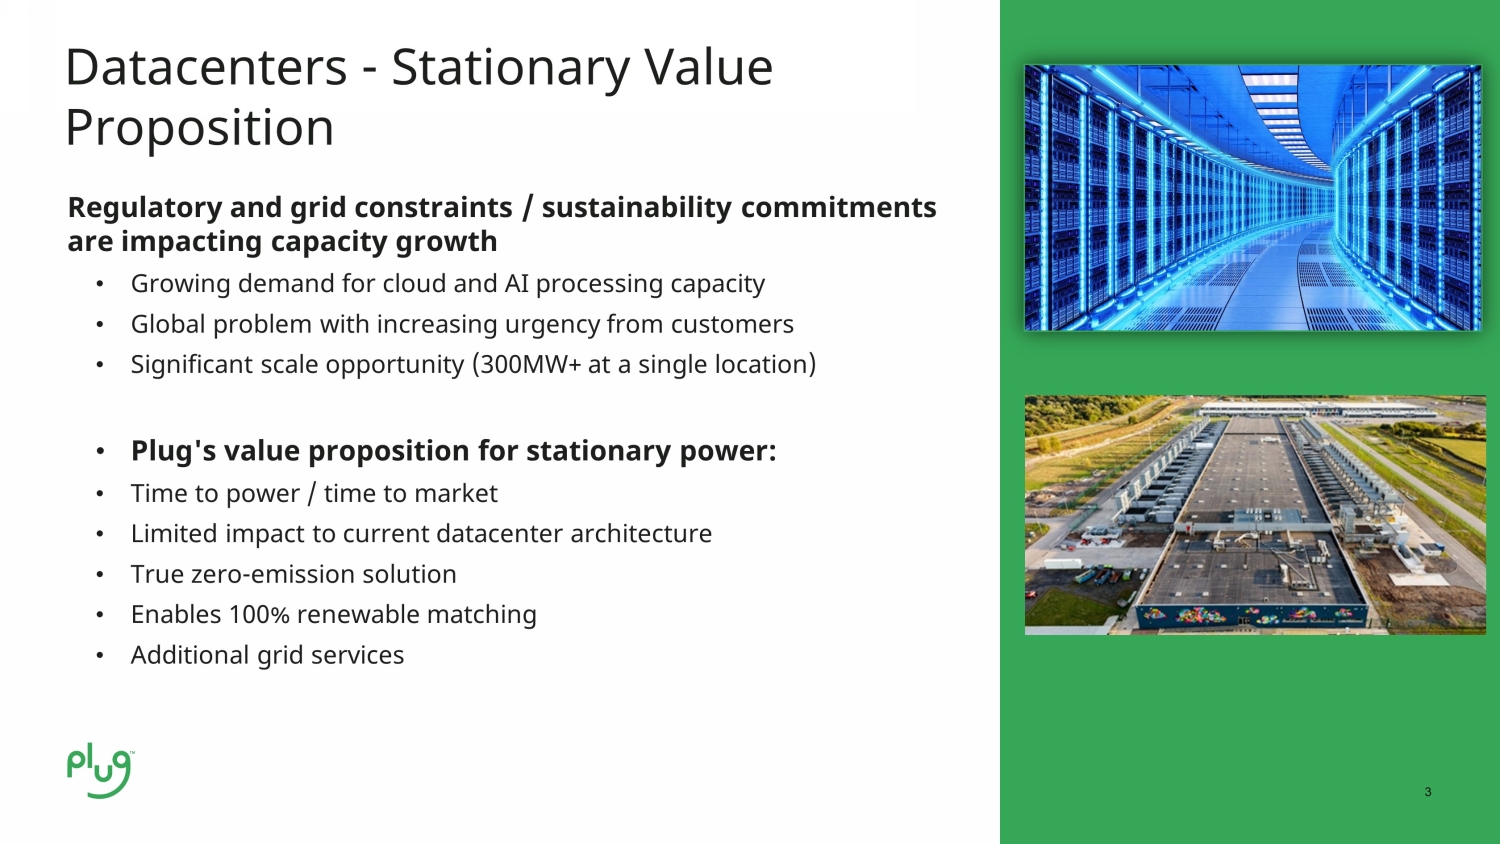
3 3 Regulatory and grid constraints / sustainability commitments are impacting capacity growth • Growing demand for cloud and AI processing capacity • Global problem with increasing urgency from customers • Significant scale opportunity (300MW+ at a single location) • Plug's value proposition for stationary power: • Time to power / time to market • Limited impact to current datacenter architecture • True zero - emission solution • Enables 100% renewable matching • Additional grid services Datacenters - Stationary Value Proposition

BLUE SKY For Data Center Environmentalists Zero Emission Zero Water Use No Greenwashing Optimal Efficiency (PUE) Circular Economy Zero Waste Construction ECL Data Center Solution Community Integration • Zero Emission • Zero Water Use • 100% Green Power • High Efficiency - PUE 1.05 • No Diesel Generators • Minimal Noise • Sustainable waste - free construction • Community Integration • Minimal carbon footprint • REAL GREEN

T he ECL Product Fully - sustainable Data Center as a Service for private colocation or on - prem applications

CHANGING THE DATA CENTER ECONOMY Typical ECL data center power • 10MW of IT load • 24/7/365 operations • 15TPD Hydrogen consumption ECL Projections

Copyright 2023, Plug Power Inc. PLUG Symposium Breakout Room: Emerging Grid Applications - Microgrids and Peaker Plants Jose Luis Crespo, General Manager, Applications, Plug Darin Painter, VP, Stationary Sales, P lug Kevin Kopczynski, VP, Strategy and M&A, Plug Craig Horne, Vice President, Advanced Energy Storage, Energy Vault Kevin Boudreaux, Head of Power Supply, Monarch Energy October 11, 2023

2 Increased fire risk is requiring transmission line shutdowns • Camp fire in CA and Lahaina fire have resulted in increased focus on PSPS / utility liability • Initial PG&E PSPS implementations have relied on rental diesel with significant CARB pushback • Batteries do not scale to durations required (days, not hours) Plug value proposition • Long - duration • True zero emissions • Grid services • Fast start up Fire Safety Transmission Line Shutdowns Customer: PG&E MW: 8.5 peaking Duration 48 up to 96 hours COD: targeting June 2024 Energy Vault selects Plug Power to Supply 8 MW of Hydrogen Fuel Cells as part of hybrid microgrid backup system for PG&E and the city of Calistoga

3 3 California State Auditor - https://www.auditor.ca.gov/pdfs/reports/2021 - 117.pdf https://mauinow.com/2023/08/28/hawaiian - electric - responds - to - lawsuit - filed - by - county - of - maui - over - lahaina - fire/ https://www.mauicounty.gov/CivicAlerts.aspx?AID=12759#:~:text=The%20la wsuit%20alleges%20that%20the,and%20brush%2C%20causing%20the%20fir es. Source – EPA - https://www.epa.gov/climate - indicators/climate - change - indicators - wildfires#:~:text=The%20extent%20of%20area%20burned,2015%20(see%20Fig ure%202) Increasing Wildfire and Grid Impact According to CA Public Utilities Commission (CPUC) Data, there were 3,550 Utility - Caused Fire Incidents Reported by the Three Largest Utilities in CA from 2015 through 2020

4 Quantifying the Wildfire Power Problem Population Density The data shows that: - The U.S. has 1,160 GW of Generation - At 333.3 Million People, we build 3.48 kW per person - On a given day (9/3/23) ~14% of the population was in a fire danger zone with >2% 7 day spread probability This means 159,522 MW of power moves through transmission lines in high fire danger zones to get to the people who need it (really more given that electricity moves through dangers zones to reach people in safer zones…) U.S. Generation Capacity Fire Danger https://www.eia.gov/energyexplained/electricity/electricity - in - the - us - generation - capacity - and - sales.php https ://en.m.wikipedia.org/wiki/File:US_population_map.png https ://firedanger.cr.usgs.gov/apps/staticmaps

Fuel Cells for Peaking Applications

6 Source: PJM Learning Center - How PJM Schedules Generation to Meet Demand EIA – Annual Energy Outlook 2023: Release Presentation What is a Peaker Plant? Example Dispatch Day US Electricity Generation & Standard Future Projection by Fuel Type 2 billion kilowatt - hours

7 UPS Power Quality T&D Grid Support Load Shifting Bulk Power Mgt seconds minutes hours Discharge Time at Rated Power 10kW 100kW 1kW 1MW 10MW 100MW 1GW System Power Ratings, Module Size High Power Supercapacitors Li - Ion Battery Solutions for Clean Peaker Plants Flow Batteries Pumped Hydro CAES Hydrogen blending into capable turbines Large scale fuel cell plants Lead - Acid Battery H2 Adapted from University of Michigan Center for Sustainable Studies: U.S. Grid Energy Storage Fact Sheet • Li - ion being deployed at scale but limited to several hours of discharge • Hydrogen can address both scalability and duration beyond 6 - 8 hours

8 State & Local Clean Power Policy Market Drivers for Clean Peaker Plants 1 FERC - Electric Power Markets, 2023 1 DOE – Inventory of U.S. Greenhouse Gas Emissions and Sinks: 1990 – 2021 US Greenhouse gas emissions by sector in 2021 1


Copyright 2023, Plug Power Inc. Plug Symposium Breakout Room: Where in the World is Green Hydrogen? Benjamin Haycraft, EVP EMEA Region October 11, 2023

Where Produced v s Where Consumed Where is the most competitive hydrogen produced at scale? Excellent combined wind, solar and other renewable resources (e.g. hydro) Ability to scale production (land, interconnection) Distribution infrastructure (coastal access, pipeline, close to demand centre) Stable, predictable geopolitical risk Where is hydrogen critical? Industrial clusters Zero / low emission areas Lack of electrical grid access Areas with binding decarbonization targets Example: Plug’s future hydrogen generation sites in New York or in Finland Example: Plug’s future hydrogen generation site in Antwerp, Plug’s stationary systems

Electrolyzer Short - Term Focus Primarily on Industrial Applications Where One Substitutes Grey for Green: Europe Existing Industrial volume to decarbonize Breakdown by usage 4.4 2.5 1.1 0.4 0.3 0.001 Refinery Ammonia Methanol & other chemicals Other industrial processes Energy Transport 50% 29% 13% 5% 4% 0.002% Mt per year , % of total

Plug is Uniquely Positioned to Take Advantage of Opportunities Sines refinery Maasvlakte Energy Hub Energy Infrastructure Green H2 Tech

Copyright 2023, Plug Power Inc. Plug Symposium Breakout Room: Green Hydrogen Plant Build Out to 2028 Sanjay Shrestha , Sanjay Shrestha, General Manager, Energy & Chief Strategy Officer Paul Middleton, CFO October 11, 2023

2 2 Global Green Hydrogen Network Targets for North American Network 500 TPD by 2025 Targets for EU and Global Network 2,500+ TPD Globally by YE 2030 1,000 TPD in Europe by YE 2030 North America Georgia, Tennessee, Louisiana, New York, Texas, and West Coast Europe 35TPD plant at Port of Antwerp - Bruges, producing in 2025 15 TPD plant, with JV partner Acciona, announced in Spain Finland Developing three green hydrogen production plants in Finland with FID expected by 2025/2026 Targeting 850 TPD of green hydrogen

3 Capital Structure Evolution 0 2 4 6 8 10 12 14 16 Yesterday Today Today+ Future $MM/TPD Plug Equity Co-Equity Project Debt EPC competition, ELX roadmap, & Reflects CapEx & EPC reductions $1 of Plug Equity Today will get us 8x more capacity in the future • 2/3 rd Capital Leverage • 1/3 rd CapEx 2024 - 2025

4 Financing the Build Out Yesterday • Execution of Gen 1 Plants • 100% Balance sheet financing • $15MM/TPD Liquid Plants • Peachtree 1 Today • Refinancing Gen 1 & developing Gen 2 • Strategic equity partners & training - wheels debt • Recycle ~40% of equity $10 - 12MM - >$9MM/TPD Today+ • Execution of Gen 2 • Drive - down CapEx to $9 - 10MM/TPD • Training - wheels debt & Strategic equity partners, Future • Path to project finance (70 - 80% Leverage) • EPC Wrap ( completed) • Bankability of offtake (BOO Model) • Operational track record • Drive - down CapEx to $6MM/TPD 2024 - 2025 • DOE loan guarantee program


Copyright 2023, Plug Power Inc. Plug Symposium Breakout Room: Plug Electrolyzer Portfolio and Value Proposition Perspectives from Plug & Key Customer Testimony Sanjay Shrestha , Sanjay Shrestha, General Manager, Energy & Chief Strategy Officer Bruno Forget, VP, Strategy & Operations management, Electrolyzer BU Drew Miller, VP of Projects, Infinium Anselmo Andrade , CEO, H2B2 Florencio Ferrera, Chief Operating Officer, H2B2 October 11, 2023

2 2 Operational experience 63 million hours of operation total across all platforms with a demonstrated record of reliability (1.61 Lambda, failures per million hours) Demonstrated ~10 - year stack life in high stress mission critical operation on submarines Hundreds of 30 - Nm3/ hr stacks deployed for C&I applications 1MW stack platform uses same technology and has demonstrated similar performance as predicted. 30 Nm 3 / hr 3 Nm 3 / hr 220+ Nm 3 / hr (MW Scale) Commercial/Industrial Applications Plug already manufacturing PEM at scale x 1.2+ GW annual run rate of electrolyzer capacity x Capacity to grow up to 2.5 GW

3 3 H2B2 Projects with Plug inside SoHyCal Project – One of the largest operating PEM projects x Current density x Energy consumption x Customer oriented x Hours of operation x Pressure x Dimensions x Degradation x Outstanding performance x3
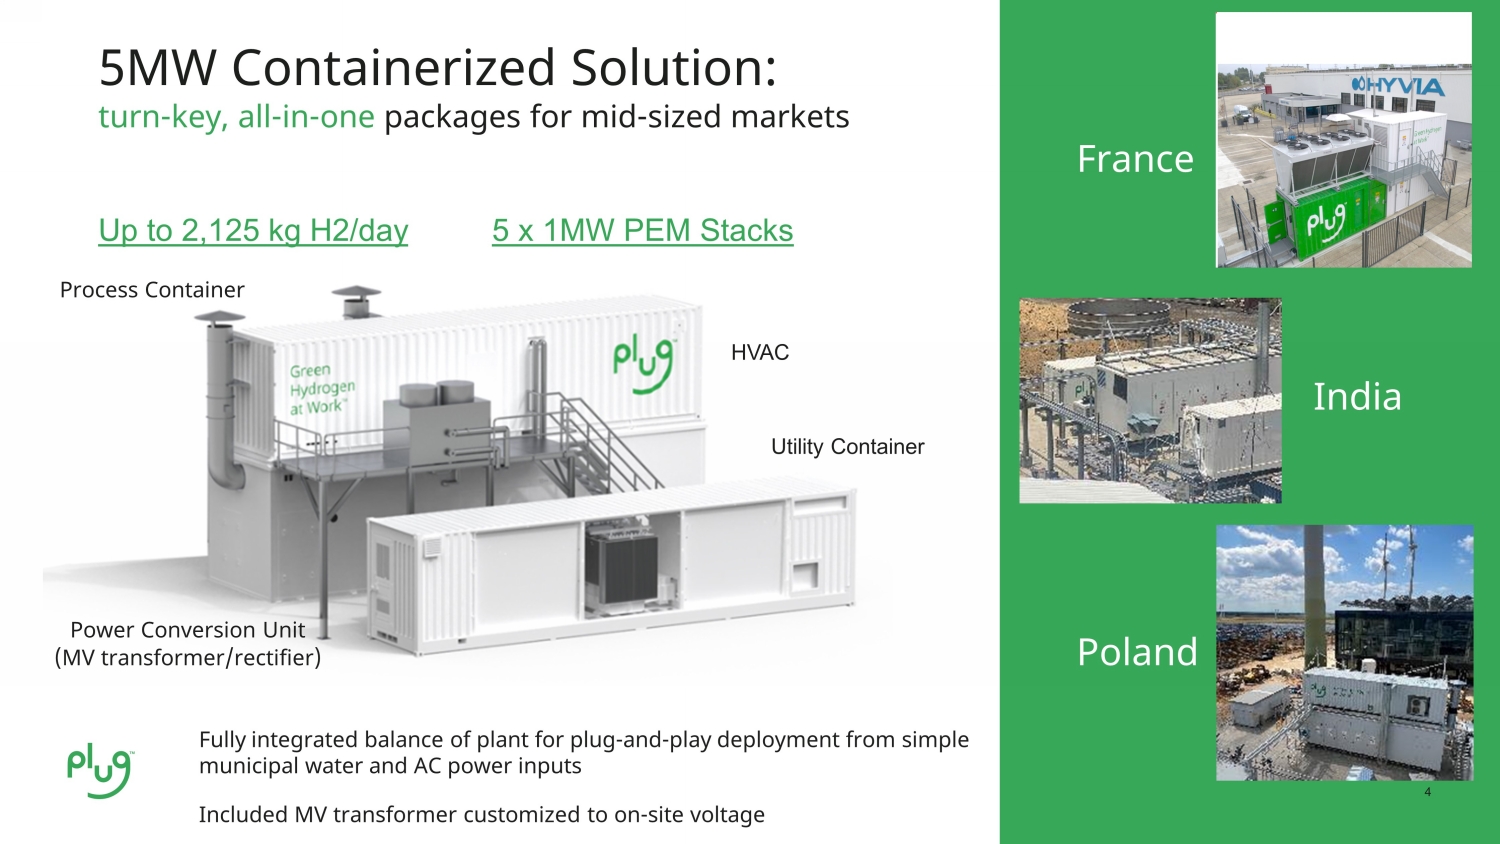
4 4 India Poland 5MW Containerized Solution: turn - key, all - in - one packages for mid - sized markets Up to 2,125 kg H2/day 5 x 1MW PEM Stacks Power Conversion Unit (MV transformer/rectifier) Process Container Utility Container HVAC Fully integrated balance of plant for plug - and - play deployment from simple municipal water and AC power inputs Included MV transformer customized to on - site voltage France

5

6 6 Plug know - how from building plants BEDP Packages 10MW Modular Unit: Efficient, modular building block for industrial - scale Hydrogen plants Up to 4,125 kg H2/day 10 x 1MW PEM Stacks Cathode/anode vessels 10 x 1 MW Stacks Stack Ventilation Heat Exchanger Shared BoP optimized around process skids in building Genesee County, NY 75 TPD green hydrogen Camden County, GA 15 TPD green hydrogen


Copyright 2023, Plug Power Inc. Plug Symposium Breakout Room: Getting Hydrogen From Here to There Sanjay Shrestha , Sanjay Shrestha, General Manager, Energy & Chief Strategy Officer Kevin Kopczynski, VP, Strategy and M&A Raja Amirthalingam, Ph.D., P.E ., Principal R&D Engineer, Hydrogen Production and Liquefaction October 11, 2023

2 Options for Hydrogen Transportation Low Medium High High High Medium Low High High Low Low Low Local ~100 miles Regional ~500 miles Continental ~1,000 miles Intercontinental >1,000 miles 1 to 10 TPD 10 to 500 TPD 100+ TPD 100+ TPD $15 / GJ* $7 / GJ* $1 / GJ* $2 / GJ* GAS TRUCK LIQUID TRUCK GAS PIPELINE AMMONIA Total Capital Costs Operating Costs Transport Cost per kg Representative Transport Distance Applicable Scale Representative Transport Costs ($/GJ) Based on Plug internal analysis (2023). * 1 GJ = ~7 kg of hydrogen

3 Plug’s Approach to Hydrogen Delivery Internal Delivery Network Targeting 500 TPD by 2025 Emerging Industrial Markets User Driver(s) Example Markets Power Gen / Storage • Long Duration Green Capacity • Redundant Power System • CA / West Coast • NY Refining • Low Carbon Fuel Standard • Scope 1 Emissions • Midcon • WY Ammonia • EU and Asian Markets • Gulf Coast Plug Customer Location Hydrogen Production Plant

4 Here to There: Today and into the Future • Short distances/distributed production • Small users • Transport volumes and station capacity • Local power costs • Compressor reliability • Transport from regional hubs • Long haul trucking, transit agencies, ports and airports • Energy storage/backup power • Concurrently scaling supply and demand • Costs of cryogenic equipment, reliability and losses • Large - scale transport from supply to demand regions • Enhancing clean grid reliability and flexibility • Regional resiliency with cavern storage • Achieving scale to offset CAPEX • Standards / contamination potential for multi - user access • Intercontinental energy transport • Chemicals, fertilizer and power • Secured offtake for capital investment • Cost of ammonia as an energy carrier AMMONIA GAS PIPELINE LIQUID TRUCK GAS TRUCK Use Case Key Constraints


Copyright 2023, Plug Power Inc. Plug Symposium Breakout Room: Decarbonizing Multiple Industries: Sanjay Shrestha , Sanjay Shrestha, General Manager, Energy & Chief Strategy Officer Bruno Forget, VP, Strategy & Operations management, Electrolyzer BU Ben Victor, VP, Hydrogen Energy Solutions October 11, 2023

2 Decarbonizing Multiple Industries with Green Hydrogen Green hydrogen enables renewable energy to be accessed by anyone at anytime Enterprise and utility sales opportunities Power & Energy Hydrogen for Logistics Green Chemicals & Fuels Industrial Hydrogen is the optimum zero - carbon fuel for long haul trucking, last - mile delivery, and mass transit vehicles Ammonia, methanol, and SAF will be required to decarbonize air and sea shipping Large plants will drive scale Refineries, steel, and chip fabs are going green 5 MW containerized system ideal for pilots

3 Electrolyzer Roadmap 2024 2025 2026 5 MW 50 MW 200 MW 1 GW 10 MW Array • Outdoor installation • Highly integrated • Plant level operation • Lower total plant cost 10 MW System • Lower footprint • 4 TPD Containerized Hydrogen Plant Plant in a box • Optimized for GW deployments • Full hydrogen plant scope • Fast field deployment • Minimal plant engineering and construction

4 4 Plug Liquefier Roadmap Designed for flexible operations and quick turn down / ramp up All equipment designed for highest reliability Integrated control system for ease of operations LX - 15T LX - 30T Liquefaction Capacity 15,000 kg/day 30,000 kg/day Specific Energy Consumption <11 kWh/kg LH 2 Purity 99.999% Turndown Up to 50% Light green – project development Dark green - production

5 LH2 Distribution: On - Road Tankers LH2 Bulk Storage LH 2 Refueler & Recharger PCT LH2 Product Portfolio & Product Development Roadmap 17,700 gal, 155 MAWP Tanker 316 grade stainless inner pressure vessel 18,250 gal,155 MAWP Tanker Provides unmatched payloads 9,000 gal , 110 MAWP Mini - Trailer Improved maneuverability for inner city applications 13,000 gal , 155 MAWP Designed and optimized for South Korea 18,000 gal. Horizontal Storage 10,000 gal. Horizontal Storage 18,000 gal. Vertical Storage 10,000 gal. Vertical Storage Self - contained LH2 fueling station on wheels, that can be easily deployed and re - deployed with minimal construction or site infrastructure requirements. The refueler can facilitate high pressure fueling up to 700 bar as well as liquid H2 delivery capability up to roughly 1,588 kg (3,500 lbs.).


Copyright 2023, Plug Power Inc. Plug Symposium Breakout Room: Path to Green Hydrogen at Cost Parity Sanjay Shrestha, General Manager, Energy & Chief Strategy Officer Jerry Kahil, VP Finance October 11, 2023

2 2 Projected Fuel Costs & Supply Build - out Green hydrogen will be cost competitive with gray hydrogen in the market today Key Drivers are: • Cost of electricity • Electrolyzer and liquefier energy consumption • Reduction of CAPEX Current cost to deliver ~$0.25 per 100 miles; delivery costs expected to decrease as network expands - 100 200 300 400 500 600 700 $- $2.00 $4.00 $6.00 $8.00 $10.00 $12.00 2023 2024 2025 2026 2027 MTPD Delivered Delivered $/KG Avg Delivered Molecule Cost Externally Sourced Internal Production Avg $/KG Delivered

3 3 Levelized Cost of Green Hydrogen ($/KG) 2023 – 2023 - 2024 2030 15% Capex 45% Electricity & other Direct Materials 20% L&OH 5% Capex 10% Electricity & other Direct Materials 5% Labor & Overhead (L&OH) 14% Capex 48% Direct Materials 18% L&OH 5% Capex 10% Direct Materials 5% L&OH Gaseous Hydrogen Gaseous Hydrogen Liquid Hydrogen Liquid Hydrogen Example 45 TPD Plant, $4.50 - $5.00 (excluding PTC) Example 45 TPD Plant, $3.00 - $3.50 (excluding PTC) > 30% decrease LCOH is primarily driven by electricity reductions, efficiency improvements, and CAPEX 2030 • 20 - 30% reduction in energy costs • ~20% improvement in energy efficiency • ~40% reduction in capex costs 2024: • Energy $0.03 - $0.04 per KWh • All - in energy consumption of 70 – 75 KWh /kg • Capex ~$10M/ton Source: Internal estimate

4 4 Cost of Hydrogen: Blue vs Green Blue (SMR with CCUS) Green Capex Capex OpEx Energy Energy & Other Direct Materials OpEx CCUS • Blue vs Green H2 is a function of future Natural Gas vs Electricity costs • Blue H2 assumes ideal geological formation for carbon capture and sequestration • Green H2 benefits from ongoing decline in LCOE for solar and wind • Green H2 should see further decline in overall opex with scale • Green H2 is expected to yield a higher PTC value Source: S&P Global


Copyright 2023, Plug Power Inc. Plug Symposium Breakout Room: Updates on the Implementation of the Inflation Reduction Act Erin Lane, VP Public Affairs, Plug Gerry Conway, EVP/General Counsel, Plug Don Boyajian, Director Government Affairs & Counsel October 11, 2023

2 Personnel and context Overview of personnel and context for this breakout discussion Context The IRA is the largest piece of federal legislation and investment in clean energy and climate action ever, which can be summarized as follows: o $220 - 372 billion in energy; $67 - 183 billion in manufacturing; $28 - 48 billion in building retrofits and energy efficiency; $33 - 436 billion in transportation; $22 - 26 billion in environmental justice, land use, air pollution reduction and resilience; and $3 - 21 billion in agriculture • The IRA includes many credits and provisions potentially relevant to Plug and the hydrogen industry. Including, but not limited to: o Section 48 Investment Tax Credit for Qualified Fuel Cell Properties and Energy Storage Technology; Section 48E Clean Electricity Investment Credit; Section 45X Clean Fuel Production Credit; and the Section 45V Clean Hydrogen Production Tax Credit. The IRA can be transformative in enabling the U.S. to meet its climate goals, strengthen energy security, invest in America to create good - paying jobs, and reduce energy costs for families. These impacts are already being observed across the nation. Personnel Gerry Conway, EVP/General Counsel, Plug Power Erin Lane, VP Public Affairs, Plug Power Don Boyajian, Director Government Affairs & Counsel
3 According to the White House, j ust twelve months after the law was signed, the IRA is already having a significant impact on American workers and families and is delivering for underserved communities that have historically been underrepresented: • Investments in clean energy and climate since the IRA was signed into law have created more than 170,000 jobs and is projected to create more than 1.5 million additional jobs over the next decade. • The private sector has announced more than $110 billion in new clean energy manufacturing investments. • Public and private sector investments driven by the IRA and the Bipartisan Infrastructure Law (BIL) are expected to reduce greenhouse gas (GHG) emissions by approximately 1 billion tons in 2030, by up to 41 percen t below 2005 levels. • Together with additional actions being taken by federal, state, and local governments as well as the private sector, the U.S. is on a path to achieve the ambitious goal of reaching net - zero emissions by no later than 2050. • Department of Energy (DOE) found that the IRA and BIL are driving significant new clean electricity generation, enabling the U.S. to potentially reach 80 percent clean electricity by 2030. IRA impact Inflation Reduction Act – Year in Review

4 • Congress enacted the Section 45 V Clean Hydrogen Production Tax Credit (“PTC”) as part of the IRA in August 2022 . The PTC affords taxpayers a credit of up to $ 3 . 00 per kilogram of hydrogen produced for sale or use, with credit amounts decreasing as the carbon intensity of hydrogen production increases . • The credit is agnostic to hydrogen production pathways, as Congress’ goal of enacting the PTC was to quickly scale clean hydrogen production by driving cost parity with incumbent, carbon - intensive technologies . • To achieve the full $ 3 . 00 /kg PTC, taxpayers must demonstrate a hydrogen production carbon intensity less than 0 . 45 kg of CO 2 e per kg of hydrogen . The amount of the credit is also dependent upon the ability of a taxpayer to satisfy certain prevailing wage and apprenticeship labor provisions . • The new 45 V PTC is available for a ten - year period after a clean hydrogen production facility is placed in service . The facility must begin construction before 2033 . Section 45V PTC Section 45V Clean Hydrogen Production Tax Credit Carbon Intensity (CO2e) per kg H2 Maximum Credit Amount per kg H2 Greater than 4 kg $0.00 2.5 - 4 kg $0.60 2.5 - 1.5 kg $0.75 1.5 - 0.45 kg $1.00 Less than 0.45 kg $3.00

5 5 Section 45V PTC potential IRA Implementation Updates • The White House and U . S . Department of Treasury, in consultation with the U . S . Department of Energy and Environmental Protection Agency (as applicable) are still in process of publishing implementation guidance and regulations . Relevant updates include : – Section 48 ITC updates : Prevailing Wage and Apprenticeship (PWA), Domestic Content, and Energy Communities guidance and draft rules published . Awaiting further guidance, finalization of PWA draft rule, and clarification on energy storage technology ITC (which explicitly references hydrogen) . – Section 45 V Clean Hydrogen Production Tax Credit . Awaiting guidance, anticipated by end of 2023 . Among other key areas, substantial advocacy regarding the calculation of “lifecycle greenhouse gas emissions . ” – Section 45 X Advanced Manufacturing Production Credit . Awaiting guidance in entirety . As a first mover in the clean hydrogen space, Plug has been well - positioned to provide valuable insight to policymakers through these processes.


Copyright 2023, Plug Power Inc. Plug Symposium Breakout Room: Updates on the U.S. Regional Clean Hydrogen Hubs (H2Hubs) Program Erin Lane, VP Public Affairs, Plug Gerry Conway, EVP/General Counsel, Plug John Lochner, NYSERDA Mitch B. Carmichael Cabinet Secretary, WV Dept. of Economic Development October 11, 2023

2 Personnel and context Overview of personnel and context for this breakout discussion Context The Bipartisan Infrastructure Law (BIL) is a once - in - a - generation investment, designed to modernize and upgrade American infrastructure to enhance U.S. competitiveness, drive the creation of good - paying union jobs, tackle the climate crisis, and ensure stronger access to economic, environmental, and other benefits. The BIL appropriates more than $62 billion to the DOE to invest in American manufacturing and workers; expand access to energy efficiency; deliver reliable, clean and affordable power to more Americans; and deploy the technologies of tomorrow through clean energy demonstrations. The H2Hubs effort is expected to catalyze investment in the development of H2Hubs that demonstrate the production, processing, delivery, storage, and end - use of clean hydrogen, in support of the Biden Administration’s goal to achieve a carbon - free electric grid by 2035 and a net zero emissions economy by 2050. The H2Hubs initiative is set to establish the cornerstone of a crucial nationwide clean hydrogen infrastructure, playing a pivotal role in cutting emissions and achieving decarbonization across various sectors of the economy. Matching the scale - up of clean hydrogen production to a growing regional demand is a pathway to achieving large - scale, commercially viable hydrogen ecosystems. This is expected to accelerate the deployment of these technologies and enabling infrastructure, attract greater investments from the private sector, and promote substantial U.S. manufacturing of numerous hydrogen related technologies. Personnel Gerry Conway, EVP/General Counsel, Plug Power Erin Lane, VP Public Affairs, Plug Power John Lochner, VP Innovation NYSERDA Mitch Carmichael, Cabinet Secretary, WV Department of Economic Development

3 Regional Clean H2Hubs Program Outline Notice of Intent issued June 6, 2022. Final applications were due April 7, 2023. Selection notifications anticipated for fall 2023. Award negotiations expected through winter 2023 and into 2024. The BIL established the definition of a “regional clean hydrogen hub” as “a network of clean hydrogen producers, potential clean hydrogen consumers, and connective infrastructure located in close proximity” that: o Demonstrably aid the achievement of the clean hydrogen production standard; o Demonstrate the production, processing, delivery, storage, and end - use of clean hydrogen; and o Can be developed into a national clean hydrogen network to facilitate a clean hydrogen economy. Statutory provisions require that to the maximum extent practicable, DOE select proposals covering characteristics of: o Feedstock diversity – at least one H2Hub shall demonstrate the production of clean hydrogen from fossil fuels, one H2Hub from renewable energy, and one H2Hub from nuclear energy. o End - use diversity – at least one H2Hub shall demonstrate the end - use of clean hydrogen in the electric power generation sector, one in the industrial sector, one in the residential and commercial heating sector, and one in the transportation sector. o Geographic diversity – each H2Hub shall be in a different region of the country and shall use energy resources that are abundant in that region, including at least two H2Hubs in regions with abundant natural gas resources. The U.S. Department of Energy (D OE) initially envisioned funding 6 - 10 hubs at around $6 - 7 billion, reserving the remaining $1 - 2 billion for future hub launches and/or "supporting activities" such as the demand - side incentive. o Each hub is expected to be funded at a minimum of $400 - 500 million and a maximum range of $1million to $1.25 billion with a 50% non - federal cost share o Execution of full project is expected over 8 - 12 years o Ongoing project f unding to be evaluated through four phases, each with go/no - go criteria to advance H2Hubs program outline

4 DOE received 79 concept papers, of which 33 were encouraged to submit full applications. Out of the 33 encouraged to apply, 20 hubs confirmed submission of a final application. 1 Regional Clean H2Hubs Final Application Landscape H2Hubs final applications 1 https://www.spglobal.com/commodityinsights/en/market - insights/latest - news/energy - transition/041823 - at - least - 20 - hubs - submitted - final - applications - for - us - hydrogen - hub - funding

5 Completed H2Hubs program phases Regional Clean H2Hubs Program Phases 1 1 DE - FOA - 0002779_Regional_Clean_Hydrogen_Hubs_Funding_Opportunity_Announcement_MOD_000002_


Copyright 2022, Plug Power Inc. Plug Symposium Breakout Room: Vertical Integration through JV’s and MOU’s Keith Schmid, EVP, Special Projects October 11, 2023

Partnerships Enabled By Plug Technology Accelerate Regional Hydrogen Ecosystems Market Knowledge & Access Scale Complementary Skills Influence Public Policy Local Supply Chain Cultural Fit The Right Fit JV Know - how Relationship Market access Infrastructure TECHNOLOGY PARTNER STRATEGIC PARTNER

3 Leading Global Automotive Manufacturer Electrified Light Commercial Vehicle Platforms Established Sales and Service Network Automotive Supply Chain High Volume Automated Manufacturing Plants Leader in hydrogen solutions and fuel cells Proven Technology 1B+ hours of operation Blue Chip Fleet Customer Base Vertically Integrated in Core Fuel Cell Technology High Volume Fuel Cell Gigafactory for Scale

4 First Generation Commercially Available Pilot Deployments Underway Second Generation Vans in Validation Testing High Volume New Master Van Platform anticipated in 2025

Primary Business Focus SK E&S LH2 Production Plants • 90 tons/day planned 2024 • 250 tons/day planned 2026

6 Hyverse HRS Network Largest LH2 Based Refueling Network in Korea 29 Stations in Network Initial Stations Online 2023 15 - 20 projected in 2024 Balance in 2025

7 Hydrogen Supply Internal SK Bus Market Demand ProGen Fuel Cell Technology & Engines Hydrogen Storage & Logistics Technology Korea’s Largest LH2 Hydrogen Refueling Network Localization of Fuel Cell Technology & Services Market Development & Sales Channel Creating and Accelerating the Korean Hydrogen Bus Ecosystem FCEV Integration Complete Homologation in Process Commercial Launch in 2024

8 Electrolyzers : 1MW approved (KGS) for Korean market 5MW KGS modifications in process Pipeline developing Stationary: Localizing MW scale stationary Targeting Power Generation Market 50 - 200MW Material MOU’s signed with key logistics players GenDrive units in local test and certification process Cryotech : LH2 storage and trailers shipping Q4 for H2 network Handling:

9 Fully Staffed and Operational First Plant projected to be online Q4 2024/Q1 2025 Plant Colocated with Acciona Wind/Solar Field in North of Spain. Capable of Scaling to 50MW 4GW Pipeline: >1 GW (8 Projects) in Advanced Stage 3.0 GW in Early Stage


Copyright 2023, Plug Power Inc. Plug Symposium Breakout Room: Ramping Manufacturing and Supply Chain Dave Mindnich, EVP Global Manufacturing Brandon Snyder, SVP, Integrated Supply Chain October 11, 2023

2 Vista Manufacturing 2023 – GenDrive & Stationary 2024 – GenDrive & Stationary – ProGen and GenFuel integration 2025 EOY 2030 Ramp Targets – GenDrive 80K per annum – Stationary 500 per annum – ProGen 20K per annum – GenFuel 250 per annum Rochester Innovation Center 2023 – Coating – Stack – 1MW, FC High Power 2024 – Transition of LC and AC Stack – Transition balance of ELX product 2025 EOY 2030 Ramp Targets – 2.5GW 5GW 5GW+ ELX – 200K+ FC Stack per annum Flagship Facilities

3 Global Expansion Operational Flexibility Integration of New Technology • Propriety licensing agreements – Power Electronics, DeOxo , Diffusion Bonding Co - investment with Alpha ECC (Vietnam) Vertical integration planning on - going ELX System Assembly and Fabrication Strategy

4 Plug’s Current Fabricators

5 5 Building Blocks For Expansion Vista WHS 206 Stock Picked Carts (BIN Location) Main Line Build Bay 1 Main Line Build Bay 3 Main Line Build Bay 4 Main Line Build Bay 2 Sub - Assy 1 Sub - Assy 2 Sub - Assy 3 Sub - Assy 4 Sub - Assy 5 Sub - Assy 6 Sub - Assy 7 Line layout designed to add volume to facility

6 Supply Chain • Supply Chain Diversification – Both with Suppliers and Regionality • Cost Maturity Increased Gross Margin Manufacturing • Expansion to 12 Build Bays • In Process Inspection • In Process Testing • Automated Factory Acceptance Testing • 24/7 Flex Labor Model – Utilize 168 hrs. In week before adding capital investment Stationary – Expansion and Industrialization


Copyright 2023, Plug Power Inc. Plug Symposium Breakout Room: Hydrogen: Fact and Fiction A level setting discussion regarding hydrogen leakage, safety, and similar topics Tim Cortes, CTO Dr. Luke Wentlent, Principal R&D Engineer October 11, 2023

2 Hydrogen Therapy: Facts vs Fiction Does hydrogen make sense? Is hydrogen dangerous? Does hydrogen leak? Is hydrogen safe? There is a significant amount of misinformation circulating around the world regarding hydrogen… Is hydrogen toxic? Is hydrogen flammable? How much water does hydrogen use? Is hydrogen explosive?

3 They Said It Best… “A global race to supply green hydrogen has begun” - Rich Powell, ClearPath Action 10.28.21 “Clean hydrogen is a game changer.” - Pres. Biden 4.29.21 “Green Hydrogen Comes In As An Enabler” - Rene Peters, Director of Gas Technology 4.20.21 Swiss army knife of zero - carbon technologies” - Sec. Granholm 5.29.23 “Ready for the Big Time” - Fatih Birol - Head IEA 9.25.21 “We need to invest in the entire hydrogen value chain.” - Sen. Manchin (D) - WV 8.31.21 “Clean hydrogen is a critical solution” - Gabrielle Habeeb, Industrial Innovation Initiative 4.7.23 “Hydrogen is a practical and implementable solution” - Andy Vesey, CEO NA Fortescue 3.2.23 “Hydrogen is an essential technology” - Michele Stockwell, Bipartisan Policy Center 4.11.21 “Hydrogen will play a critical role in decarbonizing” - Frank Wolak, CEO of FCHEA 9.1.21 “If we get it right, it can do just about anything” - Sen. Granholm 4.1.21 “Hydrogen Can Tackle the Toughest Challenges” - Sen. Manchin (D) - WV 9.7.21

4 Real Benefits of Hydrogen Why is hydrogen so critical to decarbonization? Zero Emissions Electrolyzers and renewable power can produce hydrogen with zero emissions (0 kg - CO 2 /kg - H 2 ) Flexible Hydrogen is a flexible energy carrier that can be stored or moved as a liquid or gas Produces Clean Fuel and Power Safety Hydrogen is non - toxic, environmentally safe, and has a better safety track record than any fossil fuel used today Industrial Feedstock Clean hydrogen can be used as a feed stock to decarbonize critical chemical sectors (i.e., ammonia, steel) Hydrogen an energy carrier with a unique combination of characteristics, properties, and flexibility. It is no surprise that it is widely recognized as essential to realizing society’s decarbonization efforts.

5 Hydrogen is critical to enable decarbonization. H 2 : Fuel Fuel Cells Engines/Turbines Energy Storage H 2 : Chemical Steel Manufacturing Ammonia Production Methanol Production Petrochemical Refining Hydrogen is a critical component of large scale decarbonization, particularly in hard - to - abate industries.

6 Market Adoption for Each End Use Sector.... Green hydrogen demand 1,2 , Mn tons Based upon clean hydrogen demand values reported by DOE H 2 engine fuels PtL fuels (e - fuels) Methanol (transport) Petroleum refining Energy storage Biofuels Ammonia 3 Steel Methanol (chemicals) Power Heating Source: Plug Power analysis, DOE Liftoff report, National Hydrogen Strategy & Roadmap (https://www.hydrogen.energy.gov/docs/h ydr ogenprogramlibraries/pdfs/us - national - clean - hydrogen - strategy - roadmap.pdf) 1. Logistic function (A+(A+B)/1+C/x)^n) is applied where A=forecasted minimum demand, B=forecasted maximum demand, x=individual year, n=curvature number 2. Threshold calculated based on the smallest project with 2025 Commercial Operation Date, Niagara Liquid Green Hydrogen (~6 ktpa ); demand for each end - use is then assumed to pick up after it exceeds ~10x the size of this smallest viable hydrogen project 3. Ammonia demand for 2040 is adjusted up to account for 35% of total green hydrogen demand across end uses for curve fitting Interpolated baseline demand curves by end - use sector Impact

Let's break some myths Hydrogen Safety The Myth: Hydrogen is unsafe compared to existing fuels due to its various chemical properties and features (highly flammable, ignites easily, cryogenic/high pressure storage, etc ). Hydrogen Leakage The Myth: Hydrogen will leak more than natural gas (i.e. in pipelines) because it is a smaller molecule. Water Usage The Myth: Electrolysis requires and wastes large amounts of water, far more than conventional power generation using natural gas.

8 8 Hydrogen Safety The Myth: Hydrogen is unsafe compared to existing fuels due to its various chemical properties and features (highly flammable, ignites easily, cryogenic/high pressure storage, etc ). THE FACTS Toxicity Flammability Ignition Energy Diffusivity Density Hydrogen is non - toxic, not poisonous, and will not contaminate ground water 1,3 . 4x the concentration of gasoline is required to get flammability of H 2 2,4,5 . - H 2 disperses 11x faster than gasoline in ambient conditions - Hydrogen flames have lower radiant heat than those from a burning hydrocarbon At 4 - 10% concentrations (what would be seen during a leak), the ignition energy of H 2 is comparable to natural gas 4,5 . - At these concentrations, a typical static shock would be able to ignite not just hydrogen but also methane, propane, gasoline, and hydrogen - Hydrogen cannot ignite on its own, an oxidizer must be present. Hydrogen is the most diffusive fuel available. - Hydrogen is 4x more diffusive than natural gas and 11x more diffusive than gasoline fumes 1,4,5 . H 2 is 8x lighter than natural gas 1,3 . - For a specific unit of energy, H 2 weighs 64% less than gasoline and 61% less than natural gas - H 2 is 14.4 times lighter than air and 57x lighter than gasoline vapor. MYTH BUSTED Based upon any metric, h ydrogen is no more or less dangerous than any other fuel currently used today. If anything, it is far safer.

9 9 Hydrogen Leakage The Myth: Hydrogen will leak more than natural gas when used in the existing natural gas infrastructure (i.e. pipelines) because it is a smaller molecule. THE FACTS: Swain & Swain studied two types of leaks in their study, one’s common to low - pressure piping and large atypical leaks (not commonly observed) 1,2 . Most of the discussion and conclusions focused on the atypical leaks, which are not representative of in - service conditions. Initial Study Results were Overlooked Swain & Swain (1992) also presented data that in realistic sized leaks, natural gas and H 2 will leak at the same rate 1 . Existing NG Infrastructure is Perfectly Compatible Multiple experimental efforts over the past decade have shown that H 2 does not preferentially leak from typical low - pressure NG piping when mixed in a blend 2,3,4,5 . Mechanisms are Over Simplified Saying H 2 molecules are smaller so they will leak faster is a gross oversimplification. Molecular dynamic analyses have shown it is a far more complex mechanism ultimately resulting in the same net leakage rate 1,3 . MYTH BUSTED In realistic conditions, H 2 leaks no different than natural gas. Change in pressure vs time of various gas mixtures for a fixed low - pressure piping configuration.

10 10 0.25 Water Usage The Myth: Electrolysis requires and wastes large amounts of water, far more than conventional power generation using natural gas. THE FACTS: Combined Cycle Gas Turbine (CCGT) 1. Natural Gas Production 2. Power Plant Cooling ELX with Fuel Cells 1. Electrolyzer H 2 Production Process ELX & H 2 Combustion 1. Electrolyzer H 2 Production Process 2. Power Plant Cooling 0.24 MYTH BUSTED Considering the full lifecycle (from production to power generation), electrolysis generation and fuel cell utilization consume the same amount of water as the natural gas CCGT power plants in use today. Uses for Water Water Consumption (gal/kWh produced) All power generation techniques (fossil and hydrogen - based) require water. 0.31 Learn even more at https://www.plugpower.com/water - electrolysis - powering - the - world - with - green - hydrogen/ ! Electrolyzers and Water: Saving Water, Powering the World with Green Hydrogen – blog by Plug's Dr. Thomas I. Valdez, Principal Engineer for Office of the Chief Technology Officer


12 References Slide 8 1. United States Department of Energy Office of Energy Efficiency and Renewable Energy. Fact Sheet Series. “Hydrogen Safety”. 2020. 2. Shapiro, Z.M.; and Moffette , T.R.; “ Hydrogen Flammability Data and Application to PWR Loss - Of - Coolant Accident ” Westinghouse Electric Corp. 1957 3. International Chemical Safety Card, “ Hydrogen ”. Inchem.org/documents/ icsc /eics0001.htm. July 7, 2022. 4. Yang, J.M. “ An Improved Analytical Approach to Determine the Explosive Effects of Flammable Gas - Air Mixtures”. Lawrence Livermore National Laboratory. UCRL - TR - 217005. 2005 5. Coward, HF and Jones, GW (1952 ). Limits of flammability of gases and vapors, Bulletin 503, Bureau of Mines, p. 155. 6. Schroeder, V and Holtappels , K (2005 ). Explosion characteristics of hydrogen - air and hydrogen - oxygen mixtures at elevated pressures. 1st International Conference on Hydrogen Safety, Pisa, Italy More references available upon request Slide 9 1. Swain, M.R.; Swain, M.N., “ A Comparison of H2, CH4, and C3H8 Fuel Leakage in Residential Settings ”. Int. Journal of Hydrogen Energy. Vol 17. No 10. pp 807 - 815, 1992. 2. Swain MR, Shriber J. Comparison of hydrogen, natural gas, liquified petroleum gas, and gasoline leakage in a residential garage . Energy Fuels 1998;12:83e9. 3. Meija, A.; Brouwer, J.; & Kinnon, M.M.; Hydrogen Leaks at the Same Rate as Natural Gas in Typical Low - Pressure Gas Infrastructure . International Journal of Hydrogen Energy. 45 (2020) 8810 - 8826 4. Ge X, Sutton WH. Analysis and test of compressed hydrogen interface leakage by commercial stainless steel (NPT) fittings. SAE Tech Pap 2006:2006 - 01 - 0130. 5. Qi Y, Meng X, Mu D, Sun Y, Zhang H. Study on mechanism and factors affecting the gas leakage through clearance seal at nano - level by molecular dynamics method . Energy 2016;102:252e9. Slide 10 1. Tidwell, V. & Moreland, B . Mapping Water Consumption for Energy Production Around the Pacific Rim . Sandia National Laboratories. 2016. 2. Energy Technology Innovation Policy Research Group. Water Consumption of Energy Resource Extraction, Processing, and Conversion . Harvard Kennedy School Belfer Center. October 2010 3. Seebregts , A.J. Gas Fired Power. IEA Energy Technology Systems Analysis Programme Technology Brief E02. April 2010.

Copyright 2023, Plug Power Inc. Plug Symposium Breakout Room: Global Service and Cost Leverage Leveraging Scale and System Performance Improvements for the Hydrogen Economy Chris Suriano, EVP, Service October 11, 2023

2 Plug Service: Delivering Hydrogen Ecosystem Mission: Provide world class lifecycle s ervice across all Plug products delivering the hydrogen ecosystem to our customers and the world. 15 Years of Fuel Cell Service & H2 System Maintenance 3 - Global Operations Centers • New York • Ohio • Germany 292 - Global Customer Locations • Fuel Cells – Motive & Stationary • Liquid Hydrogen • Gaseous Hydrogen • Electrolyzer • 100+ Hydrogen Projects / Year 700+ Dispensers in Operation 99.0% Avg Fleet Availability in 2023 50K - Fuelings Per Day • 80,000,000 Fills and • 45,000,000 kilograms 1 Billion+ Fuel Cell Operating Hours

3 Three Elements to Service Cost Performance Global Scale & Leverage Platforms and Skillset enable growth Lower cost of entry to new markets Fleet revenue opportunities System Life Increased stack power density Stack MEA longevity Reliability and durability improvements Per Unit Costs Total lifecycle cost management Sustainable remanufacturing Technical labor efficiency

4 Global Platforms & Skillsets for Hydrogen Economy Existing network and experience in system technologies allows for profitable and low cost of entry service offerings Common Skill Sets Fuel Cell Applications Electrolyzer & Hydrogen Systems Fleet Monitoring & Diagnostics Global Hydrogen & Fuel Cell Expertise Regional Customer Execution Global Operations Service Engineering Safety Efficiency Quality

5 12000 10000 8000 6000 4000 2000 System Life - Stack Innovations drives Service Cost Stack Life (hours) Fuel Cell Stack Technology Innovation reduces Service Lifecyle Cost • Power density increases stack life in existing and new equipment • Fleet optimization and balance of plant upgrades enhance system performance • New platform releases enables service cost down acceleration Fine Pitch Plates Thin Plates Enhanced MEA Metal Plate Stack + Converter Plug MEA 2015 2017 2019 2021 2023 2025 Air Cooled Power Increase Liquid Cooled Power Increase BOP & Software Upgrades

6 6 Per unit Lifecycle Costs Breadth of service offerings enable profitable growth Product Delivery & Site Installation Commissioning & Customer Training Maintenance (Planned & Unplanned) 24/7 Technical Support, Monitoring & Diagnostics (M&D) Warranty & Guarantees Spare Parts & Consumables Density of customer fleet Sustainable Remanufacturing Repair vs Replace Recycled Material Operations Leverage and Lifecycle material management Operations and Labor Efficiency Extending Material Life

v3.23.3
| X |
- DefinitionBoolean flag that is true when the XBRL content amends previously-filed or accepted submission.
| Name: |
dei_AmendmentFlag |
| Namespace Prefix: |
dei_ |
| Data Type: |
xbrli:booleanItemType |
| Balance Type: |
na |
| Period Type: |
duration |
|
| X |
- DefinitionFor the EDGAR submission types of Form 8-K: the date of the report, the date of the earliest event reported; for the EDGAR submission types of Form N-1A: the filing date; for all other submission types: the end of the reporting or transition period. The format of the date is YYYY-MM-DD.
| Name: |
dei_DocumentPeriodEndDate |
| Namespace Prefix: |
dei_ |
| Data Type: |
xbrli:dateItemType |
| Balance Type: |
na |
| Period Type: |
duration |
|
| X |
- DefinitionThe type of document being provided (such as 10-K, 10-Q, 485BPOS, etc). The document type is limited to the same value as the supporting SEC submission type, or the word 'Other'.
| Name: |
dei_DocumentType |
| Namespace Prefix: |
dei_ |
| Data Type: |
dei:submissionTypeItemType |
| Balance Type: |
na |
| Period Type: |
duration |
|
| X |
- DefinitionAddress Line 1 such as Attn, Building Name, Street Name
| Name: |
dei_EntityAddressAddressLine1 |
| Namespace Prefix: |
dei_ |
| Data Type: |
xbrli:normalizedStringItemType |
| Balance Type: |
na |
| Period Type: |
duration |
|
| X |
- Definition
+ References
+ Details
| Name: |
dei_EntityAddressCityOrTown |
| Namespace Prefix: |
dei_ |
| Data Type: |
xbrli:normalizedStringItemType |
| Balance Type: |
na |
| Period Type: |
duration |
|
| X |
- DefinitionCode for the postal or zip code
| Name: |
dei_EntityAddressPostalZipCode |
| Namespace Prefix: |
dei_ |
| Data Type: |
xbrli:normalizedStringItemType |
| Balance Type: |
na |
| Period Type: |
duration |
|
| X |
- DefinitionName of the state or province.
| Name: |
dei_EntityAddressStateOrProvince |
| Namespace Prefix: |
dei_ |
| Data Type: |
dei:stateOrProvinceItemType |
| Balance Type: |
na |
| Period Type: |
duration |
|
| X |
- DefinitionA unique 10-digit SEC-issued value to identify entities that have filed disclosures with the SEC. It is commonly abbreviated as CIK. Reference 1: http://www.xbrl.org/2003/role/presentationRef
-Publisher SEC
-Name Exchange Act
-Number 240
-Section 12
-Subsection b-2
| Name: |
dei_EntityCentralIndexKey |
| Namespace Prefix: |
dei_ |
| Data Type: |
dei:centralIndexKeyItemType |
| Balance Type: |
na |
| Period Type: |
duration |
|
| X |
- DefinitionIndicate if registrant meets the emerging growth company criteria. Reference 1: http://www.xbrl.org/2003/role/presentationRef
-Publisher SEC
-Name Exchange Act
-Number 240
-Section 12
-Subsection b-2
| Name: |
dei_EntityEmergingGrowthCompany |
| Namespace Prefix: |
dei_ |
| Data Type: |
xbrli:booleanItemType |
| Balance Type: |
na |
| Period Type: |
duration |
|
| X |
- DefinitionCommission file number. The field allows up to 17 characters. The prefix may contain 1-3 digits, the sequence number may contain 1-8 digits, the optional suffix may contain 1-4 characters, and the fields are separated with a hyphen.
| Name: |
dei_EntityFileNumber |
| Namespace Prefix: |
dei_ |
| Data Type: |
dei:fileNumberItemType |
| Balance Type: |
na |
| Period Type: |
duration |
|
| X |
- DefinitionTwo-character EDGAR code representing the state or country of incorporation.
| Name: |
dei_EntityIncorporationStateCountryCode |
| Namespace Prefix: |
dei_ |
| Data Type: |
dei:edgarStateCountryItemType |
| Balance Type: |
na |
| Period Type: |
duration |
|
| X |
- DefinitionThe exact name of the entity filing the report as specified in its charter, which is required by forms filed with the SEC. Reference 1: http://www.xbrl.org/2003/role/presentationRef
-Publisher SEC
-Name Exchange Act
-Number 240
-Section 12
-Subsection b-2
| Name: |
dei_EntityRegistrantName |
| Namespace Prefix: |
dei_ |
| Data Type: |
xbrli:normalizedStringItemType |
| Balance Type: |
na |
| Period Type: |
duration |
|
| X |
- DefinitionThe Tax Identification Number (TIN), also known as an Employer Identification Number (EIN), is a unique 9-digit value assigned by the IRS. Reference 1: http://www.xbrl.org/2003/role/presentationRef
-Publisher SEC
-Name Exchange Act
-Number 240
-Section 12
-Subsection b-2
| Name: |
dei_EntityTaxIdentificationNumber |
| Namespace Prefix: |
dei_ |
| Data Type: |
dei:employerIdItemType |
| Balance Type: |
na |
| Period Type: |
duration |
|
| X |
- DefinitionLocal phone number for entity.
| Name: |
dei_LocalPhoneNumber |
| Namespace Prefix: |
dei_ |
| Data Type: |
xbrli:normalizedStringItemType |
| Balance Type: |
na |
| Period Type: |
duration |
|
| X |
- DefinitionBoolean flag that is true when the Form 8-K filing is intended to satisfy the filing obligation of the registrant as pre-commencement communications pursuant to Rule 13e-4(c) under the Exchange Act. Reference 1: http://www.xbrl.org/2003/role/presentationRef
-Publisher SEC
-Name Exchange Act
-Number 240
-Section 13e
-Subsection 4c
| Name: |
dei_PreCommencementIssuerTenderOffer |
| Namespace Prefix: |
dei_ |
| Data Type: |
xbrli:booleanItemType |
| Balance Type: |
na |
| Period Type: |
duration |
|
| X |
- DefinitionBoolean flag that is true when the Form 8-K filing is intended to satisfy the filing obligation of the registrant as pre-commencement communications pursuant to Rule 14d-2(b) under the Exchange Act. Reference 1: http://www.xbrl.org/2003/role/presentationRef
-Publisher SEC
-Name Exchange Act
-Number 240
-Section 14d
-Subsection 2b
| Name: |
dei_PreCommencementTenderOffer |
| Namespace Prefix: |
dei_ |
| Data Type: |
xbrli:booleanItemType |
| Balance Type: |
na |
| Period Type: |
duration |
|
| X |
- DefinitionTitle of a 12(b) registered security. Reference 1: http://www.xbrl.org/2003/role/presentationRef
-Publisher SEC
-Name Exchange Act
-Number 240
-Section 12
-Subsection b
| Name: |
dei_Security12bTitle |
| Namespace Prefix: |
dei_ |
| Data Type: |
dei:securityTitleItemType |
| Balance Type: |
na |
| Period Type: |
duration |
|
| X |
- DefinitionName of the Exchange on which a security is registered. Reference 1: http://www.xbrl.org/2003/role/presentationRef
-Publisher SEC
-Name Exchange Act
-Number 240
-Section 12
-Subsection d1-1
| Name: |
dei_SecurityExchangeName |
| Namespace Prefix: |
dei_ |
| Data Type: |
dei:edgarExchangeCodeItemType |
| Balance Type: |
na |
| Period Type: |
duration |
|
| X |
- DefinitionBoolean flag that is true when the Form 8-K filing is intended to satisfy the filing obligation of the registrant as soliciting material pursuant to Rule 14a-12 under the Exchange Act. Reference 1: http://www.xbrl.org/2003/role/presentationRef
-Publisher SEC
-Name Exchange Act
-Section 14a
-Number 240
-Subsection 12
| Name: |
dei_SolicitingMaterial |
| Namespace Prefix: |
dei_ |
| Data Type: |
xbrli:booleanItemType |
| Balance Type: |
na |
| Period Type: |
duration |
|
| X |
- DefinitionTrading symbol of an instrument as listed on an exchange.
| Name: |
dei_TradingSymbol |
| Namespace Prefix: |
dei_ |
| Data Type: |
dei:tradingSymbolItemType |
| Balance Type: |
na |
| Period Type: |
duration |
|
| X |
- DefinitionBoolean flag that is true when the Form 8-K filing is intended to satisfy the filing obligation of the registrant as written communications pursuant to Rule 425 under the Securities Act. Reference 1: http://www.xbrl.org/2003/role/presentationRef
-Publisher SEC
-Name Securities Act
-Number 230
-Section 425
| Name: |
dei_WrittenCommunications |
| Namespace Prefix: |
dei_ |
| Data Type: |
xbrli:booleanItemType |
| Balance Type: |
na |
| Period Type: |
duration |
|
Plug Power (NASDAQ:PLUG)
Historical Stock Chart
Von Jun 2024 bis Jul 2024

Plug Power (NASDAQ:PLUG)
Historical Stock Chart
Von Jul 2023 bis Jul 2024
