India Capital Growth Fund Limited Net Asset Value Daily Estimate
03 Januar 2025 - 2:30PM
RNS Regulatory News

RNS Number : 1185S
India Capital Growth Fund Limited
03 January 2025
03 January 2025
India Capital
Growth Fund Limited (the "Company" or "ICGF")
LEI: 213800TPOS9AM7INH846
Estimated Daily
Net Asset Value ("NAV") statement as at 03 January
2025
The Company announces its Net Asset Value per
ordinary share as at 03 January 2025 was estimated to be 213.95
pence.
The Company also announces its Net Asset Value
per ordinary share before Indian CGT deferred tax provision as at
03 January 2025 was estimated to be 227.72 pence.
The Net Asset Value per ordinary share has been
estimated based upon 85,810,644 ordinary shares with voting rights
in the Company as at 03 January 2025.
This estimated
daily NAV is provided by the Investment Manager of the Company and
is, by its nature, based on incomplete and estimated data. The
making of such an estimate involves known and unknown risks,
uncertainties and other factors which may cause the estimated
results, performance, or achievements to be different from any
actual results, performance, or achievements.
This information is provided by RNS, the news service of the
London Stock Exchange. RNS is approved by the Financial Conduct
Authority to act as a Primary Information Provider in the United
Kingdom. Terms and conditions relating to the use and distribution
of this information may apply. For further information, please
contact
rns@lseg.com or visit
www.rns.com.
RNS may use your IP address to confirm compliance with the terms
and conditions, to analyse how you engage with the information
contained in this communication, and to share such analysis on an
anonymised basis with others as part of our commercial services.
For further information about how RNS and the London Stock Exchange
use the personal data you provide us, please see our
Privacy
Policy.
END
NAVBJMTTMTIMBRA
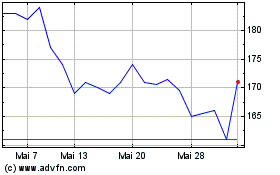
India Capital Growth (LSE:IGC)
Historical Stock Chart
Von Dez 2024 bis Jan 2025

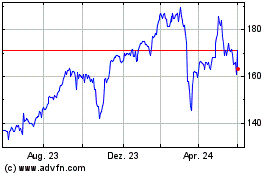
India Capital Growth (LSE:IGC)
Historical Stock Chart
Von Jan 2024 bis Jan 2025
