Corbion Q3 2021 Interim Management Statement
27 Oktober 2021 - 7:00AM

Corbion Q3 2021 Interim Management Statement
Corbion reported net sales of €
797.6 million in the
first nine months of 2021, driven
by organic net sales growth of
15.7%.
Adjusted EBITDA in the first nine
months of 2021
decreased organically by
2.4% to €
113.5
million.
“The third quarter showed a continuation of the strong sales
growth in the previous quarters. Sustainable Food Solutions is
showing organic growth due to our higher win-rates in Functional
Systems, while in Preservation, our natural solutions continue to
win share in the overall preservation market. The very positive
development in the PLA JV has been a key driver in Lactic Acid
& Specialties growth. In Incubator we see positive momentum as
growth in Q3 continued at a brisk pace as algae-based omega-3 is
seeing increased market receptiveness in the aquaculture
market.
As we indicated at the first half results, one of the key
priorities is to restore our core margin. Input cost inflation is
impacting our profitability, as there is a time lag of our sales
pricing catching up with the higher input prices. Sales price
increases have already been achieved for a number of contracts. In
addition to these price increases, we will be benefit from higher
volumes, and we will continue to drive operational
efficiencies.
We are encouraged by the continued strong sales pipeline and
sales growth momentum. The Advance 2025 strategy, intended to boost
growth, is clearly materializing”, commented Olivier Rigaud,
CEO.
Key financial highlights first nine months of
2021
- Net sales growth YTD was 7.6%; organic growth was 15.7% (16.3%
for core activities)
- Adjusted EBITDA YTD was € 113.5 million, an organic decrease of
2.4%
- Adjusted EBITDA margin YTD was 14.2% (14.1% for core
activities)
- Operating result YTD was € 95.5 million, an organic increase of
16.8%
|
€ million |
YTD 2021 |
YTD 2020 |
Total growth |
Organic growth |
|
Net sales |
797.6 |
741.2 |
7.6% |
15.7% |
|
Adjusted EBITDA |
113.5 |
128.4 |
-11.6% |
-2.4% |
|
Adjusted EBITDA margin |
14.2% |
17.3% |
|
|
|
Operating result |
95.5 |
89.4 |
6.8% |
16.8% |
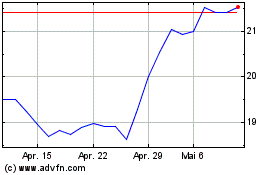
Corbion N.V (EU:CRBN)
Historical Stock Chart
Von Dez 2024 bis Jan 2025

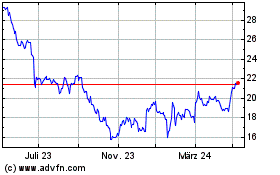
Corbion N.V (EU:CRBN)
Historical Stock Chart
Von Jan 2024 bis Jan 2025
