Corbion first half 2019 results
07 August 2019 - 7:00AM

Corbion first half 2019 results
Corbion reported H1 2019 sales of € 471.9 million, an
increase of 7.4% compared to H1 2018, mostly because of positive
currency effects. Organic sales growth was 0.9%. Adjusted EBITDA in
H1 2019 decreased by 0.1% to € 71.4 million due to 0.6% organic
growth, positive currency effects, more than offset by a negative
impact of the consolidation of the acquired Algae Ingredients plant
in Brazil.
“In the first half I was pleased to see a continued acceleration
in the organic sales growth rates for our important Food business
segment. Ingredient Solutions showed a mixed performance and ended
below the targeted sales growth bandwidth as the Biochemicals
business segment was facing significant headwinds in Electronics
and Agrochemicals. Our EBITDA margins remained at a healthy level
in both Food and Biochemicals. In Innovation Platforms we continued
on our growth trajectory in the first half. The Total Corbion PLA
joint venture saw a very strong performance in H1 2019, supported
by positive market developments.
I would like to thank everybody for their support in the past 5
years. It has been my privilege to have served as Corbion's CEO. As
I step down, I will be handing over to Olivier Rigaud. I would like
to wish Olivier and all Corbion colleagues all the best in taking
the business forward”, said Tjerk de Ruiter, CEO.
Key financial highlights first half of 2019
- Net sales organic growth was 0.9%; volume growth was 1.8%
- Adjusted EBITDA was € 71.4 million (H1 2018: € 71.5 million),
an organic increase of 0.6% (including 5.3% positive effect from
IFRS 16 implementation)
- Adjusted EBITDA margin was 15.1% (H1 2018: 16.3%)
- Adjustments at EBITDA level of € +3.4 million
- Operating result was € 46.4 million (H1 2018: 50.2
million)
- Free cash flow was € -29.3 million (H1 2018: €-16.3 million);
the decline is mostly due to the acquisition of Granotec do Brazil
(25 April 2019)
- Net debt/EBITDA at half-year end was 2.1x (year-end 2018:
1.8x)
| € million |
YTD 2019 |
YTD 2018 |
Total growth |
Organic growth |
| Net sales |
471.9 |
439.2 |
7.4% |
0.9% |
| Adjusted EBITDA |
71.4 |
71.5 |
-0.1% |
0.6% |
| Adjusted EBITDA
margin |
15.1% |
16.3% |
|
|
| Operating result |
46.4 |
50.2 |
-7.6% |
0.8% |
| ROCE |
10.0% |
14.9% |
|
|
- 20190807 1H19 Corbion press release ENG
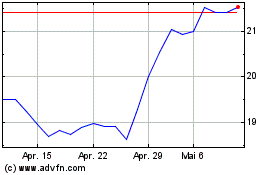
Corbion N.V (EU:CRBN)
Historical Stock Chart
Von Dez 2024 bis Jan 2025

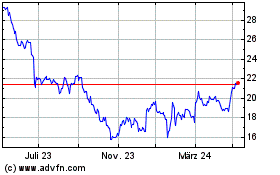
Corbion N.V (EU:CRBN)
Historical Stock Chart
Von Jan 2024 bis Jan 2025
