Bitcoin Hodlers Eye Long Term: $520 Million BTC Go To Cold Storage
13 März 2024 - 11:20AM
NEWSBTC
Bitcoin (BTC) danced into uncharted realms this week, breaking
barriers with a triumphant surge that pushed its value beyond the
$73,000 mark. The cryptocurrency world, once again, finds itself in
the midst of a thrilling price discovery phase, propelled by an
amalgamation of bullish indicators and a notable shift in investor
sentiments. Related Reading: Cardano (ADA) Price Alert: Analyst
Predicts 60% Rally In Next 7 Days Big Players Dominate The Crypto
Arena This week’s narrative unfolded on a stage dominated by two
juggernauts of the financial realm – BlackRock and MicroStrategy.
BlackRock, the undisputed titan of asset management, sent ripples
through the market by filing with the SEC, outlining tentative
plans to incorporate spot Bitcoin ETFs into its Global Allocation
Fund. Although in its infancy, this move has ignited hopes for
heightened demand, especially through BlackRock’s IBIT ETF, already
wielding a substantial 204,000 BTC. Enter MicroStrategy, the
steadfast evangelist of Bitcoin strategies. This corporate behemoth
poured more fuel into the already blazing fire by revealing the
acquisition of an additional 12,000 BTC. This move propelled
MicroStrategy’s total corporate Bitcoin holdings to an
awe-inspiring 205,000. Such maneuvers by industry giants underscore
the growing acceptance of Bitcoin as a legitimate and influential
asset class. While headlines may be dominated by institutional
power moves, peering into the intricate web of on-chain data
reveals the fascinating tapestry of investor conviction. Source:
IntoTheBlock $520 Million In Bitcoin In Transit IntoTheBlock’s
exchange netflow metric showcased a significant outflow of 4,470
BTC on March 11th. This substantial move, valued at over $520
million, saw coins making a pilgrimage from exchange wallets to
cold storage. The implication is clear – investors, despite
reaching record highs, are playing the long game, stashing their
digital treasures in cold storage rather than opting for immediate
profits. This strategic move, coupled with a surge in demand,
paints a bullish picture of supply and demand dynamics. Total
crypto market cap at $2.6 trillion on the daily chart:
TradingView.com Drawing parallels from the pages of history, the
recent exodus from exchanges echoes a similar event on February
27th. On that day, a netflow of 8,050 BTC correlated with a
breathtaking 26% surge in prices within 48 hours. If this
historical rhyming persists, the recent outflow might just be the
wind beneath Bitcoin’s wings, propelling it to conquer the $75,000
resistance level in the imminent days. As the stage is set for
Bitcoin’s next act, technical indicators join the ensemble, singing
harmoniously in the chorus of a potential breakout. GIOM
data. Source: IntoTheBlock Enjoying Profits IntoTheBlock’s “Global
In/Out of the Money” chart offers a visual feast, showcasing that
in this era of Bitcoin’s price discovery, nearly all of the 52
million holder addresses are now enjoying profits. This absence of
selling pressure, combined with the rising institutional tide,
paints a canvas of explosive potential. Related Reading: Crypto
Fever: Bitcoin Smashes Records, Approaching $73,000 Milestone While
the bulls eye the lofty target of $75,000, technical analysis
points to a potential support station at $69,000. This zone, a
fortress where over 6.6 million holders acquired nearly 3 million
BTC, could stand as a formidable psychological barricade in the
face of any price pullback. At the time of writing, Bitcoin is fast
approaching the highly-coveted $74K level, trading at $73,529, up
2% and 10% in the daily and weekly timeframes, data by Coingecko
shows. Featured image from Unsplash, chart from TradingView
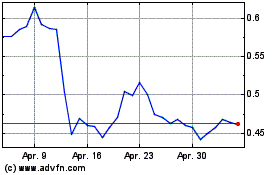
Cardano (COIN:ADAUSD)
Historical Stock Chart
Von Mär 2024 bis Apr 2024

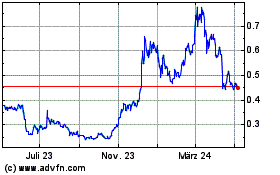
Cardano (COIN:ADAUSD)
Historical Stock Chart
Von Apr 2023 bis Apr 2024
