S&P 500 Expected to Be Volatile This Week
11 Dezember 2023 - 11:21AM
Finscreener.org
On Friday, the
S&P 500 achieved a
new peak for the year, bolstered by the latest jobs report and
University of Michigan consumer survey data, which indicated a
robust economy and easing inflation. The development has heightened
optimism for the economyU+02019s potential U+02019soft
landing.U+02019
The S&P 500 experienced a
0.41% increase, closing at 4,604.37, while the Nasdaq Composite edged up by 0.45%, finishing at 14,403.97.
The
Dow Jones Industrial Average also saw gains, rising by 130.49 points, or
0.36%, to conclude at 36,247.87.
Last week, the S&P 500
posted its highest yearly close and surpassed its 2023 intraday
high set in July, reaching over 4,609 during afternoon trading on
Friday. It marks an approximate 20% increase for the year, with the
index at its highest since March 2022. All major averages ended the
week on a positive
note, with the broad market index up by 0.2% and the Dow
slightly higher, marking their longest winning streak since 2019.
The Nasdaq climbed 0.7%.
Michael Arone, Chief Investment
Strategist at State Street Global Advisors, noted that the
employment data reflects an economy far from recession. He
emphasized that declining inflation expectations and improving
consumer sentiment are encouraging signs supporting the soft
landing scenario.
"The trajectory for stocks and
risk assets remains upbeat as long as the soft landing scenario
holds," he stated. He highlighted that factors like decreasing
inflation and an improved balance between labor supply and demand,
without a significant rise in unemployment, are positive indicators
for market sentiment.
Jobs report and interest
rates
Last Tuesday, the Job Openings
and Labor Turnover Survey (JOLTS) revealed the lowest labor market
figures since March 2021, with job openings dropping to 8.773
million against an expected 9.4 million.
On the flip side, continuing
claims recently reached a two-year peak and showed a significant
drop of 64,000 from the prior week — the most substantial decrease
since July. It marks only the second reduction in continuing claims
in the past 11 weeks, suggesting a trend towards a softer job
market, although future data may show some
fluctuations.
In further positive news for
optimistic market watchers, there was an upward adjustment in
productivity to 5.2% from the initially reported 4.9%, alongside a
decrease in unit labor costs to 2.6% from 3.2%.
Yields on the 10-year Treasury
reached a three-month low of 4.106% on Friday but have since
climbed by approximately 12 basis points to 4.25% following the
latest employment data. This rise, occurring after a roughly 90
basis point drop in 10-year yields over seven weeks, hints that the
decline may have been too rapid.
Although the increase
doesnU+02019t change the recent downward trend, it raises questions
about whether market expectations regarding the trajectory of
yields and potential Federal Reserve rate cuts next year are overly
optimistic.
As for the Federal
ReserveU+02019s future actions, BloombergU+02019s probability
estimates for a rate cut next year have decreased over the past
week. Last month, the likelihood of a cut at the March FOMC meeting
was around 76%, but this has now reduced to 48%.
While no surprises are
anticipated at the upcoming FOMC meeting, Federal Reserve Chair
Jerome Powell might adopt a more hawkish tone than the market
currently expects. The Fed will also have new inflation data to
consider before announcing its rate policy, with NovemberU+02019s
Consumer Price Index (CPI) due on Tuesday morning and the Producer
Price Index (PPI) set for release on Wednesday.
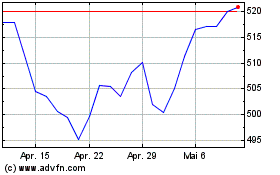
SPDR S&P 500 (AMEX:SPY)
Historical Stock Chart
Von Apr 2024 bis Mai 2024

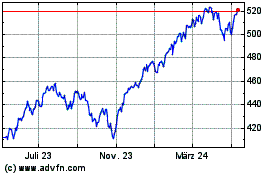
SPDR S&P 500 (AMEX:SPY)
Historical Stock Chart
Von Mai 2023 bis Mai 2024
