S&P 500 Index: Should You Expect a Santa Claus Rally In 2023?
04 Dezember 2023 - 11:15AM
Finscreener.org
The
S&P 500 saw an
increase of about 1% last week, suggesting a period of bullish
consolidation after the significant rally in November, where the
index climbed 8.9%.
However, itU+02019s premature to
draw firm conclusions. Notably, over the past couple of days, there
has been a noticeable pattern: technology stocks are
underperforming while small caps are excelling.
For instance, on Friday,
the Nasdaq Composite, which has been the top performer among major
indexes year-to-date, recorded the smallest gain (+0.56%), while
the Russell 2000, the lowest performer year-to-date, showed the
highest increase (+2.44%). This shift might indicate a potential
trend towards investing in small caps or value stocks, possibly due
to a belief that thereU+02019s more potential for relative gains in
these undervalued sectors.
One hypothesis for this trend is
that if interest rates decrease and the economy is on track for a
gentle deceleration, the undervalued small caps might be set for a
significant rebound.
However, an opposing view
suggests small caps have been underperforming for valid reasons and
may represent a risky investment. As it stands, itU+02019s a
development worth watching, and time will ultimately reveal the
outcome of these market dynamics.
Will this momentum continue for the S&P 500
index?
Stocks are reaching their daily
highs, coinciding with a notable drop in 10-year yields to their
lowest in two months, now at 4.22%. The decline in yields seems to
be a reaction to comments made late last week by Federal Reserve
Chair Jerome Powell.
Although Powell didnU+02019t
offer any new insights, stating itU+02019s premature to say that
policy settings
are adequately aligned to meet their goals, investors seemed to
latch onto his remark that monetary policy is firmly in restrictive
territory.
Consequently, the SPX, DJI, and
RUT are all poised to close at their highest levels in several
months. The SPX is below the 4,600 resistance level, leaving market
watchers curious if it will surpass the threshold this
week.
Meanwhile, the DJI has already
achieved a 52-week high, with additional gains on Friday, and the
RUT is revitalizing to two-month highs, aligning with the decline
in 10-year yields.
Considering these factors and a
generally bullish market trend typical of this season, the market
may continue to trend upward next week.
However, a couple of
uncertainties linger:
Will the SPXU+02019s struggle to
break past 4,600 dampen the upward momentum in the RUT/DJI?
and
What impact will next
FridayU+02019s Nonfarm Payrolls report have on this trend,
particularly if it shows robust figures?
Remembering that stocks reacted
favorably to last monthU+02019s weaker-than-expected nonfarm
payrolls report (150K vs. the 160K estimate, with unemployment
rising to 3.9%), investors might prefer figures that hint at a
relaxing labor market.
Interest rate hikes on the cards?
BloombergU+02019s data indicates
that the likelihood of the Federal Reserve lowering interest rates
in either their December or January FOMC meeting is currently at
9.2%. This contrasts with a higher 12.8% chance of increased rates,
as noted last Friday.
Observing these week-over-week
probability shifts offers insight into market reactions to recent
economic data and comments from the Fed. According to
BloombergU+02019s forecasts, thereU+02019s a significant chance
(over 65% probability) of a rate cut at the May 2024 FOMC
meeting.
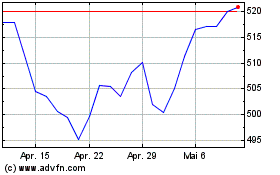
SPDR S&P 500 (AMEX:SPY)
Historical Stock Chart
Von Apr 2024 bis Mai 2024

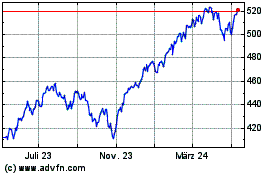
SPDR S&P 500 (AMEX:SPY)
Historical Stock Chart
Von Mai 2023 bis Mai 2024
