false
0001528356
0001528356
2024-03-13
2024-03-13
iso4217:USD
xbrli:shares
iso4217:USD
xbrli:shares
UNITED STATES
SECURITIES AND EXCHANGE COMMISSION
Washington, D.C. 20549
FORM 8-K
CURRENT REPORT
Pursuant to Section 13 or 15(d) of the Securities
Exchange Act of 1934
Date of Report (Date of earliest event reported):
March 13, 2024
GENIE ENERGY LTD.
(Exact name of registrant as specified in its charter)
| Delaware |
|
1-35327 |
|
45-2069276 |
|
(State or other jurisdiction
of incorporation) |
|
(Commission File Number) |
|
(IRS Employer
Identification No.) |
|
520 Broad Street
Newark, New Jersey |
|
07102 |
| (Address of principal executive offices) |
|
(Zip Code) |
Registrant’s telephone number, including
area code: (973) 438-3500
Not Applicable
(Former name or former address, if changed since
last report.)
Check the appropriate box below if the Form 8-K filing is intended
to simultaneously satisfy the filing obligation of the registrant under any of the following provisions (see General Instruction A.2.
below):
| ☐ | Written
communications pursuant to Rule 425 under the Securities Act (17 CFR 230.425) |
| ☐ | Soliciting
material pursuant to Rule 14a-12 under the Exchange Act (17 CFR 240.14a-12) |
| ☐ | Pre-commencement
communications pursuant to Rule 14d-2(b) under the Exchange Act (17 CFR 240.14d-2(b)) |
| ☐ | Pre-commencement
communications pursuant to Rule 13e-4(c) under the Exchange Act (17 CFR 240.13e-4(c)) |
Securities registered pursuant to Section 12(b)-2 of the Exchange Act:
| Title of each class |
|
Trading Symbol |
|
Name of each exchange on
which registered |
| Class B common stock, par value $.01 per share |
|
GNE |
|
New York Stock Exchange |
Indicate by check mark whether the registrant
is an emerging growth company as defined in Rule 405 of the Securities Act of 1933 (§230.405 of this chapter) or Rule 12b-2 of the
Securities Exchange Act of 1934 (§240.12b-2 of this chapter).
Emerging growth company ☐
If an emerging growth company, indicate by check
mark if the registrant has elected not to use the extended transition period for complying with any new or revised financial accounting
standards provided pursuant to Section 13(a) of the Exchange Act. ☐
Item 7.01. Regulation
FD
On March 13, 2024, the slide presentation (the
“Presentation”) attached hereto as Exhibit 99.1 will be provided to certain investors. The Presentation will also be available
on the Registrant’s website at the following link: http://genie.com/investors/presentations/.
The Registrant is furnishing the information contained
in this Report, including Exhibit 99.1, pursuant to Item 7.01 of Form 8-K promulgated by the Securities and Exchange Commission (the “SEC”).
This information shall not be deemed to be “filed” with the SEC or incorporated by reference into any other filing with the
SEC. In addition, the Presentation contains statements intended as “forward-looking statements” that are subject to the cautionary
statements about forward-looking statements set forth in the Presentation.
Item 9.01 Financial Statements and Exhibits.
(d) Exhibits.
SIGNATURE
Pursuant to the requirements of the Securities
Exchange Act of 1934, the Registrant has duly caused this report to be signed on its behalf by the undersigned hereunto duly authorized.
| |
GENIE ENERGY LTD. |
| |
|
|
| |
By: |
/s/ Michael Stein |
| |
Name: |
Michael Stein |
| |
Title: |
Chief Executive Officer |
Dated: March 13, 2024
EXHIBIT INDEX
Exhibit
Number |
|
Document |
| 99.1 |
|
Investor Presentation |
| 104 |
|
Cover Page Interactive Data File, formatted in Inline XBRL document |
3
Exhibit 99.1

Genie Energy Ltd (NYSE: GNE)
Investor Presentation March 2024

Safe Harbor Statement 2 This presentation contains forward - looking statements. Statements that are not historical facts are forward - looking statements and such forward - looking statements are statements made pursuant to the Safe Harbor Provisions of the Private Securities Litigation Reform Act of 1995. Examples of forward - looking statements include: • statements about Genie’s and its divisions’ future performance; • projections of Genie’s and its divisions’ results of operations or financial condition; and • statements regarding Genie’s plans, objectives or goals, including those relating to its strategies, initiatives, competition, acquisitions, dispositions and/or its products and offerings. Words such as
"believe," "anticipate," "plan," "expect," "intend," "target," "estimate," "project," "predict," "forecast," "guideline," "aim," "will," "should," “likely,” "continue" and similar expressions are intended to identify forward - looking statements but are not the exclusive means of identifying such statements. Readers are cautioned not to place undue reliance on these forward - looking statements and all such forward - looking statements are qualified in their entirety by reference to the following cautionary statements. Forward - looking statements are based on Genie’s current expectations, estimates and assumptions and because forward - looking statements address future results, events and conditions, they, by their very nature, involve inherent risks and uncertainties, many of which are unforeseeable and beyond the Genie’s control. Such known and unknown risks, uncertainties and other factors may cause Genie’s actual results, performance or other achievements to differ materially from the anticipated results, performance or achievements expressed, projected or implied by these forward - looking statements. These factors include those discussed under the headings "Risk Factors" and “Management’s Discussion and Analysis of Financial Condition and Results of Operations in Genie’s periodic filings made with the Securities and Exchange Commission. Genie cautions that such factors are not exhaustive and that other risks and uncertainties may cause actual results to differ materially from those in forward - looking statements. Forward - looking statements speak only as of the date they are made and are statements of Genie’s current expectations concerning future results, events and conditions and Genie is under no obligation to update any of the forward - looking statements, whether as a result of new information, future events or otherwise.

Genie Energy At A Glance 1 Based on stock price as of 3/11/23 $429M Revenue 34.1% Gross Margin ~1.6% Dividend Yield 1 Genie Energy Ltd. Genie Retail Energy (GRE) Genie Renewables (GREW) ~4.9X EV 1 /Adj. EBITDA 3 $6.27 Net Cash /share ($0 Debt) Genie is a leading provider of electricity, natural gas and green energy to retail and commercial customers in the U . S . 2023 Financial Highlights

Track Record of Driving Shareholder Returns Recent Market Value * Market Value Company $447 10/28/11 (Spin - off) Genie Energy (NYSE: GNE) $956M $53M (9/14/09) IDT Corp (NYSE: IDT) $6M 9/14/09 (Spin - off) IDW Media (OTCBB: IDW) $2,164M (sold to VZ Feb’18) 7/31/13 (Spin - off) Straight Path Communications (formerly NYSE: STRP) $41M 3/26/18 (Spin - off) Rafael Holdings (NYSE: RFL) $46M 6/1/16 (Spin - off) Zedge (NYSE American: ZDGE) $3,660M $53M Total * Based on market values as of 3/11/23 or as shown Experienced Management Team/Board CEO CFO Chairman Lead Ind. Dir. Michael Stein Avi Goldin Howard Jonas Wesley Perry 4

Investment Highlights Large market opportunity Attractive Growth Profile Portfolio & Risk Management Are Differentiators Strong Balance Sheet/Cash Flow Provide Strategic Flexibility 5

LARGE MARKET OPPORTUNITY

Our Opportunity: Selling Electricity & Natural Gas in De - Regulated U.S. Markets… • GRE has a presence in 18/28 states + Washington D.C. • Additional states considering de - regulation in various forms 7

…And in Developing, Owning & Operating Solar Farms *Solar Energy Industry Association Commercial >600K Commercial Facilities 1% Penetration Utility Components Supply chain issues receding Community 7% CAGR thru 2028* Favorable Regulatory Environment “In the next half decade, the long - term tax incentives and manufacturing provisions in the IRA provide the market certainty needed to boost expected solar deployment by 38% compared to pre - IRA projections.” - Solar Energy Industry Association, 2023 >5% * % of Total US Electricity Generation (through 4Q23) ~53% * of new grid capacity (4Q23) 177GWdc * Installed Capacity (through 4Q23) 8

ATTRACTIVE GROWTH PROFILE

Our Organic Growth Strategy is… Retail Solar • Take share in existing markets • Opportunistically expand retail book geographically • Introduce new products • Focus on customer retention to manage churn • Originate, develop, own & operate solar farms • Differentiate solar through vertical integration 10

…Complemented by Inorganic Growth 01 Retail Acquisitions – customer books or companies 02 Direct purchase, development and operation of solar farms by GREW 03 General Partner for Sunlight Energy Investments - owned solar farms 04 Invest in new renewable technologies 11
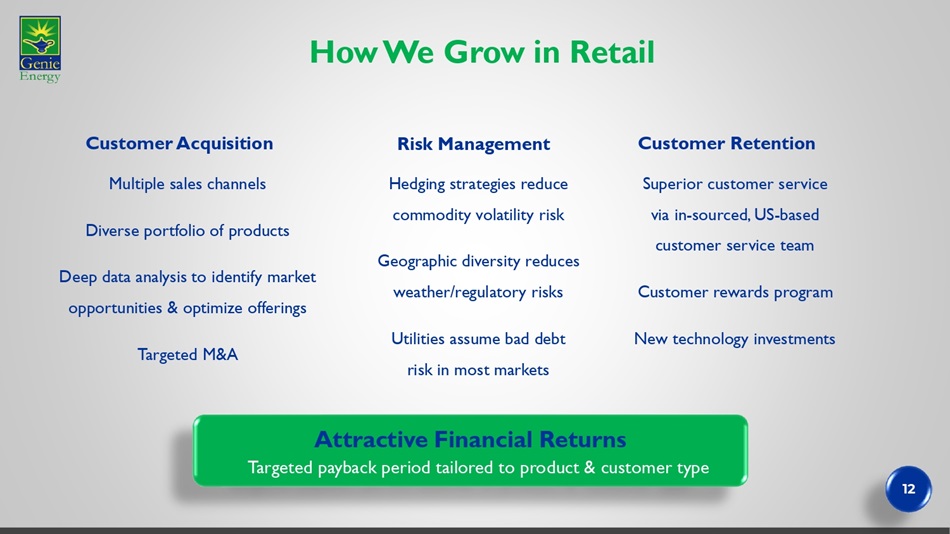
Attractive Financial Returns Targeted payback period tailored to product & customer type How We Grow in Retail Multiple sales channels Diverse portfolio of products Deep data analysis to identify market opportunities & optimize offerings Targeted M&A Hedging strategies reduce commodity volatility risk Geographic diversity reduces weather/regulatory risks Utilities assume bad debt risk in most markets Superior customer service via in - sourced, US - based customer service team Customer rewards program New technology investments Customer Acquisition Risk Management Customer Retention 12

How We Grow in Solar: Vertical Integration GREW Genie Solar Origination, development, construction Portfolio management & operations Third Party Services Sunlight Energy Investments Investment vehicle Third - party Capital 13 Development Pipeline* Operational Total Construction Permitting Site Control 10 6 72 9 98 Potential MW 2 1 10 1 14 Project Count *as of 12/31/23

Portfolio Businesses Includes: • Early investments in non - core businesses • Attractive long - term potential Portfolio Highlight: Diversegy One of the nation’s leading retail energy brokerage firms • Sales channels: sales agents; brokers; commercial sales orgs • Customers: commercial, industrial and government orgs • Competitive advantages: robust technology platform; advisory/audits (identify efficiency/cost savings) transparent reporting; best - in - class support; large energy supplier network; nationally licensed • Recurring revenue stream 182% 2023 Revenue Growth 14

PORTFOLIO AND RISK MANAGEMENT

» Hedged customer book heading into colder months » Long Energy in U.S. and Europe 2H21 » Exited UK - returned cash to U.S. Global Events: Energy Crisis in Europe » UK energy market disintegrates » Long Energy » Portfolio management of low margin customers in U.S. drives strong margins GRE » Long Energy (most competitors unhedged) » Market decayed, value of hedges > value of business » Sold/exited most of business Sweden Hedging Program Provided Portfolio Optionality » Record gross margin, Adjusted EBITDA & cash flow – not sustainable, but significantly strengthened balance sheet and repositioned GNE for significantly higher normalized results in 2023 and beyond » Paid dividends, repurchased common/preferred stock & provided investment capital for attractive projects 16 Hedging Program: How We Opportunistically Drove Massive Returns for 2022

FINANCIAL SUMMARY

GNE: Significant Margin Expansion and Adj. EBITDA Growth Lead to Higher Baselines 25% 30% 35% 40% 45% 50% 55% $0 $100 $200 $300 $400 2023 Gross Margin $m 2019 2020 2021 2022 *Non - GAAP measures – see reconciliation to closest GAAP measures in the Appendix 18 » Growth in 2023 increased our baseline Adj. EBITDA run rate to $40 - 50M from $25 - 30M in 2021 2023 OI incl. $45M non - cash charge to fund captive insurance company’s historical premiums Revenue Operating Income Adj. EBITDA* 2022 capitalized on energy pricing volatility to drive record margins/Adj. EBITDA & CF

Driven by GRE Strength* 25% 30% 35% 40% 45% 50% 55% 60% $0 $50 $100 $150 $200 $250 $300 $350 2019 2020 2021 2022 2023 Revenue Op. Inc. Adj. EBITDA* Gross Margin $m $400 *Non - GAAP measures – See reconciliation to closest GAAP measures in Appendix 19

GREW: Positioned for Future Growth * 0% 5% 30% 25% 20% 15% 10% 40% 35% - $5 $5 $15 $25 2019 2020 2021 2022 2023 Revenue Op. Inc. Adj. EBITDA* Gross Margin $m $35 2023/2024 » Project acquisition and development » Investing in internal capabilities e.g. expanding salesforce Pre - 2022: Third Party Services Only 2022+: Project ownership & development 20 *Non - GAAP measures – See reconciliation to closest GAAP measures in Appendix
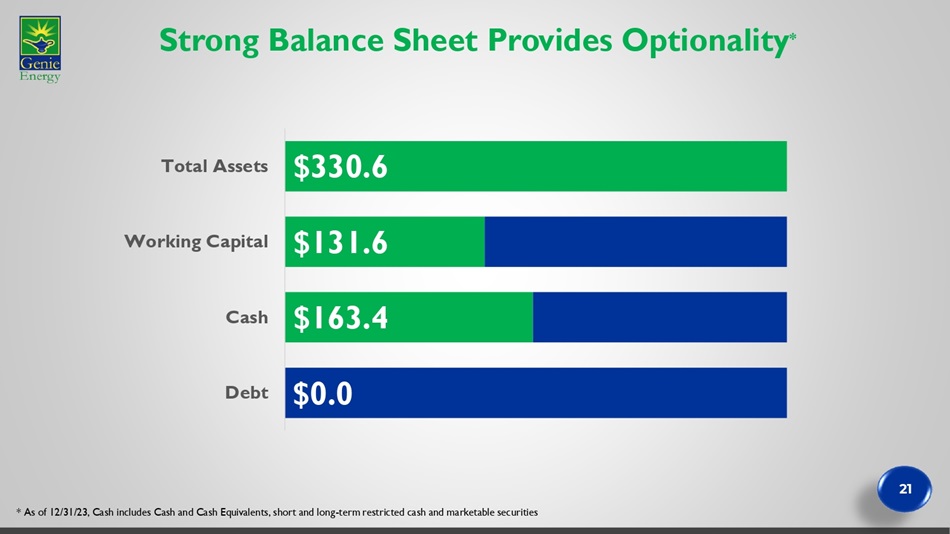
Strong Balance Sheet Provides Optionality * * As of 12/31/23, Cash includes Cash and Cash Equivalents, short and long - term restricted cash and marketable securities $0.0 $163.4 $131.6 $330.6 Debt Cash Working Capital Total Assets 21

Valuation Comps * * As of 12/31/23 unless noted $17.15 a/o 3/11/24 GNE Stock Price $447M a/o 3/11/24 GNE Market Cap $163M GNE Cash ($0 debt) $283M GNE Enterprise Value $58M GNE Adj. EBITDA 4.9X a/o 3/11/24 GNE EV/EBITDA Multiple 8.3X a/o 3/11/24 GNE PE Ratio 20.2X DJ Utility Index PE $1,084M Implied GNE Market Cap EV/EBITDA Multiples : 13.1 Utility Industry Current $763M Implied GNE EV Implied GNE Stock Prices: $35.53 EV/EBITDA $41.61 PE 22

Capital Allocation Strategy Drives Shareholder Returns Common stock dividend (currently $0.075/quarter) Common Stock Opportunities for outsized growth potential (e.g. Solar) Select M&A Retail Customer acquisition New retail markets New retail products Internal Reinvestment Corporate Development Dividend Share repurchases 23

Summary Large market opportunity Attractive Growth Profile Portfolio & Risk Management Are Differentiators Strong Balance Sheet/Cash Flow Provide Strategic Flexibility 24

THANK YOU! Michael Stein Chief Executive Officer IR Contact: Brian Siegel Senior Managing Director Hayden IR (346) 396 - 8696 brian@haydenir.com Avi Goldin Chief Financial Officer

APPENDIX: Non - GAAP Measures Use of Non - GAAP Measures Adjusted EBITDA, defined as earnings (loss) before interest, taxes, depreciation and amortization, stock compensation expense, transaction - related expenses and other non - recurring expenses, and non - GAAP net income and EPS (which adjust out stock compensation expense, transaction - related expenses and other non - recurring expenses from GAAP net income and EPS), represent measures that we believe are customarily used by investors and analysts to evaluate the financial performance of companies in addition to the GAAP measures we present. Our management also believes these measures are useful in evaluating our core operating results. However, these are not measures of financial performance under GAAP and should not be considered an alternative to net income or operating income/margin as an indicator of our operating performance or to net cash provided by operating activities as a measure of our liquidity.

APPENDIX: Financials * Excludes the impact of Texas Winter Storm Uri in 2021 and Genie Retail International – see reconciliation to closest GAAP measure on next slide. ** Excludes the one - time $45.1mm non - cash charge for captive insurance reserve – see reconciliation to closest GAAP measure on next slide. Genie Consolidated 2023 2022 2021 2020 2019 $ (000's) $409,880 $303,970 $311,830 $304,450 $286,610 Revenue GRE $18,830 $11,570 $7,510 $25,210 $12,090 GREW $428,710 $315,540 $319,340 $329,660 $298,700 Total Revenue $266,520 $150,990 $210,950* $216,140 $205,990 COGS GRE $15,980 $9,770 $4,730 $23,000 $10,140 GREW $282,500 $160,760 $215,680 $239,140 $216,120 Total COGS $146,210 $154,780 $103,660 $90,520 $82,570 Gross Profit 34.1% 49.1% 32.5% 27.5% 27.6% Gross Margin $91,110** $76,970 $66,040 $61,860 $63,840 SG&A $58,220 $83,220 $41,370* $32,070* $21,790* Adjusted EBITDA

Reconciliation Tables Slides 3,18,26 – Genie Energy Financials - Consolidated 2023 2022 2021 2020 2019 $428,710 $315,540 $323,270 $338,430 $300,100 Consolidated revenue (as reported) -- - -- - $3,930 $8,770 $1,400 Less: Revenue of Genie Japan $428,710 $315,540 $319,340 $329,660 $298,700 Adjusted consolidated revenue $146,210 $154,780 $91,640 $91,480 $82,330 Consolidated gross profit (as reported) -- - -- - ($2,020) $960 ($240) Less Gross profit (loss) of GREI -- - -- - ($10,000) -- - -- - Gross loss from Winter Storm Uri $146,210 $154,780 $103,660 $90,520 $82,570 Adjusted consolidated gross profit 34.1% 49.1% 32.5% 27.5% 27.6% Adjusted consolidated gross profit margin $9,880 $77,740 $24,530 $23,140 $12,620 Income from Operations $2,780 $2,970 $2,820 $970 $1,050 Add Back: Non - Cash Compensation $440 $390 $440 $1,100 $1,960 Depreciation & Amortization $20 $2,070 -- - $1,400 $400 Impairment $45,090 -- - -- - -- - -- - Captive Insurance Reserve $58,220 $83,160 $27,780 $26,610 $16,020 Consolidated Adjusted EBITDA (as reported) -- - -- - ($3,360) ($3,340) ($4,500) Less: Adjusted EBITDA of GREI -- - -- - ($10,000) -- - -- - Loss from Winter Storm Uri -- - -- - ($180) ($2,120) ($1,260) Adjusted EBITDA of GOGAS $58,220 $83,160 $41,320 $32,070 $21,790 Consolidated Adjusted EBITDA

Reconciliation Tables Slide 19 – GRE Financial Highlights 2023 2022 2021 2020 2019 $409,880 $303,970 $311,830 $304,450 $286,610 GRE revenue (as reported) $143,360 $152,980 $90,880 $88,310 $80,620 GRE gross profit (as reported) -- - -- - ($10,000) -- - -- - Less Gross loss from Winter Storm Uri $143,360 $152,980 $100,880 $88,310 $80,620 Adjusted GRE gross profit 35.0% 50.3% 32.4% 29.0% 28.1% Adjusted GRE gross profit margin $71,910 $92,560 $34,690 $36,510 $27,180 Income (Loss) from Operations $1,020 $950 $930 $460 $460 Add Back: Non - Cash Compensation $330 $340 $380 $460 $700 Depreciation & Amortization -- - -- - -- - -- - -- - Impairment $73,270 -- - $93,840 -- - $36,000 ($10,000) $37,440 $28,340 GRE Adjusted EBITDA (as reported) Less Loss from Winter Storm Uri $73,270 $93,840 $46,000 $37,440 $28,340 GRE Adjusted EBITDA
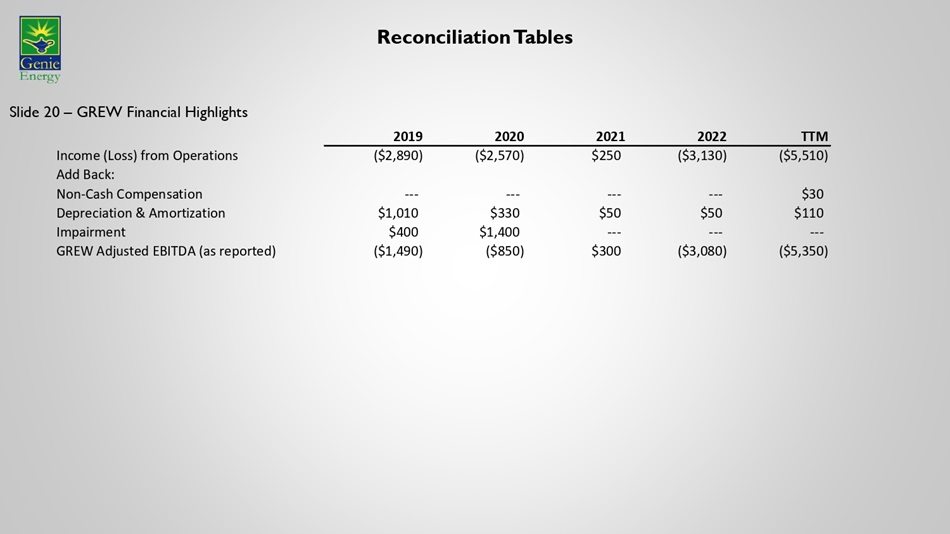
Reconciliation Tables Slide 20 – GREW Financial Highlights TTM 2022 2021 2020 2019 ($5,510) ($3,130) $250 ($2,570) ($2,890) Income (Loss) from Operations Add Back: $30 -- - -- - -- - -- - Non - Cash Compensation $110 $50 $50 $330 $1,010 Depreciation & Amortization -- - -- - -- - $1,400 $400 Impairment ($5,350) ($3,080) $300 ($850) ($1,490) GREW Adjusted EBITDA (as reported)
v3.24.0.1
| X |
- DefinitionBoolean flag that is true when the XBRL content amends previously-filed or accepted submission.
| Name: |
dei_AmendmentFlag |
| Namespace Prefix: |
dei_ |
| Data Type: |
xbrli:booleanItemType |
| Balance Type: |
na |
| Period Type: |
duration |
|
| X |
- DefinitionFor the EDGAR submission types of Form 8-K: the date of the report, the date of the earliest event reported; for the EDGAR submission types of Form N-1A: the filing date; for all other submission types: the end of the reporting or transition period. The format of the date is YYYY-MM-DD.
| Name: |
dei_DocumentPeriodEndDate |
| Namespace Prefix: |
dei_ |
| Data Type: |
xbrli:dateItemType |
| Balance Type: |
na |
| Period Type: |
duration |
|
| X |
- DefinitionThe type of document being provided (such as 10-K, 10-Q, 485BPOS, etc). The document type is limited to the same value as the supporting SEC submission type, or the word 'Other'.
| Name: |
dei_DocumentType |
| Namespace Prefix: |
dei_ |
| Data Type: |
dei:submissionTypeItemType |
| Balance Type: |
na |
| Period Type: |
duration |
|
| X |
- DefinitionAddress Line 1 such as Attn, Building Name, Street Name
| Name: |
dei_EntityAddressAddressLine1 |
| Namespace Prefix: |
dei_ |
| Data Type: |
xbrli:normalizedStringItemType |
| Balance Type: |
na |
| Period Type: |
duration |
|
| X |
- Definition
+ References
+ Details
| Name: |
dei_EntityAddressCityOrTown |
| Namespace Prefix: |
dei_ |
| Data Type: |
xbrli:normalizedStringItemType |
| Balance Type: |
na |
| Period Type: |
duration |
|
| X |
- DefinitionCode for the postal or zip code
| Name: |
dei_EntityAddressPostalZipCode |
| Namespace Prefix: |
dei_ |
| Data Type: |
xbrli:normalizedStringItemType |
| Balance Type: |
na |
| Period Type: |
duration |
|
| X |
- DefinitionName of the state or province.
| Name: |
dei_EntityAddressStateOrProvince |
| Namespace Prefix: |
dei_ |
| Data Type: |
dei:stateOrProvinceItemType |
| Balance Type: |
na |
| Period Type: |
duration |
|
| X |
- DefinitionA unique 10-digit SEC-issued value to identify entities that have filed disclosures with the SEC. It is commonly abbreviated as CIK. Reference 1: http://www.xbrl.org/2003/role/presentationRef
-Publisher SEC
-Name Exchange Act
-Number 240
-Section 12
-Subsection b-2
| Name: |
dei_EntityCentralIndexKey |
| Namespace Prefix: |
dei_ |
| Data Type: |
dei:centralIndexKeyItemType |
| Balance Type: |
na |
| Period Type: |
duration |
|
| X |
- DefinitionIndicate if registrant meets the emerging growth company criteria. Reference 1: http://www.xbrl.org/2003/role/presentationRef
-Publisher SEC
-Name Exchange Act
-Number 240
-Section 12
-Subsection b-2
| Name: |
dei_EntityEmergingGrowthCompany |
| Namespace Prefix: |
dei_ |
| Data Type: |
xbrli:booleanItemType |
| Balance Type: |
na |
| Period Type: |
duration |
|
| X |
- DefinitionCommission file number. The field allows up to 17 characters. The prefix may contain 1-3 digits, the sequence number may contain 1-8 digits, the optional suffix may contain 1-4 characters, and the fields are separated with a hyphen.
| Name: |
dei_EntityFileNumber |
| Namespace Prefix: |
dei_ |
| Data Type: |
dei:fileNumberItemType |
| Balance Type: |
na |
| Period Type: |
duration |
|
| X |
- DefinitionTwo-character EDGAR code representing the state or country of incorporation.
| Name: |
dei_EntityIncorporationStateCountryCode |
| Namespace Prefix: |
dei_ |
| Data Type: |
dei:edgarStateCountryItemType |
| Balance Type: |
na |
| Period Type: |
duration |
|
| X |
- DefinitionThe exact name of the entity filing the report as specified in its charter, which is required by forms filed with the SEC. Reference 1: http://www.xbrl.org/2003/role/presentationRef
-Publisher SEC
-Name Exchange Act
-Number 240
-Section 12
-Subsection b-2
| Name: |
dei_EntityRegistrantName |
| Namespace Prefix: |
dei_ |
| Data Type: |
xbrli:normalizedStringItemType |
| Balance Type: |
na |
| Period Type: |
duration |
|
| X |
- DefinitionThe Tax Identification Number (TIN), also known as an Employer Identification Number (EIN), is a unique 9-digit value assigned by the IRS. Reference 1: http://www.xbrl.org/2003/role/presentationRef
-Publisher SEC
-Name Exchange Act
-Number 240
-Section 12
-Subsection b-2
| Name: |
dei_EntityTaxIdentificationNumber |
| Namespace Prefix: |
dei_ |
| Data Type: |
dei:employerIdItemType |
| Balance Type: |
na |
| Period Type: |
duration |
|
| X |
- DefinitionLocal phone number for entity.
| Name: |
dei_LocalPhoneNumber |
| Namespace Prefix: |
dei_ |
| Data Type: |
xbrli:normalizedStringItemType |
| Balance Type: |
na |
| Period Type: |
duration |
|
| X |
- DefinitionBoolean flag that is true when the Form 8-K filing is intended to satisfy the filing obligation of the registrant as pre-commencement communications pursuant to Rule 13e-4(c) under the Exchange Act. Reference 1: http://www.xbrl.org/2003/role/presentationRef
-Publisher SEC
-Name Exchange Act
-Number 240
-Section 13e
-Subsection 4c
| Name: |
dei_PreCommencementIssuerTenderOffer |
| Namespace Prefix: |
dei_ |
| Data Type: |
xbrli:booleanItemType |
| Balance Type: |
na |
| Period Type: |
duration |
|
| X |
- DefinitionBoolean flag that is true when the Form 8-K filing is intended to satisfy the filing obligation of the registrant as pre-commencement communications pursuant to Rule 14d-2(b) under the Exchange Act. Reference 1: http://www.xbrl.org/2003/role/presentationRef
-Publisher SEC
-Name Exchange Act
-Number 240
-Section 14d
-Subsection 2b
| Name: |
dei_PreCommencementTenderOffer |
| Namespace Prefix: |
dei_ |
| Data Type: |
xbrli:booleanItemType |
| Balance Type: |
na |
| Period Type: |
duration |
|
| X |
- DefinitionTitle of a 12(b) registered security. Reference 1: http://www.xbrl.org/2003/role/presentationRef
-Publisher SEC
-Name Exchange Act
-Number 240
-Section 12
-Subsection b
| Name: |
dei_Security12bTitle |
| Namespace Prefix: |
dei_ |
| Data Type: |
dei:securityTitleItemType |
| Balance Type: |
na |
| Period Type: |
duration |
|
| X |
- DefinitionName of the Exchange on which a security is registered. Reference 1: http://www.xbrl.org/2003/role/presentationRef
-Publisher SEC
-Name Exchange Act
-Number 240
-Section 12
-Subsection d1-1
| Name: |
dei_SecurityExchangeName |
| Namespace Prefix: |
dei_ |
| Data Type: |
dei:edgarExchangeCodeItemType |
| Balance Type: |
na |
| Period Type: |
duration |
|
| X |
- DefinitionBoolean flag that is true when the Form 8-K filing is intended to satisfy the filing obligation of the registrant as soliciting material pursuant to Rule 14a-12 under the Exchange Act. Reference 1: http://www.xbrl.org/2003/role/presentationRef
-Publisher SEC
-Name Exchange Act
-Section 14a
-Number 240
-Subsection 12
| Name: |
dei_SolicitingMaterial |
| Namespace Prefix: |
dei_ |
| Data Type: |
xbrli:booleanItemType |
| Balance Type: |
na |
| Period Type: |
duration |
|
| X |
- DefinitionTrading symbol of an instrument as listed on an exchange.
| Name: |
dei_TradingSymbol |
| Namespace Prefix: |
dei_ |
| Data Type: |
dei:tradingSymbolItemType |
| Balance Type: |
na |
| Period Type: |
duration |
|
| X |
- DefinitionBoolean flag that is true when the Form 8-K filing is intended to satisfy the filing obligation of the registrant as written communications pursuant to Rule 425 under the Securities Act. Reference 1: http://www.xbrl.org/2003/role/presentationRef
-Publisher SEC
-Name Securities Act
-Number 230
-Section 425
| Name: |
dei_WrittenCommunications |
| Namespace Prefix: |
dei_ |
| Data Type: |
xbrli:booleanItemType |
| Balance Type: |
na |
| Period Type: |
duration |
|
Genie Energy (NYSE:GNE-A)
Historical Stock Chart
Von Apr 2024 bis Mai 2024

Genie Energy (NYSE:GNE-A)
Historical Stock Chart
Von Mai 2023 bis Mai 2024
