FORM 6-K
SECURITIES AND EXCHANGE COMMISSION
Washington, D.C. 20549
Report of Foreign Private Issuer
Pursuant
to Rule 13a-16 or 15d-16
of the Securities Exchange Act of 1934
For the month of July, 2023
Commission File Number 001-15266
BANK OF CHILE
(Translation of registrant’s name into English)
Ahumada 251
Santiago, Chile
(Address of principal executive offices)
Indicate by check mark whether the registrant files
or will file annual reports under cover Form 20-F or Form 40-F.
Form 20-F ☒
Form 40-F ☐
BANCO DE CHILE
REPORT ON FORM 6-K
Attached is a Press Release issued by Banco de Chile (“the Bank”)
on July 28, 2023, regarding its financial results for the Second Quarter 2023 and as of June 30, 2023.
SIGNATURE
Pursuant to the requirements
of the Securities Exchange Act of 1934, the registrant has duly caused this report to be signed on its behalf by the undersigned, thereunto
duly authorized.
Date: July 28, 2023
| |
Banco de Chile |
| |
|
|
| |
By: |
/s/ Eduardo Ebensperger O. |
| |
|
Eduardo Ebensperger O.
CEO |
2
Exhibit 99.1
| 1 FINANCIAL MANAGEMENT REVIEW Banco de Chile July 2023 2Q23 Quarterly & YTD Financial Report
Table of Contents 6 About Banco de Chile I. Our History Financial Snapshot on Banco de Chile 8 Corporate Governance II. Equity Composition and Ownership Structure Board of Directors, Committees and Managerial Structure 11 Business Strategy III. Competitive Strengths and Resources Corporate Statements, Commitments and Strategic Pillars Business Trends Strategic Initiatives Stakeholders Engagement Business Segments Description 23 Economic and Business Environment IV. Regulation & Supervision Economic Outlook Competitive Landscape Banking Industry Performance and Competitive Position Key Business Drivers 29 Management Discussion & Analysis V. Snapshot on Strategic Advances Income Statement Analysis Business Segments Performance Balance Sheet Analysis 57 Risk & Capital Management VI. Risk Management Approach Funding Concentration and Liquidity Market Risk Operational Risk Capital Adequacy and Credit Ratings | 2
About this Report Basis for Presentation This financial report, which accompanies our quarterly financial statements, has been prepared as requested by the Chilean Financial Market Commission (CMF) in the Compendium of Accounting Standards for Banks while being elaborated in accordance with the IFRS Practice Statement 1 – Management Commentary as issued by the International Accounting Standards Board (IASB) . Figures included in this report “ Financial Management Review ” , for purposes of analysis, are based on both the financial statements and management information systems of Banco de Chile . Forward - Looking Information The information contained herein incorporates by reference statements which constitute “ forward - looking statements ” that include statements regarding the intent, belief or current expectations of our directors and officers with respect to our future operating performance . Such statements include any forecasts, projections and descriptions of anticipated cost savings or other synergies . You should be aware that any such forward - looking statements are not guarantees of future performance and may involve risks and uncertainties, and that actual results may differ from those set forth in the forward - looking statements as a result of various factors (including, without limitations, the actions of competitors, future global economic conditions, market conditions, foreign exchange rates, and operating and financial risks related to managing growth and integrating acquired businesses), many of which are beyond our control . The occurrence of any such factors not currently expected by us would significantly alter the results set forth in these statements . Factors that could cause actual results to differ materially and adversely include, but are not limited to : changes in general economic, business or political or other conditions in Chile or changes in general economic or business conditions in Latin America; changes in capital markets in general that may affect policies or attitudes toward lending to Chile or Chilean companies; unexpected developments in certain existing litigation; increased costs; unanticipated increases in financing and other costs or the inability to obtain additional debt or equity financing on attractive terms; natural disasters or pandemics; the effect of tax laws or other kind of regulation on our business; other risk factors as reported in our form 20F filed with the U.S. SEC. Undue reliance should not be placed on such statements, which speak only as of the date that they were made . Our independent public accountants have not examined or compiled the forward - looking statements and, accordingly, do not provide any assurance with respect to such statements . These cautionary statements should be considered in connection with any written or oral forward - looking statements that we may issue in the future . We do not undertake any obligation to release publicly any revisions to such forward - looking statements to reflect later events or circumstances or to reflect the occurrence of unanticipated events . | 3 Contacts Daniel Galarce Head of Financial Control & Capital Financial Control & Capital Area | Banco de Chile dgalarce@bancochile.cl Pablo Mejia Head of Investor Relations Investor Relations | Banco de Chile pmejiar@bancochile.cl
EY Chile Avda. Presidente Riesco 5435, piso 4, Las Condes, Santiago | 4 Tel: +56 (2) 2676 1000 www.eychile.cl Independent Auditor’s Report (Free translation of a report originally issued in Spanish) To the Shareholders and the Board of Directors Banco de Chile We have reviewed the accompanying presentation of “Management Commentary” financial report of Banco de Chile and its subsidiaries for the six - month period ended on June 30, 2023, taken as a whole. In connection to this review, we have reviewed, in accordance with generally accepted auditing standards in Chile, the interim consolidated financial statements, of Banco de Chile and its subsidiaries as of June 30, 2023, and for the three - and six - months periods then ended and the related notes to the interim consolidated financial statements. In our report dated July 27, 2023, we issued unmodified conclusion on such interim consolidated financial statements. Management’s Responsibility The Bank’s Management is responsible for the preparation and fair presentation of this “Management Commentary” of Banco de Chile and its subsidiaries in accordance with standards and instructions issued by the Chile’s Financial Market Commission (CMF), established in Chapter C - 2 of the Compendium of Accounting Standards for Banks. Auditor’s Responsibility Our review was conducted in accordance with attestation standards issued by the Institute of Chilean Accountants. A review, consists, mainly, in the application of analytical procedures and making inquiries to those responsible for financial and accounting matters. A review consists mainly of applying analytical procedures and making inquiries, primarily of persons responsible for financial and accounting matters. A review is substantially less in scope than an exam which objective would be to present an opinion over the Management Commentary. Therefore, we do not express such opinion. The “Management Commentary” contains non - financial information such as operational and commercial information, sustainability indicators, macroeconomics projections and managerial information and others. Although this information may provide other additional elements for the analysis of the financial situation and results of the operations of Banco de Chile and its subsidiaries, our review does not extend to such type of information.
The preparation and presentation of the “Management Commentary” of Banco de Chile and its subsidiaries as of June 30, 2023, requires management to interpret certain criteria, make determinations regarding the relevance of the information to be included and make estimates and assumptions that affects the information presented. The “Management Commentary” of Banco de Chile and its subsidiaries as of June 30, 2023, includes current and prospective information that estimates the future impact of transactions and events that have occurred or are expected to occur, estimates future expected sources of liquidity and financial resources, and also estimates operational and macroeconomic trends and commitments and uncertainties. The results obtained in the future may differ significantly from the current evaluation of this information presented by the management of Banco de Chile and its subsidiaries due the facts and circumstances frequently do not occur as expected. Our review has considered such information only to the extent that it has been used in the preparation and presentation of the financial information contained in the “Management Commentary” and not to express a conclusion on such information itself. Conclusion Based in our review, we are not aware of any significant changes that should be made to the presentation of the “Management Commentary” of Banco de Chile and its subsidiaries so that such presentation: i) Is in accordance with the elements required by the standards and instructions from the Chile’s Financial Market Commission (CMF); ii) the historical financial amounts included in the presentation have been correctly extracted from the interim consolidated financial statements of Banco de Chile and its subsidiaries and iii) the information, determinations, estimates and underlying assumptions of Banco de Chile and its subsidiaries are consistent with the bases used for the preparation of the financial information contained in such presentation. | 5 Eduardo Rodríguez B. EY Audit Ltda. Santiago, July 27, 2023
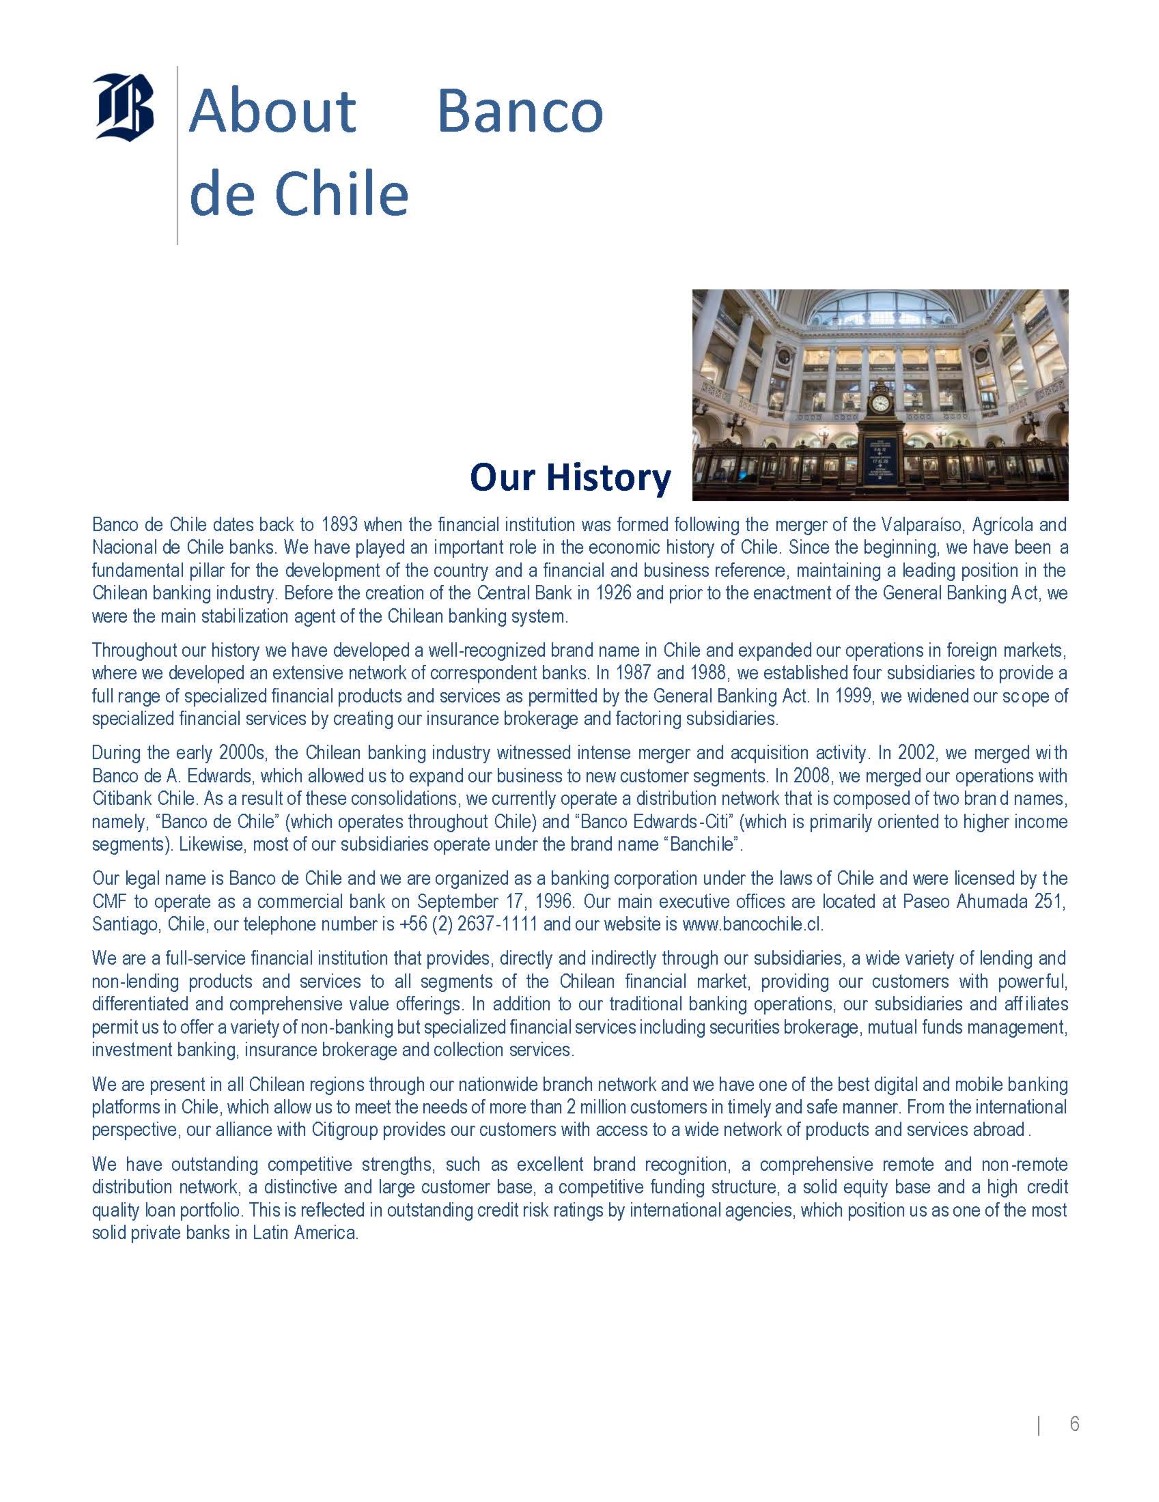
About de Chile Banco Our History Banco de Chile dates back to 1893 when the financial institution was formed following the merger of the Valparaíso, Agrícola and Nacional de Chile banks . We have played an important role in the economic history of Chile . Since the beginning, we have been a fundamental pillar for the development of the country and a financial and business reference, maintaining a leading position in the Chilean banking industry . Before the creation of the Central Bank in 1926 and prior to the enactment of the General Banking A ct, we were the main stabilization agent of the Chilean banking system . Throughout our history we have developed a well - recognized brand name in Chile and expanded our operations in foreign markets, where we developed an extensive network of correspondent banks . In 1987 and 1988 , we established four subsidiaries to provide a full range of specialized financial products and services as permitted by the General Banking Act . In 1999 , we widened our sc ope of specialized financial services by creating our insurance brokerage and factoring subsidiaries . During the early 2000 s, the Chilean banking industry witnessed intense merger and acquisition activity . In 2002 , we merged wi th Banco de A . Edwards, which allowed us to expand our business to new customer segments . In 2008 , we merged our operations with Citibank Chile . As a result of these consolidations, we currently operate a distribution network that is composed of two bran d names, namely, “Banco de Chile” (which operates throughout Chile) and “Banco Edwards - Citi” (which is primarily oriented to higher income segments) . Likewise, most of our subsidiaries operate under the brand name “Banchile” . Our legal name is Banco de Chile and we are organized as a banking corporation under the laws of Chile and were licensed by t he CMF to operate as a commercial bank on September 17 , 1996 . Our main executive offices are located at Paseo Ahumada 251 , Santiago, Chile, our telephone number is + 56 ( 2 ) 2637 - 1111 and our website is www . bancochile . cl . We are a full - service financial institution that provides, directly and indirectly through our subsidiaries, a wide variety of lending and non - lending products and services to all segments of the Chilean financial market, providing our customers with powerful, differentiated and comprehensive value offerings . In addition to our traditional banking operations, our subsidiaries and aff iliates permit us to offer a variety of non - banking but specialized financial services including securities brokerage, mutual funds management, investment banking, insurance brokerage and collection services . We are present in all Chilean regions through our nationwide branch network and we have one of the best digital and mobile banking platforms in Chile, which allow us to meet the needs of more than 2 million customers in timely and safe manner . From the international perspective, our alliance with Citigroup provides our customers with access to a wide network of products and services abroad . We have outstanding competitive strengths, such as excellent brand recognition, a comprehensive remote and non - remote distribution network, a distinctive and large customer base, a competitive funding structure, a solid equity base and a high credit quality loan portfolio . This is reflected in outstanding credit risk ratings by international agencies, which position us as one of the most solid private banks in Latin America . | 6
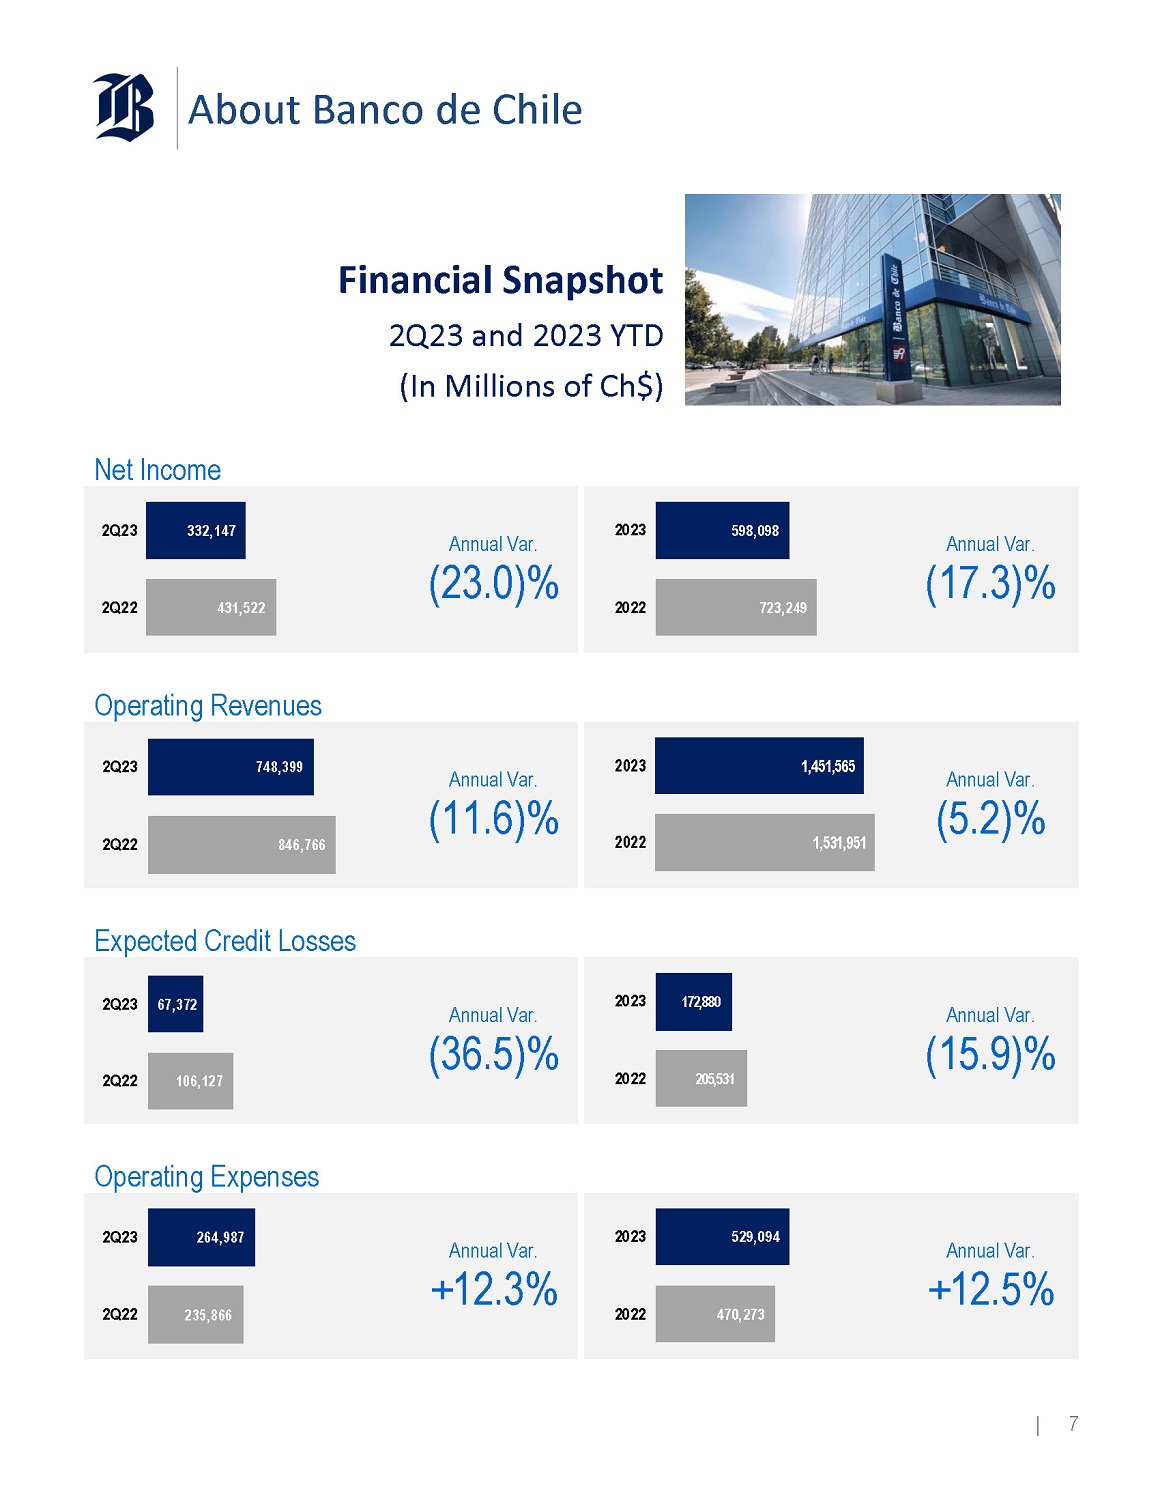
About Banco de Chile Financial Snapshot 2Q23 and 2023 YTD (In Millions of Ch$) Net Income Annual Var. (17.3)% 2023 598,098 2022 723,249 Annual Var. (23.0)% 2Q23 332,147 2Q22 431,522 Operating Revenues Annual Var. (5.2)% 2023 1,451,56 5 2022 1,531,95 1 Annual Var. (11.6)% 2Q23 748,399 2Q22 846,766 s Expected Credit Losse Annual Var. (15.9)% 2023 172,880 2022 205,531 Annual Var. (36.5)% 2Q23 67,372 2Q22 106,127 Operating Expenses Annual Var. +12.5% 2023 529,094 2022 470,273 Annual Var. +12.3% 2Q23 264,987 2Q22 235,866 | 7
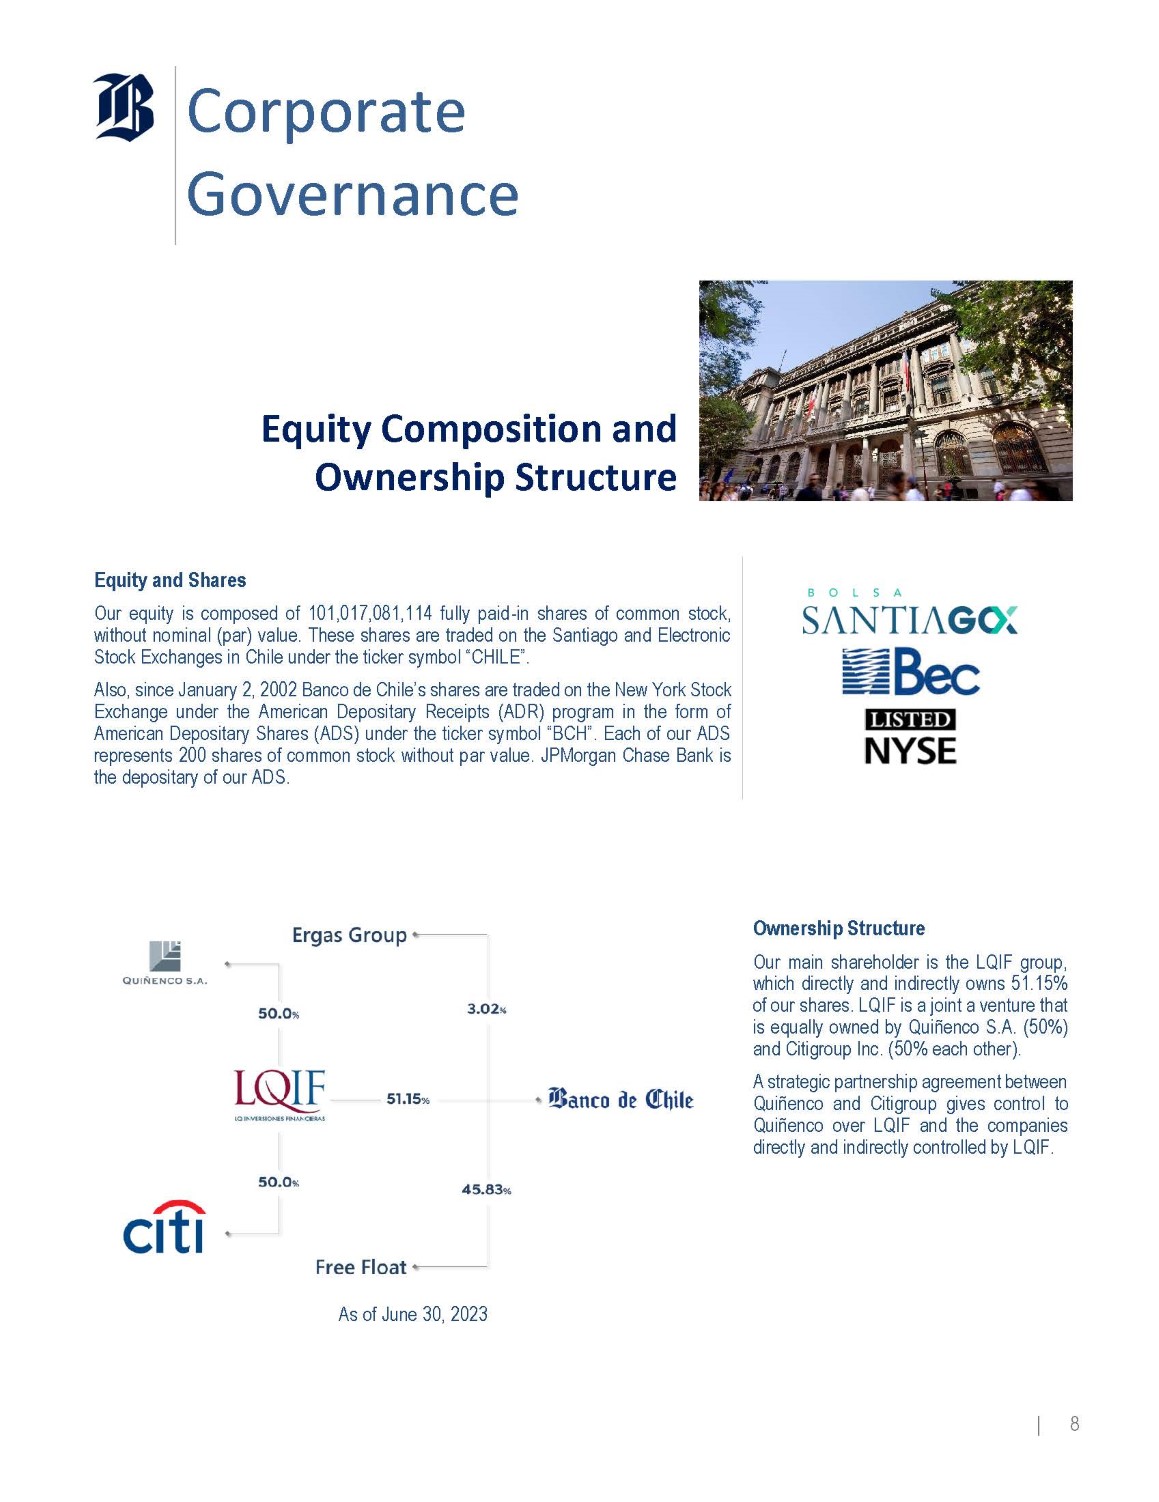
Corporate Governance Equity Composition and Ownership Structure Equity and Shares Our equity is composed of 101 , 017 , 081 , 114 fully paid - in shares of common stock, without nominal (par) value . These shares are traded on the Santiago and Electronic Stock Exchanges in Chile under the ticker symbol “CHILE” . Also, since January 2 , 2002 Banco de Chile’s shares are traded on the New York Stock Exchange under the American Depositary Receipts (ADR) program in the form of American Depositary Shares (ADS) under the ticker symbol “BCH” . Each of our ADS represents 200 shares of common stock without par value . JPMorgan Chase Bank is the depositary of our ADS . Ownership Structure Our main shareholder is the LQIF group, which directly and indirectly owns 51 . 15 % of our shares . LQIF is a joint a venture that is equally owned by Quiñenco S . A . ( 50 % ) and Citigroup Inc . ( 50 % each other) . A strategic partnership agreement between Quiñenco and Citigroup gives control to Quiñenco over LQIF and the companies directly and indirectly controlled by LQIF . As of June 30, 2023 | 8

Corporate Governance Board of Directors, Committees and Managerial Structure Board of Directors Our Board of Directors (Board) is the main corporate governance body and its most important duties include establishing strategic guidelines ; approving policies, procedures and mechanisms designed to meet the objectives of the corporate governance system ; and appointing a Chief Executive Officer . The Board is composed of eleven directors and two alternate directors, in accordance with our bylaws . The board is voted every three years . In March 2023 , the most recent election date, our shareholders elected new directors, of which eleven were proposed by LQIF (nine directors and two alternate directors) and other two members were proposed by shareholders other than LQIF, including an independent director . Currently, our Board is composed of three women and ten men . Our Board meets twice a month, except in February, when it meets once . Extraordinary sessions may be convened by the Chairman or by request of one or more regular directors . Board Committees Our Board delegates certain functions and activities to our committees to control, evaluate and report to the board of directors regarding specific matters which may affect our businesses. | 9
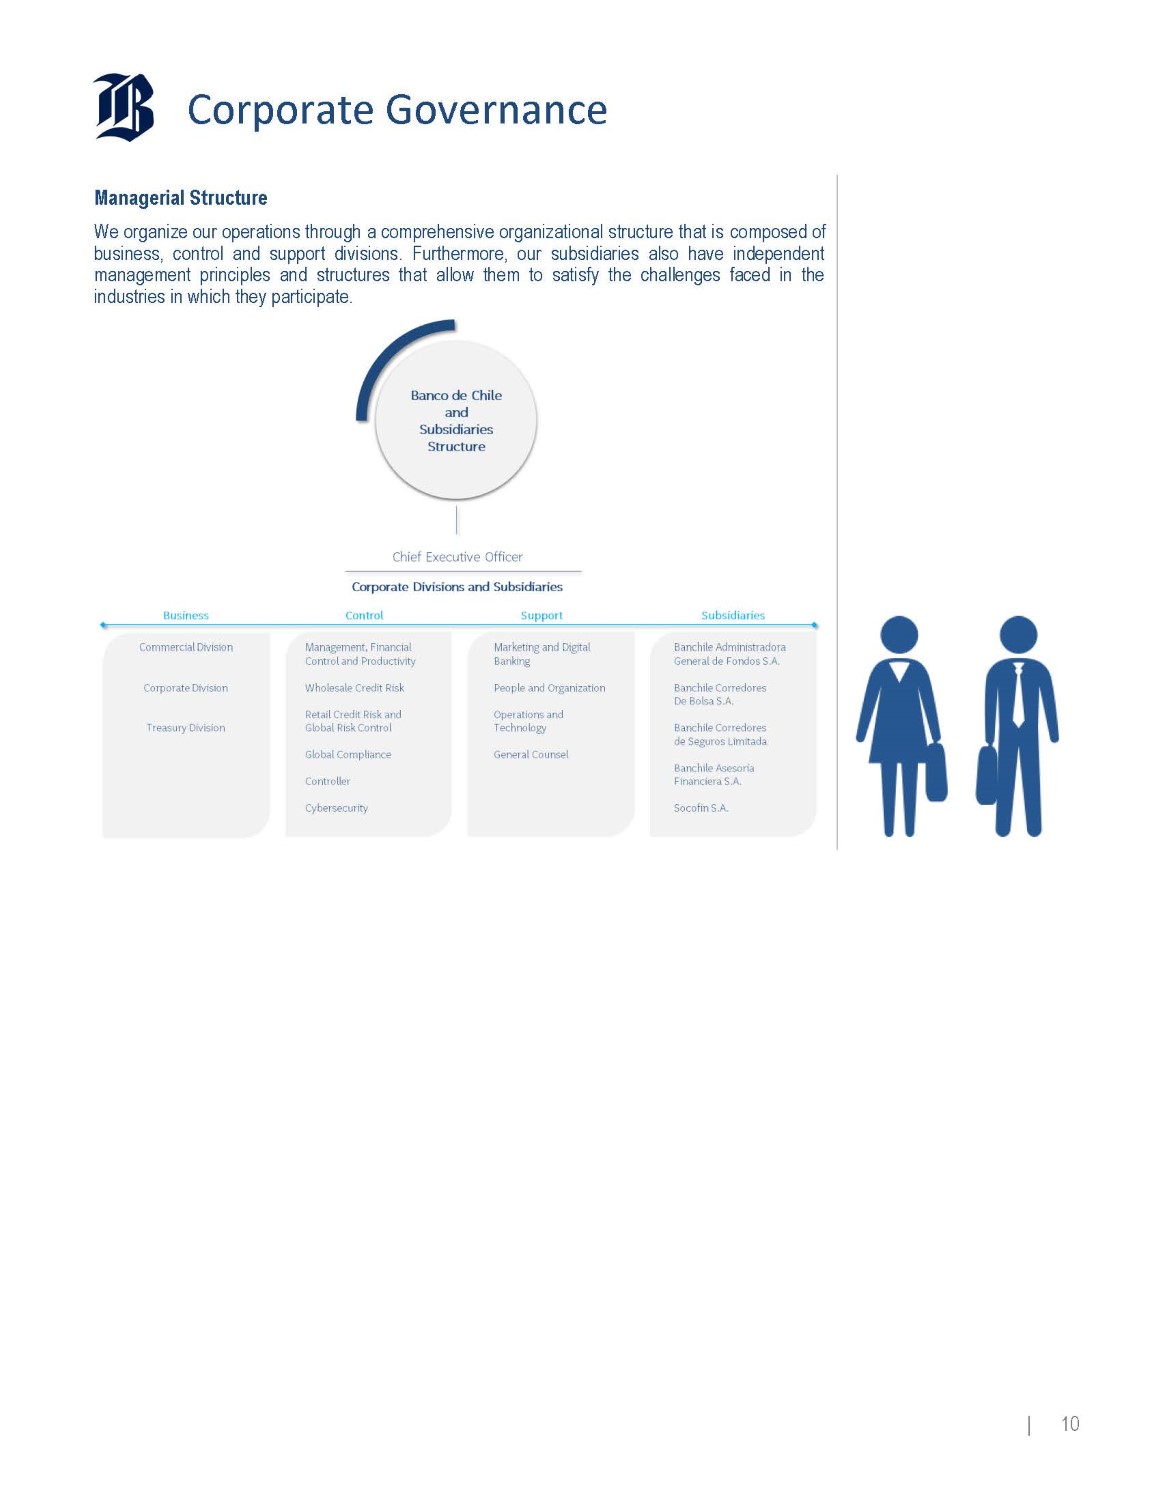
Corporate Governance Managerial Structure We organize our operations through a comprehensive organizational structure that is composed of business, control and support divisions . Furthermore, our subsidiaries also have independent management principles and structures that allow them to satisfy the challenges faced in the industries in which they participate . | 10
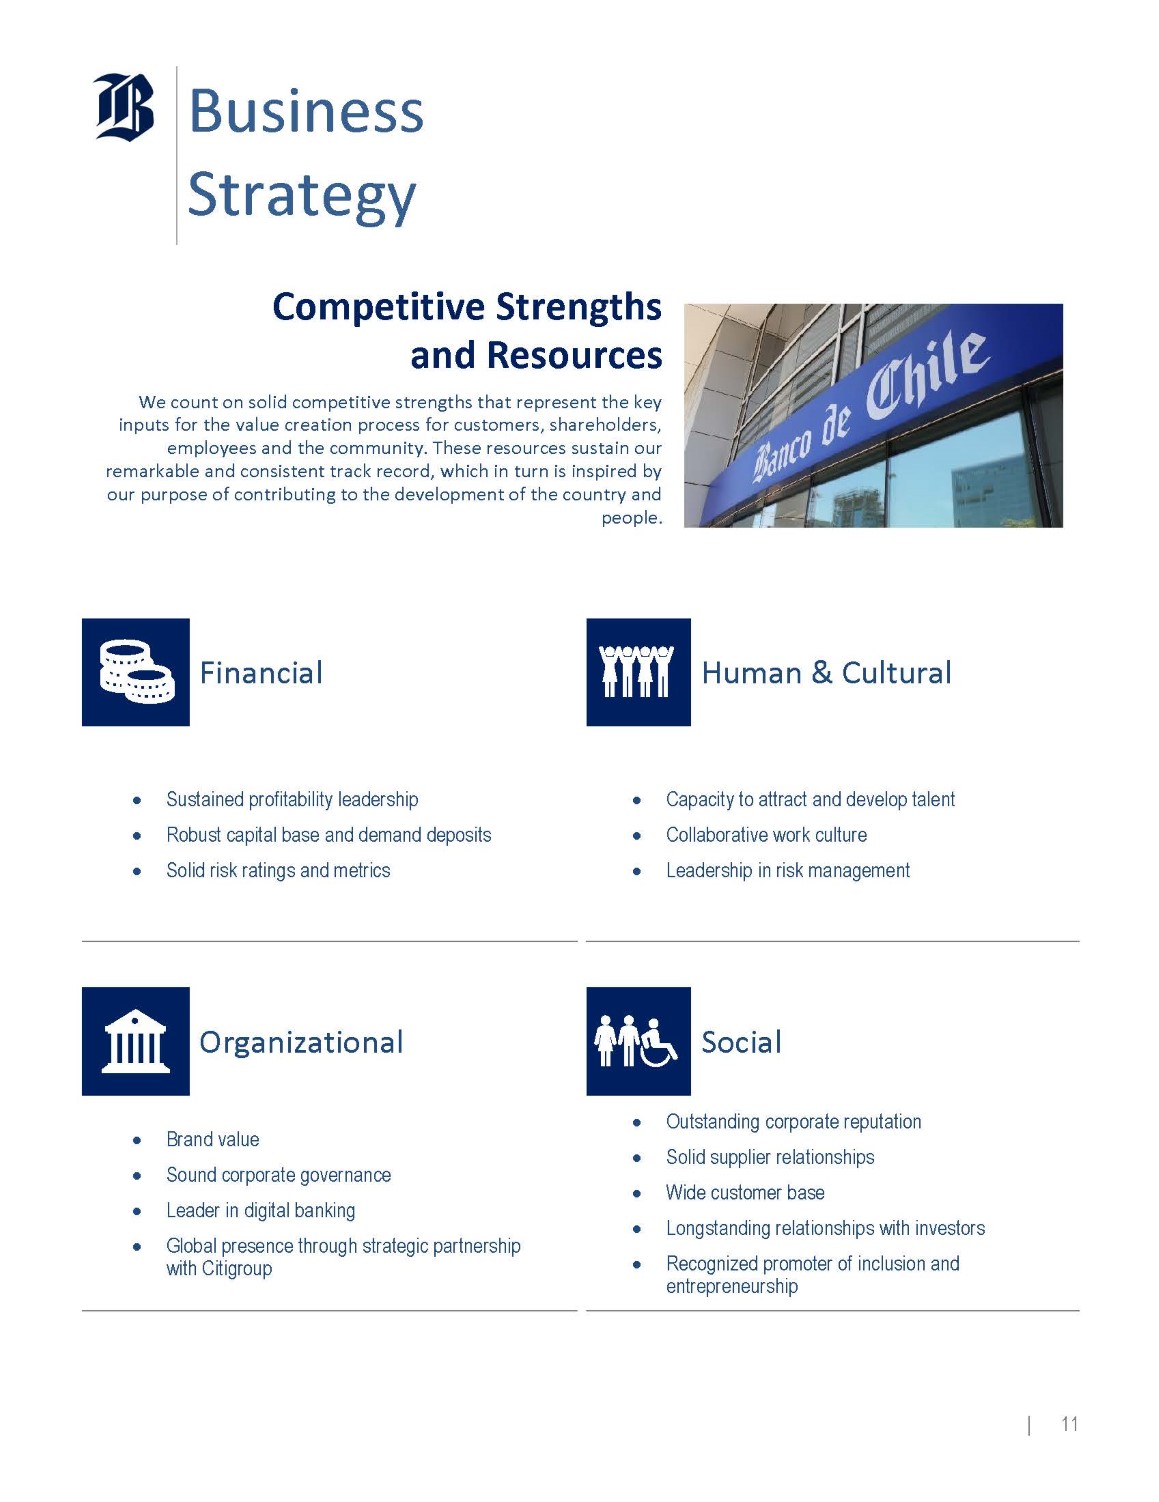
Business Strategy Competitive Strengths and Resources We count on solid competitive strengths that represent the key inputs for the value creation process for customers, shareholders, employees and the community. These resources sustain our remarkable and consistent track record, which in turn is inspired by our purpose of contributing to the development of the country and people. Human & Cultural Financial Capacity to attract and develop talent Collaborative work culture Leadership in risk management Sustained profitability leadership Robust capital base and demand deposits Solid risk ratings and metrics Social Organizational Outstanding corporate reputation Solid supplier relationships Wide customer base Longstanding relationships with investors Recognized promoter of inclusion and entrepreneurship Brand value Sound corporate governance Leader in digital banking Global presence through strategic partnership with Citigroup | 11

Business Strategy Corporate Statements, Commitments and Strategic Pillars Mission Purpose We are a leading, globally - connected financial corporation with a prestigious business tradition. We provide financial services of excellence to each customer segment, offering creative, agile and effective solutions and thus ensuring value creation for our shareholders, our employees and the community at large. To contribute to the development of the country and its people. Corporate Values Vision In everything we do, we constantly strive to be the best bank for our customers, the best place to work, and the best investment for our shareholders. We do so in a way that demonstrates our commitment to the people in our organization and the community in general. | 12

Business Strategy Commitment Our Customers We pursue to be the bank with the best service quality, offering innovative, simple and secure products and services designed to meet the needs and aspirations of each segment, with timely, agile and proactive service in order to build trusted and long - term relationships . To do this, it is essential to have always available distribution channels that allow fluid and timely communication, in addition to employees devoted to customer service while having digital knowledge . Our Staff We are certain that our team is a distinctive asset and a solid competitive advantage in the industry . This is based on their commitment, dedication and excellence . For this reason, we offer development and growth opportunities based on merit, providing competitive compensation and economic and welfare benefits . At the same time, we seek to promote a respectful, friendly and collaborative work environment in a place that has suitable technological tools and infrastructure . We build a homogeneous and distinctive culture, based on corporate commitments and values through the involvement in social activities, in order to become a Corporation distinguished as the best place to work and the best team in Chilean banking industry . Our Shareholders We honor our shareholders' confidence by maximizing the company's value, with responsibility, prudence and a long - term business vision . We deploy our strategy through appropriate risk management and a culture of operational excellence that allows us to project the sustainable leadership of the corporation . Our Community We are convinced that our success is linked to the sustainable development of our country and the community . That is why in our daily actions we reflect our commitment to community by supporting diverse initiatives to overcome adversity, through the development of internal policies while being present in emblematic solidarity crusades . We are also committed to diversity and inclusion, entrepreneurship, environmental care, and with equality and governance dimensions . | 13
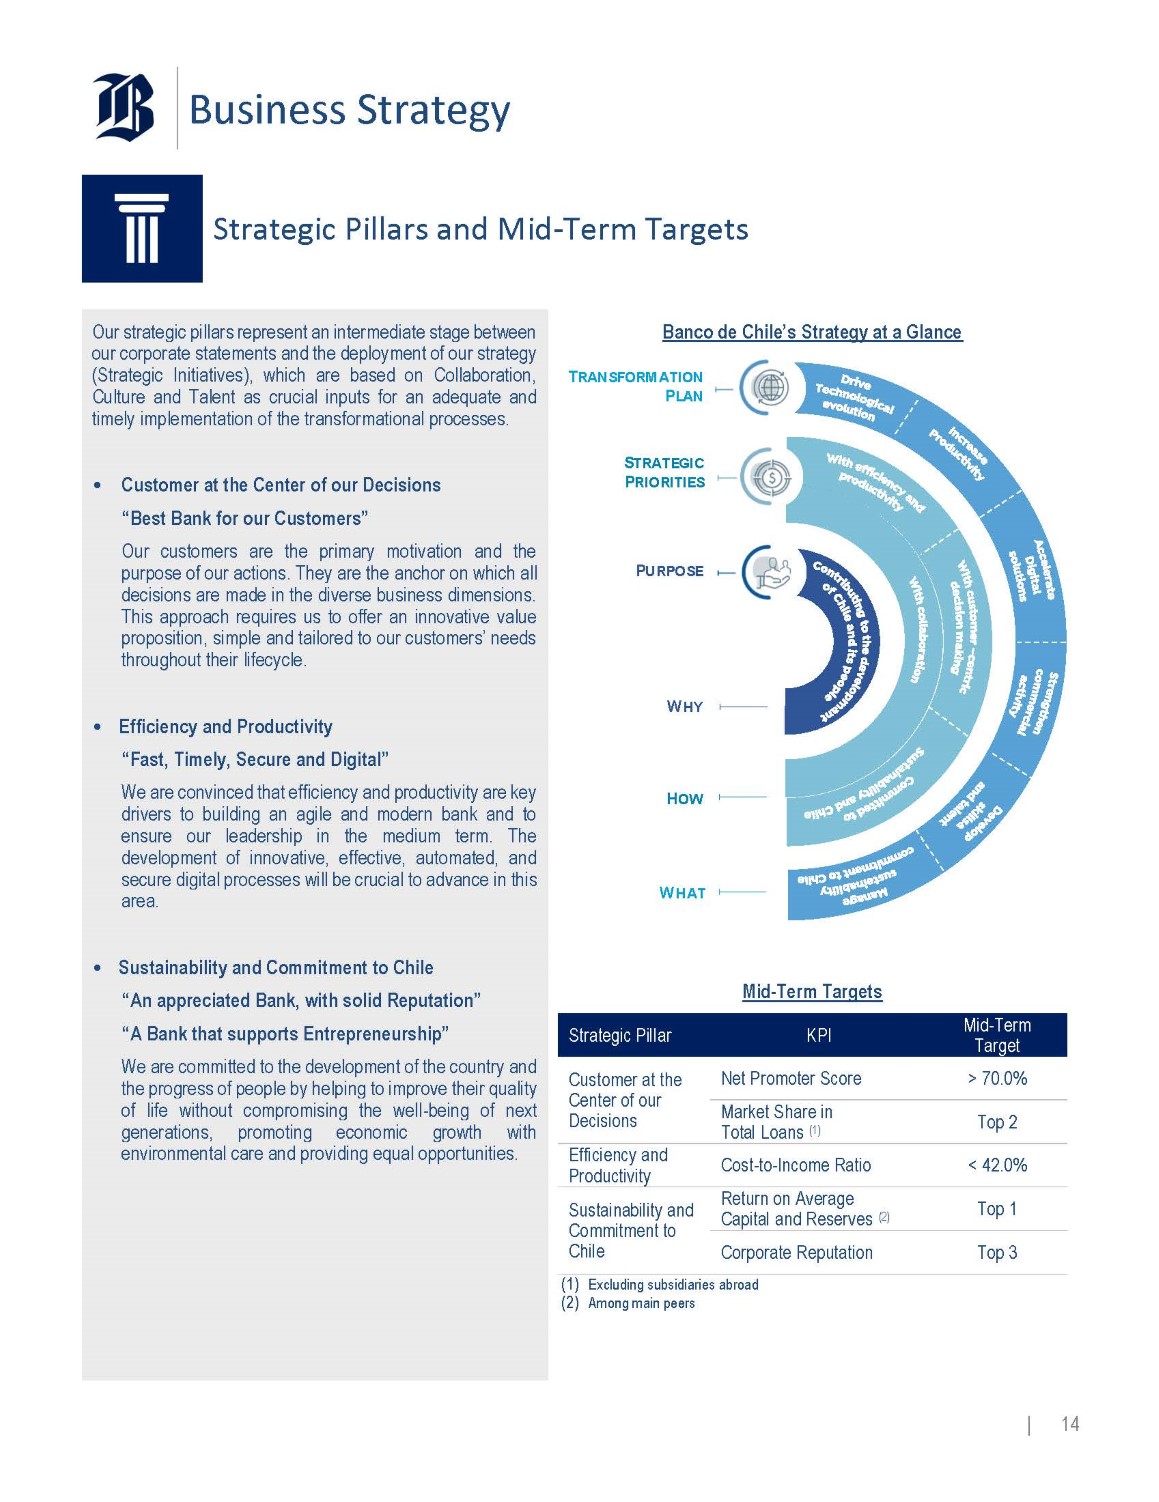
Business Strategy Strategic Pillars and Mid - Term Targets Our strategic pillars represent an intermediate stage between our corporate statements and the deployment of our strategy (Strategic Initiatives), which are based on Collaboration, Culture and Talent as crucial inputs for an adequate and timely implementation of the transformational processes . • Customer at the Center of our Decisions “Best Bank for our Customers” Our customers are the primary motivation and the purpose of our actions . They are the anchor on which all decisions are made in the diverse business dimensions . This approach requires us to offer an innovative value proposition, simple and tailored to our customers’ needs throughout their lifecycle . • Efficiency and Productivity “Fast, Timely, Secure and Digital” We are convinced that efficiency and productivity are key drivers to building an agile and modern bank and to ensure our leadership in the medium term . The development of innovative, effective, automated, and secure digital processes will be crucial to advance in this area . • Sustainability and Commitment to Chile “An appreciated Bank, with solid Reputation” “A Bank that supports Entrepreneurship” We are committed to the development of the country and the progress of people by helping to improve their quality of life without compromising the well - being of next generations, promoting economic growth with environmental care and providing equal opportunities . Banco de Chile’s Strategy at a Glance Mid - Term Targets Mid - Term Target KPI Strategic Pillar > 70.0% Net Promoter Score Customer at the Center of our Decisions Top 2 Market Share in Total Loans (1) < 42.0% Cost - to - Income Ratio Efficiency and Productivity Top 1 Return on Average Capital and Reserves (2) Sustainability and Commitment to Chile Top 3 Corporate Reputation (1) Excluding subsidiaries abroad (2) Among main peers W HAT | 14 H OW W HY P URPOSE S TRATEGIC P RIORITIES T RANSFORMATION P LAN

Business Strategy Business Trends To achieve our strategic goals is crucial to know and understand the factors that could affect our performance in order to adapt our business strategy to face what we are not capable of controlling. The following factors represent main trends and changes affecting the banking business, which we address through our strategic initiatives: New political and social cycle. Constitutional process in progress in Chile. Diverse reforms promoted by the government administration with potential impact on the economic and business environment. Global and local economic uncertainty. Increased competition and regulatory requirements. Generational and behavioral shifts: customer | worker. Digital transformation and adaptation to new technologies. Change in the company – customer relationship. Sanitary risks and climate change. Social and Cultural Trends Trends in Banking Business Consolidation of digital channels as the main means of interaction with customers and non - customers. Business model modernization: Talent management and IT strategy to adapt to the new environment. Sustainability requirements. Cost base optimization to mitigate competition and regulatory changes. Innovation in banking solutions. Arising of non - traditional competitors. | 15

Business Strategy Transformation Initiatives Our Directive Plan describes the roadmap of initiatives and projects we have defined to achieve our medium and long - term objectives . This roadmap is flexible by adapting to the changes in the business environment and trends while permitting us to prioritize and focus financial and human resources. The six dimensions that comprise our Directive Plan are described below: Recent Achievements Accelerating Digital Solutions Launching of digital onboarding current account in USD for individuals and companies. New functionalities enabled in websites and mobile apps for individuals and companies. Integration of investment functionalities into corporate websites. 100% digital adoption of CRM tools. Implementation of smart technologies to improve phone - banking customer experience. Significant advances in information management and data governance. This dimension crosses at dimensions related to commercial activities, efficiency and technological evolution by defining our strategic ambition on this matter : "being the digital benchmark in the Chilean banking industry by generating the best customer experience and pursuing sustained growth in the future" . Based on this strategy, we have strengthened and enhanced our offer of digital products and services while optimizing our processes and undertaking technological renovation for full accessibility of remote our channels . More recently, one of the fundamental initiatives of this digital strategy has become the development of mobile applications and websites that are part of the digital ecosystem that provides 100 % digital services . Recent Achievements Strengthen Commercial Activity Checking accounts sales increase above 10% per year. Strengthening of investment products through a new sales - force management model, process digitalization and segmentation. 1st place in the state - guaranteed Fogape Chile Apoya program, among private banks. Strengthened brand positioning through improved loyalty programs and new digital marketing channels. Enhanced value offerings for individuals and companies through new developments in advanced analytics and AI. First steps in the metaverse that pursue to enhance customer engagement and experience. Recognized as best investment bank by both Euromoney and Global Finance. This aspect aims to improve our value propositions to match new trends and customer expectations, in order to sustain profitable business growth . Its projects and initiatives encompass channels, platforms, service centers and commercial dynamics, and it incorporates greater technology, efficiency, automation and simplicity into our processes . | 16
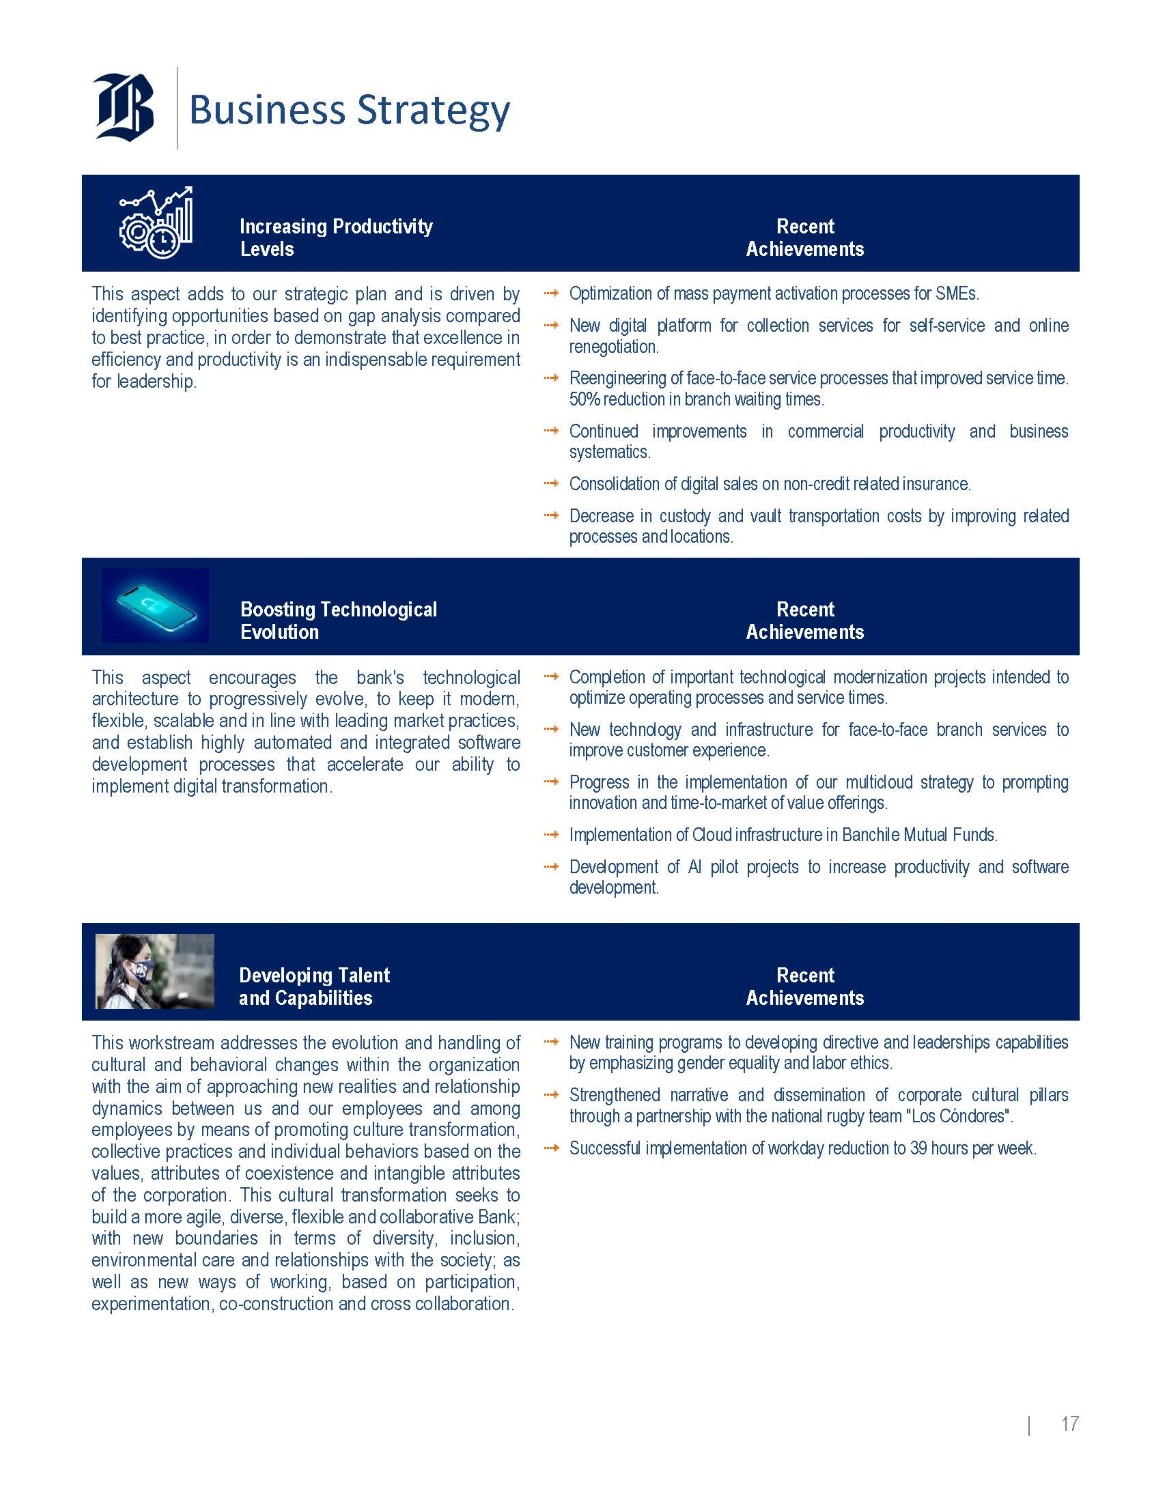
Business Strategy Recent Achievements Increasing Productivity Levels Optimization of mass payment activation processes for SMEs. New digital platform for collection services for self - service and online renegotiation. Reengineering of face - to - face service processes that improved service time. 50% reduction in branch waiting times. Continued improvements in commercial productivity and business systematics. Consolidation of digital sales on non - credit related insurance. Decrease in custody and vault transportation costs by improving related processes and locations. This aspect adds to our strategic plan and is driven by identifying opportunities based on gap analysis compared to best practice, in order to demonstrate that excellence in efficiency and productivity is an indispensable requirement for leadership . Recent Achievements Boosting Technological Evolution Completion of important technological modernization projects intended to optimize operating processes and service times. New technology and infrastructure for face - to - face branch services to improve customer experience. Progress in the implementation of our multicloud strategy to prompting innovation and time - to - market of value offerings. Implementation of Cloud infrastructure in Banchile Mutual Funds. Development of AI pilot projects to increase productivity and software development. This aspect encourages the bank's technological architecture to progressively evolve, to keep it modern, flexible, scalable and in line with leading market practices, and establish highly automated and integrated software development processes that accelerate our ability to implement digital transformation . Recent Achievements Developing Talent and Capabilities New training programs to developing directive and leaderships capabilities by emphasizing gender equality and labor ethics. Strengthened narrative and dissemination of corporate cultural pillars through a partnership with the national rugby team "Los Cóndores". Successful implementation of workday reduction to 39 hours per week. This workstream addresses the evolution and handling of cultural and behavioral changes within the organization with the aim of approaching new realities and relationship dynamics between us and our employees and among employees by means of promoting culture transformation, collective practices and individual behaviors based on the values, attributes of coexistence and intangible attributes of the corporation . This cultural transformation seeks to build a more agile, diverse, flexible and collaborative Bank ; with new boundaries in terms of diversity, inclusion, environmental care and relationships with the society ; as well as new ways of working, based on participation, experimentation, co - construction and cross collaboration . | 17
Business Strategy Recent Achievements Strengthening ESG and Commitment to Chile Support actions to assist customers and communities affected by forest fires, rains and floods . Deployment of support actions for women and SMEs through "Mujeres que Inspiran" program and the "Desafío Emprendedor" national contests . Implementation of corporate volunteering activities aimed at supporting social and educational organizations and senior citizen communities . Training in sustainable finance and climate change impacts on the banking industry for management levels . Issuance of ESG bonds for more than USD 80 million under the Sustainability Financing Framework to finance companies and enterprises led by women . " 100 % digital insurance for greener squares" campaign . Planting of native trees and bushes in squares and parks throughout the country . Continuation of our strategy to promote inclusion : (i) Contribution to the Chilean Special Olympics Foundation, (ii) launching of the VI version of Expo Inclusión, and (iii) organization of the Chilean Open Copa Banco de Chile . Strengthening of information and awareness campaigns for customers and the community on new cybersecurity threats and digital fraud . Improvement in the Sustainalytics ESG Risk Rating, achieving the best score within the local industry (as of May 2023 ) . This is a cross initiative that involves all the other five dimensions of our Directive Plan . This initiative is composed of the following pillars, that are also part of our sustainability strategy : diversity and inclusion, education and entrepreneurship, emergency response, contribution to the environment, and governance of sustainable management. The deployment of this initiative considers communication activities aimed at reinforcing corporate values and culture, stakeholder management, and building alliances with expert foundations and public and private organizations . | 18

Business Strategy Stakeholder Engagement Banco de Chile keeps several communication channels open with our stakeholders in order to gather information to answer questions and manage concerns regarding different issues. We also actively participate in social media and count on specific channels dedicated to managing inquiries and requirements. Frequency Mechanisms and/or Channels of Communication Engagement Objectives Stakeholders Ongoing www.bancochile.c l Branches and ATMs Telephone banking service 600 637 37 37 Mobile applications https://cl.linkedin.com/company/banco - de - chile Twitter and Instagram:@bancodechile | @bancoedwards |@ayudaBancoChile Facebook: bancodechile | bancoedwards Offer excellent service characterized by integrity, personalization, agility and proactivity in order to build long - term, trust - based relationships . Use permanently available service channels to keep customers informed in a timely and appropriate manner . Provide differentiated financial solutions featuring quality, innovative products and services for each customer segment . Customers Annual Quarterly Monthly Ongoing Shareholders’ meeting Annual Report & Form 20 - F Financial reporting Investor Relations: ir@bancochile.cl Webcasts Website CMF Reports belonging to both the Information System and the Risk System Frameworks. Be the best investment option, maintaining a leading position by value of shares traded Promote operational efficiency and productivity in order to encourage prudent risk management based on integrity and transparency . Comply with the regulatory requirements defined by the correspondent authority . Keep a corporate governance and internal control environment that allow to manage risk and capital adequately . Shareholders and Regulators Annual Ongoing Intranet / Emails / SOY_DELCHILE App Competency Assessment Counseling Program (Programa Orienta) My Health Program (Programa Mi Salud) Quality of Life Program / Active Chile Program Point Bank / Team meetings Contact: comitedeetica@bancochile.c l apoyolaboral@bancochile.c l centroatencionpersonas@bancochile.c l Offer merit - based development opportunities with competitive compensation and economic benefits. Promote a respectful, polite work environment in a location equipped with the appropriate technology and infrastructure. Employees Ongoing Annual Report Contact: sostenibilidad@bancochile.c l www.bancochile.c l Promote financial education. Facilitate a more equitable society that offers greater opportunities through inclusion of persons with disabilities. Manage the business in an environmentally respectful manner. Support SMEs and entrepreneurs in developing their businesses. Community Ongoing proveedores@bancochile.c l Build long - term collaborative supplier relationships based on transparency, competition, efficiency, respect and objectivity. Streamline and increase the effectiveness of processes for supplying goods and services. Ensure that services are hired and goods are acquired under market conditions. Ensure that the bank's obligations are paid in accordance with the terms and conditions agreed. Suppliers | 19
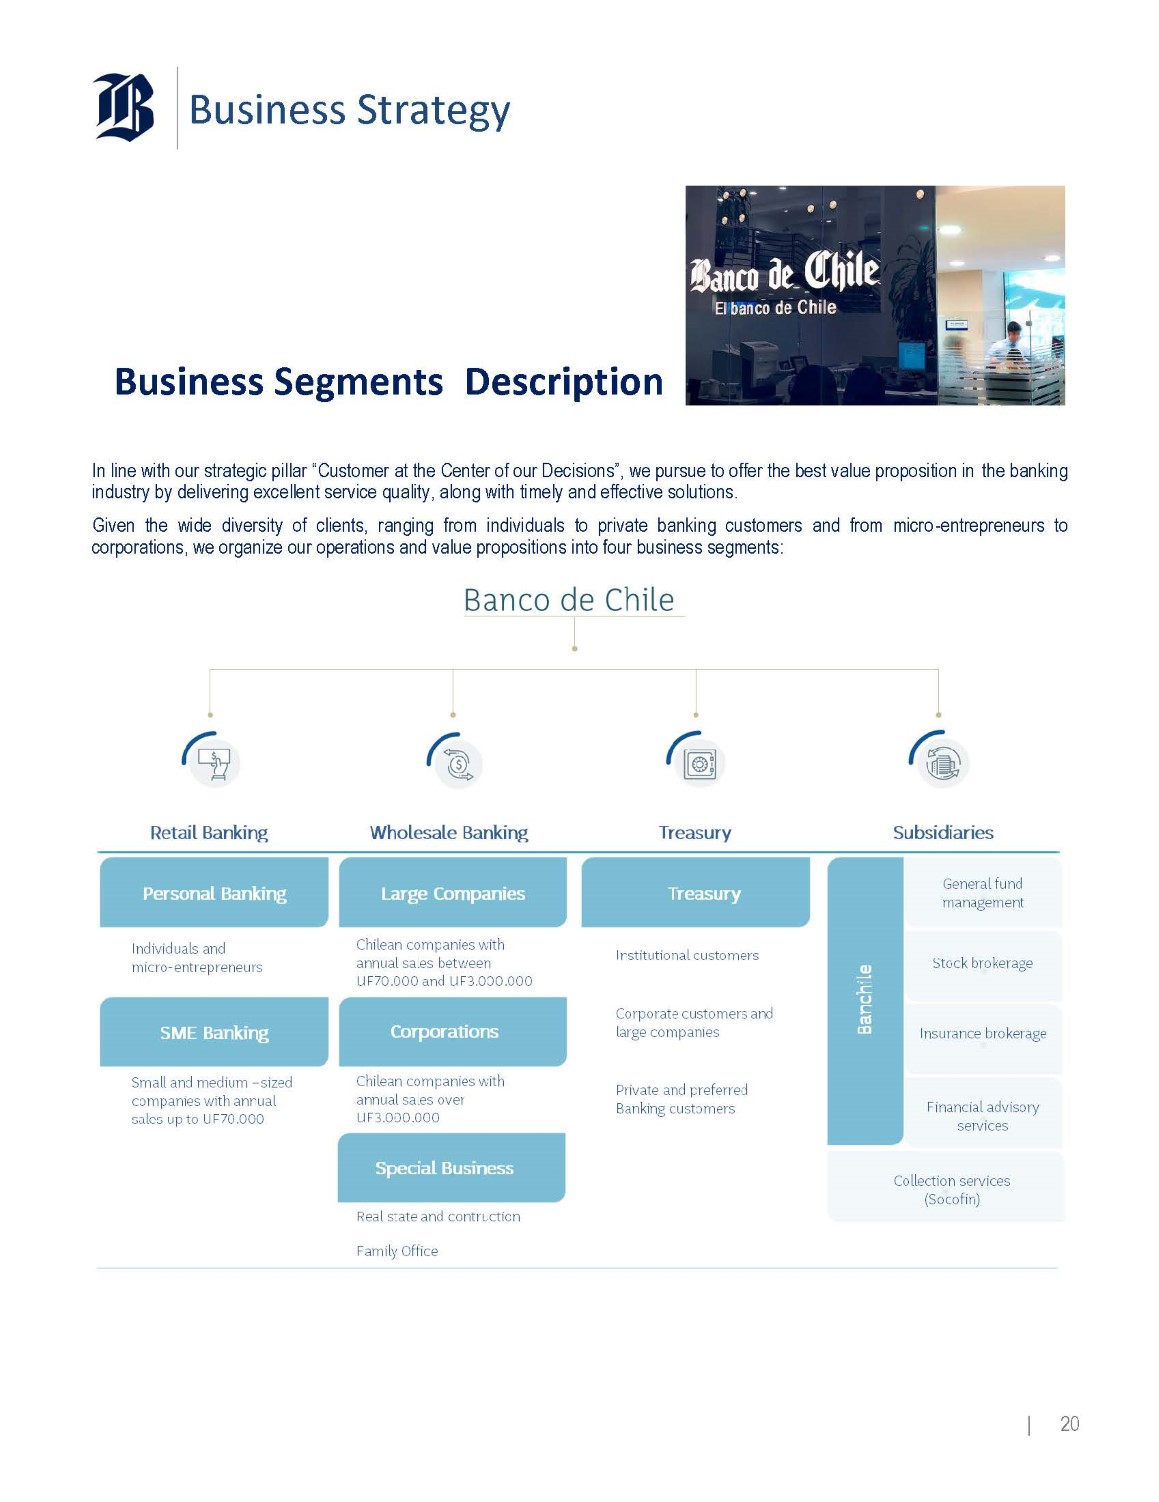
Business Strategy Business Segments Description In line with our strategic pillar “Customer at the Center of our Decisions”, we pursue to offer the best value proposition in the banking industry by delivering excellent service quality, along with timely and effective solutions. Given the wide diversity of clients, ranging from individuals to private banking customers and from micro - entrepreneurs to corporations, we organize our operations and value propositions into four business segments: | 20

Business Strategy Retail Banking Segment This business unit provides universal financial solutions to everyone in Chile, including : teenagers, individuals, employed workers, self – employed workers, retired people and micro, small and medium - sized companies with annual sales of up to UF 70 , 000 . The value propositions to this segment reflects how customers interact with the bank, whether on - site or remotely, according to their needs for the simplest to the most sophisticated products and services, with differentiated value propositions for the relational and transactional segments . The financial products and services offered by this segment include checking accounts, debit cards, credit cards, lines of credit, mortgage loans, consumer loans, commercial loans, general purpose mortgage loans, finance leases, factoring services, mutual fund management and stock brokerage, foreign trade, payments and collections, insurance brokerage including life and general insurance, time deposits, savings instruments and foreign currency services, through a network of branches operating under the “Banco de Chile” and “Banco Edwards Citi” brands . Wholesale Banking Segment This business unit provides banking products and services to companies with annual sales that exceed UF 70 , 000 , which include a large proportion of Chilean listed and unlisted companies, subsidiaries of multinational companies and conglomerates operating in Chile, in the financial, commercial, manufacturing, industrial, infrastructure, real estate and construction sectors, as well as projects, concessions, family offices and large companies . This business unit provides a wide range of products that include short and long - term commercial loans, working capital loans, lines of credit, corporate credit cards, foreign trade and foreign currency brokerage, factoring services, leases, non - residential mortgage loans and long - term syndicated loans . Investment banking services are provided by the subsidiary Banchile Asesoría Financiera S . A . , such as transaction structuring services for mergers and acquisitions and assistance with debt restructuring . It provides cash management services, which include paying payroll, suppliers, pensions and dividends, collection services, connections to international funds transfer networks and traditional deposit products, particularly checking accounts . It provides traditional lending products, a wide range of non - lending services related to project finance, deposit and fund management, treasury and investment management, derivative contracts, insurance brokerage, and other tailored services . | 21
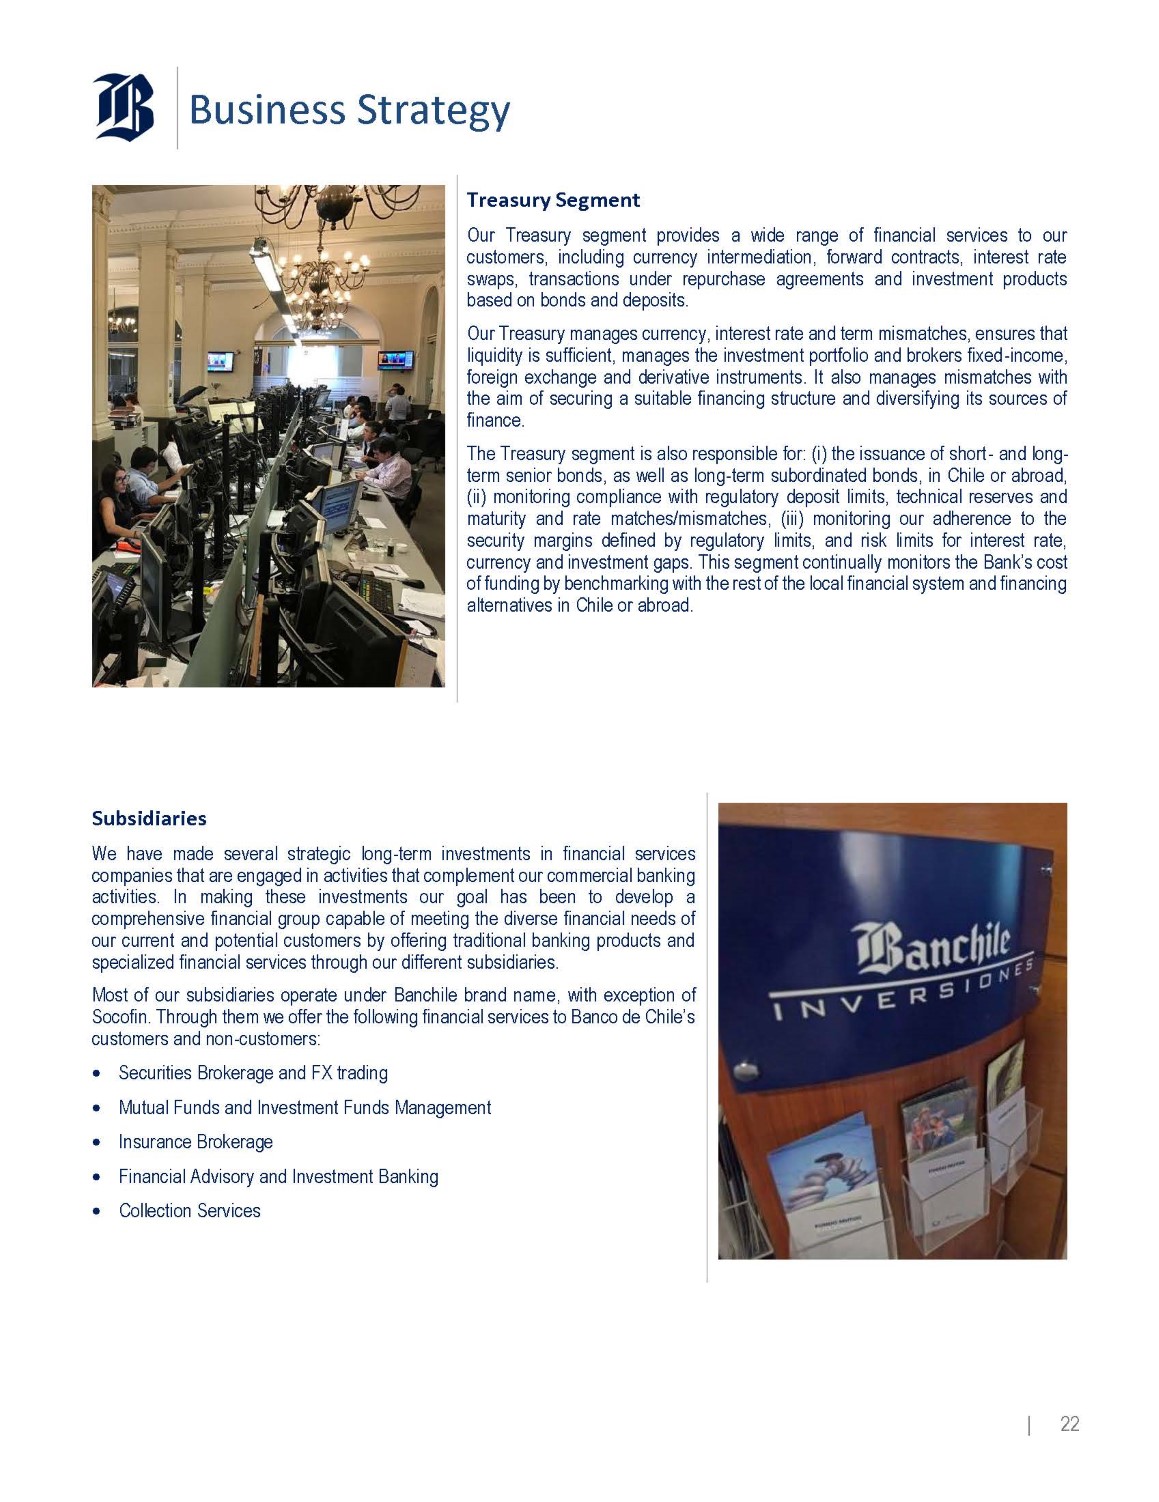
Business Strategy Treasury Segment Our Treasury segment provides a wide range of financial services to our customers, including currency intermediation, forward contracts, interest rate swaps, transactions under repurchase agreements and investment products based on bonds and deposits . Our Treasury manages currency, interest rate and term mismatches, ensures that liquidity is sufficient, manages the investment portfolio and brokers fixed - income, foreign exchange and derivative instruments . It also manages mismatches with the aim of securing a suitable financing structure and diversifying its sources of finance . The Treasury segment is also responsible for : (i) the issuance of short - and long - term senior bonds, as well as long - term subordinated bonds, in Chile or abroad, (ii) monitoring compliance with regulatory deposit limits, technical reserves and maturity and rate matches/mismatches, (iii) monitoring our adherence to the security margins defined by regulatory limits, and risk limits for interest rate, currency and investment gaps . This segment continually monitors the Bank’s cost of funding by benchmarking with the rest of the local financial system and financing alternatives in Chile or abroad . Subsidiaries We have made several strategic long - term investments in financial services companies that are engaged in activities that complement our commercial banking activities . In making these investments our goal has been to develop a comprehensive financial group capable of meeting the diverse financial needs of our current and potential customers by offering traditional banking products and specialized financial services through our different subsidiaries . Most of our subsidiaries operate under Banchile brand name, with exception of Socofin . Through them we offer the following financial services to Banco de Chile’s customers and non - customers : Securities Brokerage and FX trading Mutual Funds and Investment Funds Management Insurance Brokerage Financial Advisory and Investment Banking Collection Services | 22
Economic & Business Environment Regulation & Supervision Chilean banks are primarily subject to the General Banking Act and secondarily, to the extent not inconsistent with that law, the provisions of the Chilean Corporations Law governing publicly listed corporations, except for certain provisions that are expressly excluded. The main authorities regulating financial institutions in Chile are the Financial Market Commission ( “ CMF ” ) and the Chilean Central Bank. The CMF The CMF must regulate, oversee, sanction and manage the operation, stability and development of the Chilean financial market by easing the participation of market agents while keeping public trust . In order to do so, the CMF must have an overall and systemic vision by protecting interests of investors and insured agents . The CMF also can impose sanctions on the supervised entities . The CMF currently oversees the Chilean Financial Market (comprised of publicly traded companies, banks and financial institutions, insurance companies, insurance brokers, mutual funds and investment funds) . Regarding the specific powers of the CMF related to banking regulation, this entity authorizes the creation of new banks and has broad powers to interpret and enforce legal and regulatory requirements applicable to banks and financial institutions . Furthermore, in cases of noncompliance with its legal and regulatory requirements, the CMF has the ability to impose sanctions . In extreme cases, it can appoint, with the prior approval of the board of directors of the Central Bank, a provisional administrator to manage a bank . It also has the mandate to approve any amendment to a bank’s bylaws or any increase in its capital . The CMF examines all banks, usually at least once a year or more often if necessary under certain circumstances . Banks are required to submit unaudited financial statements to the CMF on a monthly basis and to publish their unaudited financial statements at least four times a year in a newspaper of national circulation . A bank’s financial statements as of December 31 of each year must be audited and submitted to the CMF together with the opinion of its independent auditors . Also, banks are required by the CMF to include in mid - year financial statements (as of June 30 of every fiscal year) an auditor’s review statement in accordance with Chilean GAAP . In addition, banks are required to provide extensive information regarding their operations at various periodic intervals to the CMF by means of specialized reports associated with business - related risk, products, debtors, transactions, distribution channels, among others . The Central Bank The Central Bank is an autonomous legal entity created under the framework of the Chilean Constitution . It is subject to its Ley Orgánica Constitucional (the “Organic Constitutional Law”) and the current Chilean Constitution . To the extent not inconsistent with its Organic Constitutional Law or the current Chilean Constitution, the Central Bank is also subject to general laws applicable to the private sector, but is not subject to the laws applicable to the public sector . The Central Bank is directed and administered by a board of directors composed of five members appointed by the President of Chile, subject to Senate approval . The legal purpose of the Central Bank is to maintain the stability of the Chilean peso, control inflation and the orderly functioning of Chile’s internal and external payment systems . The Central Bank’s powers include setting reserve requirements, regulating the amount of money and credit in circulation, and establishing regulations and guidelines regarding financial companies, foreign exchange (including the Formal Exchange Market) and bank deposit - taking activities . The SEC As we are listed on the New York Stock Exchange since January 1 st , 2002 through our ADR program, we are also subject to regulation and supervision of the Securities and Exchange Commission . We are required to file with SEC the form 20 F, including audited financial statements, as of December of each year in accordance with IFRS as issued by the International Accounting Standards Board . | 23
Economic & Business Environment Economic Outlook The economic activity continues posting negative annual growth rates, confirming a short - term recession . In the 1 Q 23 , GDP contracted 0 . 6 % on an annual basis, after declining 2 . 3 % in the previous quarter, due to 4 . 8 % annual decline in consumption, which was driven by the steep annual reduction of 28 . 8 % in durable consumption . Investment has also remained weak, falling 2 . 1 % on an annual basis . Instead, exports were the only component that grew in the period . Available information for the second quarter has also been anticipating further economic contraction, as demonstrated by the Imacec (monthly GDP) that declined 1 . 1 % and 2 . 0 % in April and May, respectively, when compared to same months of 2022 , a trend that has mainly been supported by further deterioration in domestic consumption . On a sequential basis, the contraction has been even more evident . In May 2023 , the Imacec was 2 . 3 % below the level posted in December of 2021 , suggesting that the economy has not grown since the beginning of 2022 . Furthermore, GDP has posted consecutive negative rates since last February, after declining in the 3 Q 22 and the 4 Q 22 . This lackluster outlook has been produced by several factors, such as : (i) the lagged effects of interest rate hikes, which rose 1 , 075 bp . between 2021 and 2022 to stand and stay at 11 . 25 % , (ii) the contractionary fiscal policy implemented last year, as reflected by the 23 % annual decrease in fiscal spending and the improvement in the fiscal balance to 9 % of the GDP, and (iii) normalized liquidity levels due to no further stimuli such as pension funds withdrawals and money transfers . GDP Growth (Annual growth, %) 5.2 0.2 - 0.6 - 2.3 - 1.4 2Q22 3Q22 4Q22 1Q23 2Q23f The unemployment rate has gradually been increasing since 2022 . The jobless rate rose to 8 . 5 % in the quarter ended in May, rising 70 bp . when compared to a year ago . This trend has been a consequence of the 2 . 8 % annual growth in the labor force (in relation to the 2 . 0 % annual increase in employment), resulting in an overall recovery in the participation rate . In this environment, some leading indicators, such as the Internet Job Ad Index (conducted by the Central Bank), anticipate further deterioration in the labor market over the following months . CPI & Unemployment Rate (1) (In Percentage) 12.5 13.7 12.8 11.1 7.8 7.9 7.9 8.8 7.6 8.7 2Q22 2Q23f 3Q22 4Q22 1Q23 CPI Unemployment (1) End of period CPI 12m variation and average unemployment rate for the quarter. The inflation rate has continued to decline, although it remains well above the medium - term target set by the Central Bank . In June, the CPI decreased 0 . 2 % on a monthly basis, while the measure that excludes food and energy prices fell 0 . 1 % in the same period . The lower inflationary pressures were also displayed by alternative core figures, such as the index that excludes volatile prices, which fell 0 . 4 % on a monthly basis . As a result, 12 - month inflation went down to 7 . 6 % , the lowest level since December 2021 , trend that was driven by the substantial decline of tradable goods, which declined to 7 . 3 % from a peak of 17 % in the 3 Q 22 , due to a strengthened local currency . Based on the above, the Central Bank Board maintained the overnight rate at 11 . 25 % in June . However, the board adopted a more expansionary bias in the press release by anticipating that cut rates are likely to occur in the short - term . | 24

Economic & Business Environment Competitive Landscape The Chilean market for banking and other financial services is highly and increasingly competitive and consists of various market sectors . The most important sector is commercial banking with total loans (excluding operations of subsidiaries abroad) representing 86 % of the Chilean GDP as of December 31 , 2022 . The Chilean banking industry consisted of 17 banks, 16 of which were private sector banks and one state - owned bank, namely, Banco Estado . We face significant and increasing competition in all market segments in which we operate . As a comprehensive commercial bank that offers a wide range of services to all types of enterprises and individual customers, we deal with a variety of competitors, ranging from large private sector commercial banks to more specialized entities, such as “niche” banks . In addition, we face competition from other types of lenders, such as non - banking leasing, crowdfunding, factoring and automobile financing companies, especially in credit products, mutual funds, pension funds and insurance companies within the market for savings products, as well as insurance companies in the market for mortgage loans . Likewise, other non - traditional providers of financial services have emerged over the last years, such as e - commerce, local and foreign fintech companies, Telecom companies, like internet and mobile phone providers, and more recently some marketplaces that may set and provide offerings, in the form of temporary financing, directly to their customers or providers . These new ways of doing business are based on the disintermediation of traditional banking service providers while not being subject to the same capital requirements that banks are . Therefore, these providers represent a challenge for the traditional banking industry . Within the local banking industry, our primary competitors are the main private sector commercial banks in Chile, namely, Banco Santander - Chile, BCI, Scotiabank Chile, and Itaú . Nevertheless, we also face competition from Banco Estado . In the retail market, we compete with other private sector Chilean banks, as well as with Banco del Estado . Among private sector banks, we believe our strongest competitors in this market are Banco Santander — Chile, Scotiabank Chile and BCI, as these banks have developed diversified business strategies focused on both small and medium sized companies and lower to middle income segments of the Chilean population . In addition, we believe our strongest competitors in the high - income individual segment are Banco Santander — Chile, and Banco Bice, as these banks rely on specialized business models that provide wealth management and traditional banking services, as we do . In the wholesale market, we believe our strongest competitors are also Banco Santander - Chile, BCI, Itaú and Scotiabank Chile . Similarly, we believe these banks are our most significant competitors in the small and medium sized companies’ business segment . We also compete, mainly through our subsidiaries, with companies that offer non - banking specialized financial services in the higher - income individuals segment and the middle market and corporate segment such as Larrain Vial, BTG Pactual, Moneda Asset and CrediCorp, whose core businesses are stock brokerage, financial advisory and wealth management services . Other Chilean commercial banks also compete in these markets of specialized financial services, but they are less focused on such businesses . The Chilean banking industry has experienced increased levels of competition in recent years from domestic as well as foreign banks . This phenomenon has triggered a consolidation wave within the industry and the creation of more comprehensive banking entities that participate in most of our markets . Consequently, banks’ strategies have been increasingly focused on reducing costs and improving efficiency standards in order to compete effectively with the larger banks . | 25
Economic & Business Environment Banking Industry Performance and Competitive Position - 2.8% - 0.5% - 2.0% - 4.6% 3.0% 2.5% 1.6% 0.9% 1.3% 1.5% The banking business continues to be constrained due to both the prevailing monetary landscape characterized by a hawkish sentiment by the Central Bank and a deteriorated business and consumer sentiment regarding the economic outlook . As such, offer conditions remain tightened across all business segments but particularly in personal banking in light of a riskier credit environment for consumer loans, whereas demand for loans has stagnated, specifically from the wholesale segment, due to uncertainties surrounding the wide array of reforms the government is expected to undertake and economic and financial conditions that continue to be restricted Based on these dynamics, the local banking industry managed to post total loans by Ch $ 228 , 470 , 417 million as of May 30 , 2023 (latest available information that excludes operations by offshore subsidiaries) . This amount denotes a 7 . 2 % annual nominal growth when compared to May 2022 and a 1 . 4 % year - to - date expansion . This level of nominal loan growth indicates a clear contraction in real terms . In fact, when adjusting by inflation, total loans contracted 2 . 8 % when compared to May 2022 and 1 . 2 % year - to - date . Loan Growth (1) (12m % change, in real terms) 5.9% 1.7% 1.4% 0.4% - 2.4% - 2.5% - 2.8% - 3.3% - 5.2% - 5.7% Dec - 22 Jun - 22 Sep - 22 Mar - 23 May - 23 Commercial Loans Consumer Loans Total Loans Residential Mortgage Loans (1) Figures do not include operations of subsidiaries abroad. As evidenced by the chart, the most affected lending products continued to be both commercial loans decreasing 5.2% in real terms on an annual basis and consumer loans contracting 3 . 3 % in real terms within the same period . The downward trend is aligned with findings revealed by the Central Bank in the 2 Q 23 Credit Survey, particularly in terms of a subdued demand from the Wholesale Banking segment and constrained offer conditions for individuals . Residential mortgage loans, instead, continue to be the exception in terms of loan growth by expanding 1 . 5 % in real terms when compared to May 2022 , though well below the dynamism shown before the pandemic . The evolution of this lending product has been the result of the level achieved by long - term interest rates during the COVID - 19 , together with stricter requirements set by banks in terms of both Loan - to - Value ratio and customers’ financial burden . As for liabilities, the marked trends seen in the last quarters seem to be softening, based on both a funding composition that appears to be converging to mid - term figures and tempered balance sheet growth due to a lackluster economic activity . In this regard, even though Demand Deposits have continued to decline by reaching Ch $ 64 , 992 , 135 million in May 2023 , both the 10 . 9 % annual drop and the 3 . 4 % year - to - date decrease represented by this figure reflect a decelerating downward trend of previous quarters . This is also endorsed by a “reciprocity” ratio of Demand Deposits to Total Loans that landed at 28 . 4 % in May 2023 , which is very close to average historical levels . Likewise, Time Deposits totalled Ch $ 105 , 225 , 923 million in May 2023 , which indicates a 21 . 8 % annual advance and a 2 . 6 % year - to - date increase, denoting a significant deceleration over the last months . Long - term debt and funding through REPO have also tempered, following reduced funding needs arising from balance sheet growth . Regarding profits, the industry posted a bottom line of Ch $ 1 , 973 , 744 million as of May 2023 , which represents a Ch $ 496 , 881 million decline when compared to the same period of 2022 . The decline in net income was the consequence of : (i) higher Expected Credit Losses by Ch $ 364 , 328 million on an annual basis, owing to deteriorated risk profiles of both individuals and companies in relation to the positive payment behavior in 2022 , and (ii) increased operating expenses by Ch $ 204 , 058 million on a yearly basis, primarily influenced by the inflation - indexed line items, such as personnel, IT - related expenses and external advisory, among others . | 26
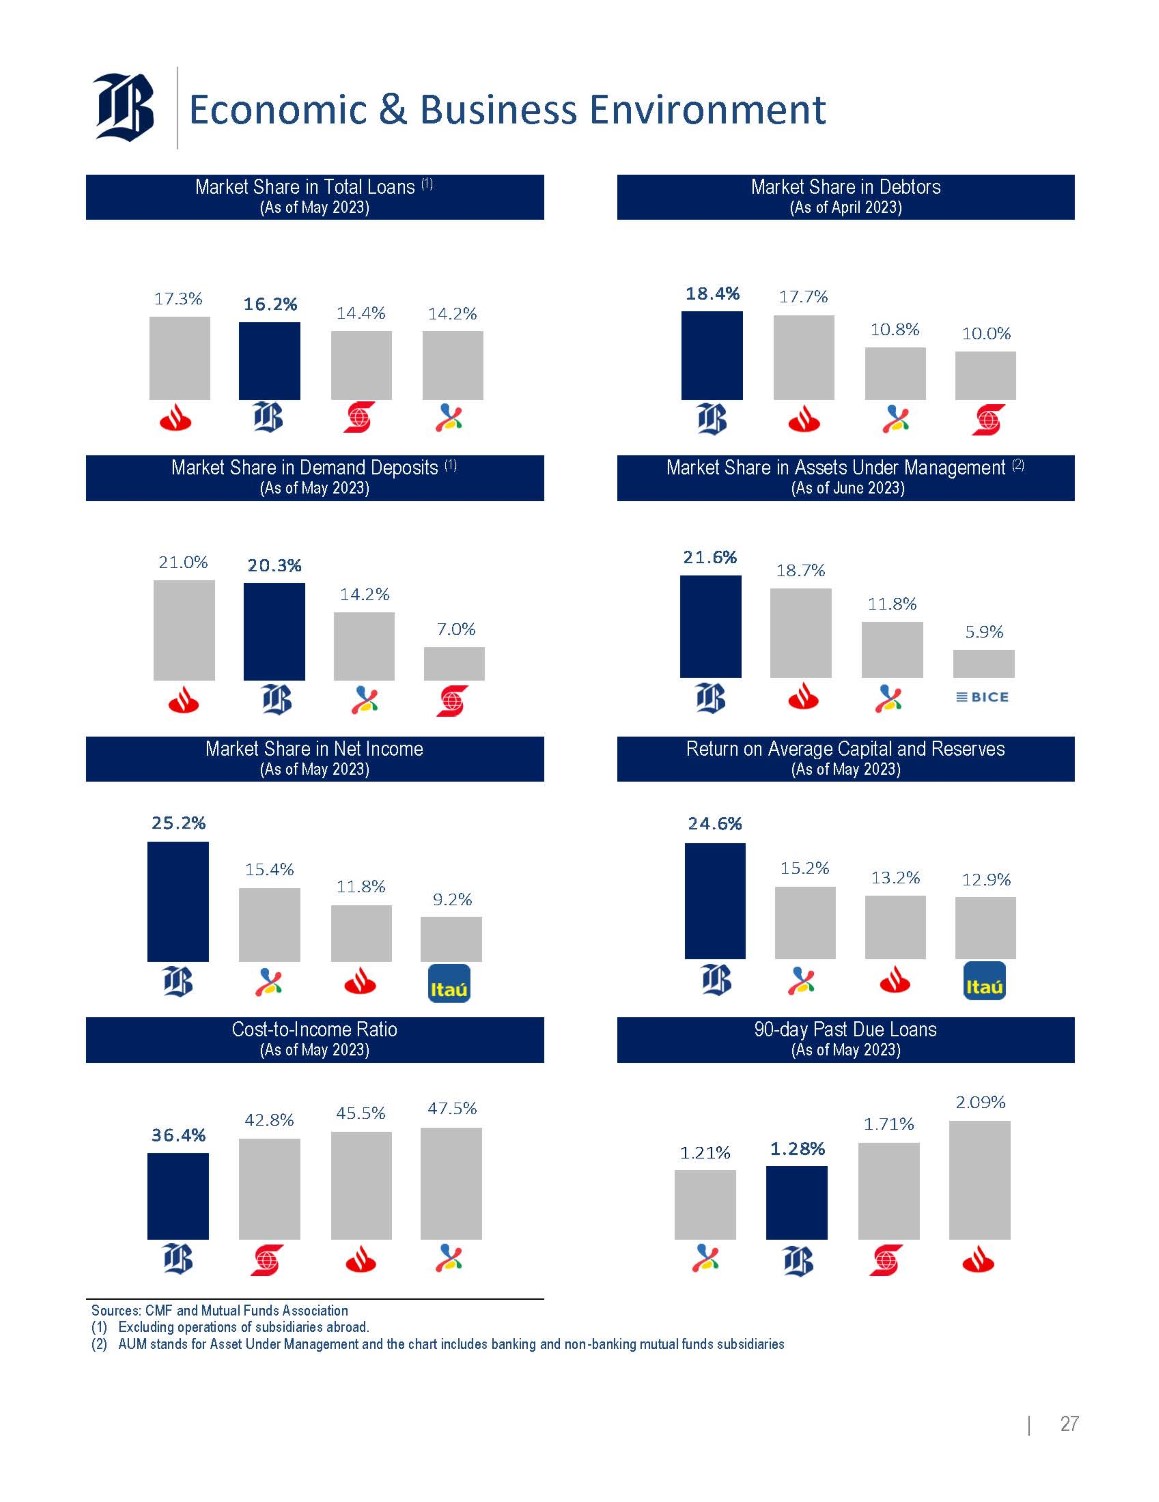
Economic & Business Environment Market Share in Debtors (As of April 2023) Market Share in Total Loans (1) (As of May 2023) 18.4% 17.7% 10.8% 10.0% 17.3% 16.2% 14.4% 14.2% Market Share in Assets Under Management (2) (As of June 2023) Market Share in Demand Deposits (1) (As of May 2023) 21.6% 18.7% 11.8% 5.9% 21.0% 20.3% 14.2% 7.0% Return on Average Capital and Reserves (As of May 2023) Market Share in Net Income (As of May 2023) 24.6% 15.2% 13.2% 12.9% 25.2% 15.4% 11.8% 9.2% 90 - day Past Due Loans (As of May 2023) Cost - to - Income Ratio (As of May 2023) 2.09% 1.71% 1.21% 1.28% 42.8% 45.5% 47.5% 36.4% Sources: CMF and Mutual Funds Association (1) Excluding operations of subsidiaries abroad. (2) AUM stands for Asset Under Management and the chart includes banking and non - banking mutual funds subsidiaries | 27
Economic & Business Environment Key Business Drivers The GDP slowdown has resulted from the normalization of several factors that fueled more than expected growth over the last years . Some of the main adjustments included the reduction in fiscal spending last year, the sharp rise in the overnight rate, and the absence of further measures contributing to increasing liquidity . Overall, the economy is converging towards levels consistent with its fundamentals . In this environment, we expect the economy to contract by 0 . 2 % this year, resulting from negative growth in the 1 H 23 and a slight recovery in the 2 H 23 . The main factors conducting this performance should be a decline in total consumption (driven by a sharp contraction in durable goods) and a fall in gross investment . In contrast, we expect a positive contribution from net exports to local growth due to a recovery in total exports and a contraction in imports, in line with the dynamics observed in domestic demand . All these factors should contribute to narrowing the current account deficit, which improved from 9 % of GDP in 2022 to 6 . 9 % in the 12 - month period ending in March of 2023 , due to the surplus posted in 1 Q 23 . We also expect headline inflation to continue falling . This trend will likely result from both subdued growth, which reduces non - tradable inflationary pressures, and lower tradable prices due to the stronger Chilean peso . Thus, we foresee 12 - month inflation at 3 . 8 % at the end of 2023 , which is still above the policy target of 3 . 0 % , but well below the 12 . 8 % posted in 2022 . Given these trends, we expect the Central Bank to begin an easing cycle in 3 Q 23 , reducing the monetary policy rate to nearly 7 . 5 % by the end of this year . These results are subject to certain risks : (i) GDP growth of trade partners, such as China and the U . S . , given the integration of Chile into the global economy, and (ii) the evolution of political discussions in the local front, particularly in critical fields such as constitution, pension system, health system and taxes . 2023f Chilean Economy (1) (0.2)% GDP Growth ~3.8% CPI Variation (EoP) ~7.5% Monetary Policy Interest Rate (EoP) (1) Based on Banco de Chile’s own estimates and forecasts provided by the Chilean Central Bank in the last Monetary Policy Report as of June 2023. In relation to the banking industry, for the rest of 2023 we expect: Loan growth to continue under pressure, on the grounds of the current economic landscape, characterized by low or negative GDP growth and interest rates that have remained well above neutral levels for longer than expected . These factors have coupled with both credit granting conditions that keep restrained for individuals and companies and, furthermore, economic reforms sponsored by the government that have taken a troubled path with the diverse political forces . Accordingly, even though we continue to believe that 12 - month real growth (adjusted by inflation) in total loans should converge to zero by December 2023 , we cannot rule out a real annual contraction in the neighborhood of 1 . 0 % in December 2023 . From the funding perspective, although monetary conditions should ease over the rest of the year, they will remain more tightened than previously expected . Accordingly, we believe demand deposits should continue to decline though at more tempered pace, based on which we now expect an annual contraction around 3 . 0 % in real terms for the industry (excluding subsidiaries abroad) . Instead, time deposits, interbank loans and debt placements should continue to converge to equilibrium relationships with loans over the rest of 2023 . In terms of P&L, the industry’s NIM have already declined in 2023 from the levels seen in 2022 , though less than previously considered, since inflation has stayed high though - based on recent pieces of information – a steeper and faster drop is foreseen for the 2 H 23 . As a consequence, NIM should continue to decrease from levels seen as of May 2023 . As for credit risk, past due loans and expected credit losses may deteriorate in the margin, from levels recorded as of May 2023 . 2023f Banking System (1) Slightly below inflation Nominal Loan Growth ~25% DDA / Total Loans Important Decline Net Interest Margin ~1.5% ECL / Avg. Loans ~1.9% Non - Performing Loans (>90d) (1) Based on Banco de Chile’s own estimates. | 28
Management Discussion & Analysis Snapshot on Strategic Advances Strategic Pillar Key Performance Indicator As of June 2023 Mid - Term Target Compliance x 75.4% Net Promoter Score Customer at the Center of our Decisions x Top 2 Market Share in Total Loans x 36.4% Cost - to - Income Ratio Efficiency and Productivity x Top 1 Return on Average Capital and Reserves Sustainability and Commitment to Chile x Top 2 Corporate Reputation (1) (1) Based on 2022 Merco Ranking. | 29
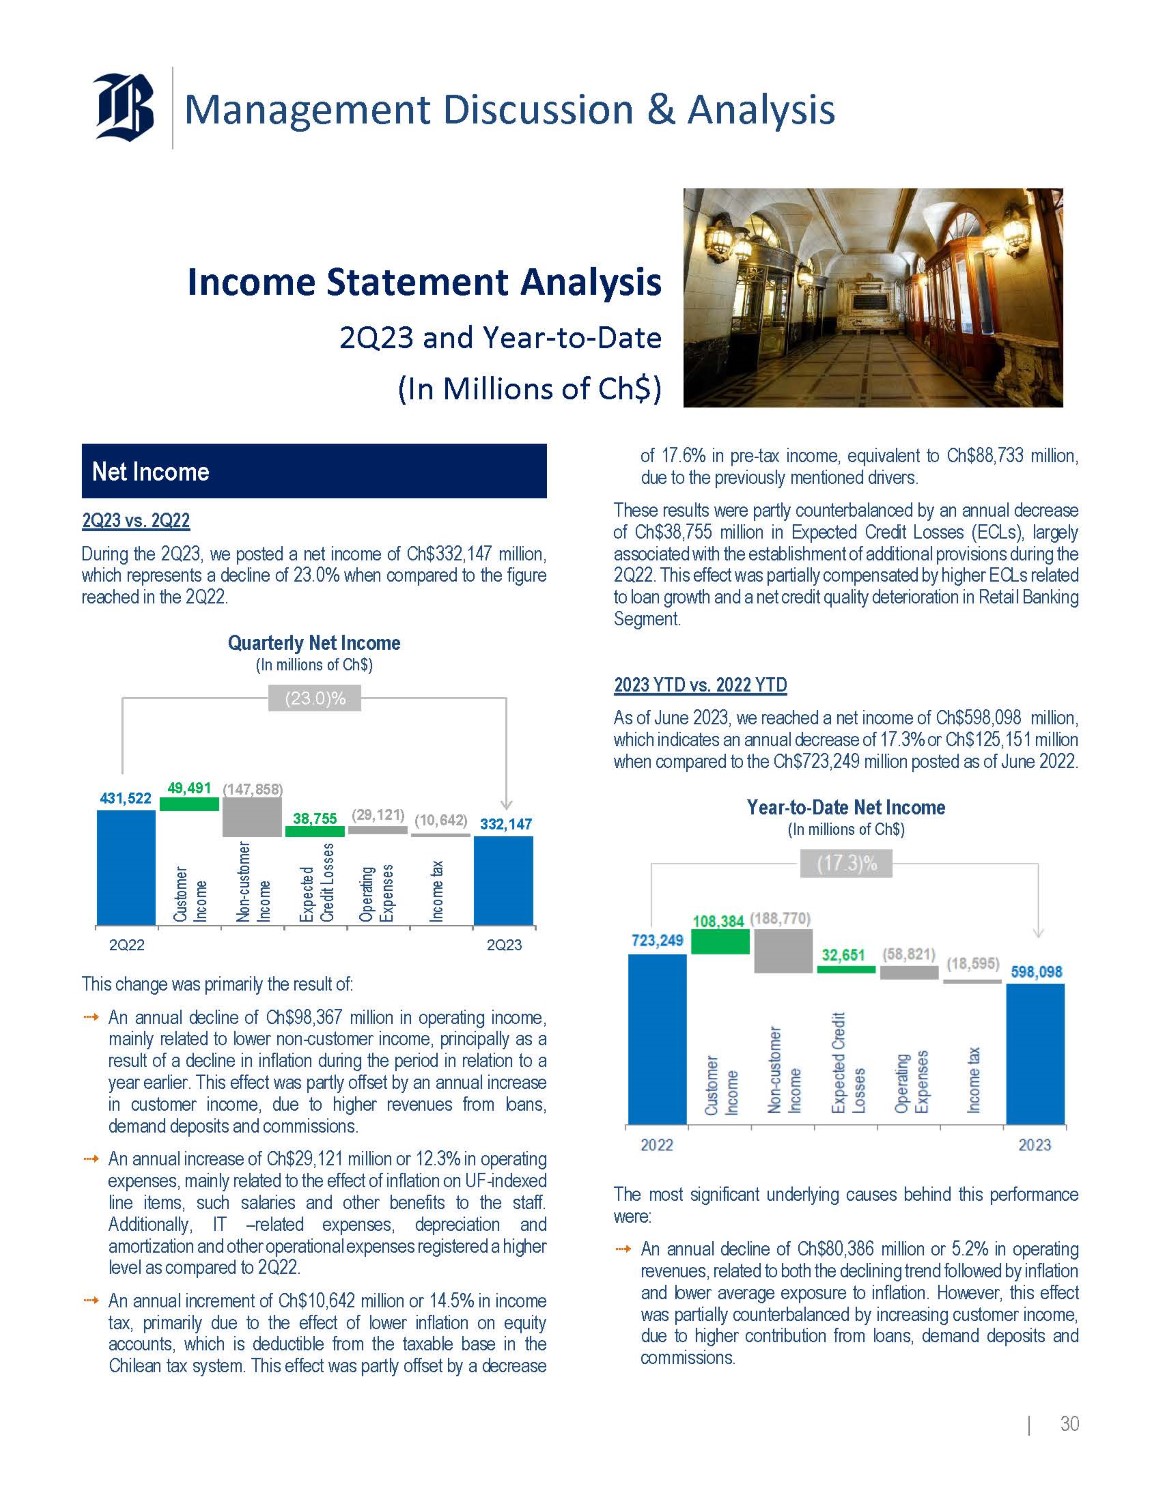
Management Discussion & Analysis Income Statement Analysis 2Q23 and Year - to - Date (In Millions of Ch$) Net Income 2 Q 23 vs . 2 Q 22 During the 2 Q 23 , we posted a net income of Ch $ 332 , 147 million, which represents a decline of 23 . 0 % when compared to the figure reached in the 2 Q 22 . Quarterly Net Income (In millions of Ch$) (23.0)% 431,522 49,491 (147,858) 38,755 (29,121) (10,642) 332,147 2Q23 2Q22 This change was primarily the result of : An annual decline of Ch $ 98 , 367 million in operating income, mainly related to lower non - customer income, principally as a result of a decline in inflation during the period in relation to a year earlier . This effect was partly offset by an annual increase in customer income, due to higher revenues from loans, demand deposits and commissions . An annual increase of Ch $ 29 , 121 million or 12 . 3 % in operating expenses, mainly related to the effect of inflation on UF - indexed line items, such salaries and other benefits to the staff . Additionally, IT – related expenses, depreciation and amortization and other operational expenses registered a higher level as compared to 2 Q 22 . An annual increment of Ch $ 10 , 642 million or 14 . 5 % in income tax, primarily due to the effect of lower inflation on equity accounts, which is deductible from the taxable base in the Chilean tax system . This effect was partly offset by a decrease Non - customer Income Income tax Customer Income Expected Credit Losses Operating Expenses of 17.6% in pre - tax income, equivalent to Ch$88,733 million, due to the previously mentioned drivers. These results were partly counterbalanced by an annual decrease of Ch $ 38 , 755 million in Expected Credit Losses (ECLs), largely associated with the establishment of additional provisions during the 2 Q 22 . This effect was partially compensated by higher ECLs related to loan growth and a net credit quality deterioration in Retail Banking Segment . 2023 YTD vs . 2022 YTD As of June 2023 , we reached a net income of Ch $ 598 , 098 million, which indicates an annual decrease of 17 . 3 % or Ch $ 125 , 151 million when compared to the Ch $ 723 , 249 million posted as of June 2022 . Year - to - Date Net Income (In millions of Ch$) The most significant underlying causes behind this performance were: An annual decline of Ch $ 80 , 386 million or 5 . 2 % in operating revenues, related to both the declining trend followed by inflation and lower average exposure to inflation . However, this effect was partially counterbalanced by increasing customer income, due to higher contribution from loans, demand deposits and commissions . | 30
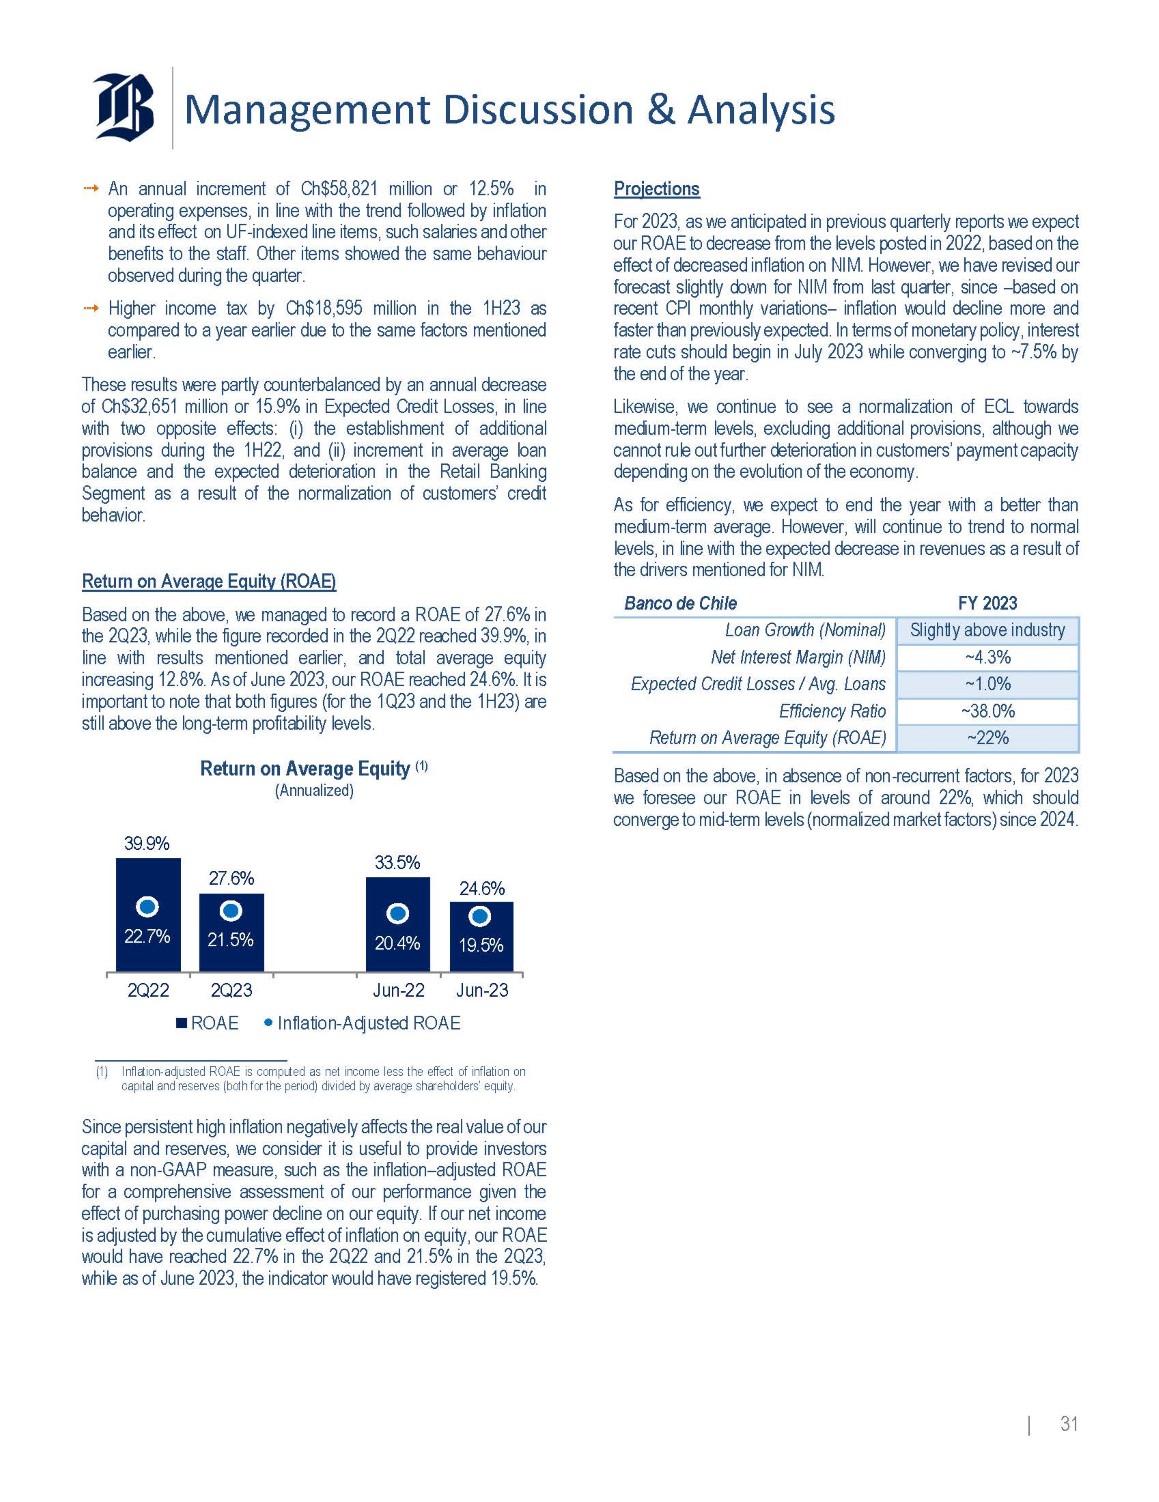
Management Discussion & Analysis An annual increment of Ch $ 58 , 821 million or 12 . 5 % in operating expenses, in line with the trend followed by inflation and its effect on UF - indexed line items, such salaries and other benefits to the staff . Other items showed the same behaviour observed during the quarter . Higher income tax by Ch $ 18 , 595 million in the 1 H 23 as compared to a year earlier due to the same factors mentioned earlier . These results were partly counterbalanced by an annual decrease of Ch $ 32 , 651 million or 15 . 9 % in Expected Credit Losses, in line with two opposite effects : (i) the establishment of additional provisions during the 1 H 22 , and (ii) increment in average loan balance and the expected deterioration in the Retail Banking Segment as a result of the normalization of customers’ credit behavior . Return on Average Equity (ROAE) Based on the above, we managed to record a ROAE of 27 . 6 % in the 2 Q 23 , while the figure recorded in the 2 Q 22 reached 39 . 9 % , in line with results mentioned earlier, and total average equity increasing 12 . 8 % . As of June 2023 , our ROAE reached 24 . 6 % . It is important to note that both figures (for the 1 Q 23 and the 1 H 23 ) are still above the long - term profitability levels . Return on Average Equity (1) (Annualized) 39.9% 27.6% 33.5% 24.6% 22.7% 21.5% 20.4% 19.5% 2Q22 2Q23 ROAE Jun - 22 Jun - 23 Inflation - Adjusted ROAE (1) Inflation - adjusted ROAE is computed as net income less the effect of inflation on capital and reserves (both for the period) divided by average shareholders’ equity. | 31 Since persistent high inflation negatively affects the real value of our capital and reserves, we consider it is useful to provide investors with a non - GAAP measure, such as the inflation – adjusted ROAE for a comprehensive assessment of our performance given the effect of purchasing power decline on our equity . If our net income is adjusted by the cumulative effect of inflation on equity, our ROAE would have reached 22 . 7 % in the 2 Q 22 and 21 . 5 % in the 2 Q 23 , while as of June 2023 , the indicator would have registered 19 . 5 % . Projections For 2023 , as we anticipated in previous quarterly reports we expect our ROAE to decrease from the levels posted in 2022 , based on the effect of decreased inflation on NIM . However, we have revised our forecast slightly down for NIM from last quarter, since – based on recent CPI monthly variations – inflation would decline more and faster than previously expected . In terms of monetary policy, interest rate cuts should begin in July 2023 while converging to ~ 7 . 5 % by the end of the year . Likewise, we continue to see a normalization of ECL towards medium - term levels, excluding additional provisions, although we cannot rule out further deterioration in customers’ payment capacity depending on the evolution of the economy . As for efficiency, we expect to end the year with a better than medium - term average . However, will continue to trend to normal levels, in line with the expected decrease in revenues as a result of the drivers mentioned for NIM . FY 2023 Banco de Chile Slightly above industry Loan Growth (Nominal) ~4.3% Net Interest Margin (NIM) ~1.0% Expected Credit Losses / Avg. Loans ~38.0% Efficiency Ratio ~22% Return on Average Equity (ROAE) Based on the above, in absence of non - recurrent factors, for 2023 we foresee our ROAE in levels of around 22 % , which should converge to mid - term levels (normalized market factors) since 2024 .
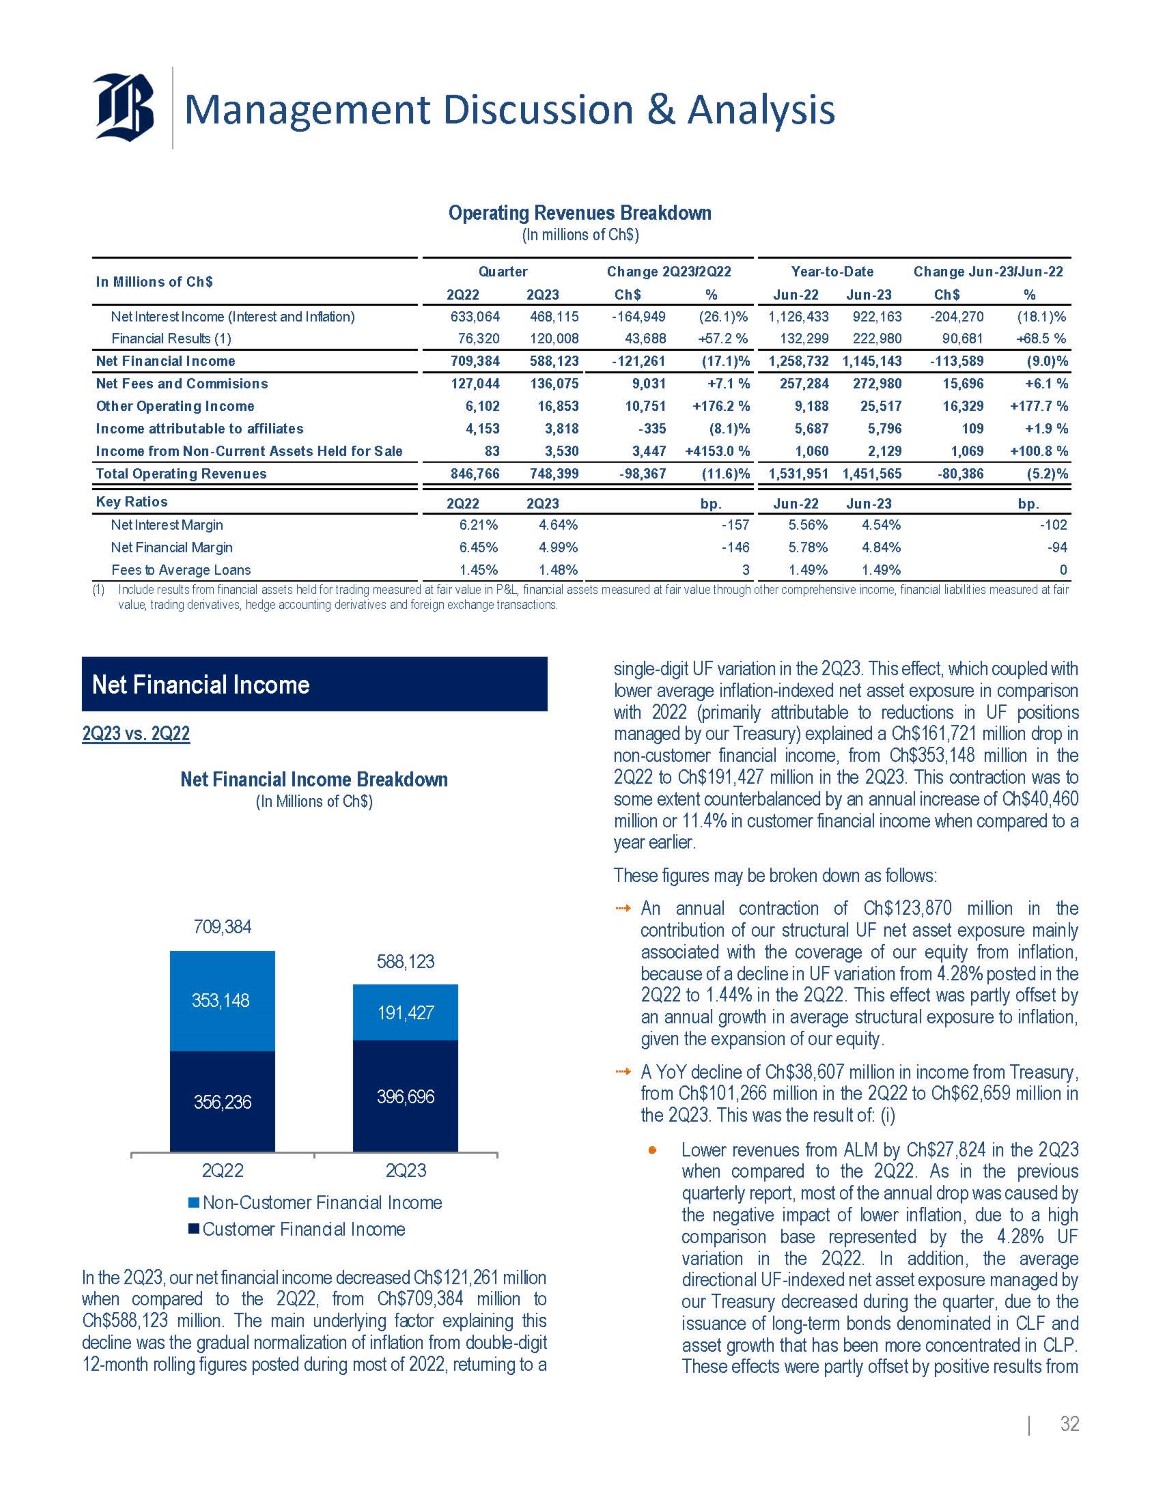
Management Discussion & Analysis Operating Revenues Breakdown (In millions of Ch$) Quarter Change 2Q23/2Q22 % Ch$ Jun - 23 Jun - 22 % Ch$ 2Q23 2Q22 (18.1)% - 204,270 922,163 1,126,433 (26.1)% - 164,949 468,115 633,064 Net Interest Income (Interest and Inflation) +68.5 % 90,681 222,980 132,299 +57.2 % 43,688 120,008 76,320 Financial Results (1) (9.0)% - 113,589 1,145,143 1,258,732 (17.1)% - 121,261 588,123 709,384 Net Financial Income +6.1 % 15,696 272,980 257,284 +7.1 % 9,031 136,075 127,044 Net Fees and Commisions +177.7 % 16,329 25,517 9,188 +176.2 % 10,751 16,853 6,102 Other Operating Income +1.9 % 109 5,796 5,687 (8.1)% - 335 3,818 4,153 Income attributable to affiliates +100.8 % 1,069 2,129 1,060 +4153.0 % 3,447 3,530 83 Income from Non - Current Assets Held for Sale (5.2)% - 80,386 1,451,565 1,531,951 (11.6)% - 98,367 748,399 846,766 Total Operating Revenues bp. Jun - 23 Jun - 22 bp. 2Q23 2Q22 Key Ratios - 102 4.54% 5.56% - 157 4.64% 6.21% Net Interest Margin - 94 4.84% 5.78% - 146 4.99% 6.45% Net Financial Margin 0 1.49% 1.49% 3 1.48% 1.45% Fees to Average Loans Change Jun - 23/Jun - 22 In Millions of Ch$ Year - to - Date (1) Include results from financial assets held for trading measured at fair value in P&L, financial assets measured at fair value through other comprehensive income, financial liabilities measured at fair value, trading derivatives, hedge accounting derivatives and foreign exchange transactions. Net Financial Income 2Q23 vs. 2Q22 Net Financial Income Breakdown (In Millions of Ch$) 356,236 396,696 353,148 191,427 709,384 588,123 2Q22 2Q23 Non - Customer Financial Income Customer Financial Income In the 2 Q 23 , our net financial income decreased Ch $ 121 , 261 million when compared to the 2 Q 22 , from Ch $ 709 , 384 million to Ch $ 588 , 123 million . The main underlying factor explaining this decline was the gradual normalization of inflation from double - digit 12 - month rolling figures posted during most of 2022 , returning to a | 32 single - digit UF variation in the 2 Q 23 . This effect, which coupled with lower average inflation - indexed net asset exposure in comparison with 2022 (primarily attributable to reductions in UF positions managed by our Treasury) explained a Ch $ 161 , 721 million drop in non - customer financial income, from Ch $ 353 , 148 million in the 2 Q 22 to Ch $ 191 , 427 million in the 2 Q 23 . This contraction was to some extent counterbalanced by an annual increase of Ch $ 40 , 460 million or 11 . 4 % in customer financial income when compared to a year earlier . These figures may be broken down as follows : An annual contraction of Ch $ 123 , 870 million in the contribution of our structural UF net asset exposure mainly associated with the coverage of our equity from inflation, because of a decline in UF variation from 4 . 28 % posted in the 2 Q 22 to 1 . 44 % in the 2 Q 22 . This effect was partly offset by an annual growth in average structural exposure to inflation, given the expansion of our equity . A YoY decline of Ch $ 38 , 607 million in income from Treasury, from Ch $ 101 , 266 million in the 2 Q 22 to Ch $ 62 , 659 million in the 2 Q 23 . This was the result of : (i) Lower revenues from ALM by Ch $ 27 , 824 in the 2 Q 23 when compared to the 2 Q 22 . As in the previous quarterly report, most of the annual drop was caused by the negative impact of lower inflation, due to a high comparison base represented by the 4 . 28 % UF variation in the 2 Q 22 . In addition, the average directional UF - indexed net asset exposure managed by our Treasury decreased during the quarter, due to the issuance of long - term bonds denominated in CLF and asset growth that has been more concentrated in CLP . These effects were partly offset by positive results from
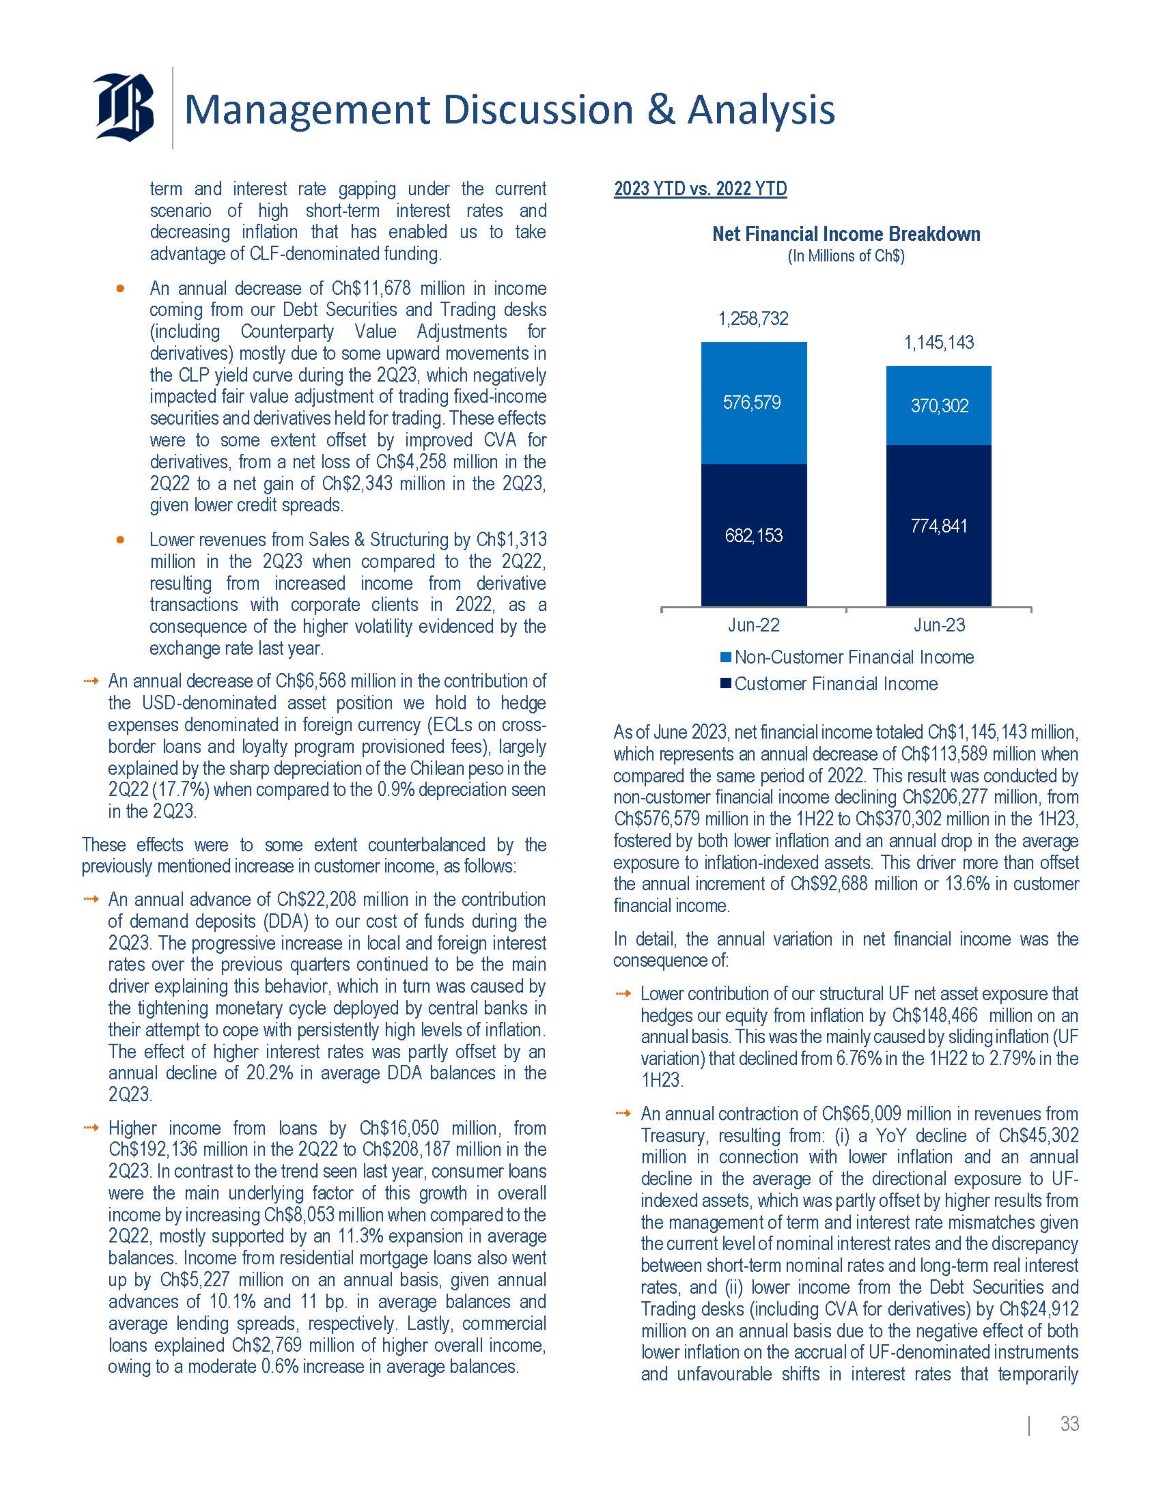
Management Discussion & Analysis term and interest rate gapping under the current scenario of high short - term interest rates and decreasing inflation that has enabled us to take advantage of CLF - denominated funding . An annual decrease of Ch $ 11 , 678 million in income coming from our Debt Securities and Trading desks (including Counterparty Value Adjustments for derivatives) mostly due to some upward movements in the CLP yield curve during the 2 Q 23 , which negatively impacted fair value adjustment of trading fixed - income securities and derivatives held for trading . These effects were to some extent offset by improved CVA for derivatives, from a net loss of Ch $ 4 , 258 million in the 2 Q 22 to a net gain of Ch $ 2 , 343 million in the 2 Q 23 , given lower credit spreads . Lower revenues from Sales & Structuring by Ch $ 1 , 313 million in the 2 Q 23 when compared to the 2 Q 22 , resulting from increased income from derivative transactions with corporate clients in 2022 , as a consequence of the higher volatility evidenced by the exchange rate last year . An annual decrease of Ch $ 6 , 568 million in the contribution of the USD - denominated asset position we hold to hedge expenses denominated in foreign currency (ECLs on cross - border loans and loyalty program provisioned fees), largely explained by the sharp depreciation of the Chilean peso in the 2 Q 22 ( 17 . 7 % ) when compared to the 0 . 9 % depreciation seen in the 2 Q 23 . These effects were to some extent counterbalanced by the previously mentioned increase in customer income, as follows: An annual advance of Ch $ 22 , 208 million in the contribution of demand deposits (DDA) to our cost of funds during the 2 Q 23 . The progressive increase in local and foreign interest rates over the previous quarters continued to be the main driver explaining this behavior, which in turn was caused by the tightening monetary cycle deployed by central banks in their attempt to cope with persistently high levels of inflation . The effect of higher interest rates was partly offset by an annual decline of 20 . 2 % in average DDA balances in the 2 Q 23 . Higher income from loans by Ch $ 16 , 050 million, from Ch $ 192 , 136 million in the 2 Q 22 to Ch $ 208 , 187 million in the 2 Q 23 . In contrast to the trend seen last year, consumer loans were the main underlying factor of this growth in overall income by increasing Ch $ 8 , 053 million when compared to the 2 Q 22 , mostly supported by an 11 . 3 % expansion in average balances . Income from residential mortgage loans also went up by Ch $ 5 , 227 million on an annual basis, given annual advances of 10 . 1 % and 11 bp . in average balances and average lending spreads, respectively . Lastly, commercial loans explained Ch $ 2 , 769 million of higher overall income, owing to a moderate 0 . 6 % increase in average balances . 2023 YTD vs. 2022 YTD Net Financial Income Breakdown (In Millions of Ch$) 1,258,732 682,153 774,841 576,579 370,302 1,145,143 Jun - 22 Jun - 23 Non - Customer Financial Income Customer Financial Income As of June 2023 , net financial income totaled Ch $ 1 , 145 , 143 million, which represents an annual decrease of Ch $ 113 , 589 million when compared the same period of 2022 . This result was conducted by non - customer financial income declining Ch $ 206 , 277 million, from Ch $ 576 , 579 million in the 1 H 22 to Ch $ 370 , 302 million in the 1 H 23 , fostered by both lower inflation and an annual drop in the average exposure to inflation - indexed assets . This driver more than offset the annual increment of Ch $ 92 , 688 million or 13 . 6 % in customer financial income . In detail, the annual variation in net financial income was the consequence of : Lower contribution of our structural UF net asset exposure that hedges our equity from inflation by Ch $ 148 , 466 million on an annual basis . This was the mainly caused by sliding inflation (UF variation) that declined from 6 . 76 % in the 1 H 22 to 2 . 79 % in the 1 H 23 . An annual contraction of Ch $ 65 , 009 million in revenues from Treasury, resulting from : (i) a YoY decline of Ch $ 45 , 302 million in connection with lower inflation and an annual decline in the average of the directional exposure to UF - indexed assets, which was partly offset by higher results from the management of term and interest rate mismatches given the current level of nominal interest rates and the discrepancy between short - term nominal rates and long - term real interest rates, and (ii) lower income from the Debt Securities and Trading desks (including CVA for derivatives) by Ch $ 24 , 912 million on an annual basis due to the negative effect of both lower inflation on the accrual of UF - denominated instruments and unfavourable shifts in interest rates that temporarily | 33
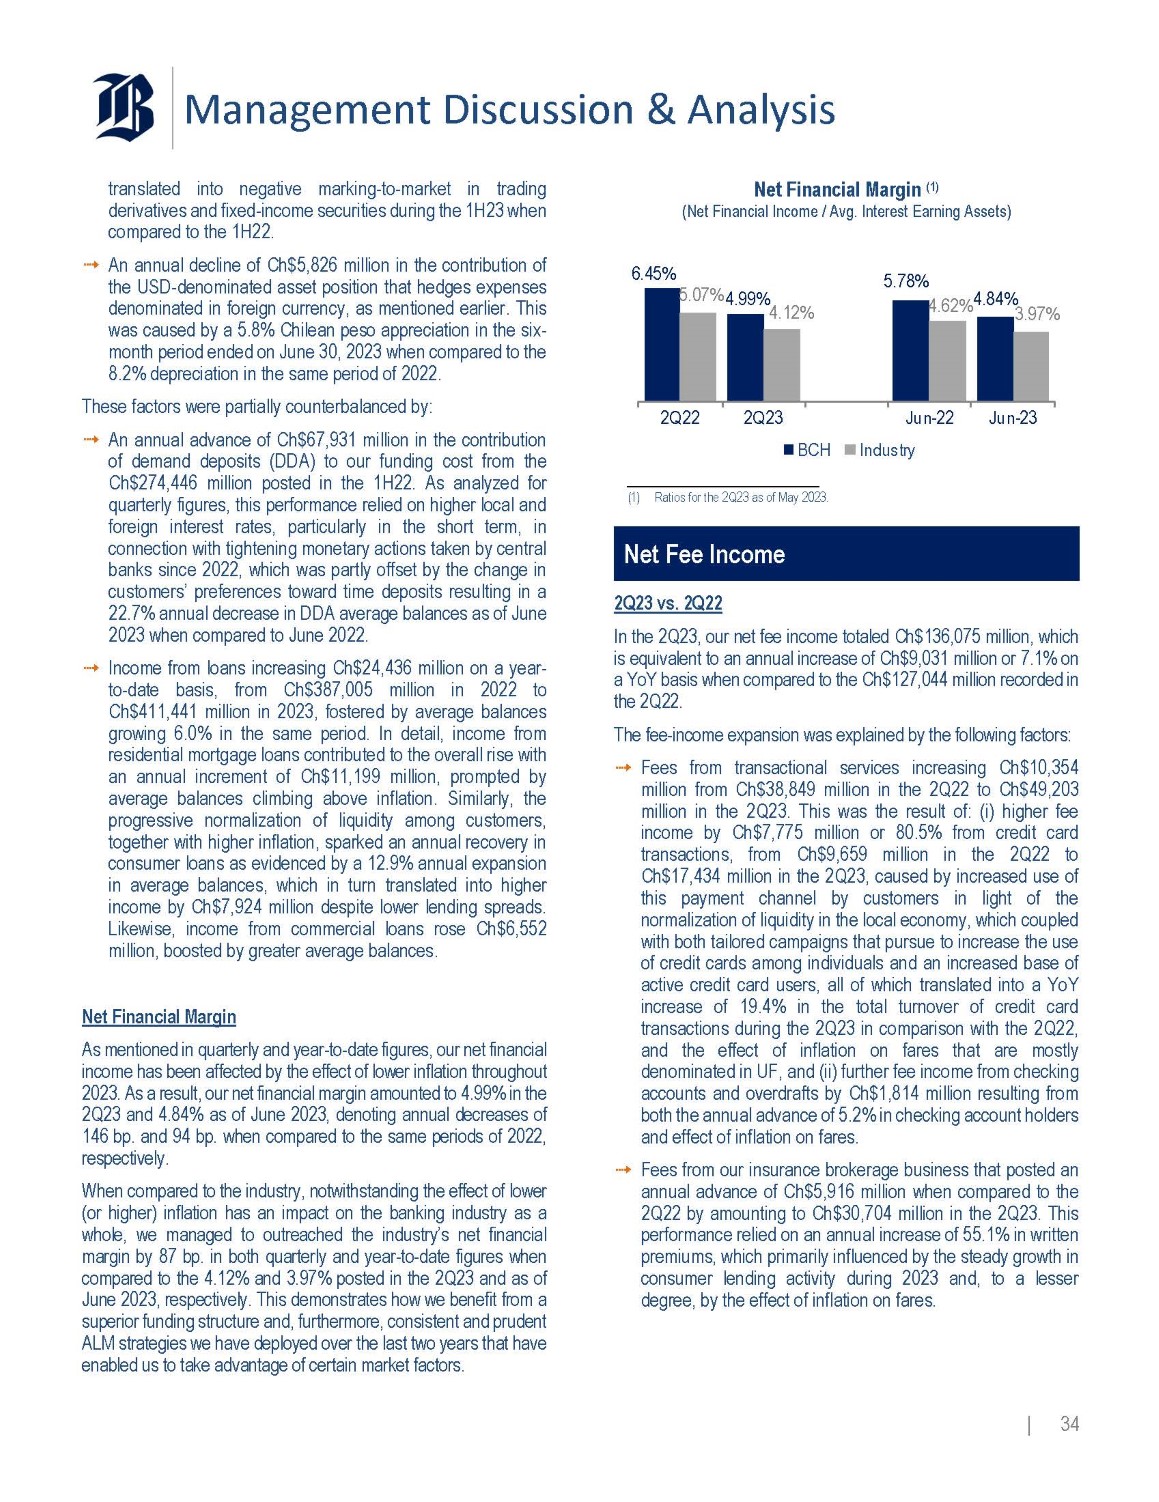
Management Discussion & Analysis translated into negative marking - to - market in trading derivatives and fixed - income securities during the 1 H 23 when compared to the 1 H 22 . An annual decline of Ch $ 5 , 826 million in the contribution of the USD - denominated asset position that hedges expenses denominated in foreign currency, as mentioned earlier . This was caused by a 5 . 8 % Chilean peso appreciation in the six - month period ended on June 30 , 2023 when compared to the 8 . 2 % depreciation in the same period of 2022 . These factors were partially counterbalanced by : An annual advance of Ch $ 67 , 931 million in the contribution of demand deposits (DDA) to our funding cost from the Ch $ 274 , 446 million posted in the 1 H 22 . As analyzed for quarterly figures, this performance relied on higher local and foreign interest rates, particularly in the short term, in connection with tightening monetary actions taken by central banks since 2022 , which was partly offset by the change in customers’ preferences toward time deposits resulting in a 22 . 7 % annual decrease in DDA average balances as of June 2023 when compared to June 2022 . Income from loans increasing Ch $ 24 , 436 million on a year - to - date basis, from Ch $ 387 , 005 million in 2022 to Ch $ 411 , 441 million in 2023 , fostered by average balances growing 6 . 0 % in the same period . In detail, income from residential mortgage loans contributed to the overall rise with an annual increment of Ch $ 11 , 199 million, prompted by average balances climbing above inflation . Similarly, the progressive normalization of liquidity among customers, together with higher inflation, sparked an annual recovery in consumer loans as evidenced by a 12 . 9 % annual expansion in average balances, which in turn translated into higher income by Ch $ 7 , 924 million despite lower lending spreads . Likewise, income from commercial loans rose Ch $ 6 , 552 million, boosted by greater average balances . Net Financial Margin As mentioned in quarterly and year - to - date figures, our net financial income has been affected by the effect of lower inflation throughout 2023 . As a result, our net financial margin amounted to 4 . 99 % in the 2 Q 23 and 4 . 84 % as of June 2023 , denoting annual decreases of 146 bp . and 94 bp . when compared to the same periods of 2022 , respectively . When compared to the industry, notwithstanding the effect of lower (or higher) inflation has an impact on the banking industry as a whole, we managed to outreached the industry’s net financial margin by 87 bp . in both quarterly and year - to - date figures when compared to the 4 . 12 % and 3 . 97 % posted in the 2 Q 23 and as of June 2023 , respectively . This demonstrates how we benefit from a superior funding structure and, furthermore, consistent and prudent ALM strategies we have deployed over the last two years that have enabled us to take advantage of certain market factors . 6.45% Net Financial Margin (1) (Net Financial Income / Avg. Interest Earning Assets) 5.78% 5.07% 4.99% 4.12% 4.62% 4.84% 3.97% 2Q22 2Q23 Jun - 23 Jun - 22 BCH Industry | 34 (1) Ratios for the 2Q23 as of May 2023. Net Fee Income 2 Q 23 vs . 2 Q 22 In the 2 Q 23 , our net fee income totaled Ch $ 136 , 075 million, which is equivalent to an annual increase of Ch $ 9 , 031 million or 7 . 1 % on a YoY basis when compared to the Ch $ 127 , 044 million recorded in the 2 Q 22 . The fee - income expansion was explained by the following factors : Fees from transactional services increasing Ch $ 10 , 354 million from Ch $ 38 , 849 million in the 2 Q 22 to Ch $ 49 , 203 million in the 2 Q 23 . This was the result of : (i) higher fee income by Ch $ 7 , 775 million or 80 . 5 % from credit card transactions, from Ch $ 9 , 659 million in the 2 Q 22 to Ch $ 17 , 434 million in the 2 Q 23 , caused by increased use of this payment channel by customers in light of the normalization of liquidity in the local economy, which coupled with both tailored campaigns that pursue to increase the use of credit cards among individuals and an increased base of active credit card users, all of which translated into a YoY increase of 19 . 4 % in the total turnover of credit card transactions during the 2 Q 23 in comparison with the 2 Q 22 , and the effect of inflation on fares that are mostly denominated in UF, and (ii) further fee income from checking accounts and overdrafts by Ch $ 1 , 814 million resulting from both the annual advance of 5 . 2 % in checking account holders and effect of inflation on fares . Fees from our insurance brokerage business that posted an annual advance of Ch $ 5 , 916 million when compared to the 2 Q 22 by amounting to Ch $ 30 , 704 million in the 2 Q 23 . This performance relied on an annual increase of 55 . 1 % in written premiums, which primarily influenced by the steady growth in consumer lending activity during 2023 and, to a lesser degree, by the effect of inflation on fares .
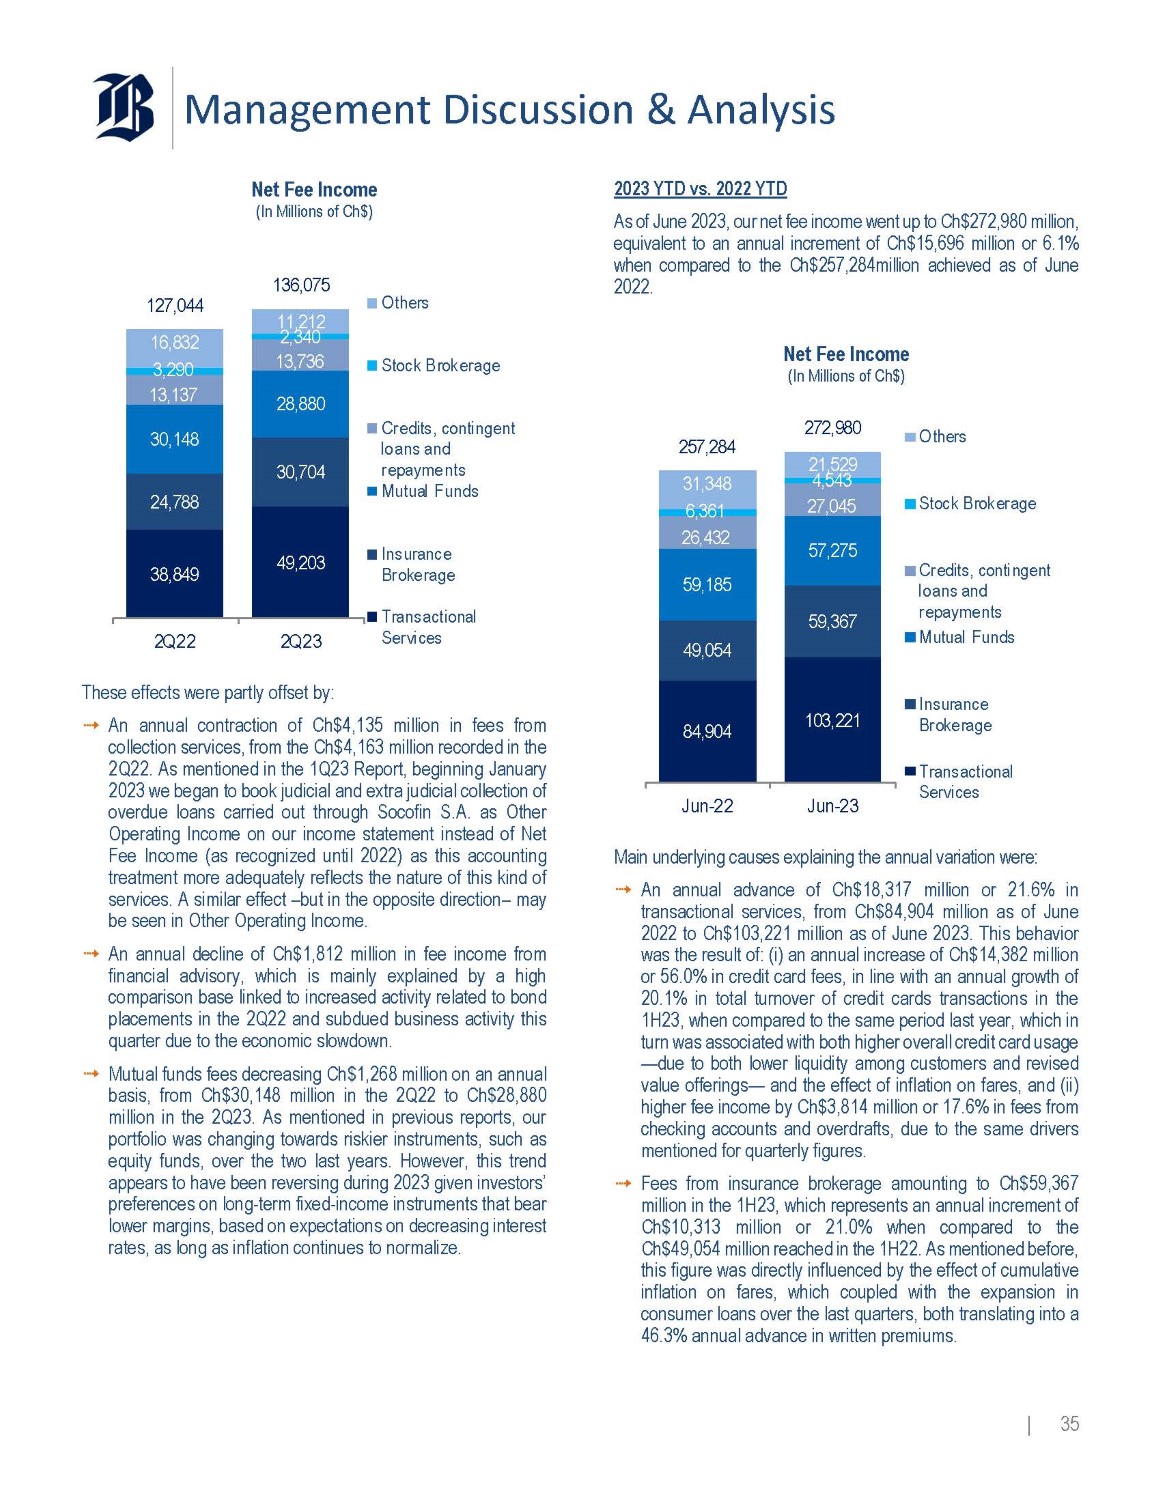
Management Discussion & Analysis Net Fee Income (In Millions of Ch$) 136,075 38,849 49,203 24,788 30,704 30,148 28,880 13,137 2,340 13,736 16,832 3,290 11,212 127,044 2Q22 2Q23 These effects were partly offset by: Others Stock Brokerage Credits, contingent loans and repayments Mutual Funds Insurance Brokerage Transactional Services An annual contraction of Ch $ 4 , 135 million in fees from collection services, from the Ch $ 4 , 163 million recorded in the 2 Q 22 . As mentioned in the 1 Q 23 Report, beginning January 2023 we began to book judicial and extra judicial collection of overdue loans carried out through Socofin S . A . as Other Operating Income on our income statement instead of Net Fee Income (as recognized until 2022 ) as this accounting treatment more adequately reflects the nature of this kind of services . A similar effect – but in the opposite direction – may be seen in Other Operating Income . An annual decline of Ch $ 1 , 812 million in fee income from financial advisory, which is mainly explained by a high comparison base linked to increased activity related to bond placements in the 2 Q 22 and subdued business activity this quarter due to the economic slowdown . Mutual funds fees decreasing Ch $ 1 , 268 million on an annual basis, from Ch $ 30 , 148 million in the 2 Q 22 to Ch $ 28 , 880 million in the 2 Q 23 . As mentioned in previous reports, our portfolio was changing towards riskier instruments, such as equity funds, over the two last years . However, this trend appears to have been reversing during 2023 given investors’ preferences on long - term fixed - income instruments that bear lower margins, based on expectations on decreasing interest rates, as long as inflation continues to normalize . 2023 YTD vs . 2022 YTD As of June 2023 , our net fee income went up to Ch $ 272 , 980 million, equivalent to an annual increment of Ch $ 15 , 696 million or 6 . 1 % when compared to the Ch $ 257 , 284 million achieved as of June 2022 . Net Fee Income (In Millions of Ch$) 84,904 103,221 49,054 59,367 59,185 57,275 26,432 27,045 31,348 6,361 21,529 4,543 257,284 272,980 Jun - 22 Jun - 23 Others Stock Brokerage Credits, contingent loans and repayments Mutual Funds Insurance Brokerage Transactional Services | 35 Main underlying causes explaining the annual variation were : An annual advance of Ch $ 18 , 317 million or 21 . 6 % in transactional services, from Ch $ 84 , 904 million as of June 2022 to Ch $ 103 , 221 million as of June 2023 . This behavior was the result of : (i) an annual increase of Ch $ 14 , 382 million or 56 . 0 % in credit card fees, in line with an annual growth of 20 . 1 % in total turnover of credit cards transactions in the 1 H 23 , when compared to the same period last year, which in turn was associated with both higher overall credit card usage — due to both lower liquidity among customers and revised value offerings — and the effect of inflation on fares, and (ii) higher fee income by Ch $ 3 , 814 million or 17 . 6 % in fees from checking accounts and overdrafts, due to the same drivers mentioned for quarterly figures . Fees from insurance brokerage amounting to Ch $ 59 , 367 million in the 1 H 23 , which represents an annual increment of Ch $ 10 , 313 million or 21 . 0 % when compared to the Ch $ 49 , 054 million reached in the 1 H 22 . As mentioned before, this figure was directly influenced by the effect of cumulative inflation on fares, which coupled with the expansion in consumer loans over the last quarters, both translating into a 46 . 3 % annual advance in written premiums .
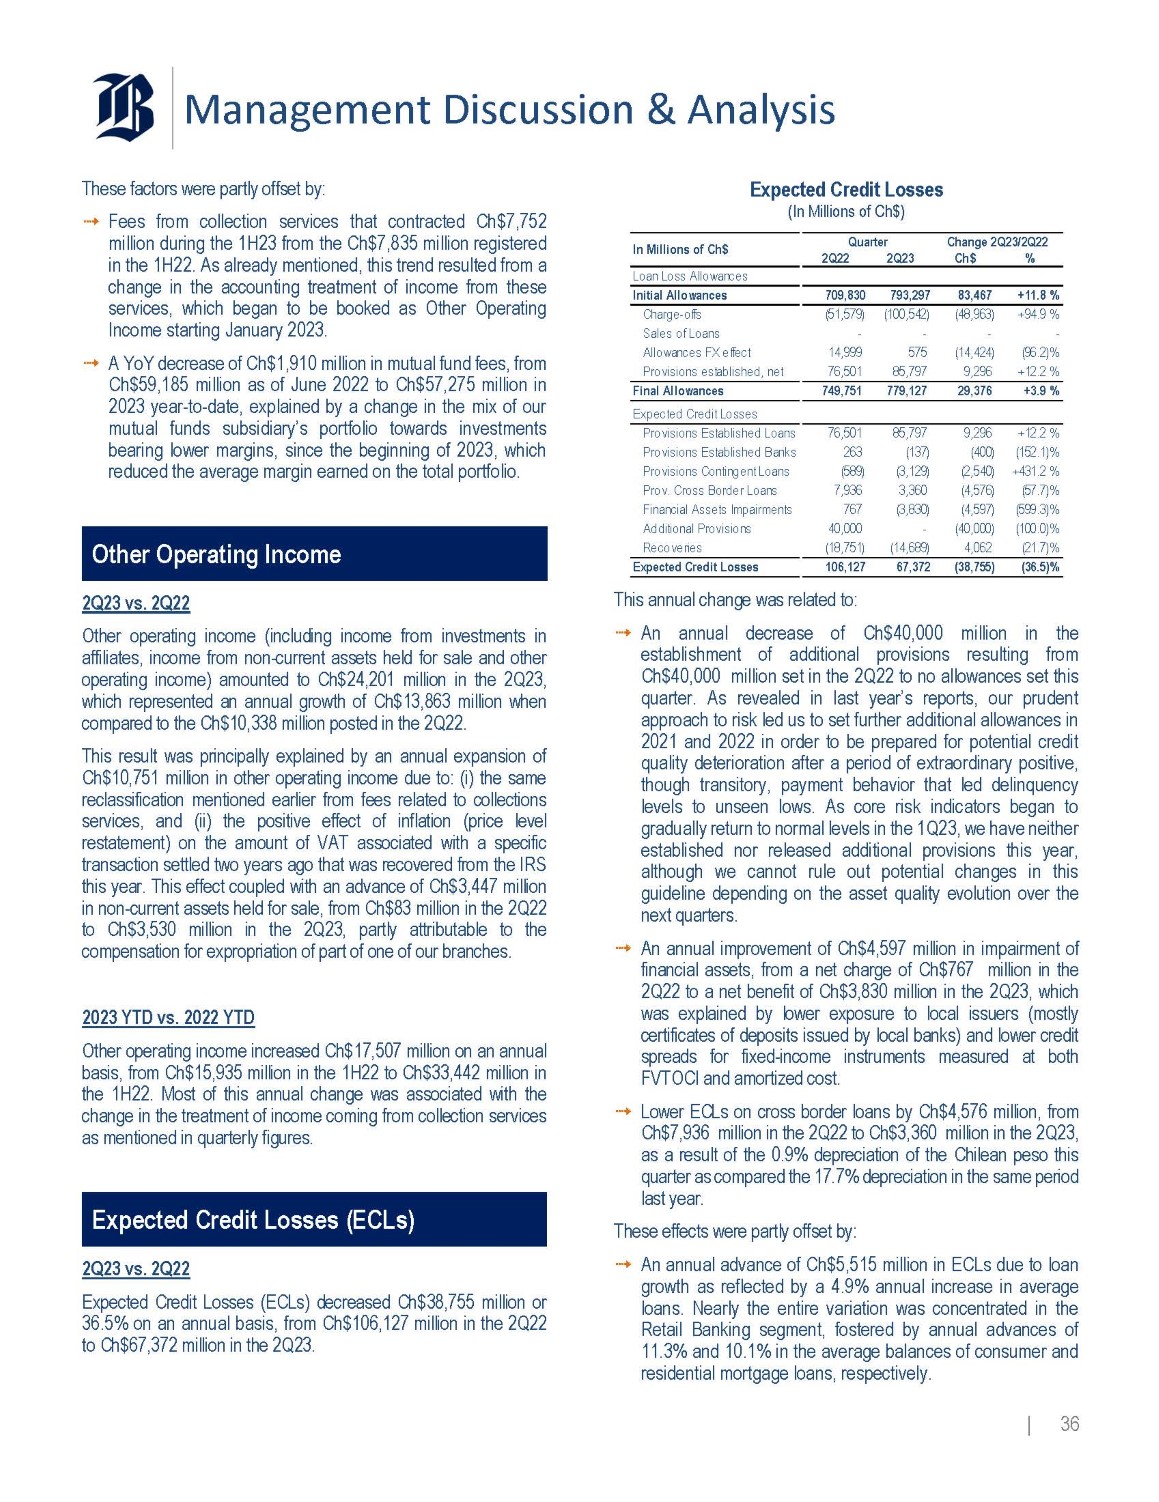
Management Discussion & Analysis These factors were partly offset by : Fees from collection services that contracted Ch $ 7 , 752 million during the 1 H 23 from the Ch $ 7 , 835 million registered in the 1 H 22 . As already mentioned, this trend resulted from a change in the accounting treatment of income from these services, which began to be booked as Other Operating Income starting January 2023 . A YoY decrease of Ch $ 1 , 910 million in mutual fund fees, from Ch $ 59 , 185 million as of June 2022 to Ch $ 57 , 275 million in 2023 year - to - date, explained by a change in the mix of our mutual funds subsidiary’s portfolio towards investments bearing lower margins, since the beginning of 2023 , which reduced the average margin earned on the total portfolio . | 36 Other Operating Income 2 Q 23 vs . 2 Q 22 Other operating income (including income from investments in affiliates, income from non - current assets held for sale and other operating income) amounted to Ch $ 24 , 201 million in the 2 Q 23 , which represented an annual growth of Ch $ 13 , 863 million when compared to the Ch $ 10 , 338 million posted in the 2 Q 22 . This result was principally explained by an annual expansion of Ch $ 10 , 751 million in other operating income due to : (i) the same reclassification mentioned earlier from fees related to collections services, and (ii) the positive effect of inflation (price level restatement) on the amount of VAT associated with a specific transaction settled two years ago that was recovered from the IRS this year . This effect coupled with an advance of Ch $ 3 , 447 million in non - current assets held for sale, from Ch $ 83 million in the 2 Q 22 to Ch $ 3 , 530 million in the 2 Q 23 , partly attributable to the compensation for expropriation of part of one of our branches . 2023 YTD vs . 2022 YTD Other operating income increased Ch $ 17 , 507 million on an annual basis, from Ch $ 15 , 935 million in the 1 H 22 to Ch $ 33 , 442 million in the 1 H 22 . Most of this annual change was associated with the change in the treatment of income coming from collection services as mentioned in quarterly figures . Expected Credit Losses (ECLs) 2 Q 23 vs . 2 Q 22 Expected Credit Losses (ECLs) decreased Ch $ 38 , 755 million or 36 . 5 % on an annual basis, from Ch $ 106 , 127 million in the 2 Q 22 to Ch $ 67 , 372 million in the 2 Q 23 . Expected Credit Losses (In Millions of Ch$) 23/2Q22 % Change 2Q Ch$ ter 2Q23 Quar 2Q22 In Millions of Ch$ Loan Loss Allowances +11.8 % 83,467 793,297 709,830 Initial Allowances +94.9 % (48,963) (100,542) (51,579) Charge - offs - - - - Sales of Loans (96.2)% (14,424) 575 14,999 Allowances FX effect +12.2 % 9,296 85,797 76,501 Provisions established, net +3.9 % 29,376 779,127 749,751 Final Allowances Expected Credit Losses +12.2 % 9,296 85,797 76,501 Provisions Established Loans (152.1)% (400) (137) 263 Provisions Established Banks +431.2 % (2,540) (3,129) (589) Provisions Contingent Loans (57.7)% (4,576) 3,360 7,936 Prov. Cross Border Loans (599.3)% (4,597) (3,830) 767 Financial Assets Impairments (100.0)% (40,000) - 40,000 Additional Provisions (21.7)% 4,062 (14,689) (18,751) Recoveries (36.5)% (38,755) 67,372 106,127 Expected Credit Losses This annual change was related to : An annual decrease of Ch $ 40 , 000 million in the establishment of additional provisions resulting from Ch $ 40 , 000 million set in the 2 Q 22 to no allowances set this quarter . As revealed in last year’s reports, our prudent approach to risk led us to set further additional allowances in 2021 and 2022 in order to be prepared for potential credit quality deterioration after a period of extraordinary positive, though transitory, payment behavior that led delinquency levels to unseen lows . As core risk indicators began to gradually return to normal levels in the 1 Q 23 , we have neither established nor released additional provisions this year, although we cannot rule out potential changes in this guideline depending on the asset quality evolution over the next quarters . An annual improvement of Ch $ 4 , 597 million in impairment of financial assets, from a net charge of Ch $ 767 million in the 2 Q 22 to a net benefit of Ch $ 3 , 830 million in the 2 Q 23 , which was explained by lower exposure to local issuers (mostly certificates of deposits issued by local banks) and lower credit spreads for fixed - income instruments measured at both FVTOCI and amortized cost . Lower ECLs on cross border loans by Ch $ 4 , 576 million, from Ch $ 7 , 936 million in the 2 Q 22 to Ch $ 3 , 360 million in the 2 Q 23 , as a result of the 0 . 9 % depreciation of the Chilean peso this quarter as compared the 17 . 7 % depreciation in the same period last year . These effects were partly offset by : An annual advance of Ch $ 5 , 515 million in ECLs due to loan growth as reflected by a 4 . 9 % annual increase in average loans . Nearly the entire variation was concentrated in the Retail Banking segment, fostered by annual advances of 11 . 3 % and 10 . 1 % in the average balances of consumer and residential mortgage loans, respectively .
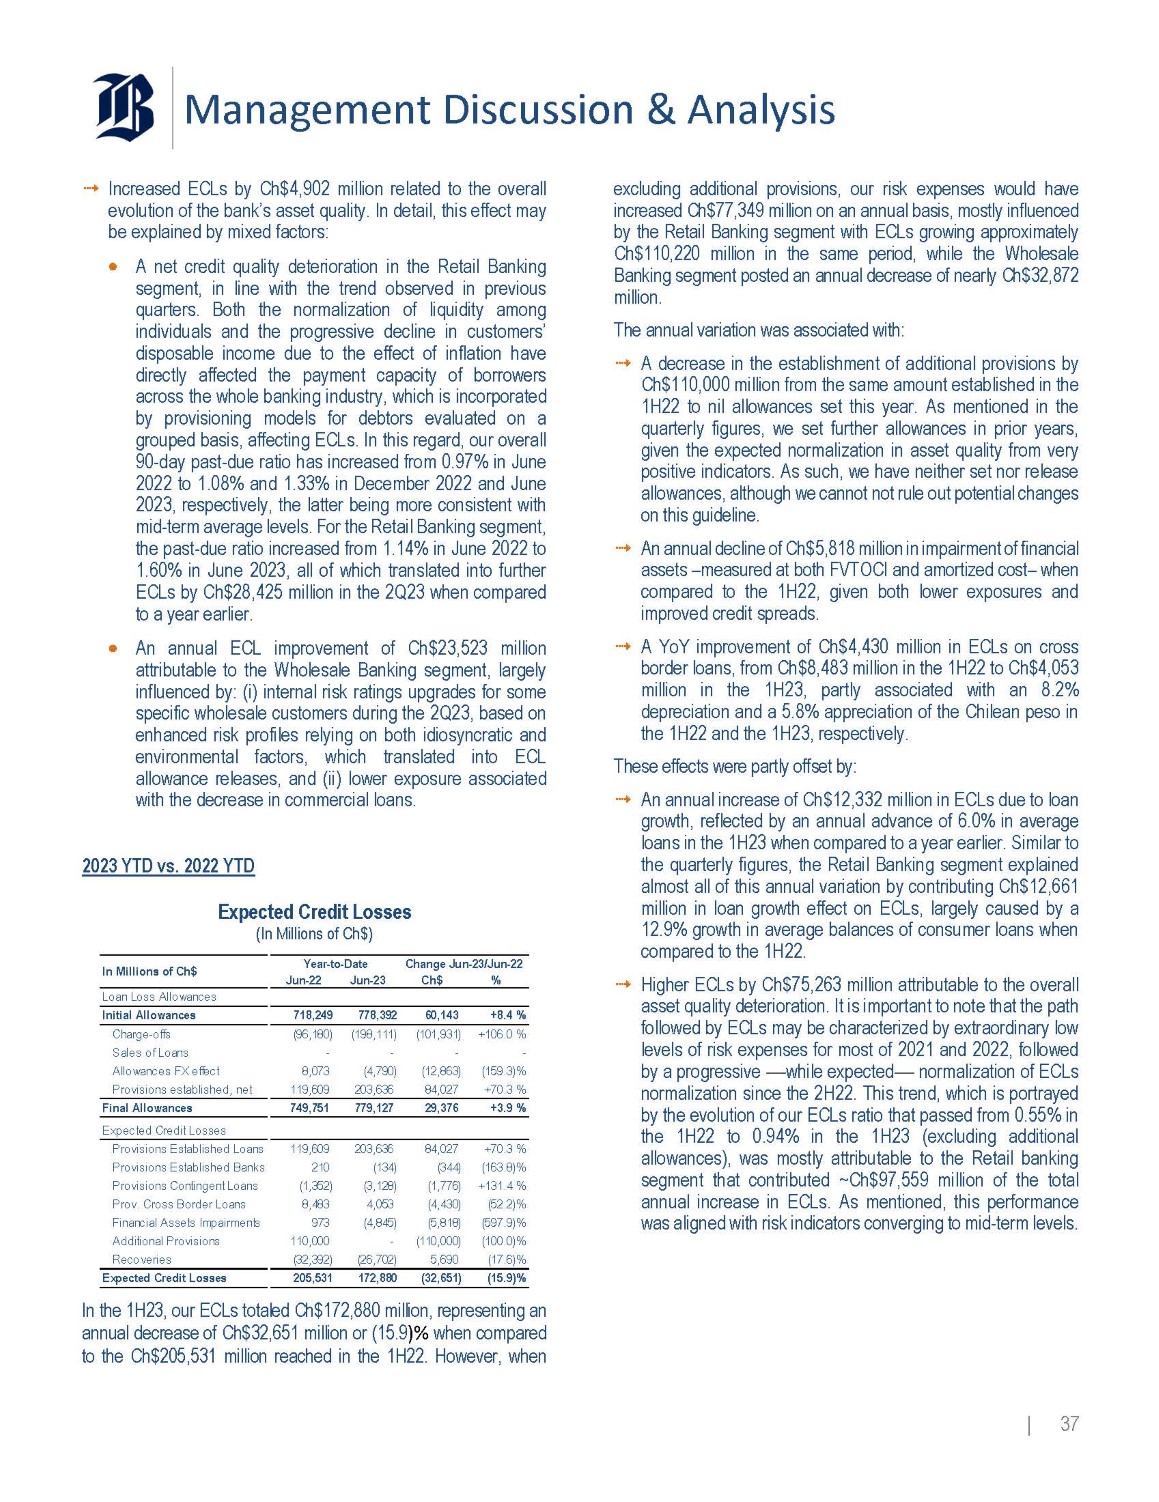
Management Discussion & Analysis Increased ECLs by Ch $ 4 , 902 million related to the overall evolution of the bank’s asset quality . In detail, this effect may be explained by mixed factors : A net credit quality deterioration in the Retail Banking segment, in line with the trend observed in previous quarters . Both the normalization of liquidity among individuals and the progressive decline in customers’ disposable income due to the effect of inflation have directly affected the payment capacity of borrowers across the whole banking industry, which is incorporated by provisioning models for debtors evaluated on a grouped basis, affecting ECLs . In this regard, our overall 90 - day past - due ratio has increased from 0 . 97 % in June 2022 to 1 . 08 % and 1 . 33 % in December 2022 and June 2023 , respectively, the latter being more consistent with mid - term average levels . For the Retail Banking segment, the past - due ratio increased from 1 . 14 % in June 2022 to 1 . 60 % in June 2023 , all of which translated into further ECLs by Ch $ 28 , 425 million in the 2 Q 23 when compared to a year earlier . An annual ECL improvement of Ch $ 23 , 523 million attributable to the Wholesale Banking segment, largely influenced by : (i) internal risk ratings upgrades for some specific wholesale customers during the 2 Q 23 , based on enhanced risk profiles relying on both idiosyncratic and environmental factors, which translated into ECL allowance releases, and (ii) lower exposure associated with the decrease in commercial loans . 2023 YTD vs. 2022 YTD Expected Credit Losses (In Millions of Ch$) Loan Loss Allowances Initial Allowances Charge - offs Sales of Loans (159.3)% (12,863) (4,790) 8,073 Allowances FX effect +70.3 % 84,027 203,636 119,609 Provisions established, net +3.9 % 29,376 779,127 749,751 Final Allowances Expected Credit Losses +70.3 % 84,027 203,636 119,609 Provisions Established Loans (163.8)% (344) (134) 210 Provisions Established Banks +131.4 % (1,776) (3,128) (1,352) Provisions Contingent Loans (52.2)% (4,430) 4,053 8,483 Prov. Cross Border Loans (597.9)% (5,818) (4,845) 973 Financial Assets Impairments (100.0)% (110,000) - 110,000 Additional Provisions (17.6)% 5,690 (26,702) (32,392) Recoveries (15.9)% (32,651) 172,880 205,531 Expected Credit Losses Year - to - Date Change Jun - 23/Jun - 22 Jun - 22 Jun - 23 Ch$ % 718,249 778,392 60,143 +8.4 % (96,180) (198,111) (101,931) +106.0 % - - - - In Millions of Ch$ In the 1 H 23 , our ECLs totaled Ch $ 172 , 880 million, representing an annual decrease of Ch $ 32 , 651 million or ( 15 . 9 ) % when compared to the Ch $ 205 , 531 million reached in the 1 H 22 . However, when | 37 excluding additional provisions, our risk expenses would have increased Ch $ 77 , 349 million on an annual basis, mostly influenced by the Retail Banking segment with ECLs growing approximately Ch $ 110 , 220 million in the same period, while the Wholesale Banking segment posted an annual decrease of nearly Ch $ 32 , 872 million . The annual variation was associated with : A decrease in the establishment of additional provisions by Ch $ 110 , 000 million from the same amount established in the 1 H 22 to nil allowances set this year . As mentioned in the quarterly figures, we set further allowances in prior years, given the expected normalization in asset quality from very positive indicators . As such, we have neither set nor release allowances, although we cannot not rule out potential changes on this guideline . An annual decline of Ch $ 5 , 818 million in impairment of financial assets – measured at both FVTOCI and amortized cost – when compared to the 1 H 22 , given both lower exposures and improved credit spreads . A YoY improvement of Ch $ 4 , 430 million in ECLs on cross border loans, from Ch $ 8 , 483 million in the 1 H 22 to Ch $ 4 , 053 million in the 1 H 23 , partly associated with an 8 . 2 % depreciation and a 5 . 8 % appreciation of the Chilean peso in the 1 H 22 and the 1 H 23 , respectively . These effects were partly offset by : An annual increase of Ch $ 12 , 332 million in ECLs due to loan growth, reflected by an annual advance of 6 . 0 % in average loans in the 1 H 23 when compared to a year earlier . Similar to the quarterly figures, the Retail Banking segment explained almost all of this annual variation by contributing Ch $ 12 , 661 million in loan growth effect on ECLs, largely caused by a 12 . 9 % growth in average balances of consumer loans when compared to the 1 H 22 . Higher ECLs by Ch $ 75 , 263 million attributable to the overall asset quality deterioration . It is important to note that the path followed by ECLs may be characterized by extraordinary low levels of risk expenses for most of 2021 and 2022 , followed by a progressive — while expected — normalization of ECLs normalization since the 2 H 22 . This trend, which is portrayed by the evolution of our ECLs ratio that passed from 0 . 55 % in the 1 H 22 to 0 . 94 % in the 1 H 23 (excluding additional allowances), was mostly attributable to the Retail banking segment that contributed ~Ch $ 97 , 559 million of the total annual increase in ECLs . As mentioned, this performance was aligned with risk indicators converging to mid - term levels .
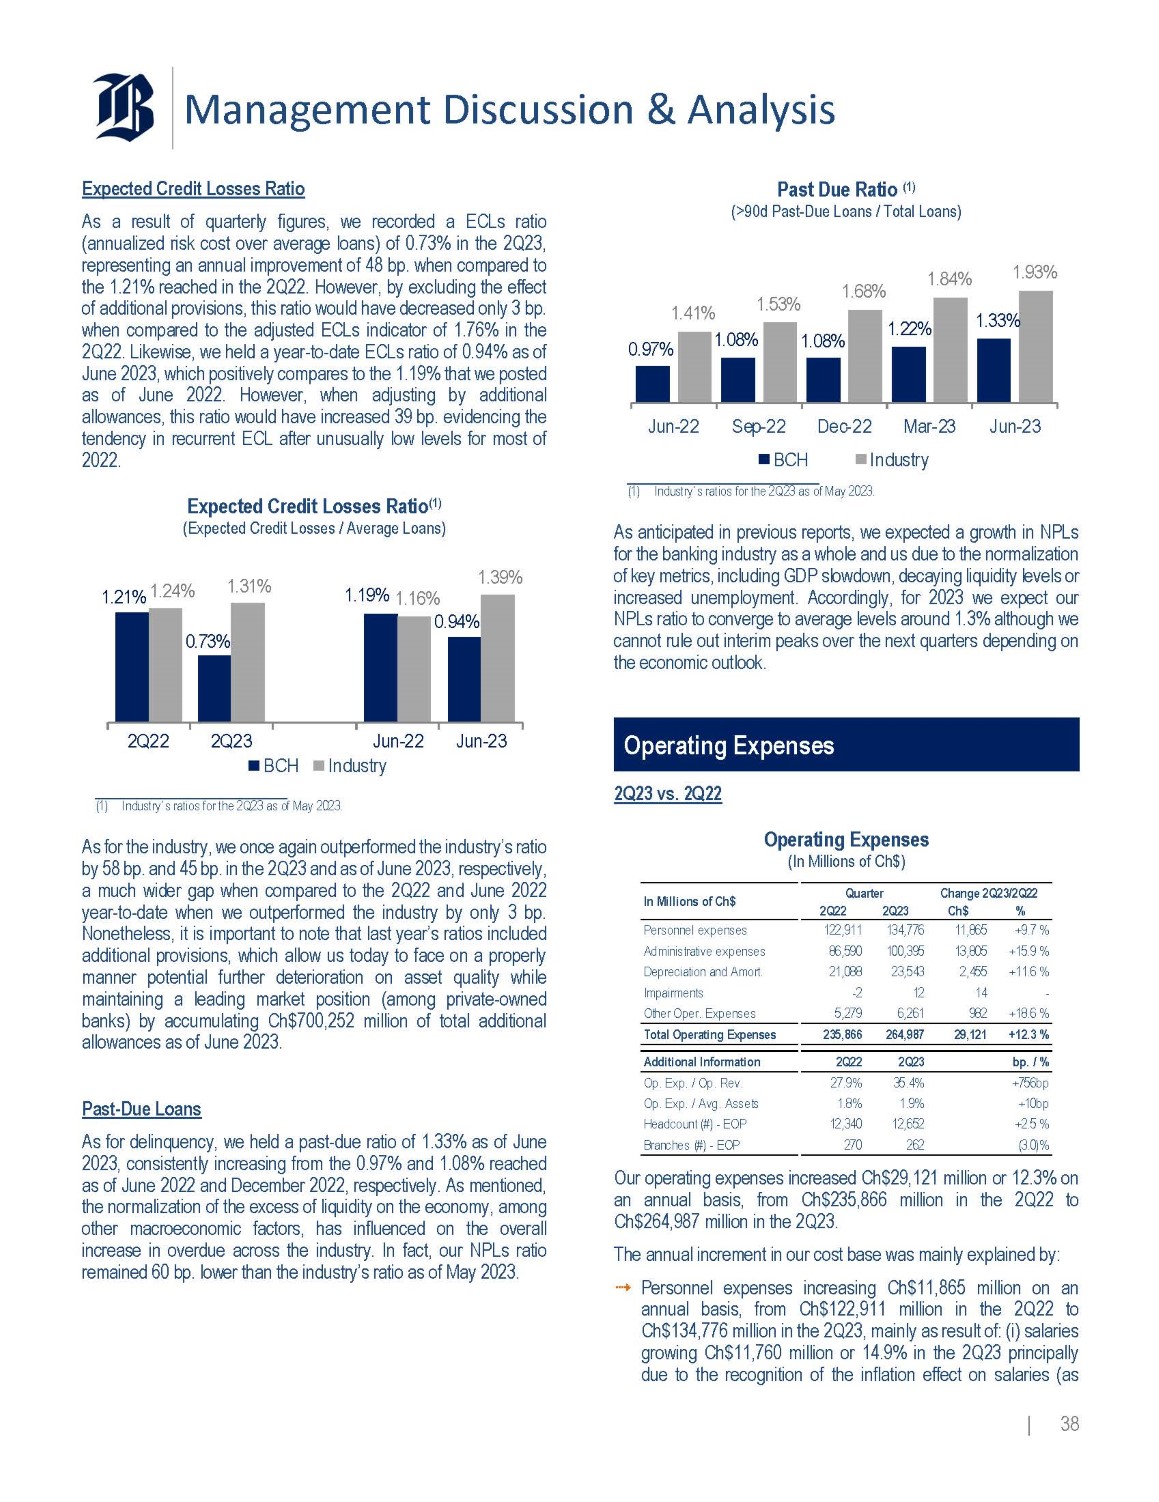
Management Discussion & Analysis Expected Credit Losses Ratio As a result of quarterly figures, we recorded a ECLs ratio (annualized risk cost over average loans) of 0 . 73 % in the 2 Q 23 , representing an annual improvement of 48 bp . when compared to the 1 . 21 % reached in the 2 Q 22 . However, by excluding the effect of additional provisions, this ratio would have decreased only 3 bp . when compared to the adjusted ECLs indicator of 1 . 76 % in the 2 Q 22 . Likewise, we held a year - to - date ECLs ratio of 0 . 94 % as of June 2023 , which positively compares to the 1 . 19 % that we posted as of June 2022 . However, when adjusting by additional allowances, this ratio would have increased 39 bp . evidencing the tendency in recurrent ECL after unusually low levels for most of 2022 . Expected Credit Losses Ratio (1) (Expected Credit Losses / Average Loans) 0.73% 1.19% 0.94% 1.21% 1.24% 1.31% 1.16% 1.39% 2Q22 2Q23 Jun - 22 Jun - 23 BCH Industry (1) Industry s ratios for the 2Q23 as of May 2023. As for the industry, we once again outperformed the industry’s ratio by 58 bp . and 45 bp . in the 2 Q 23 and as of June 2023 , respectively, a much wider gap when compared to the 2 Q 22 and June 2022 year - to - date when we outperformed the industry by only 3 bp . Nonetheless, it is important to note that last year’s ratios included additional provisions, which allow us today to face on a properly manner potential further deterioration on asset quality while maintaining a leading market position (among private - owned banks) by accumulating Ch $ 700 , 252 million of total additional allowances as of June 2023 . Past - Due Loans As for delinquency, we held a past - due ratio of 1 . 33 % as of June 2023 , consistently increasing from the 0 . 97 % and 1 . 08 % reached as of June 2022 and December 2022 , respectively . As mentioned, the normalization of the excess of liquidity on the economy, among other macroeconomic factors, has influenced on the overall increase in overdue across the industry . In fact, our NPLs ratio remained 60 bp . lower than the industry’s ratio as of May 2023 . Past Due Ratio (1) (>90d Past - Due Loans / Total Loans) 0.97% 1.08% 1.08% 1.22% 1.33% 1.41% 1.53% 1.68% 1.84% 1.93% Jun - 22 Dec - 22 Mar - 23 Jun - 23 Sep - 22 BCH Industry (1) Industry s ratios for the 2Q23 as of May 2023. As anticipated in previous reports, we expected a growth in NPLs for the banking industry as a whole and us due to the normalization of key metrics, including GDP slowdown, decaying liquidity levels or increased unemployment . Accordingly, for 2023 we expect our NPLs ratio to converge to average levels around 1 . 3 % although we cannot rule out interim peaks over the next quarters depending on the economic outlook . Operating Expenses 2Q23 vs. 2Q22 Operating Expenses (In Millions of Ch$) 2Q22 2Q23 +9.7 % 11,865 134,776 122,911 Personnel expenses +15.9 % 13,805 100,395 86,590 Administrative expenses +11.6 % 2,455 23,543 21,088 Depreciation and Amort. - 14 12 - 2 Impairments +18.6 % 982 6,261 5,279 Other Oper. Expenses +12.3 % 29,121 264,987 235,866 Total Operating Expenses bp. / % 2Q23 2Q22 Additional Information +756bp 35.4% 27.9% Op. Exp. / Op. Rev. +10bp 1.9% 1.8% Op. Exp. / Avg. Assets +2.5 % 12,652 12,340 Headcount (#) - EOP (3.0)% 262 270 Branches (#) - EOP In Millions of Ch$ Quarter Change 2Q23/2Q22 Ch$ % Our operating expenses increased Ch $ 29 , 121 million or 12 . 3 % on an annual basis, from Ch $ 235 , 866 million in the 2 Q 22 to Ch $ 264 , 987 million in the 2 Q 23 . The annual increment in our cost base was mainly explained by : Personnel expenses increasing Ch $ 11 , 865 million on an annual basis, from Ch $ 122 , 911 million in the 2 Q 22 to Ch $ 134 , 776 million in the 2 Q 23 , mainly as result of : (i) salaries growing Ch $ 11 , 760 million or 14 . 9 % in the 2 Q 23 principally due to the recognition of the inflation effect on salaries (as | 38
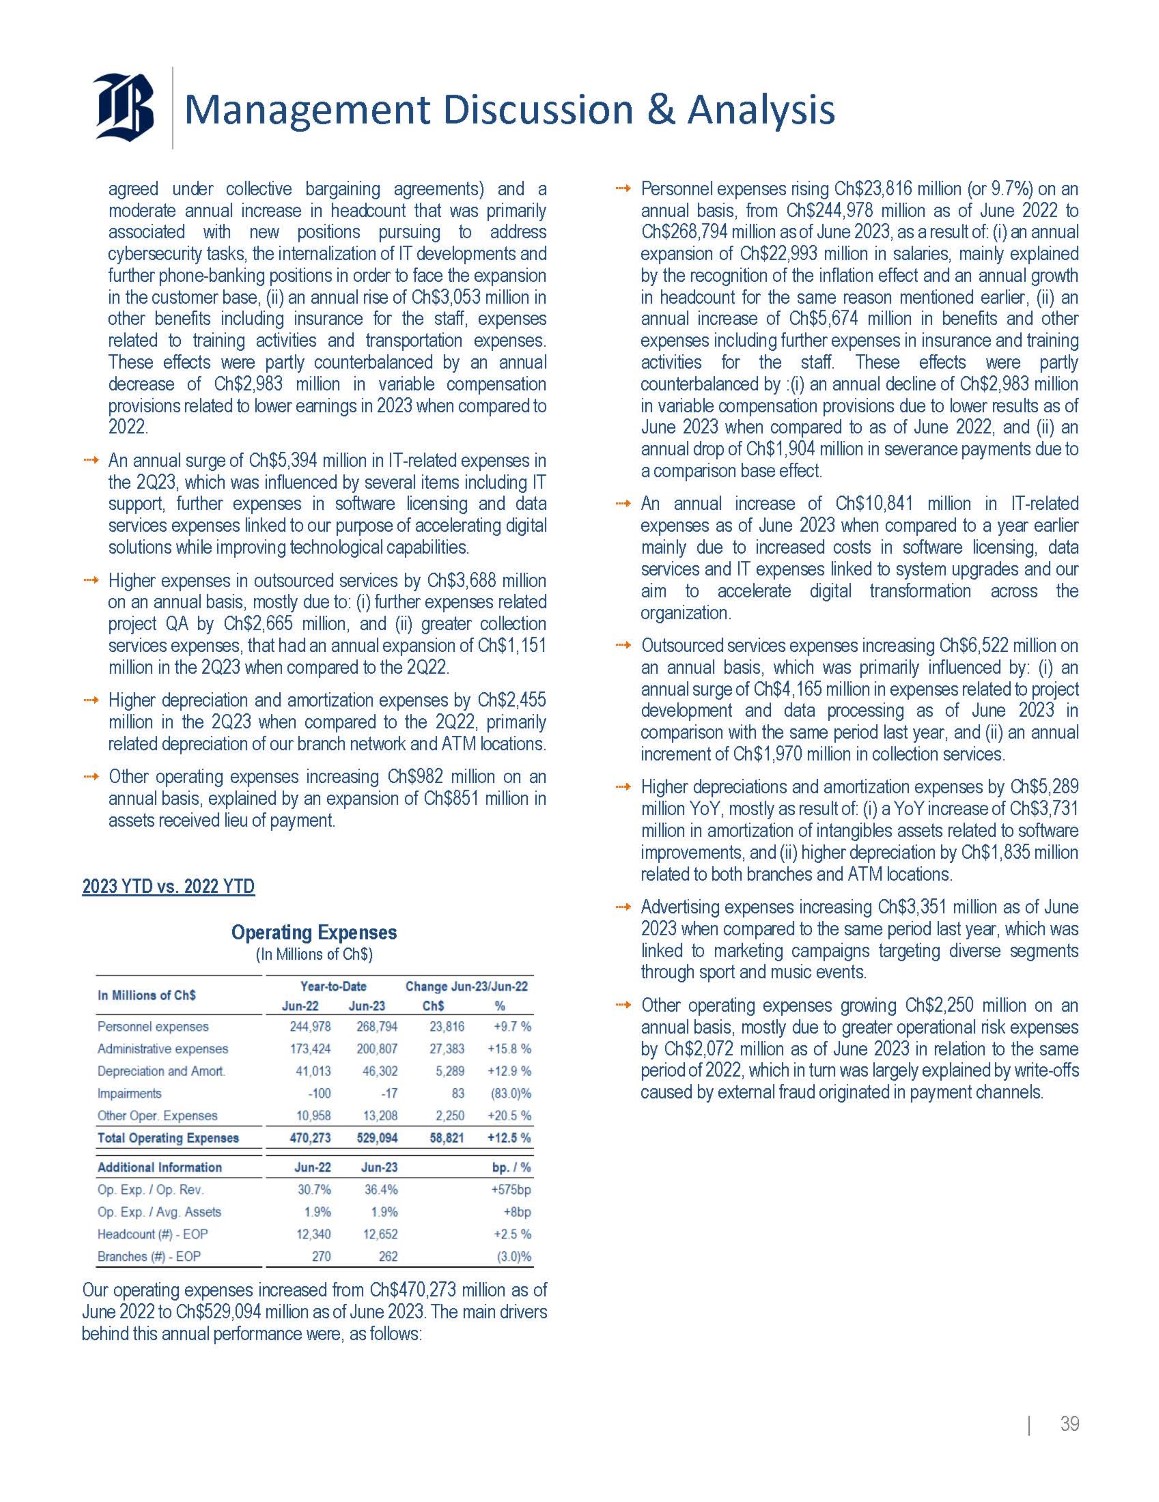
Management Discussion & Analysis agreed under collective bargaining agreements) and a moderate annual increase in headcount that was primarily associated with new positions pursuing to address cybersecurity tasks, the internalization of IT developments and further phone - banking positions in order to face the expansion in the customer base, (ii) an annual rise of Ch $ 3 , 053 million in other benefits including insurance for the staff, expenses related to training activities and transportation expenses . These effects were partly counterbalanced by an annual decrease of Ch $ 2 , 983 million in variable compensation provisions related to lower earnings in 2023 when compared to 2022 . An annual surge of Ch $ 5 , 394 million in IT - related expenses in the 2 Q 23 , which was influenced by several items including IT support, further expenses in software licensing and data services expenses linked to our purpose of accelerating digital solutions while improving technological capabilities . Higher expenses in outsourced services by Ch $ 3 , 688 million on an annual basis, mostly due to : (i) further expenses related project QA by Ch $ 2 , 665 million, and (ii) greater collection services expenses, that had an annual expansion of Ch $ 1 , 151 million in the 2 Q 23 when compared to the 2 Q 22 . Higher depreciation and amortization expenses by Ch $ 2 , 455 million in the 2 Q 23 when compared to the 2 Q 22 , primarily related depreciation of our branch network and ATM locations . Other operating expenses increasing Ch $ 982 million on an annual basis, explained by an expansion of Ch $ 851 million in assets received lieu of payment . 2023 YTD vs. 2022 YTD Operating Expenses (In Millions of Ch$) Our operating expenses increased from Ch $ 470 , 273 million as of June 2022 to Ch $ 529 , 094 million as of June 2023 . The main drivers behind this annual performance were, as follows : | 39 Personnel expenses rising Ch $ 23 , 816 million (or 9 . 7 % ) on an annual basis, from Ch $ 244 , 978 million as of June 2022 to Ch $ 268 , 794 million as of June 2023 , as a result of : (i) an annual expansion of Ch $ 22 , 993 million in salaries, mainly explained by the recognition of the inflation effect and an annual growth in headcount for the same reason mentioned earlier, (ii) an annual increase of Ch $ 5 , 674 million in benefits and other expenses including further expenses in insurance and training activities for the staff . These effects were partly counterbalanced by : (i) an annual decline of Ch $ 2 , 983 million in variable compensation provisions due to lower results as of June 2023 when compared to as of June 2022 , and (ii) an annual drop of Ch $ 1 , 904 million in severance payments due to a comparison base effect . An annual increase of Ch $ 10 , 841 million in IT - related expenses as of June 2023 when compared to a year earlier mainly due to increased costs in software licensing, data services and IT expenses linked to system upgrades and our aim to accelerate digital transformation across the organization . Outsourced services expenses increasing Ch $ 6 , 522 million on an annual basis, which was primarily influenced by : (i) an annual surge of Ch $ 4 , 165 million in expenses related to project development and data processing as of June 2023 in comparison with the same period last year, and (ii) an annual increment of Ch $ 1 , 970 million in collection services . Higher depreciations and amortization expenses by Ch $ 5 , 289 million YoY, mostly as result of : (i) a YoY increase of Ch $ 3 , 731 million in amortization of intangibles assets related to software improvements, and (ii) higher depreciation by Ch $ 1 , 835 million related to both branches and ATM locations . Advertising expenses increasing Ch $ 3 , 351 million as of June 2023 when compared to the same period last year, which was linked to marketing campaigns targeting diverse segments through sport and music events . Other operating expenses growing Ch $ 2 , 250 million on an annual basis, mostly due to greater operational risk expenses by Ch $ 2 , 072 million as of June 2023 in relation to the same period of 2022 , which in turn was largely explained by write - offs caused by external fraud originated in payment channels .
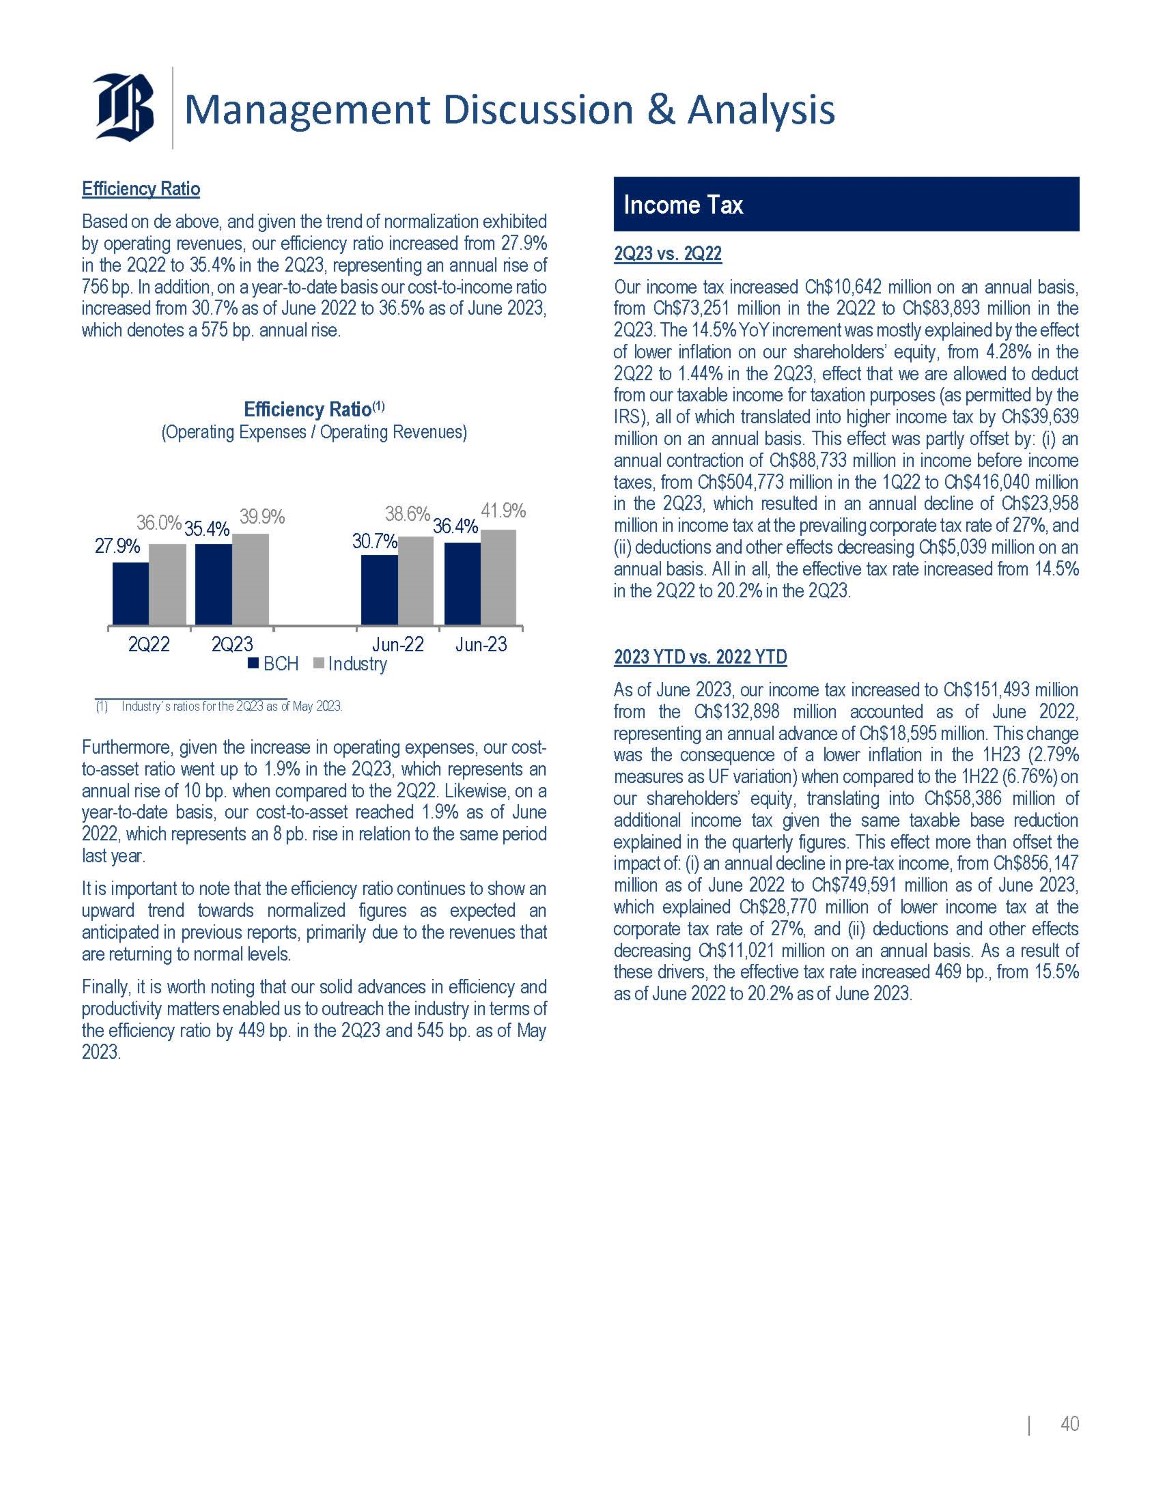
Management Discussion & Analysis Efficiency Ratio Based on de above, and given the trend of normalization exhibited by operating revenues, our efficiency ratio increased from 27 . 9 % in the 2 Q 22 to 35 . 4 % in the 2 Q 23 , representing an annual rise of 756 bp . In addition, on a year - to - date basis our cost - to - income ratio increased from 30 . 7 % as of June 2022 to 36 . 5 % as of June 2023 , which denotes a 575 bp . annual rise . Efficiency Ratio (1) (Operating Expenses / Operating Revenues) 27.9% 35.4% 30.7% 36.4% 36.0% 39.9% 38.6% 41.9% 2Q22 Jun - 23 2Q23 Jun - 22 BCH Industry (1) Industry s ratios for the 2Q23 as of May 2023. Furthermore, given the increase in operating expenses, our cost - to - asset ratio went up to 1 . 9 % in the 2 Q 23 , which represents an annual rise of 10 bp . when compared to the 2 Q 22 . Likewise, on a year - to - date basis, our cost - to - asset reached 1 . 9 % as of June 2022 , which represents an 8 pb . rise in relation to the same period last year . It is important to note that the efficiency ratio continues to show an upward trend towards normalized figures as expected an anticipated in previous reports, primarily due to the revenues that are returning to normal levels . Finally, it is worth noting that our solid advances in efficiency and productivity matters enabled us to outreach the industry in terms of the efficiency ratio by 449 bp . in the 2 Q 23 and 545 bp . as of May 2023 . Income Tax 2 Q 23 vs . 2 Q 22 Our income tax increased Ch $ 10 , 642 million on an annual basis, from Ch $ 73 , 251 million in the 2 Q 22 to Ch $ 83 , 893 million in the 2 Q 23 . The 14 . 5 % YoY increment was mostly explained by the effect of lower inflation on our shareholders’ equity, from 4 . 28 % in the 2 Q 22 to 1 . 44 % in the 2 Q 23 , effect that we are allowed to deduct from our taxable income for taxation purposes (as permitted by the IRS), all of which translated into higher income tax by Ch $ 39 , 639 million on an annual basis . This effect was partly offset by : (i) an annual contraction of Ch $ 88 , 733 million in income before income taxes, from Ch $ 504 , 773 million in the 1 Q 22 to Ch $ 416 , 040 million in the 2 Q 23 , which resulted in an annual decline of Ch $ 23 , 958 million in income tax at the prevailing corporate tax rate of 27 % , and (ii) deductions and other effects decreasing Ch $ 5 , 039 million on an annual basis . All in all, the effective tax rate increased from 14 . 5 % in the 2 Q 22 to 20 . 2 % in the 2 Q 23 . 2023 YTD vs . 2022 YTD As of June 2023 , our income tax increased to Ch $ 151 , 493 million from the Ch $ 132 , 898 million accounted as of June 2022 , representing an annual advance of Ch $ 18 , 595 million . This change was the consequence of a lower inflation in the 1 H 23 ( 2 . 79 % measures as UF variation) when compared to the 1 H 22 ( 6 . 76 % ) on our shareholders’ equity, translating into Ch $ 58 , 386 million of additional income tax given the same taxable base reduction explained in the quarterly figures . This effect more than offset the impact of : (i) an annual decline in pre - tax income, from Ch $ 856 , 147 million as of June 2022 to Ch $ 749 , 591 million as of June 2023 , which explained Ch $ 28 , 770 million of lower income tax at the corporate tax rate of 27 % , and (ii) deductions and other effects decreasing Ch $ 11 , 021 million on an annual basis . As a result of these drivers, the effective tax rate increased 469 bp . , from 15 . 5 % as of June 2022 to 20 . 2 % as of June 2023 . | 40
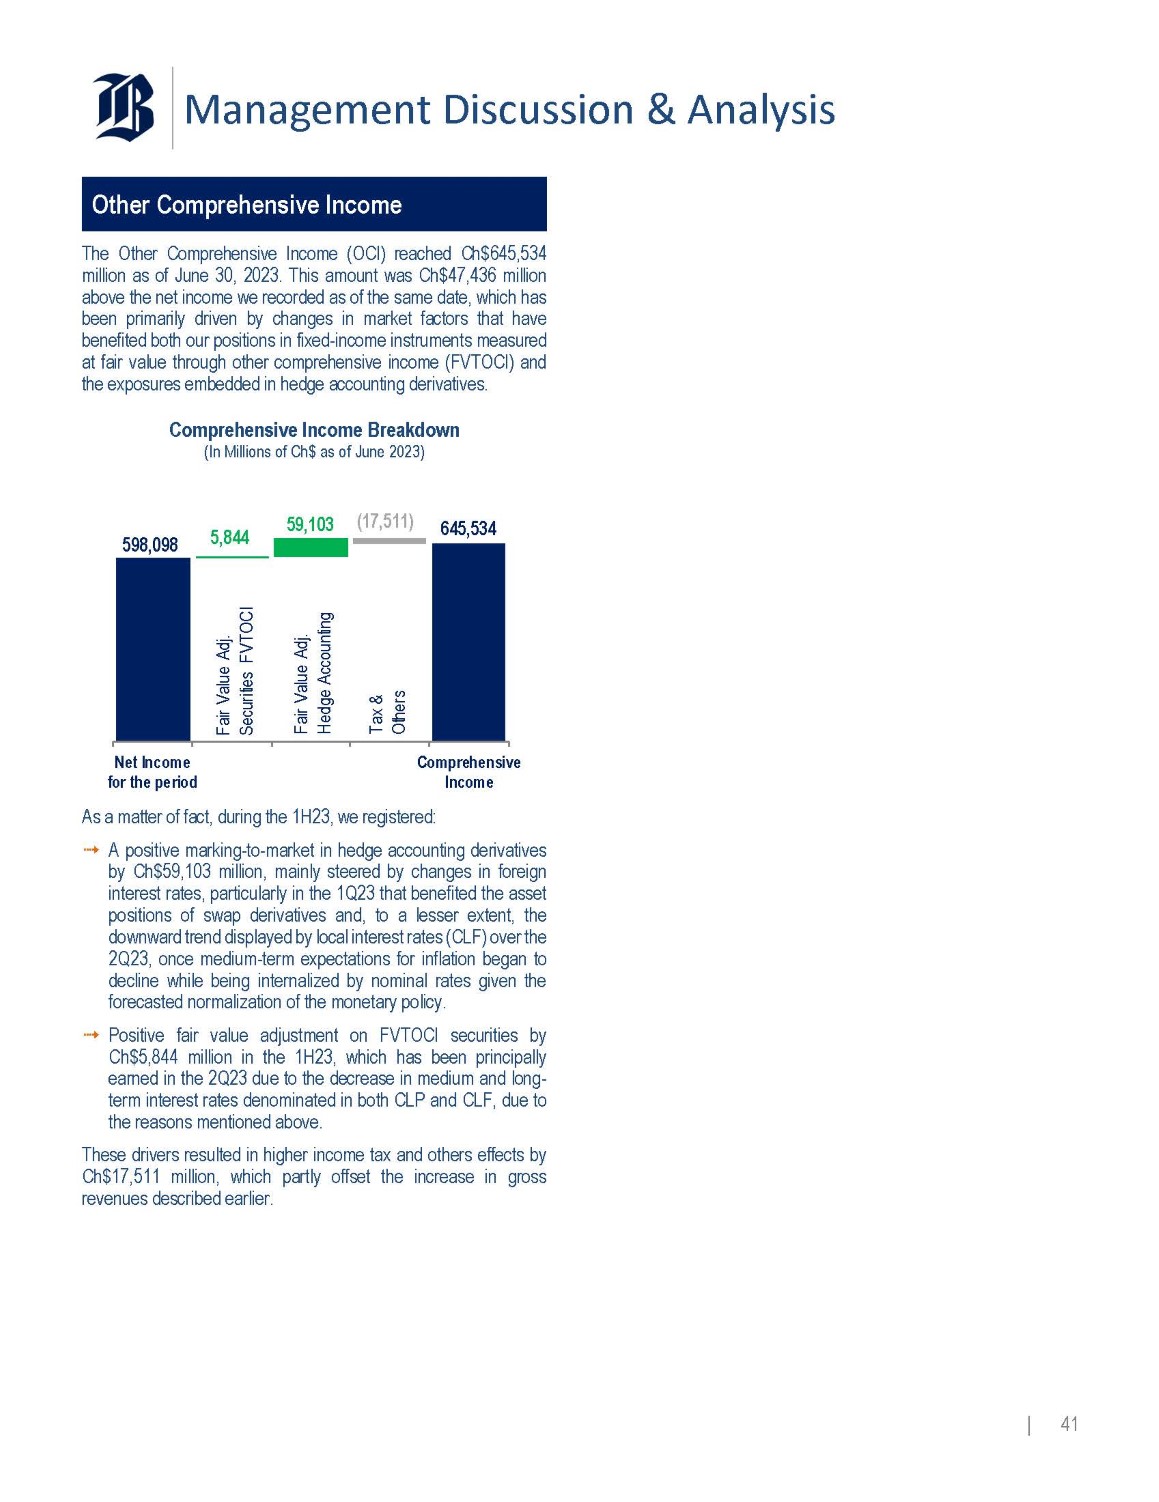
Management Discussion & Analysis Other Comprehensive Income The Other Comprehensive Income (OCI) reached Ch $ 645 , 534 million as of June 30 , 2023 . This amount was Ch $ 47 , 436 million above the net income we recorded as of the same date, which has been primarily driven by changes in market factors that have benefited both our positions in fixed - income instruments measured at fair value through other comprehensive income (FVTOCI) and the exposures embedded in hedge accounting derivatives . Comprehensive Income Breakdown (In Millions of Ch$ as of June 2023) 598,098 | 41 645,534 5,844 59,103 (17,511) Net Income for the period Comprehensive Income Fair Value Adj. Securities FVTOCI Fair Value Adj. Hedge Accounting Tax & Others As a matter of fact, during the 1 H 23 , we registered : A positive marking - to - market in hedge accounting derivatives by Ch $ 59 , 103 million, mainly steered by changes in foreign interest rates, particularly in the 1 Q 23 that benefited the asset positions of swap derivatives and, to a lesser extent, the downward trend displayed by local interest rates (CLF) over the 2 Q 23 , once medium - term expectations for inflation began to decline while being internalized by nominal rates given the forecasted normalization of the monetary policy . Positive fair value adjustment on FVTOCI securities by Ch $ 5 , 844 million in the 1 H 23 , which has been principally earned in the 2 Q 23 due to the decrease in medium and long - term interest rates denominated in both CLP and CLF, due to the reasons mentioned above . These drivers resulted in higher income tax and others effects by Ch $ 17 , 511 million, which partly offset the increase in gross revenues described earlier .
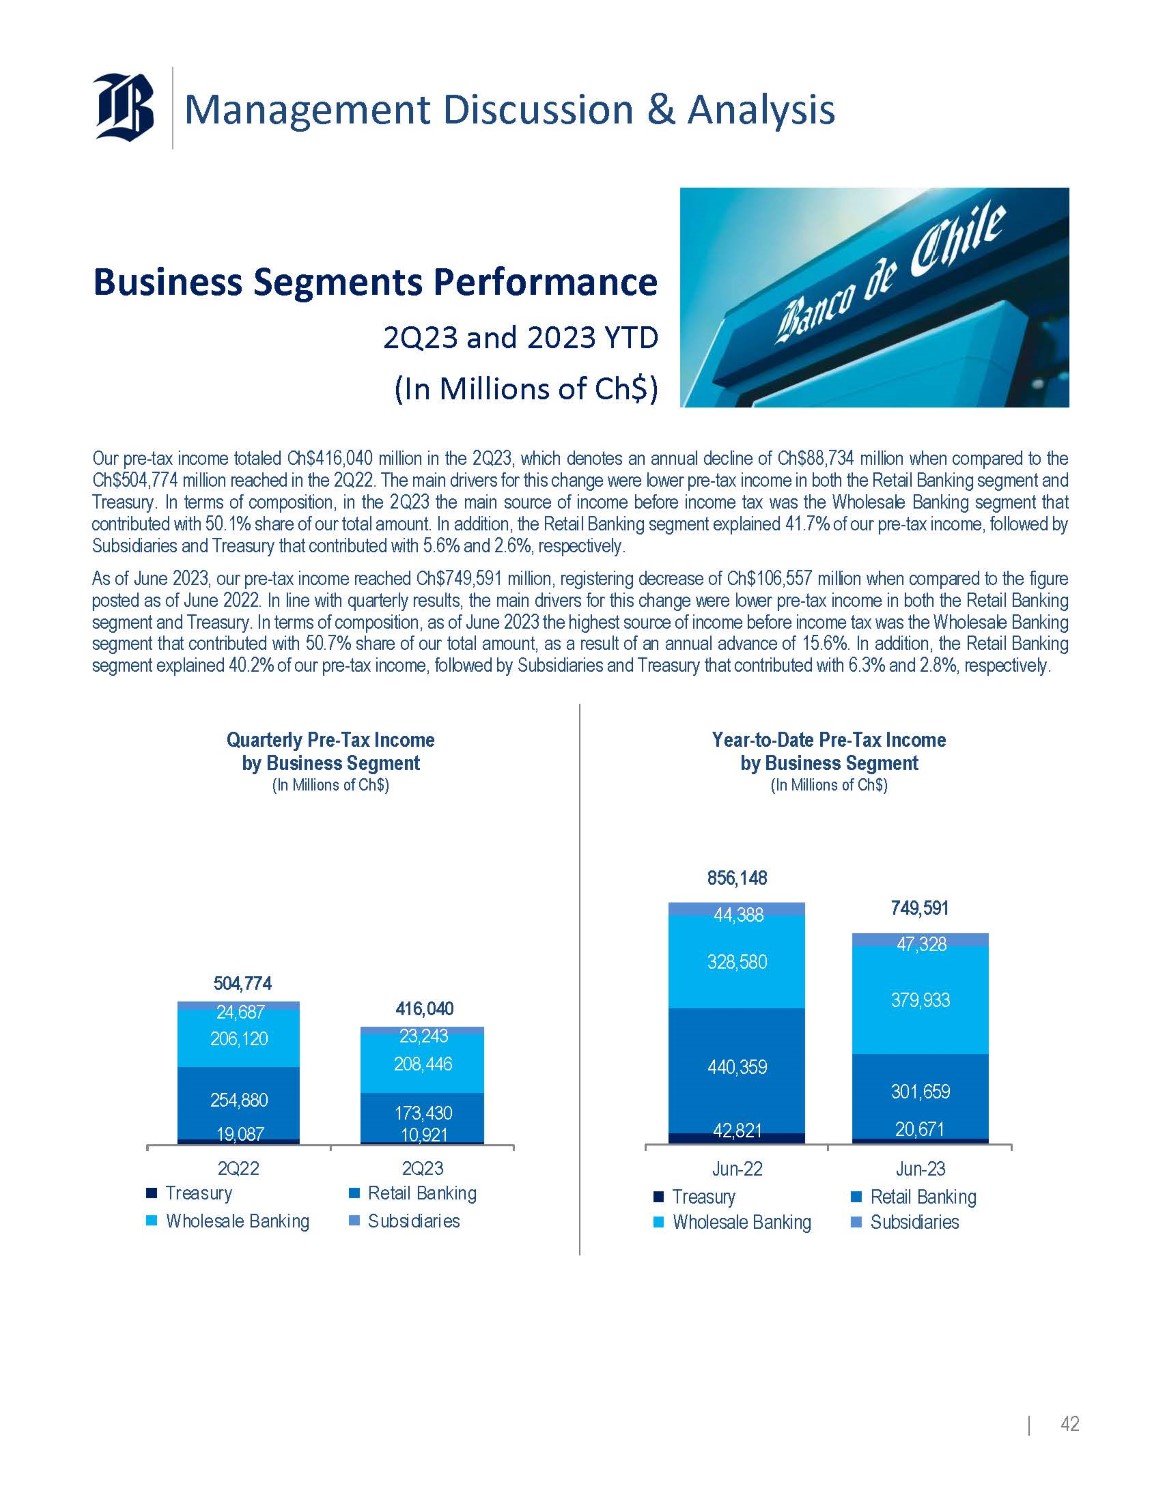
Management Discussion & Analysis Business Segments Performance 2Q23 and 2023 YTD (In Millions of Ch$) Our pre - tax income totaled Ch $ 416 , 040 million in the 2 Q 23 , which denotes an annual decline of Ch $ 88 , 734 million when compared to the Ch $ 504 , 774 million reached in the 2 Q 22 . The main drivers for this change were lower pre - tax income in both the Retail Banking segment and Treasury . In terms of composition, in the 2 Q 23 the main source of income before income tax was the Wholesale Banking segment that contributed with 50 . 1 % share of our total amount . In addition, the Retail Banking segment explained 41 . 7 % of our pre - tax income, followed by Subsidiaries and Treasury that contributed with 5 . 6 % and 2 . 6 % , respectively . As of June 2023 , our pre - tax income reached Ch $ 749 , 591 million, registering decrease of Ch $ 106 , 557 million when compared to the figure posted as of June 2022 . In line with quarterly results, the main drivers for this change were lower pre - tax income in both the Retail Banking segment and Treasury . In terms of composition, as of June 2023 the highest source of income before income tax was the Wholesale Banking segment that contributed with 50 . 7 % share of our total amount, as a result of an annual advance of 15 . 6 % . In addition, the Retail Banking segment explained 40 . 2 % of our pre - tax income, followed by Subsidiaries and Treasury that contributed with 6 . 3 % and 2 . 8 % , respectively . Year - to - Date Pre - Tax Income by Business Segment (In Millions of Ch$) 856,148 44,388 749,591 47,328 328,580 379,933 440,359 301,659 42,821 20,671 Jun - 22 Jun - 23 Treasury Retail Banking Wholesale Banking Subsidiaries Quarterly Pre - Tax Income by Business Segment (In Millions of Ch$) 504,774 24,687 416,040 206,120 23,243 208,446 254,880 173,430 19,087 10,921 2Q22 2Q23 Treasury Retail Banking Wholesale Banking Subsidiaries | 42
Management Discussion & Analysis Retail Banking Segment In the 2 Q 23 , the Retail Banking segment posted a pre - tax income of Ch $ 173 , 430 million, representing an annual decline of Ch $ 81 , 450 million when compared the Ch $ 254 , 880 million earned in the 2 Q 22 . This behavior was mostly attributable to : (i) an annual decline of Ch $ 42 , 834 million in operating revenues, from Ch $ 492 , 771 million in the 2 Q 22 to Ch $ 449 , 937 million in the 2 Q 23 , mainly due to the negative effect of lower inflation in the 2 Q 23 (+ 1 . 44 % , measured as UF variation) when compared to the 2 Q 22 (+ 4 . 28 % ) on the UF net asset exposure partly allocated to this segment . This effect was partly offset by an annual increment of Ch $ 13 , 702 million or 19 . 6 % in fee income, mostly attributable to higher transactionality and the reactivation of our consumer lending that increased fee income generation from the insurance brokerage business on an annual basis, (ii) operating expenses increasing Ch $ 24 , 949 million on an annual basis, from Ch $ 165 , 522 million in the 2 Q 22 to Ch $ 190 , 471 million in the 2 Q 23 , highly influenced by an annual increase in IT expenses, the recognition of cumulative inflation on salaries and the effect of changes in the accounting treatment of revenues and expenses generated by one of our subsidiaries Socofin S . A . , and (iii) an annual increase of Ch $ 13 , 667 million in ECLs, from Ch $ 72 , 369 million in the 2 Q 22 to Ch $ 86 , 036 million in the 2 Q 23 , resulting from the normalization of key asset quality indicators after benefiting from positive but transitory effects caused by an excess of liquidity in the economy for most of 2021 and 2022 . As of June 2023 , Retail Banking segment registered a decrease of 31 . 5 % , equivalent to Ch $ 138 , 700 million, from Ch $ 440 , 359 million as of June 2022 to Ch $ 301 , 659 at the end of the 1 H 23 . This change was mainly explained by the effect of lower inflation on both operating revenues and higher ECLs, in line with quarterly results . Likewise, the segment posted an annual increase in operating expenses, due to the cumulative effect of inflation in certain line items and the drivers described for the 2 Q 23 . Wholesale Banking Segment The Wholesale Banking segment reached an income before income tax of Ch $ 208 , 446 million in the 2 Q 23 , which was Ch $ 2 , 326 million above the figure posted in the 2 Q 22 . The 1 . 1 % annual rise was primarily associated with an annual decline of Ch $ 47 , 826 million or 145 . 0 % in ECLs given the joint effect of a significant improvement in the credit risk profile of certain customers that translated into allowance releases, lower loan balances and a nil establishment of additional provisions in the 2 Q 23 when compared to Ch $ 40 , 000 million in the 2 Q 22 , amounts that are partly allocated to this segment . This positive effect was counterbalanced by : (i) an annual decrease of Ch $ 39 , 806 million in operating revenues, primarily influenced by the trend followed by inflation and lowered lending activity that has resulted in a decrease in commercial loans, and (ii) an annual increment of Ch $ 5 , 694 million in operating expenses, which was mostly attributable to the recognition of cumulative inflation on salaries . As of June 2023 , this segment registered a pre - tax income of Ch $ 379 , 933 million, which positively compares to the Ch $ 328 , 580 million posted as of June 2022 . This change was largely explained by lower ECLs, in line with the drivers described for quarterly figures . | 43
Management Discussion & Analysis Treasury Segment Our Treasury posted an income before income tax of Ch $ 10 , 921 million in the 2 Q 23 , which denotes an annual decline of Ch $ 8 , 166 million when compared to the 2 Q 22 . This behavior had mainly to do with the change in market factors that negatively affected the segment’s revenue - generating capacity, which was mainly reflected by lower revenues from the management of our Investment portfolio by Ch $ 12 , 840 million on an annual basis, as a result of both a high comparison base in the 2 Q 22 when we benefited from the positive impact of high inflation on UF - denominated securities, which coupled with higher funding rates and negative movements in some tenors of the yield curve in the 2 Q 23 . This effect was to some degree counterbalanced by : (i) an annual improvement of Ch $ 4 , 597 million in the impairment of FVTOCI instruments, principally explained by lower credit spreads of our counterparties, and (ii) higher results from the management of our Trading portfolio, including derivates and fixed - income securities, by Ch $ 1 , 162 million on an annual basis primarily due to combined effect of an annual increase in revenues from derivatives (net of Counterparty Value Adjustment) by Ch $ 4 , 202 million on an annual basis and specific unfavorable interest rates movements on positions held in local fixed - income securities amounting to Ch $ 2 , 836 million . On a year - to - date basis, our Treasury recorded a pre - tax income of Ch $ 20 , 671 million as of June 2023 , which poses an annual decrease of Ch $ 22 , 150 million when compared to the Ch $ 42 , 821 million posted in the same period last year . This decline had to do mainly with : (i) a decrease of Ch $ 18 , 172 million in income from the management of our investment portfolio, for the same reasons explained for quarterly figures, and (ii) lower revenues from the management of the Trading portfolio by Ch $ 6 , 740 million when compared to the 1 H 22 , primarily as a consequence of an annual drop of Ch $ 4 , 588 million in revenues from derivatives (net of CVA) and an annual dwindle of Ch $ 3 , 341 million in income form fixed - income securities, in both cases primarily due to changes in interest rates . These drivers were also partly offset by a net annual improvement of Ch $ 5 , 818 million in FVTOCI impairment, given lower credit spreads of our counterparties . Subsidiaries On the whole, our Subsidiaries reported pre - tax income of Ch $ 23 , 243 million in the 2 Q 23 , amount that was Ch $ 1 , 444 million below the level posted in the 2 Q 22 . This tempered decrease was attributable to mixed results from our diverse subsidiaries, including : (i) an annual drop in pre - tax income from our Mutual Funds subsidiary by Ch $ 1 , 455 million in the same period, mainly as a result of changes in the portfolio mix towards fixed - income funds, which bear lower margins, based on the investors’ expectations on lower interest rates in the short - term, and (ii) an annual decline of Ch $ 1 , 258 million in income before income tax from our Investment Banking subsidiary, given subdued economic activity that has negatively affected the business when compared to the 2 Q 22 . These factors were partly offset by an annual increase of Ch $ 1 , 700 million in pre - tax income earned by our Insurance Brokerage subsidiary, mainly due to the upsurge in consumer lending, which has resulted in an annual increase in written premiums . As of June 2023 , our Subsidiaries posted an income before income tax of Ch $ 47 , 328 million, which represented an annual increment of Ch $ 2 , 940 million when compared to the same period last year . This behavior was mainly supported by : (i) an annual increment of Ch $ 2 , 759 million in pre - tax earned by our Insurance Brokerage subsidiary, which was primarily produced by higher fee - income associated with increased written premiums caused by the recovery evidenced in consumer loan origination once the excess of liquidity began to vanish, and (ii) pre - tax income of our Collection Services subsidiary that went up by Ch $ 1 , 007 million, which is in line with asset quality deterioration and the increase in past - due loans, leading to higher fee - income on an annual basis . These drivers were to some degree counterbalanced by lower income before income tax of our Mutual Funds subsidiary by Ch $ 1 , 225 million, for the same reasons mentioned for quarterly figures . | 44
Management Discussion & Analysis Balance Sheet Analysis As of December 2022 and June 2023 (In Millions of Ch$) Loan Portfolio Our Loan Portfolio accounted for Ch $ 36 , 441 , 255 million as of June 30 , 2023 . The slowdown evidenced by our loan portfolio has been the consequence of diverse and mixed drivers, including the dynamics experienced by the whole industry and our own decisions that pursued to optimize the risk - return relationship across all business segments given the current economic landscape and perspectives . First of all, the whole industry is witnessing the effects of the economic downturn and the decline in aggregate demand produced by the tightening monetary policy deployed by the Central Bank, which has led short - term interest rates to the highest level in 25 years, increasing the cost of credit . This factor, in combination with other business drivers, including both the uncertainty surrounding definitive outcome of economic reforms the government is attempting to deploy and second round effects of the economic plunge in key macroeconomic variables like unemployment have drawn a challenging scenario for banking in the short - term . These factors resulted in the dynamics revealed by 2 Q 23 Credit Survey conducted by the Central Bank . In fact, the poll unveiled : (i) weakened demand for loans from all segments when compared to the 1 Q 23 while highlighting a more marked trend for large companies and corporations, which is aligned with a business sentiment that remained in negative territory while deteriorating in the margin in relation to the 1 Q 23 , (ii) restricted offer conditions for individuals and SMEs, which should be the consequence of the expected negative impact on unemployment and customers’ payment capacity, and (iii) a constrained credit offer for the real estate and construction sector in light of the significant slowdown in sales experienced by this industry, as evidenced by activity indices that declined to the lowest level since 2011 . In addition, we have devoted efforts to preserve the risk - return equation of our loan portfolio within the current economic backdrop, which has led us to set stricter credit - granting requirements, particularly for some segments of the individually evaluated portfolio, including the real estate and construction sector, among other sectors . At the same time, we have revised credit offerings and requisites for the diverse retail banking sub - segments in order to ensure profitable growth in products targeting these customers . Loan Portfolio Evolution (In Millions of Ch$ and %) 20,297,311 20,285,710 19,441,148 10,834,312 11,416,154 11,843,185 4,592,466 4,992,940 5,156,922 35,724,089 36,694,804 36,441,255 Jun - 22 Dec - 22 Jun - 23 Commercial Loans Residential Mortgage Loans Consumer Loans - 4.2% +3.7% - 0.7% 53% 32% +2.0% 14% +3.3% On an annual basis, our Total Loans recorded an expansion of 2 . 0 % equivalent to Ch $ 717 , 166 million . On a year - to - date basis, instead, our loan book contracted 0 . 7 % or Ch $ 253 , 549 million in comparison with March 2023 . The tempered growth was explained by mixed behaviors across the main lending products, as explained below : Residential mortgage loans amounted to Ch $ 11 , 843 , 185 million in June 2023 , which indicates an annual increase of Ch $ 1 , 008 , 873 million or 9 . 3 % when compared to June 2022 and year - to - date expansion of Ch $ 427 , 031 million or 3 . 7 % . These increments are largely attributable to the effect of 12 - month and year - to - date inflation – measured as UF variation – of 9 . 1 % and 2 . 8 % , respectively, on the balances of residential | 45
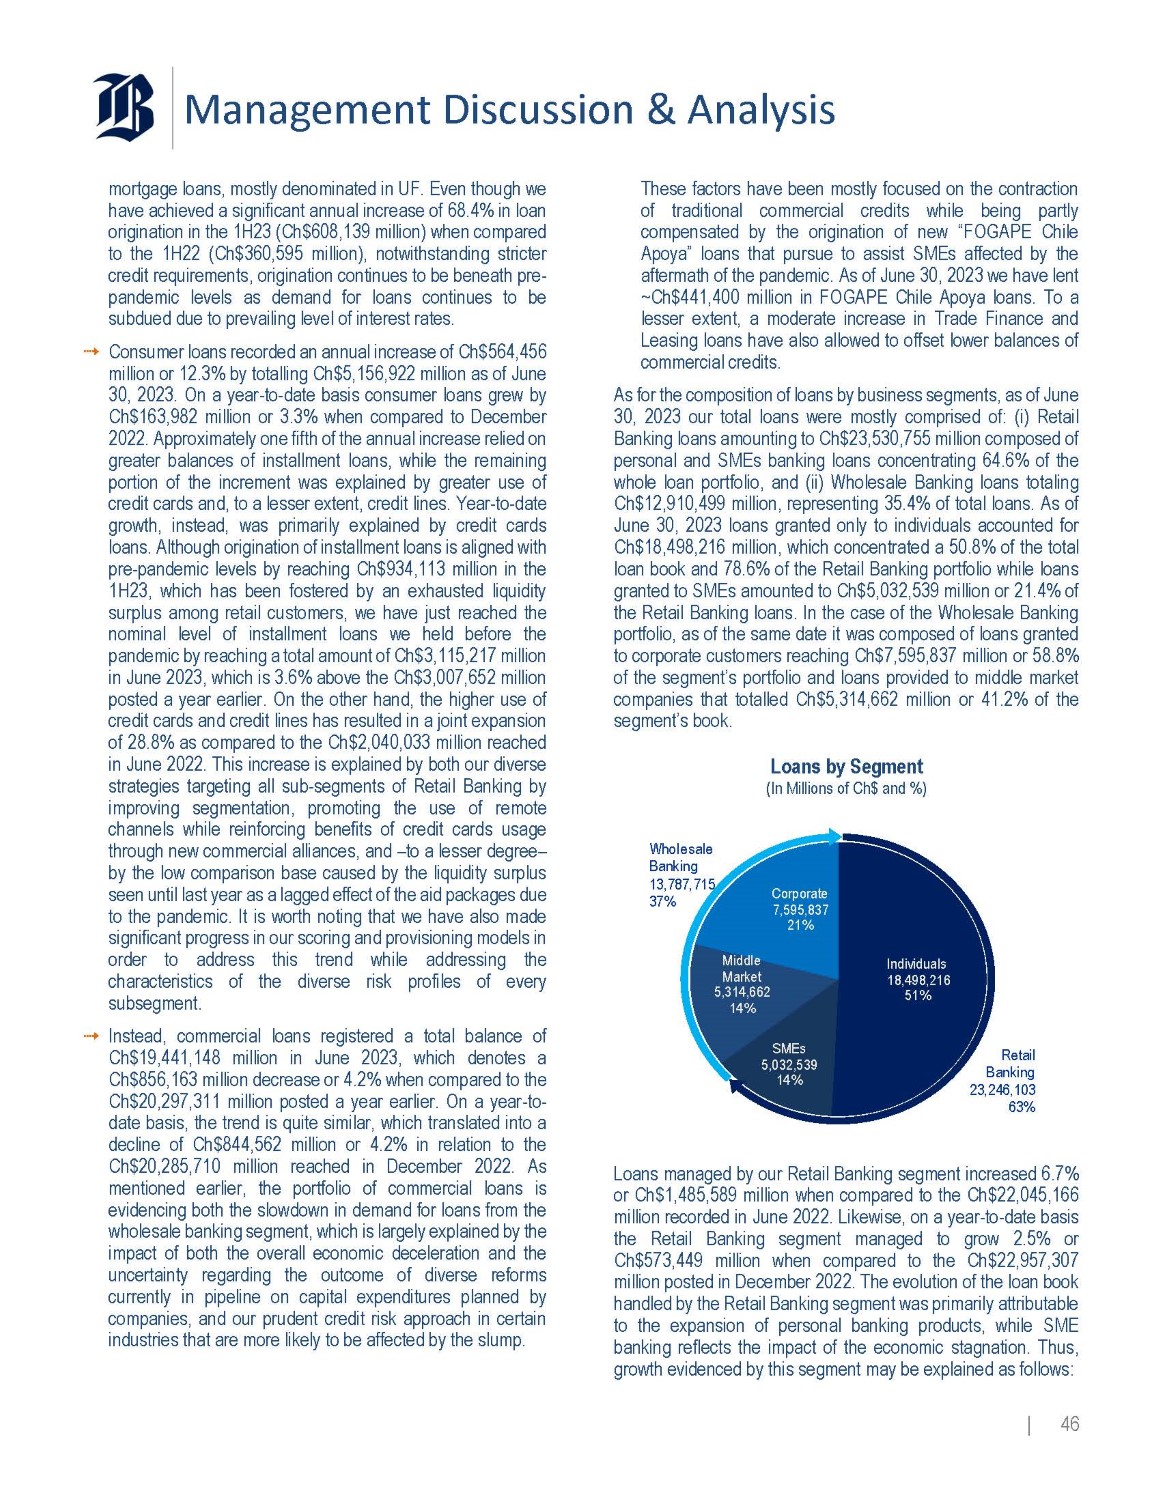
Management Discussion & Analysis mortgage loans, mostly denominated in UF . Even though we have achieved a significant annual increase of 68 . 4 % in loan origination in the 1 H 23 (Ch $ 608 , 139 million) when compared to the 1 H 22 (Ch $ 360 , 595 million), notwithstanding stricter credit requirements, origination continues to be beneath pre - pandemic levels as demand for loans continues to be subdued due to prevailing level of interest rates . Consumer loans recorded an annual increase of Ch $ 564 , 456 million or 12 . 3 % by totalling Ch $ 5 , 156 , 922 million as of June 30 , 2023 . On a year - to - date basis consumer loans grew by Ch $ 163 , 982 million or 3 . 3 % when compared to December 2022 . Approximately one fifth of the annual increase relied on greater balances of installment loans, while the remaining portion of the increment was explained by greater use of credit cards and, to a lesser extent, credit lines . Year - to - date growth, instead, was primarily explained by credit cards loans . Although origination of installment loans is aligned with pre - pandemic levels by reaching Ch $ 934 , 113 million in the 1 H 23 , which has been fostered by an exhausted liquidity surplus among retail customers, we have just reached the nominal level of installment loans we held before the pandemic by reaching a total amount of Ch $ 3 , 115 , 217 million in June 2023 , which is 3 . 6 % above the Ch $ 3 , 007 , 652 million posted a year earlier . On the other hand, the higher use of credit cards and credit lines has resulted in a joint expansion of 28 . 8 % as compared to the Ch $ 2 , 040 , 033 million reached in June 2022 . This increase is explained by both our diverse strategies targeting all sub - segments of Retail Banking by improving segmentation, promoting the use of remote channels while reinforcing benefits of credit cards usage through new commercial alliances, and – to a lesser degree – by the low comparison base caused by the liquidity surplus seen until last year as a lagged effect of the aid packages due to the pandemic . It is worth noting that we have also made significant progress in our scoring and provisioning models in order to address this trend while addressing the characteristics of the diverse risk profiles of every subsegment . Instead, commercial loans registered a total balance of Ch $ 19 , 441 , 148 million in June 2023 , which denotes a Ch $ 856 , 163 million decrease or 4 . 2 % when compared to the Ch $ 20 , 297 , 311 million posted a year earlier . On a year - to - date basis, the trend is quite similar, which translated into a decline of Ch $ 844 , 562 million or 4 . 2 % in relation to the Ch $ 20 , 285 , 710 million reached in December 2022 . As mentioned earlier, the portfolio of commercial loans is evidencing both the slowdown in demand for loans from the wholesale banking segment, which is largely explained by the impact of both the overall economic deceleration and the uncertainty regarding the outcome of diverse reforms currently in pipeline on capital expenditures planned by companies, and our prudent credit risk approach in certain industries that are more likely to be affected by the slump . These factors have been mostly focused on the contraction of traditional commercial credits while being partly compensated by the origination of new “FOGAPE Chile Apoya” loans that pursue to assist SMEs affected by the aftermath of the pandemic . As of June 30 , 2023 we have lent ~Ch $ 441 , 400 million in FOGAPE Chile Apoya loans . To a lesser extent, a moderate increase in Trade Finance and Leasing loans have also allowed to offset lower balances of commercial credits . As for the composition of loans by business segments, as of June 30 , 2023 our total loans were mostly comprised of : (i) Retail Banking loans amounting to Ch $ 23 , 530 , 755 million composed of personal and SMEs banking loans concentrating 64 . 6 % of the whole loan portfolio, and (ii) Wholesale Banking loans totaling Ch $ 12 , 910 , 499 million, representing 35 . 4 % of total loans . As of June 30 , 2023 loans granted only to individuals accounted for Ch $ 18 , 498 , 216 million, which concentrated a 50 . 8 % of the total loan book and 78 . 6 % of the Retail Banking portfolio while loans granted to SMEs amounted to Ch $ 5 , 032 , 539 million or 21 . 4 % of the Retail Banking loans . In the case of the Wholesale Banking portfolio, as of the same date it was composed of loans granted to corporate customers reaching Ch $ 7 , 595 , 837 million or 58 . 8 % of the segment’s portfolio and loans provided to middle market companies that totalled Ch $ 5 , 314 , 662 million or 41 . 2 % of the segment’s book . Loans by Segment (In Millions of Ch$ and %) SMEs 5,032,539 14% Middle Market 5,314,662 14% Corporate 7,595,837 21% Individuals 18,498,216 51% Wholesale Banking 13,787,715 37% Retail Banking 23,246,103 63% Loans managed by our Retail Banking segment increased 6 . 7 % or Ch $ 1 , 485 , 589 million when compared to the Ch $ 22 , 045 , 166 million recorded in June 2022 . Likewise, on a year - to - date basis the Retail Banking segment managed to grow 2 . 5 % or Ch $ 573 , 449 million when compared to the Ch $ 22 , 957 , 307 million posted in December 2022 . The evolution of the loan book handled by the Retail Banking segment was primarily attributable to the expansion of personal banking products, while SME banking reflects the impact of the economic stagnation . Thus, growth evidenced by this segment may be explained as follows : | 46
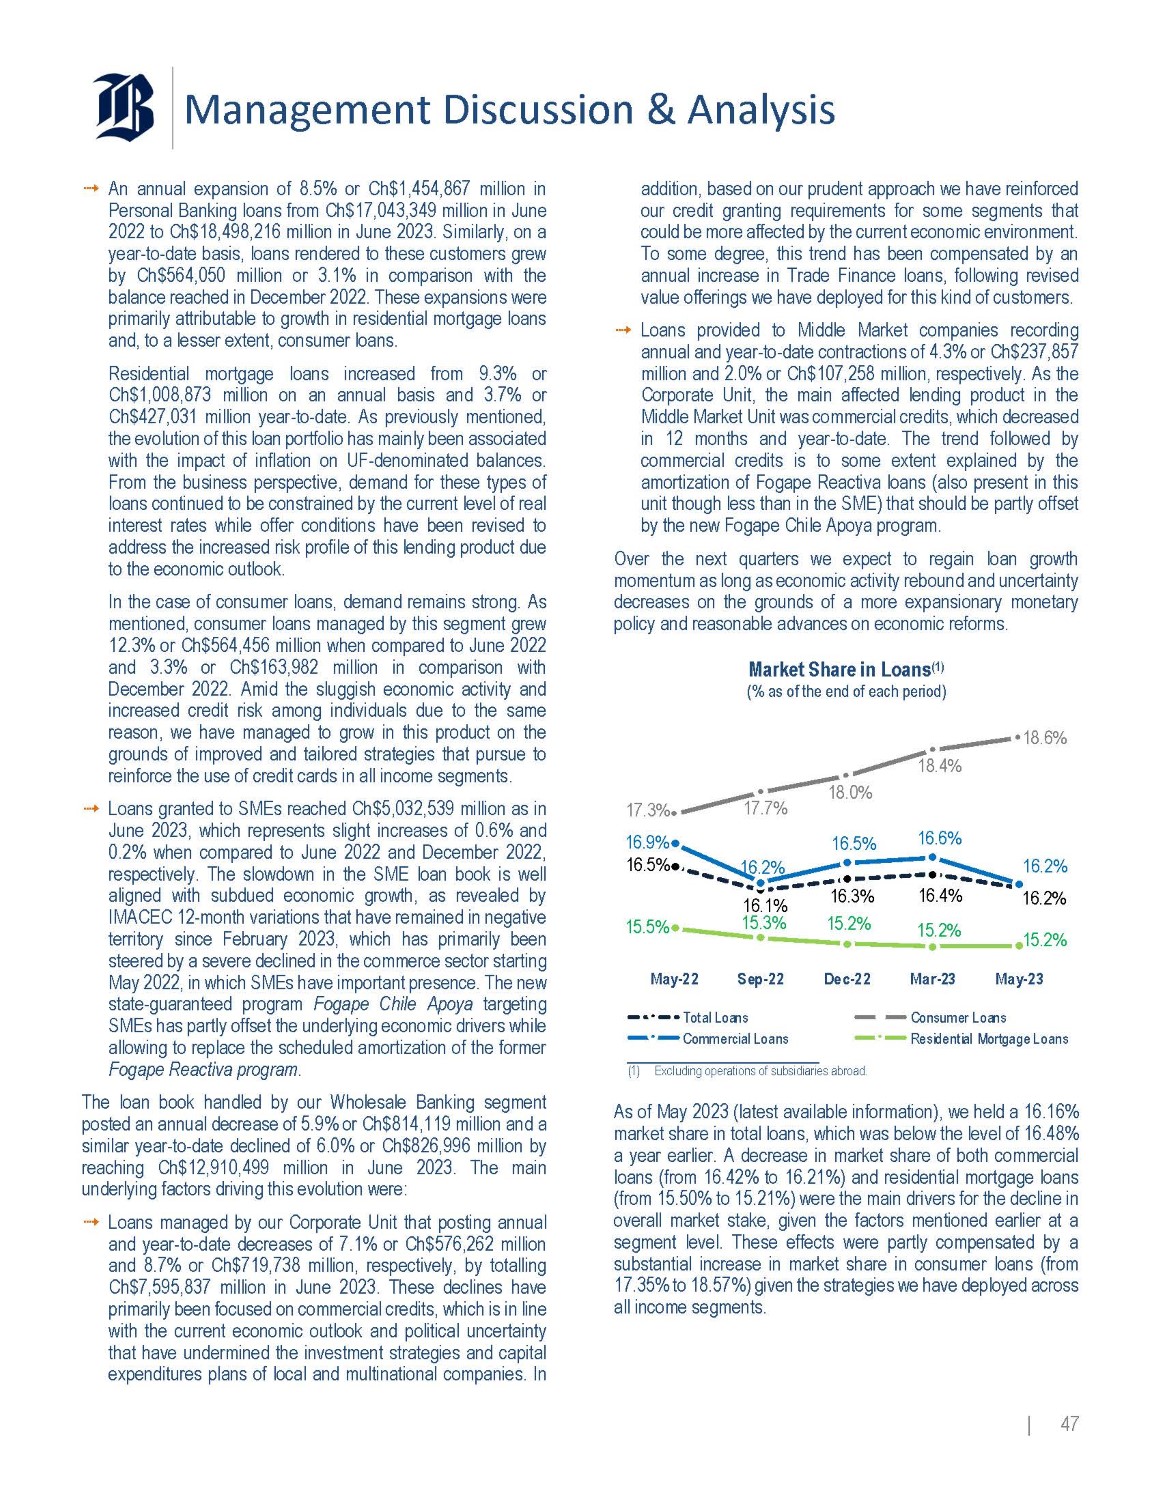
Management Discussion & Analysis An annual expansion of 8 . 5 % or Ch $ 1 , 454 , 867 million in Personal Banking loans from Ch $ 17 , 043 , 349 million in June 2022 to Ch $ 18 , 498 , 216 million in June 2023 . Similarly, on a year - to - date basis, loans rendered to these customers grew by Ch $ 564 , 050 million or 3 . 1 % in comparison with the balance reached in December 2022 . These expansions were primarily attributable to growth in residential mortgage loans and, to a lesser extent, consumer loans . Residential mortgage loans increased from 9 . 3 % or Ch $ 1 , 008 , 873 million on an annual basis and 3 . 7 % or Ch $ 427 , 031 million year - to - date . As previously mentioned, the evolution of this loan portfolio has mainly been associated with the impact of inflation on UF - denominated balances . From the business perspective, demand for these types of loans continued to be constrained by the current level of real interest rates while offer conditions have been revised to address the increased risk profile of this lending product due to the economic outlook . In the case of consumer loans, demand remains strong . As mentioned, consumer loans managed by this segment grew 12 . 3 % or Ch $ 564 , 456 million when compared to June 2022 and 3 . 3 % or Ch $ 163 , 982 million in comparison with December 2022 . Amid the sluggish economic activity and increased credit risk among individuals due to the same reason, we have managed to grow in this product on the grounds of improved and tailored strategies that pursue to reinforce the use of credit cards in all income segments . Loans granted to SMEs reached Ch $ 5 , 032 , 539 million as in June 2023 , which represents slight increases of 0 . 6 % and 0 . 2 % when compared to June 2022 and December 2022 , respectively . The slowdown in the SME loan book is well aligned with subdued economic growth, as revealed by IMACEC 12 - month variations that have remained in negative territory since February 2023 , which has primarily been steered by a severe declined in the commerce sector starting May 2022 , in which SMEs have important presence . The new state - guaranteed program Fogape Chile Apoya targeting SMEs has partly offset the underlying economic drivers while allowing to replace the scheduled amortization of the former Fogape Reactiva program . The loan book handled by our Wholesale Banking segment posted an annual decrease of 5 . 9 % or Ch $ 814 , 119 million and a similar year - to - date declined of 6 . 0 % or Ch $ 826 , 996 million by reaching Ch $ 12 , 910 , 499 million in June 2023 . The main underlying factors driving this evolution were : Loans managed by our Corporate Unit that posting annual and year - to - date decreases of 7 . 1 % or Ch $ 576 , 262 million and 8 . 7 % or Ch $ 719 , 738 million, respectively, by totalling Ch $ 7 , 595 , 837 million in June 2023 . These declines have primarily been focused on commercial credits, which is in line with the current economic outlook and political uncertainty that have undermined the investment strategies and capital expenditures plans of local and multinational companies . In addition, based on our prudent approach we have reinforced our credit granting requirements for some segments that could be more affected by the current economic environment . To some degree, this trend has been compensated by an annual increase in Trade Finance loans, following revised value offerings we have deployed for this kind of customers . Loans provided to Middle Market companies recording annual and year - to - date contractions of 4 . 3 % or Ch $ 237 , 857 million and 2 . 0 % or Ch $ 107 , 258 million, respectively . As the Corporate Unit, the main affected lending product in the Middle Market Unit was commercial credits, which decreased in 12 months and year - to - date . The trend followed by commercial credits is to some extent explained by the amortization of Fogape Reactiva loans (also present in this unit though less than in the SME) that should be partly offset by the new Fogape Chile Apoya program . Over the next quarters we expect to regain loan growth momentum as long as economic activity rebound and uncertainty decreases on the grounds of a more expansionary monetary policy and reasonable advances on economic reforms . Market Share in Loans (1) (% as of the end of each period) 18.6% 18.4% 18.0% 17.7% 17.3% 16.9% 16.5% 16.5% 16.6% 16.2% 16.2% 15.5% 16.2% 16.1% 15.3% 16.3% 15.2% 16.4% 15.2% 15.2% Dec - 22 Mar - 23 May - 23 Consumer Loans Residential Mortgage Loans May - 22 Sep - 22 Total Loans Commercial Loans (1) Excluding operations of subsidiaries abroad. | 47 As of May 2023 (latest available information), we held a 16 . 16 % market share in total loans, which was below the level of 16 . 48 % a year earlier . A decrease in market share of both commercial loans (from 16 . 42 % to 16 . 21 % ) and residential mortgage loans (from 15 . 50 % to 15 . 21 % ) were the main drivers for the decline in overall market stake, given the factors mentioned earlier at a segment level . These effects were partly compensated by a substantial increase in market share in consumer loans (from 17 . 35 % to 18 . 57 % ) given the strategies we have deployed across all income segments .
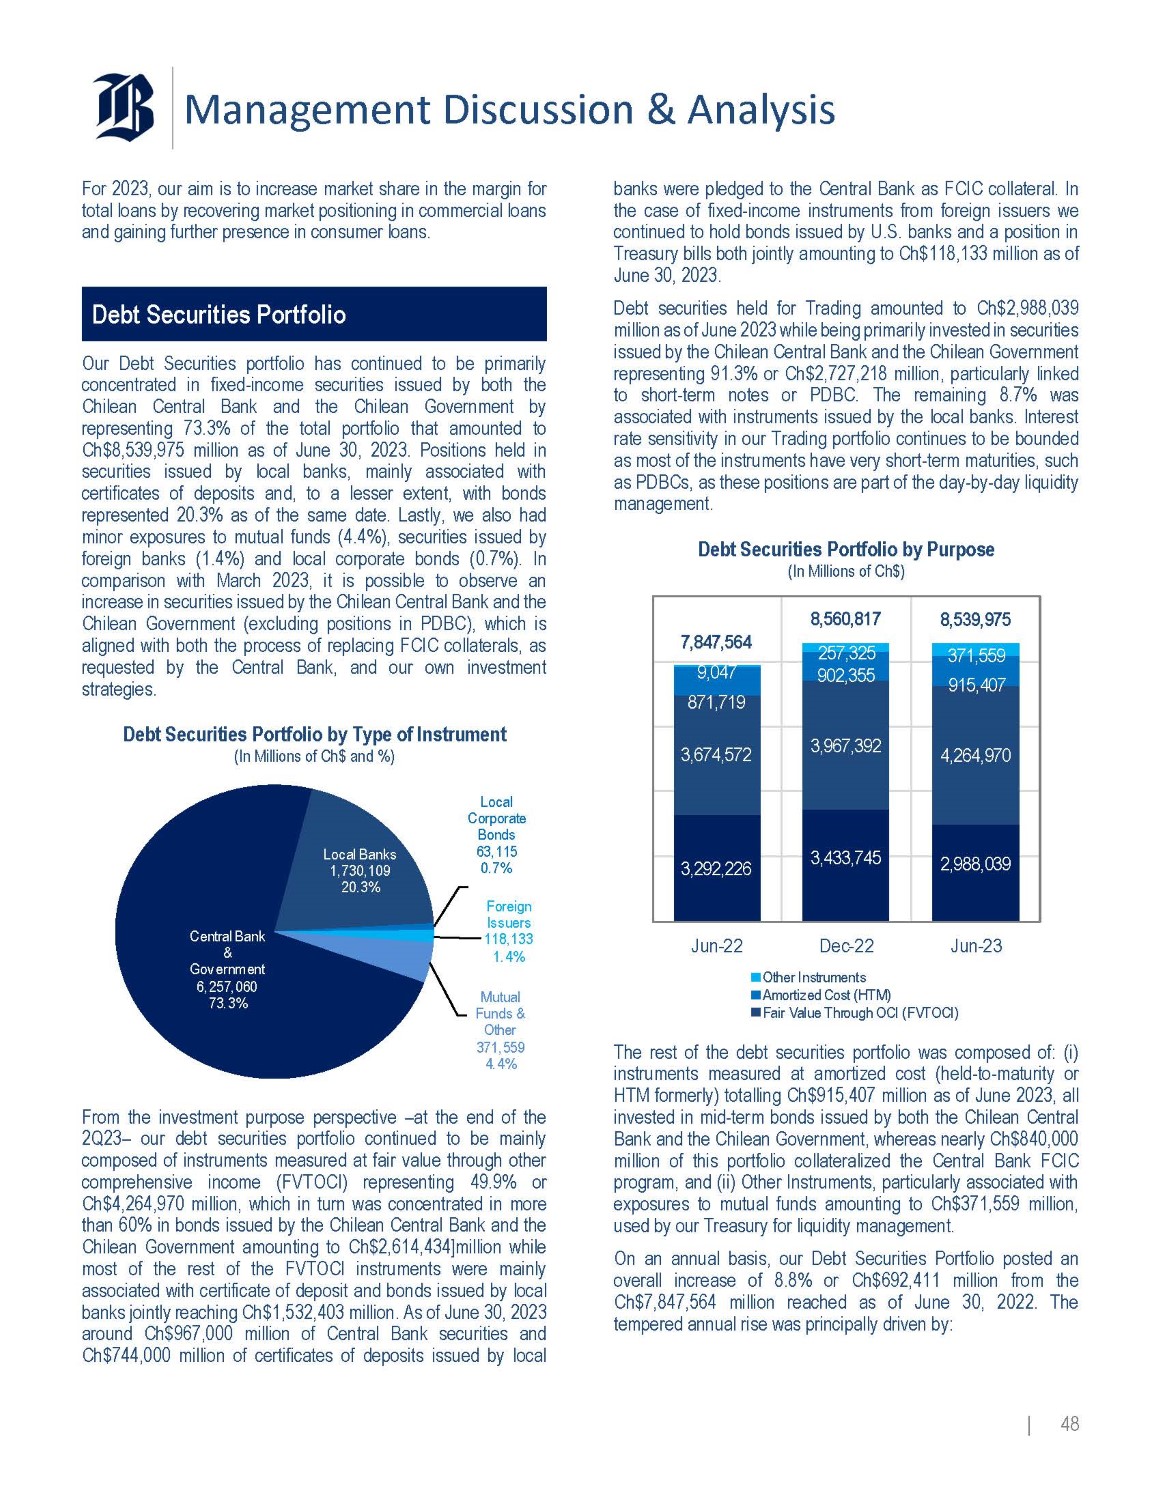
Management Discussion & Analysis For 2023 , our aim is to increase market share in the margin for total loans by recovering market positioning in commercial loans and gaining further presence in consumer loans . Debt Securities Portfolio Our Debt Securities portfolio has continued to be primarily concentrated in fixed - income securities issued by both the Chilean Central Bank and the Chilean Government by representing 73 . 3 % of the total portfolio that amounted to Ch $ 8 , 539 , 975 million as of June 30 , 2023 . Positions held in securities issued by local banks, mainly associated with certificates of deposits and, to a lesser extent, with bonds represented 20 . 3 % as of the same date . Lastly, we also had minor exposures to mutual funds ( 4 . 4 % ), securities issued by foreign banks ( 1 . 4 % ) and local corporate bonds ( 0 . 7 % ) . In comparison with March 2023 , it is possible to observe an increase in securities issued by the Chilean Central Bank and the Chilean Government (excluding positions in PDBC), which is aligned with both the process of replacing FCIC collaterals, as requested by the Central Bank, and our own investment strategies . Debt Securities Portfolio by Type of Instrument (In Millions of Ch$ and %) Central Bank & Gov ernment 6,257,060 73.3% Local Banks 1,730,109 20.3% Local Corporate Bonds 63,115 0.7% Foreign Issuers 118 , 133 1.4% Mutual Funds & Other 371,559 4.4% From the investment purpose perspective – at the end of the 2 Q 23 – our debt securities portfolio continued to be mainly composed of instruments measured at fair value through other comprehensive income (FVTOCI) representing 49 . 9 % or Ch $ 4 , 264 , 970 million, which in turn was concentrated in more than 60 % in bonds issued by the Chilean Central Bank and the Chilean Government amounting to Ch $ 2 , 614 , 434 ]million while most of the rest of the FVTOCI instruments were mainly associated with certificate of deposit and bonds issued by local banks jointly reaching Ch $ 1 , 532 , 403 million . As of June 30 , 2023 around Ch $ 967 , 000 million of Central Bank securities and Ch $ 744 , 000 million of certificates of deposits issued by local banks were pledged to the Central Bank as FCIC collateral . In the case of fixed - income instruments from foreign issuers we continued to hold bonds issued by U . S . banks and a position in Treasury bills both jointly amounting to Ch $ 118 , 133 million as of June 30 , 2023 . Debt securities held for Trading amounted to Ch $ 2 , 988 , 039 million as of June 2023 while being primarily invested in securities issued by the Chilean Central Bank and the Chilean Government representing 91 . 3 % or Ch $ 2 , 727 , 218 million, particularly linked to short - term notes or PDBC . The remaining 8 . 7 % was associated with instruments issued by the local banks . Interest rate sensitivity in our Trading portfolio continues to be bounded as most of the instruments have very short - term maturities, such as PDBCs, as these positions are part of the day - by - day liquidity management . Debt Securities Portfolio by Purpose (In Millions of Ch$) 8,539,975 8,560,817 7,847,564 371,559 915,407 257,325 902,355 9,047 4,264,970 3,967,392 871,719 3,674,572 3,433,745 3,292,226 2,988,039 Jun - 22 Dec - 22 Other Instruments Amortized Cost (HTM) Jun - 23 Fair Value Through OCI (FVTOCI) | 48 The rest of the debt securities portfolio was composed of : (i) instruments measured at amortized cost (held - to - maturity or HTM formerly) totalling Ch $ 915 , 407 million as of June 2023 , all invested in mid - term bonds issued by both the Chilean Central Bank and the Chilean Government, whereas nearly Ch $ 840 , 000 million of this portfolio collateralized the Central Bank FCIC program, and (ii) Other Instruments, particularly associated with exposures to mutual funds amounting to Ch $ 371 , 559 million, used by our Treasury for liquidity management . On an annual basis, our Debt Securities Portfolio posted an overall increase of 8 . 8 % or Ch $ 692 , 411 million from the Ch $ 7 , 847 , 564 million reached as of June 30 , 2022 . The tempered annual rise was principally driven by :
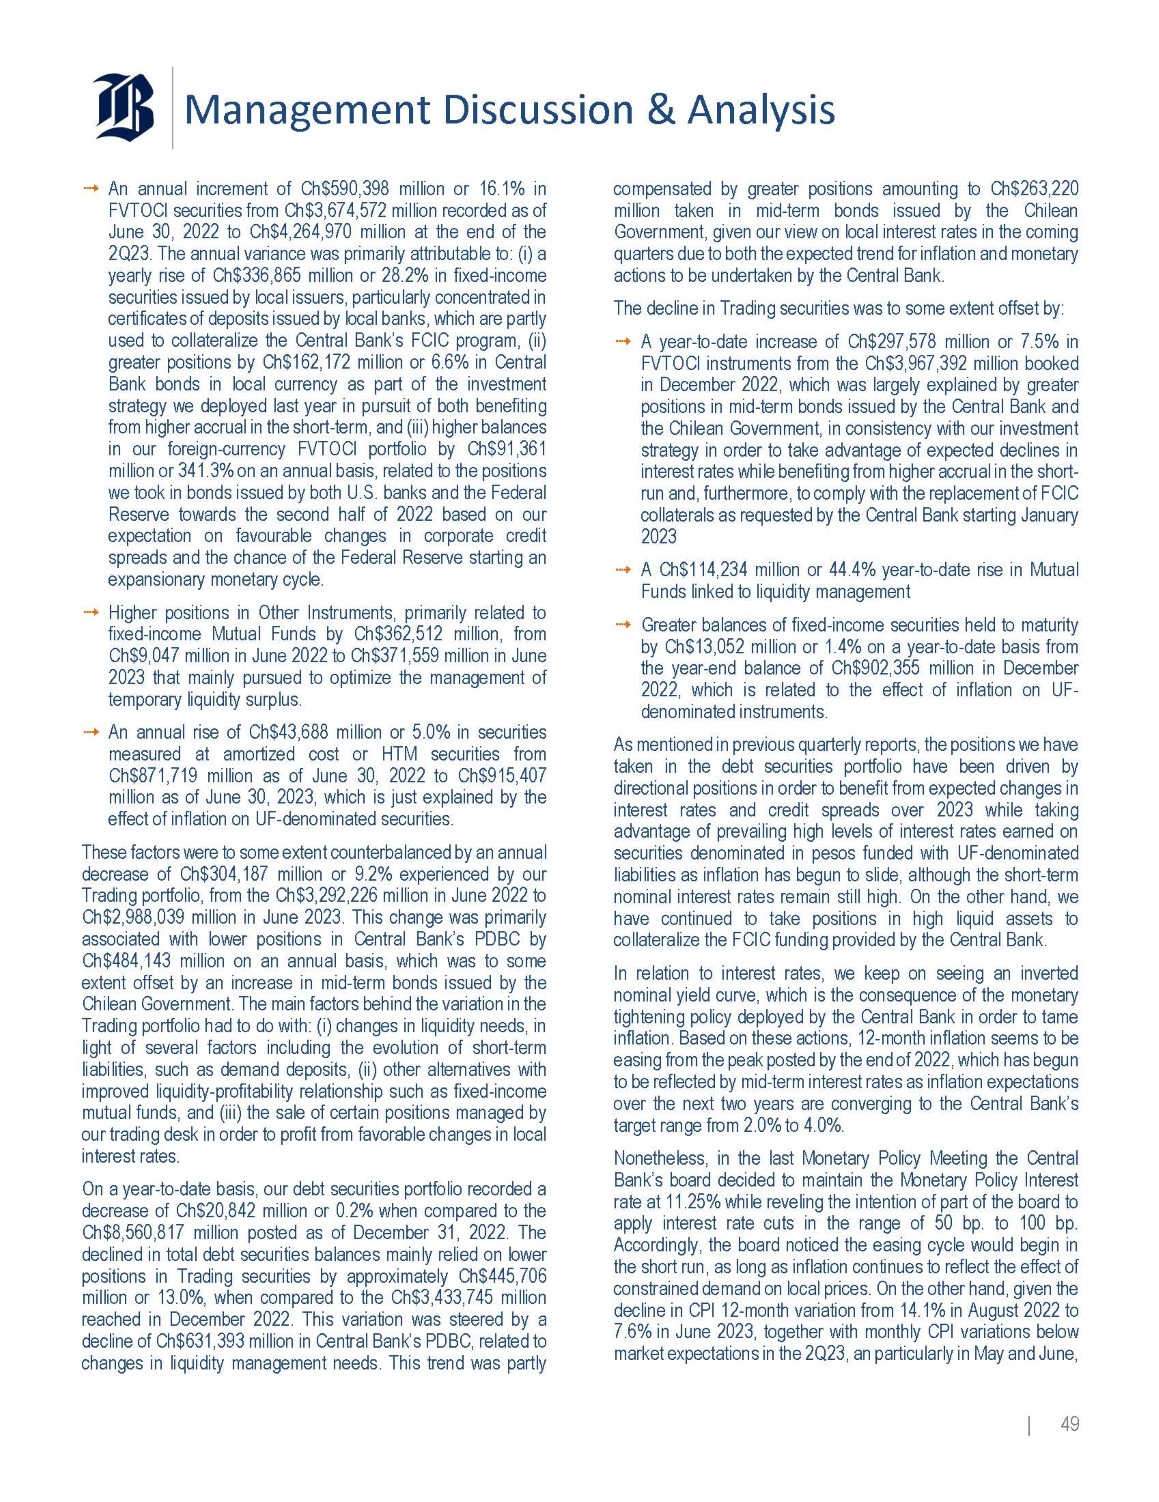
Management Discussion & Analysis An annual increment of Ch $ 590 , 398 million or 16 . 1 % in FVTOCI securities from Ch $ 3 , 674 , 572 million recorded as of June 30 , 2022 to Ch $ 4 , 264 , 970 million at the end of the 2 Q 23 . The annual variance was primarily attributable to : (i) a yearly rise of Ch $ 336 , 865 million or 28 . 2 % in fixed - income securities issued by local issuers, particularly concentrated in certificates of deposits issued by local banks, which are partly used to collateralize the Central Bank’s FCIC program, (ii) greater positions by Ch $ 162 , 172 million or 6 . 6 % in Central Bank bonds in local currency as part of the investment strategy we deployed last year in pursuit of both benefiting from higher accrual in the short - term, and (iii) higher balances in our foreign - currency FVTOCI portfolio by Ch $ 91 , 361 million or 341 . 3 % on an annual basis, related to the positions we took in bonds issued by both U . S . banks and the Federal Reserve towards the second half of 2022 based on our expectation on favourable changes in corporate credit spreads and the chance of the Federal Reserve starting an expansionary monetary cycle . Higher positions in Other Instruments, primarily related to fixed - income Mutual Funds by Ch $ 362 , 512 million, from Ch $ 9 , 047 million in June 2022 to Ch $ 371 , 559 million in June 2023 that mainly pursued to optimize the management of temporary liquidity surplus . An annual rise of Ch $ 43 , 688 million or 5 . 0 % in securities measured at amortized cost or HTM securities from Ch $ 871 , 719 million as of June 30 , 2022 to Ch $ 915 , 407 million as of June 30 , 2023 , which is just explained by the effect of inflation on UF - denominated securities . These factors were to some extent counterbalanced by an annual decrease of Ch $ 304 , 187 million or 9 . 2 % experienced by our Trading portfolio, from the Ch $ 3 , 292 , 226 million in June 2022 to Ch $ 2 , 988 , 039 million in June 2023 . This change was primarily associated with lower positions in Central Bank’s PDBC by Ch $ 484 , 143 million on an annual basis, which was to some extent offset by an increase in mid - term bonds issued by the Chilean Government . The main factors behind the variation in the Trading portfolio had to do with : (i) changes in liquidity needs, in light of several factors including the evolution of short - term liabilities, such as demand deposits, (ii) other alternatives with improved liquidity - profitability relationship such as fixed - income mutual funds, and (iii) the sale of certain positions managed by our trading desk in order to profit from favorable changes in local interest rates . On a year - to - date basis, our debt securities portfolio recorded a decrease of Ch $ 20 , 842 million or 0 . 2 % when compared to the Ch $ 8 , 560 , 817 million posted as of December 31 , 2022 . The declined in total debt securities balances mainly relied on lower positions in Trading securities by approximately Ch $ 445 , 706 million or 13 . 0 % , when compared to the Ch $ 3 , 433 , 745 million reached in December 2022 . This variation was steered by a decline of Ch $ 631 , 393 million in Central Bank’s PDBC, related to changes in liquidity management needs . This trend was partly | 49 compensated by greater positions amounting to Ch $ 263 , 220 million taken in mid - term bonds issued by the Chilean Government, given our view on local interest rates in the coming quarters due to both the expected trend for inflation and monetary actions to be undertaken by the Central Bank . The decline in Trading securities was to some extent offset by : A year - to - date increase of Ch $ 297 , 578 million or 7 . 5 % in FVTOCI instruments from the Ch $ 3 , 967 , 392 million booked in December 2022 , which was largely explained by greater positions in mid - term bonds issued by the Central Bank and the Chilean Government, in consistency with our investment strategy in order to take advantage of expected declines in interest rates while benefiting from higher accrual in the short - run and, furthermore, to comply with the replacement of FCIC collaterals as requested by the Central Bank starting January 2023 A Ch $ 114 , 234 million or 44 . 4 % year - to - date rise in Mutual Funds linked to liquidity management Greater balances of fixed - income securities held to maturity by Ch $ 13 , 052 million or 1 . 4 % on a year - to - date basis from the year - end balance of Ch $ 902 , 355 million in December 2022 , which is related to the effect of inflation on UF - denominated instruments . As mentioned in previous quarterly reports, the positions we have taken in the debt securities portfolio have been driven by directional positions in order to benefit from expected changes in interest rates and credit spreads over 2023 while taking advantage of prevailing high levels of interest rates earned on securities denominated in pesos funded with UF - denominated liabilities as inflation has begun to slide, although the short - term nominal interest rates remain still high . On the other hand, we have continued to take positions in high liquid assets to collateralize the FCIC funding provided by the Central Bank . In relation to interest rates, we keep on seeing an inverted nominal yield curve, which is the consequence of the monetary tightening policy deployed by the Central Bank in order to tame inflation . Based on these actions, 12 - month inflation seems to be easing from the peak posted by the end of 2022 , which has begun to be reflected by mid - term interest rates as inflation expectations over the next two years are converging to the Central Bank’s target range from 2 . 0 % to 4 . 0 % . Nonetheless, in the last Monetary Policy Meeting the Central Bank’s board decided to maintain the Monetary Policy Interest rate at 11 . 25 % while reveling the intention of part of the board to apply interest rate cuts in the range of 50 bp . to 100 bp . Accordingly, the board noticed the easing cycle would begin in the short run, as long as inflation continues to reflect the effect of constrained demand on local prices . On the other hand, given the decline in CPI 12 - month variation from 14 . 1 % in August 2022 to 7 . 6 % in June 2023 , together with monthly CPI variations below market expectations in the 2 Q 23 , an particularly in May and June,
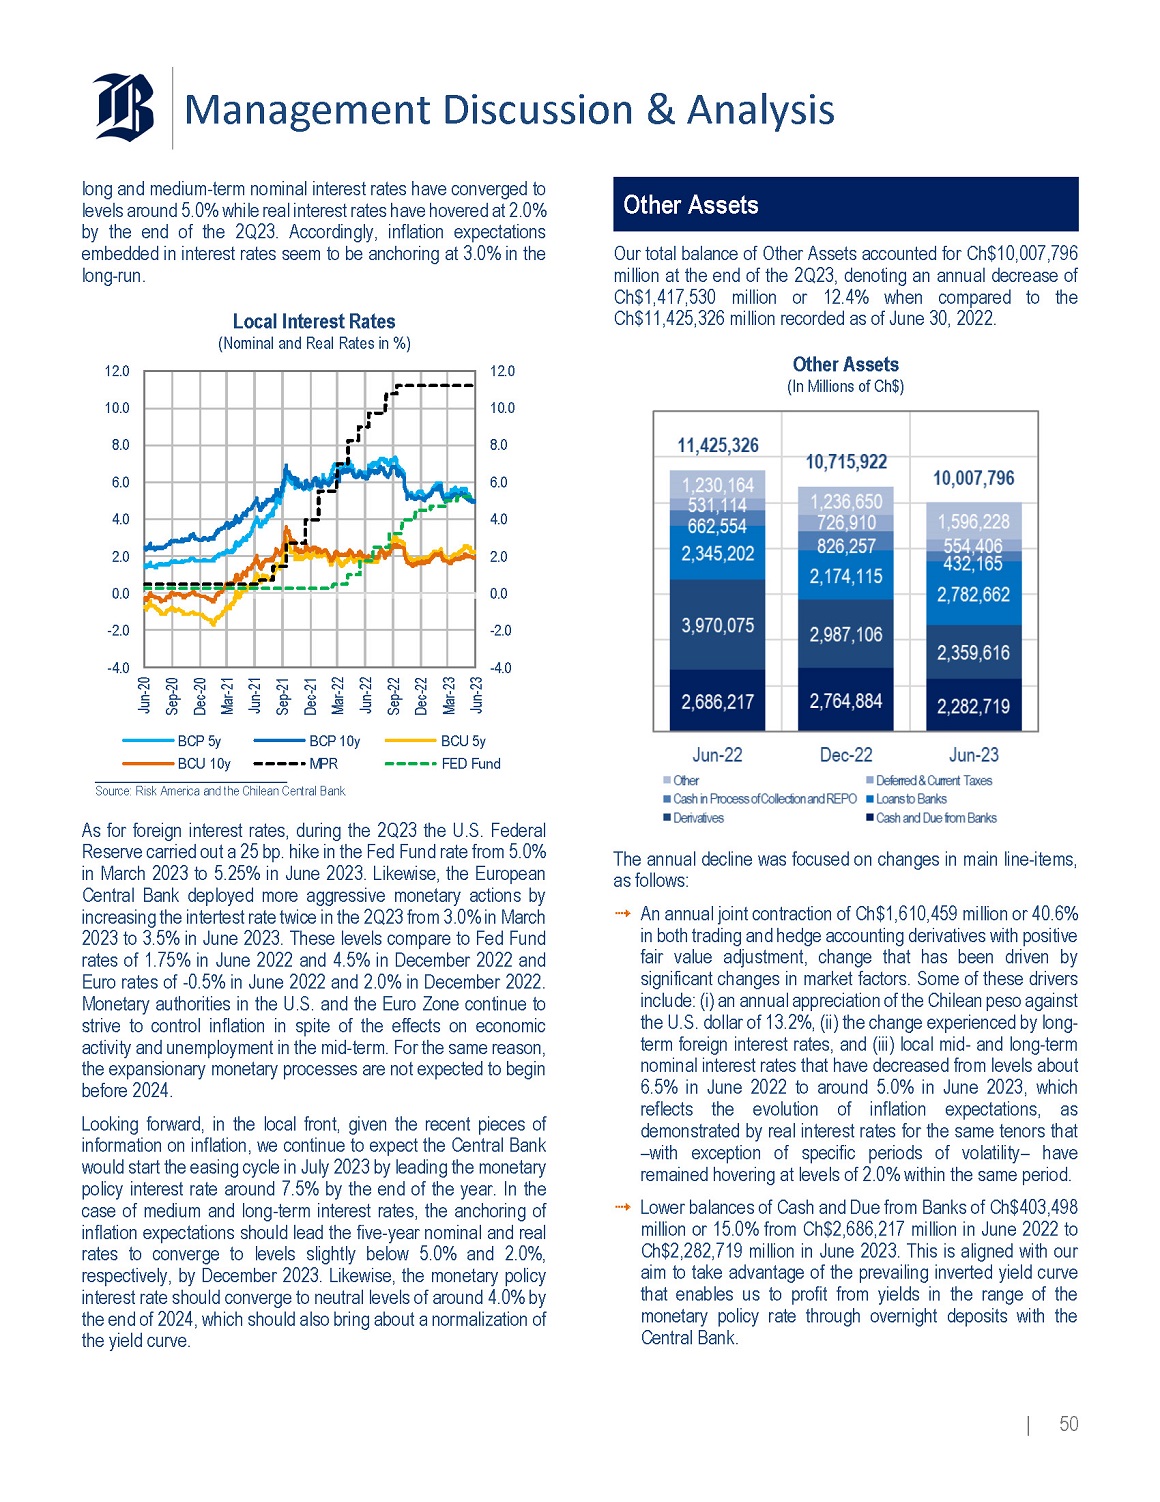
Management Discussion & Analysis long and medium - term nominal interest rates have converged to levels around 5 . 0 % while real interest rates have hovered at 2 . 0 % by the end of the 2 Q 23 . Accordingly, inflation expectations embedded in interest rates seem to be anchoring at 3 . 0 % in the long - run . Local Interest Rates (Nominal and Real Rates in %) - 4.0 - 2.0 0.0 2.0 4.0 6.0 8.0 10.0 12.0 - 4.0 - 2.0 0.0 2.0 4.0 6.0 8.0 10.0 12.0 Jun - 20 Sep - 20 Dec - 20 Mar - 21 Jun - 21 Sep - 21 Dec - 21 Mar - 22 Jun - 22 Sep - 22 Dec - 22 Mar - 23 Jun - 23 BCP 5y BCU 10y BCP 10y MPR BCU 5y FED Fund Source: Risk America and the Chilean Central Bank. As for foreign interest rates, during the 2 Q 23 the U . S . Federal Reserve carried out a 25 bp . hike in the Fed Fund rate from 5 . 0 % in March 2023 to 5 . 25 % in June 2023 . Likewise, the European Central Bank deployed more aggressive monetary actions by increasing the intertest rate twice in the 2 Q 23 from 3 . 0 % in March 2023 to 3 . 5 % in June 2023 . These levels compare to Fed Fund rates of 1 . 75 % in June 2022 and 4 . 5 % in December 2022 and Euro rates of - 0 . 5 % in June 2022 and 2 . 0 % in December 2022 . Monetary authorities in the U . S . and the Euro Zone continue to strive to control inflation in spite of the effects on economic activity and unemployment in the mid - term . For the same reason, the expansionary monetary processes are not expected to begin before 2024 . Looking forward, in the local front, given the recent pieces of information on inflation, we continue to expect the Central Bank would start the easing cycle in July 2023 by leading the monetary policy interest rate around 7 . 5 % by the end of the year . In the case of medium and long - term interest rates, the anchoring of inflation expectations should lead the five - year nominal and real rates to converge to levels slightly below 5 . 0 % and 2 . 0 % , respectively, by December 2023 . Likewise, the monetary policy interest rate should converge to neutral levels of around 4 . 0 % by the end of 2024 , which should also bring about a normalization of the yield curve . Other Assets Our total balance of Other Assets accounted for Ch $ 10 , 007 , 796 million at the end of the 2 Q 23 , denoting an annual decrease of Ch $ 1 , 417 , 530 million or 12 . 4 % when compared to the Ch $ 11 , 425 , 326 million recorded as of June 30 , 2022 . Other Assets (In Millions of Ch$) 2,686,217 2,764,884 2,282,719 3,970,075 2,987,106 2,359,616 2,345,202 2,174,115 2,782,662 662,554 826,257 432,165 726,910 1,230,164 531,114 1,236,650 1,596,228 554,406 11,425,326 10,715,922 10,007,796 Jun - 22 Dec - 22 Jun - 23 Other Deferred & Current Taxes Cash in Process of Collection and REPO The annual decline was focused on changes in main line - items, as follows: | 50 An annual joint contraction of Ch $ 1 , 610 , 459 million or 40 . 6 % in both trading and hedge accounting derivatives with positive fair value adjustment, change that has been driven by significant changes in market factors . Some of these drivers include : (i) an annual appreciation of the Chilean peso against the U . S . dollar of 13 . 2 % , (ii) the change experienced by long - term foreign interest rates, and (iii) local mid - and long - term nominal interest rates that have decreased from levels about 6 . 5 % in June 2022 to around 5 . 0 % in June 2023 , which reflects the evolution of inflation expectations, as demonstrated by real interest rates for the same tenors that – with exception of specific periods of volatility – have remained hovering at levels of 2 . 0 % within the same period . Lower balances of Cash and Due from Banks of Ch $ 403 , 498 million or 15 . 0 % from Ch $ 2 , 686 , 217 million in June 2022 to Ch $ 2 , 282 , 719 million in June 2023 . This is aligned with our aim to take advantage of the prevailing inverted yield curve that enables us to profit from yields in the range of the monetary policy rate through overnight deposits with the Central Bank .
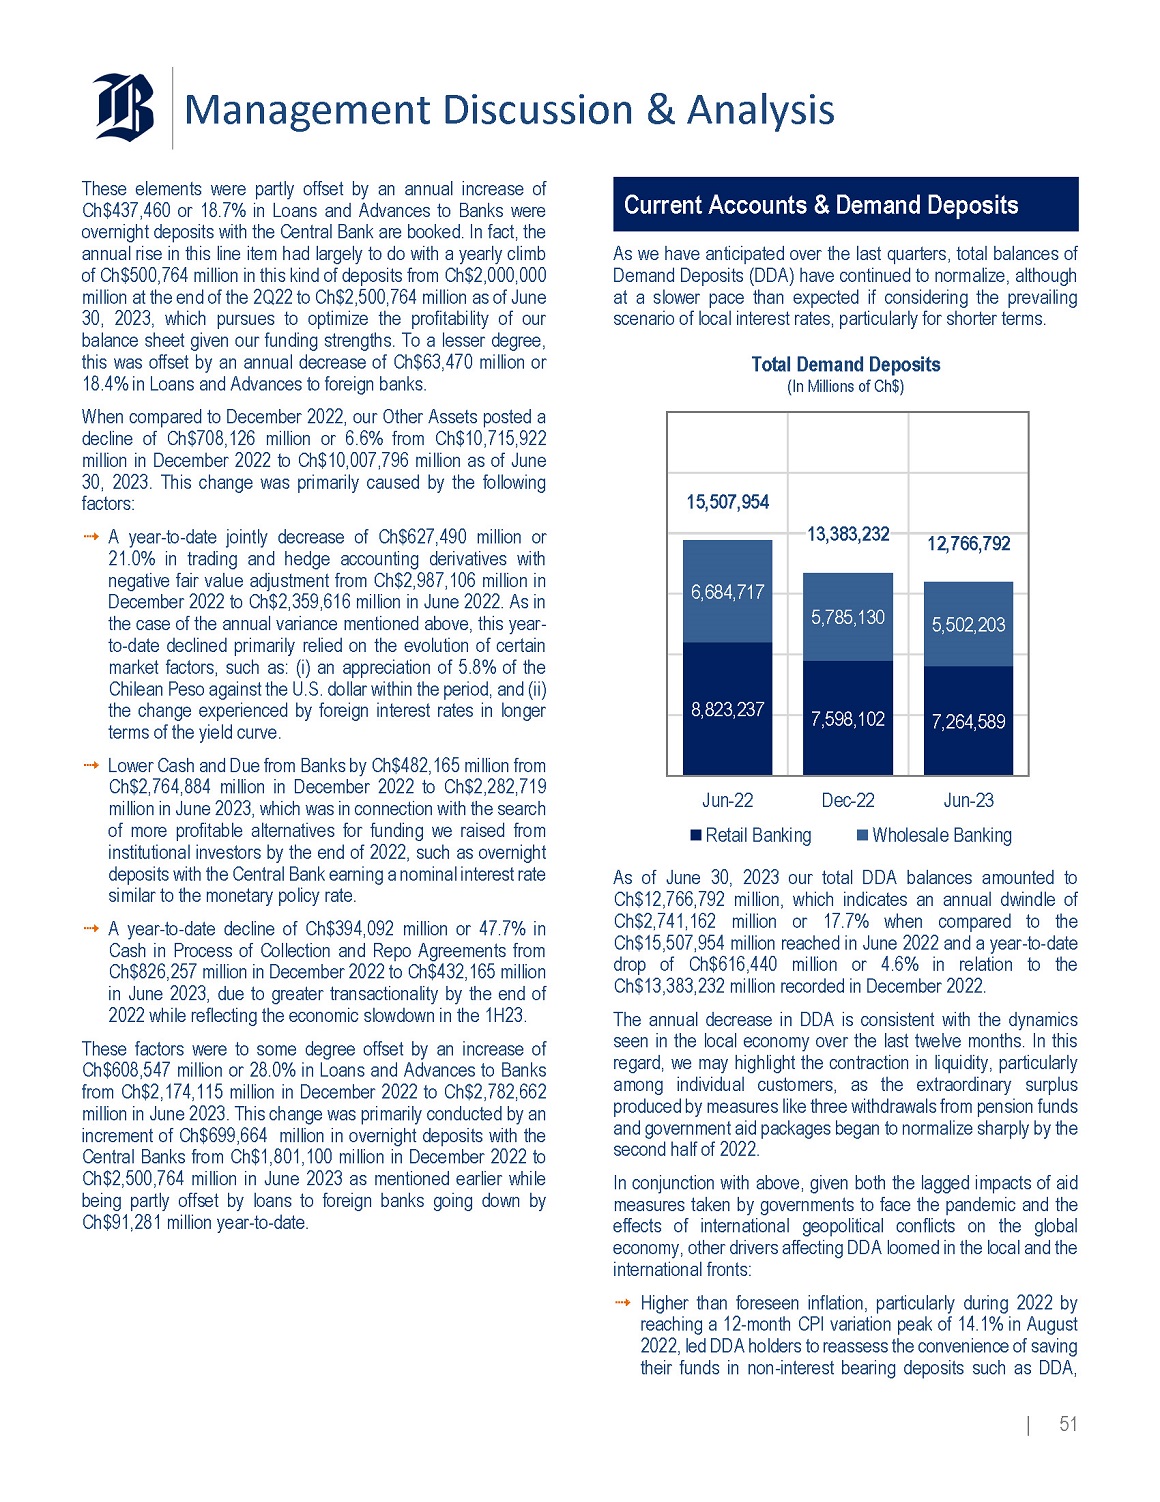
Management Discussion & Analysis These elements were partly offset by an annual increase of Ch $ 437 , 460 or 18 . 7 % in Loans and Advances to Banks were overnight deposits with the Central Bank are booked . In fact, the annual rise in this line item had largely to do with a yearly climb of Ch $ 500 , 764 million in this kind of deposits from Ch $ 2 , 000 , 000 million at the end of the 2 Q 22 to Ch $ 2 , 500 , 764 million as of June 30 , 2023 , which pursues to optimize the profitability of our balance sheet given our funding strengths . To a lesser degree, this was offset by an annual decrease of Ch $ 63 , 470 million or 18 . 4 % in Loans and Advances to foreign banks . When compared to December 2022 , our Other Assets posted a decline of Ch $ 708 , 126 million or 6 . 6 % from Ch $ 10 , 715 , 922 million in December 2022 to Ch $ 10 , 007 , 796 million as of June 30 , 2023 . This change was primarily caused by the following factors : A year - to - date jointly decrease of Ch $ 627 , 490 million or 21 . 0 % in trading and hedge accounting derivatives with negative fair value adjustment from Ch $ 2 , 987 , 106 million in December 2022 to Ch $ 2 , 359 , 616 million in June 2022 . As in the case of the annual variance mentioned above, this year - to - date declined primarily relied on the evolution of certain market factors, such as : (i) an appreciation of 5 . 8 % of the Chilean Peso against the U . S . dollar within the period, and (ii) the change experienced by foreign interest rates in longer terms of the yield curve . Lower Cash and Due from Banks by Ch $ 482 , 165 million from Ch $ 2 , 764 , 884 million in December 2022 to Ch $ 2 , 282 , 719 million in June 2023 , which was in connection with the search of more profitable alternatives for funding we raised from institutional investors by the end of 2022 , such as overnight deposits with the Central Bank earning a nominal interest rate similar to the monetary policy rate . A year - to - date decline of Ch $ 394 , 092 million or 47 . 7 % in Cash in Process of Collection and Repo Agreements from Ch $ 826 , 257 million in December 2022 to Ch $ 432 , 165 million in June 2023 , due to greater transactionality by the end of 2022 while reflecting the economic slowdown in the 1 H 23 . These factors were to some degree offset by an increase of Ch $ 608 , 547 million or 28 . 0 % in Loans and Advances to Banks from Ch $ 2 , 174 , 115 million in December 2022 to Ch $ 2 , 782 , 662 million in June 2023 . This change was primarily conducted by an increment of Ch $ 699 , 664 million in overnight deposits with the Central Banks from Ch $ 1 , 801 , 100 million in December 2022 to Ch $ 2 , 500 , 764 million in June 2023 as mentioned earlier while being partly offset by loans to foreign banks going down by Ch $ 91 , 281 million year - to - date . Current Accounts & Demand Deposits As we have anticipated over the last quarters, total balances of Demand Deposits (DDA) have continued to normalize, although at a slower pace than expected if considering the prevailing scenario of local interest rates, particularly for shorter terms . Total Demand Deposits (In Millions of Ch$) 8,823,23 7 7,598,10 2 7,264,58 9 6,684,71 7 5,785,13 0 5,502,20 3 15,507,954 13,383,232 12,766,792 Jun - 22 Retail Banking Dec - 22 Jun - 23 Wholesale Banking | 51 As of June 30 , 2023 our total DDA balances amounted to Ch $ 12 , 766 , 792 million, which indicates an annual dwindle of Ch $ 2 , 741 , 162 million or 17 . 7 % when compared to the Ch $ 15 , 507 , 954 million reached in June 2022 and a year - to - date drop of Ch $ 616 , 440 million or 4 . 6 % in relation to the Ch $ 13 , 383 , 232 million recorded in December 2022 . The annual decrease in DDA is consistent with the dynamics seen in the local economy over the last twelve months . In this regard, we may highlight the contraction in liquidity, particularly among individual customers, as the extraordinary surplus produced by measures like three withdrawals from pension funds and government aid packages began to normalize sharply by the second half of 2022 . In conjunction with above, given both the lagged impacts of aid measures taken by governments to face the pandemic and the effects of international geopolitical conflicts on the global economy, other drivers affecting DDA loomed in the local and the international fronts : Higher than foreseen inflation, particularly during 2022 by reaching a 12 - month CPI variation peak of 14 . 1 % in August 2022 , led DDA holders to reassess the convenience of saving their funds in non - interest bearing deposits such as DDA,
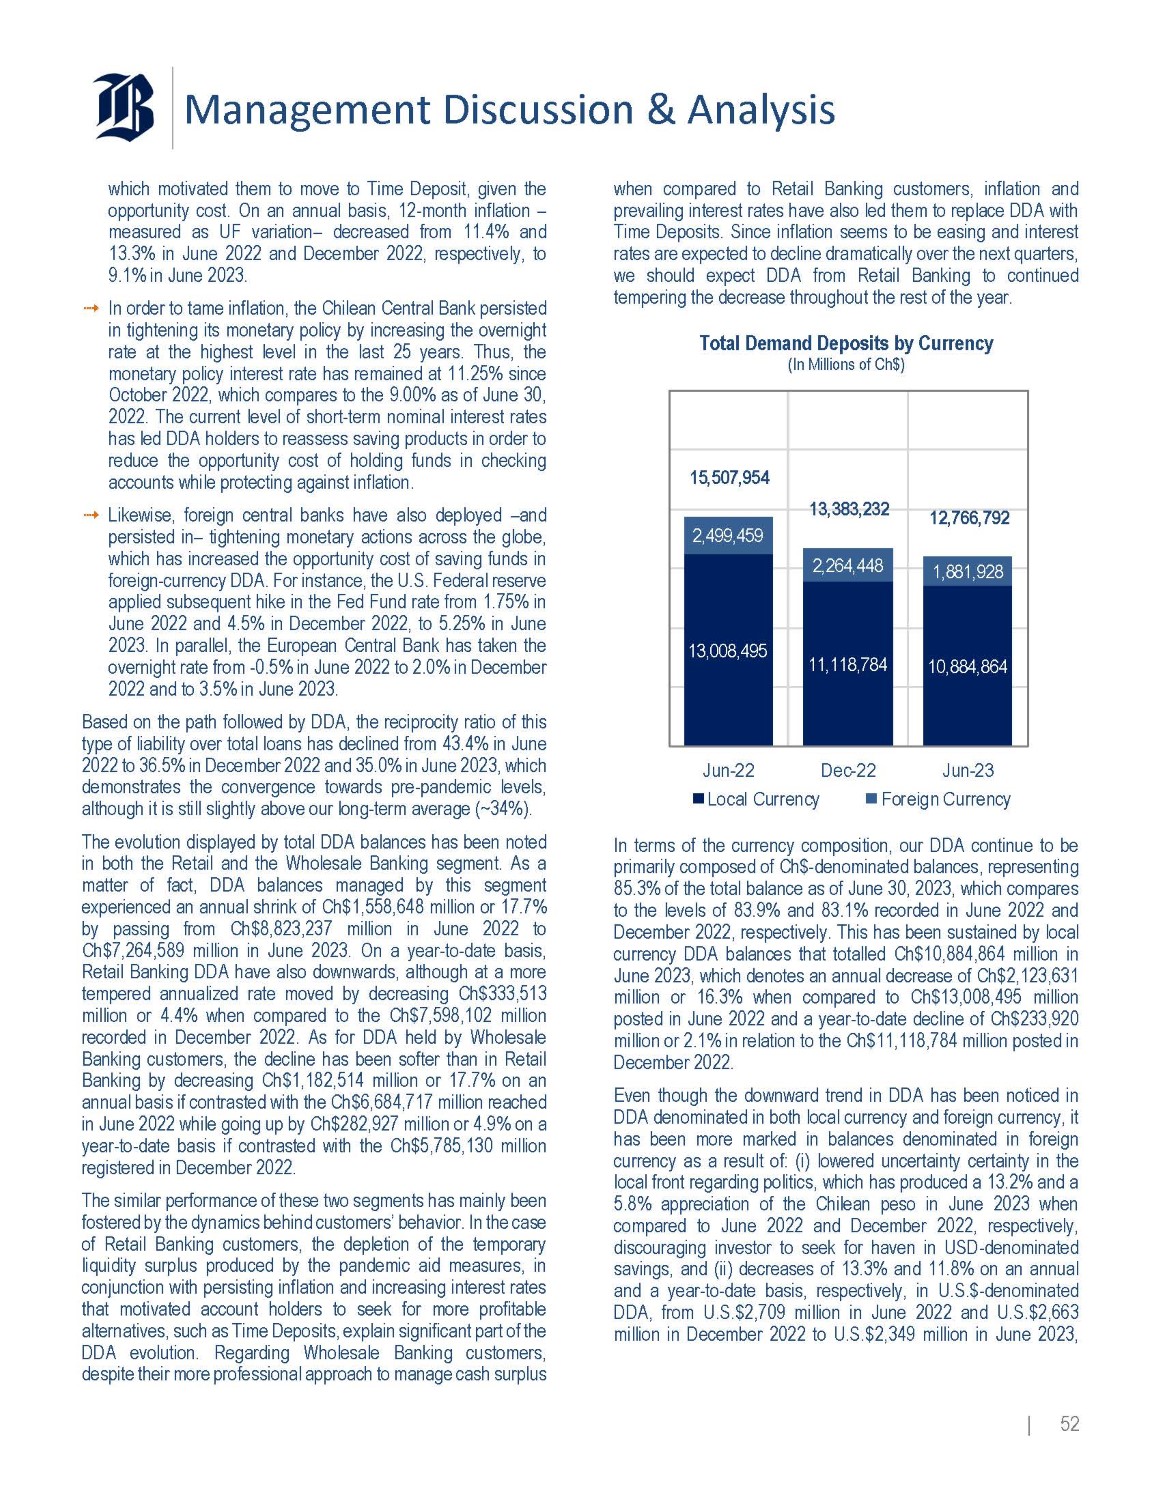
Management Discussion & Analysis which motivated them to move to Time Deposit, given the opportunity cost . On an annual basis, 12 - month inflation – measured as UF variation – decreased from 11 . 4 % and 13 . 3 % in June 2022 and December 2022 , respectively, to 9 . 1 % in June 2023 . In order to tame inflation, the Chilean Central Bank persisted in tightening its monetary policy by increasing the overnight rate at the highest level in the last 25 years . Thus, the monetary policy interest rate has remained at 11 . 25 % since October 2022 , which compares to the 9 . 00 % as of June 30 , 2022 . The current level of short - term nominal interest rates has led DDA holders to reassess saving products in order to reduce the opportunity cost of holding funds in checking accounts while protecting against inflation . Likewise, foreign central banks have also deployed – and persisted in – tightening monetary actions across the globe, which has increased the opportunity cost of saving funds in foreign - currency DDA . For instance, the U . S . Federal reserve applied subsequent hike in the Fed Fund rate from 1 . 75 % in June 2022 and 4 . 5 % in December 2022 , to 5 . 25 % in June 2023 . In parallel, the European Central Bank has taken the overnight rate from - 0 . 5 % in June 2022 to 2 . 0 % in December 2022 and to 3 . 5 % in June 2023 . Based on the path followed by DDA, the reciprocity ratio of this type of liability over total loans has declined from 43 . 4 % in June 2022 to 36 . 5 % in December 2022 and 35 . 0 % in June 2023 , which demonstrates the convergence towards pre - pandemic levels, although it is still slightly above our long - term average (~ 34 % ) . The evolution displayed by total DDA balances has been noted in both the Retail and the Wholesale Banking segment . As a matter of fact, DDA balances managed by this segment experienced an annual shrink of Ch $ 1 , 558 , 648 million or 17 . 7 % by passing from Ch $ 8 , 823 , 237 million in June 2022 to Ch $ 7 , 264 , 589 million in June 2023 . On a year - to - date basis, Retail Banking DDA have also downwards, although at a more tempered annualized rate moved by decreasing Ch $ 333 , 513 million or 4 . 4 % when compared to the Ch $ 7 , 598 , 102 million recorded in December 2022 . As for DDA held by Wholesale Banking customers, the decline has been softer than in Retail Banking by decreasing Ch $ 1 , 182 , 514 million or 17 . 7 % on an annual basis if contrasted with the Ch $ 6 , 684 , 717 million reached in June 2022 while going up by Ch $ 282 , 927 million or 4 . 9 % on a year - to - date basis if contrasted with the Ch $ 5 , 785 , 130 million registered in December 2022 . The similar performance of these two segments has mainly been fostered by the dynamics behind customers’ behavior . In the case of Retail Banking customers, the depletion of the temporary liquidity surplus produced by the pandemic aid measures, in conjunction with persisting inflation and increasing interest rates that motivated account holders to seek for more profitable alternatives, such as Time Deposits, explain significant part of the DDA evolution . Regarding Wholesale Banking customers, despite their more professional approach to manage cash surplus when compared to Retail Banking customers, inflation and prevailing interest rates have also led them to replace DDA with Time Deposits . Since inflation seems to be easing and interest rates are expected to decline dramatically over the next quarters, we should expect DDA from Retail Banking to continued tempering the decrease throughout the rest of the year . Total Demand Deposits by Currency (In Millions of Ch$) 13,383,232 15,507,954 12,766,792 2,499,459 1,881,928 2,264,448 13,008,495 10,884,864 11,118,784 Dec - 22 Jun - 23 Foreign Currency Jun - 22 Local Currency In terms of the currency composition, our DDA continue to be primarily composed of Ch $ - denominated balances, representing 85 . 3 % of the total balance as of June 30 , 2023 , which compares to the levels of 83 . 9 % and 83 . 1 % recorded in June 2022 and December 2022 , respectively . This has been sustained by local currency DDA balances that totalled Ch $ 10 , 884 , 864 million in June 2023 , which denotes an annual decrease of Ch $ 2 , 123 , 631 million or 16 . 3 % when compared to Ch $ 13 , 008 , 495 million posted in June 2022 and a year - to - date decline of Ch $ 233 , 920 million or 2 . 1 % in relation to the Ch $ 11 , 118 , 784 million posted in December 2022 . Even though the downward trend in DDA has been noticed in DDA denominated in both local currency and foreign currency, it has been more marked in balances denominated in foreign currency as a result of : (i) lowered uncertainty certainty in the local front regarding politics, which has produced a 13 . 2 % and a 5 . 8 % appreciation of the Chilean peso in June 2023 when compared to June 2022 and December 2022 , respectively, discouraging investor to seek for haven in USD - denominated savings, and (ii) decreases of 13 . 3 % and 11 . 8 % on an annual and a year - to - date basis, respectively, in U . S . $ - denominated DDA, from U . S . $ 2 , 709 million in June 2022 and U . S . $ 2 , 663 million in December 2022 to U . S . $ 2 , 349 million in June 2023 , | 52
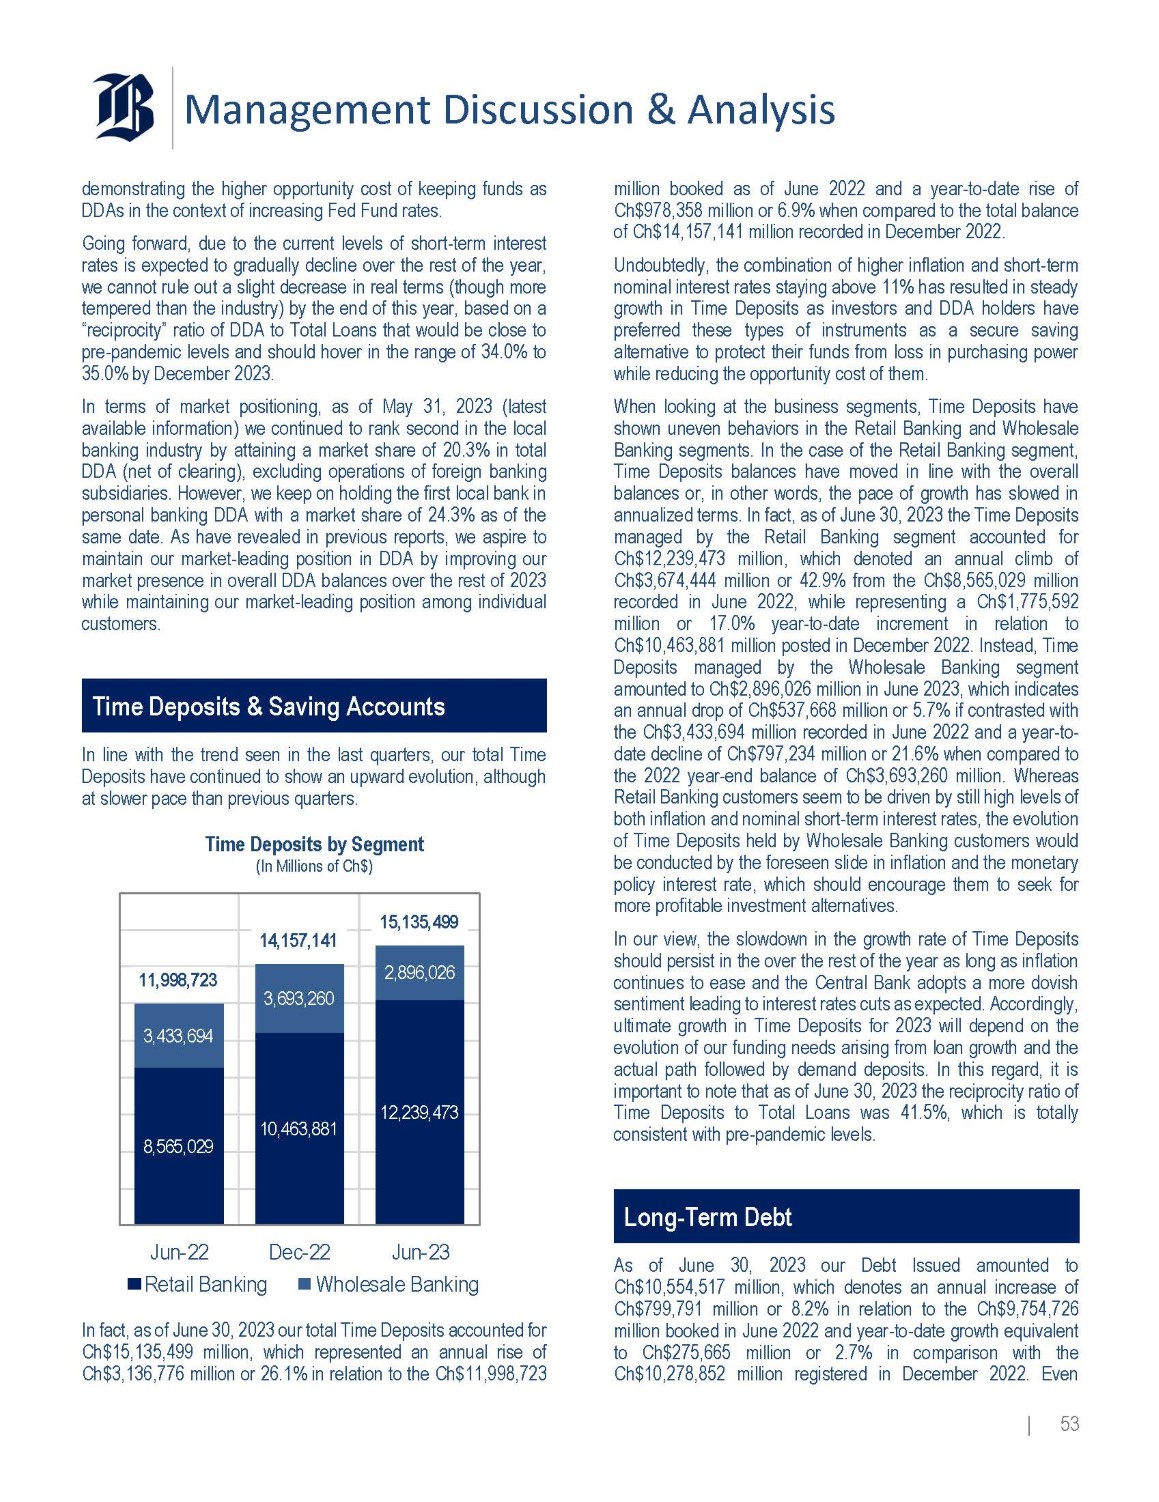
Management Discussion & Analysis demonstrating the higher opportunity cost of keeping funds as DDAs in the context of increasing Fed Fund rates . Going forward, due to the current levels of short - term interest rates is expected to gradually decline over the rest of the year, we cannot rule out a slight decrease in real terms (though more tempered than the industry) by the end of this year, based on a “reciprocity” ratio of DDA to Total Loans that would be close to pre - pandemic levels and should hover in the range of 34 . 0 % to 35 . 0 % by December 2023 . In terms of market positioning, as of May 31 , 2023 (latest available information) we continued to rank second in the local banking industry by attaining a market share of 20 . 3 % in total DDA (net of clearing), excluding operations of foreign banking subsidiaries . However, we keep on holding the first local bank in personal banking DDA with a market share of 24 . 3 % as of the same date . As have revealed in previous reports, we aspire to maintain our market - leading position in DDA by improving our market presence in overall DDA balances over the rest of 2023 while maintaining our market - leading position among individual customers . Time Deposits & Saving Accounts In line with the trend seen in the last quarters, our total Time Deposits have continued to show an upward evolution, although at slower pace than previous quarters . Time Deposits by Segment (In Millions of Ch$) 15,135,499 14,157,141 2,896,026 3,693,260 11,998,723 12,239,473 3,433,694 10,463,881 8,565,029 Jun - 22 Retail Banking Dec - 22 Jun - 23 Wholesale Banking | 53 In fact, as of June 30 , 2023 our total Time Deposits accounted for Ch $ 15 , 135 , 499 million, which represented an annual rise of Ch $ 3 , 136 , 776 million or 26 . 1 % in relation to the Ch $ 11 , 998 , 723 million booked as of June 2022 and a year - to - date rise of Ch $ 978 , 358 million or 6 . 9 % when compared to the total balance of Ch $ 14 , 157 , 141 million recorded in December 2022 . Undoubtedly, the combination of higher inflation and short - term nominal interest rates staying above 11 % has resulted in steady growth in Time Deposits as investors and DDA holders have preferred these types of instruments as a secure saving alternative to protect their funds from loss in purchasing power while reducing the opportunity cost of them . When looking at the business segments, Time Deposits have shown uneven behaviors in the Retail Banking and Wholesale Banking segments . In the case of the Retail Banking segment, Time Deposits balances have moved in line with the overall balances or, in other words, the pace of growth has slowed in annualized terms . In fact, as of June 30 , 2023 the Time Deposits managed by the Retail Banking segment accounted for Ch $ 12 , 239 , 473 million, which denoted an annual climb of Ch $ 3 , 674 , 444 million or 42 . 9 % from the Ch $ 8 , 565 , 029 million recorded in June 2022 , while representing a Ch $ 1 , 775 , 592 million or 17 . 0 % year - to - date increment in relation to Ch $ 10 , 463 , 881 million posted in December 2022 . Instead, Time Deposits managed by the Wholesale Banking segment amounted to Ch $ 2 , 896 , 026 million in June 2023 , which indicates an annual drop of Ch $ 537 , 668 million or 5 . 7 % if contrasted with the Ch $ 3 , 433 , 694 million recorded in June 2022 and a year - to - date decline of Ch $ 797 , 234 million or 21 . 6 % when compared to the 2022 year - end balance of Ch $ 3 , 693 , 260 million . Whereas Retail Banking customers seem to be driven by still high levels of both inflation and nominal short - term interest rates, the evolution of Time Deposits held by Wholesale Banking customers would be conducted by the foreseen slide in inflation and the monetary policy interest rate, which should encourage them to seek for more profitable investment alternatives . In our view, the slowdown in the growth rate of Time Deposits should persist in the over the rest of the year as long as inflation continues to ease and the Central Bank adopts a more dovish sentiment leading to interest rates cuts as expected . Accordingly, ultimate growth in Time Deposits for 2023 will depend on the evolution of our funding needs arising from loan growth and the actual path followed by demand deposits . In this regard, it is important to note that as of June 30 , 2023 the reciprocity ratio of Time Deposits to Total Loans was 41 . 5 % , which is totally consistent with pre - pandemic levels . Long - Term Debt As of June 30 , 2023 our Debt Issued amounted to Ch $ 10 , 554 , 517 million, which denotes an annual increase of Ch $ 799 , 791 million or 8 . 2 % in relation to the Ch $ 9 , 754 , 726 million booked in June 2022 and year - to - date growth equivalent to Ch $ 275 , 665 million or 2 . 7 % in comparison with the Ch $ 10 , 278 , 852 million registered in December 2022 . Even
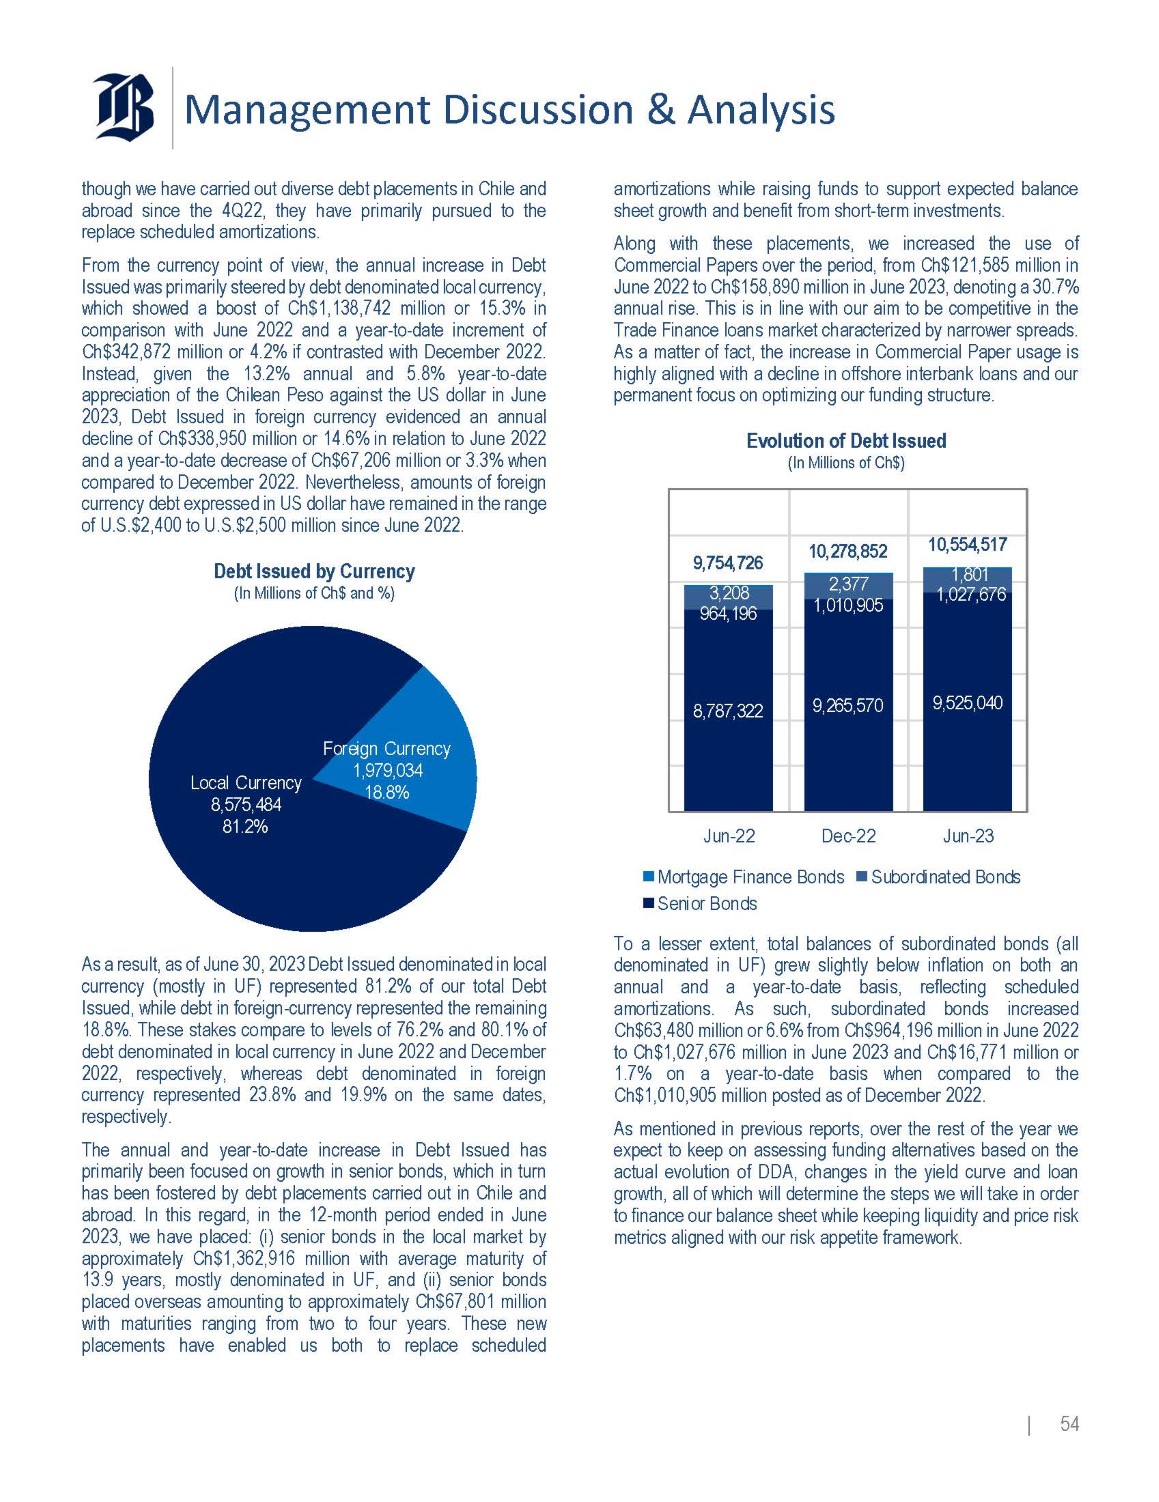
Management Discussion & Analysis though we have carried out diverse debt placements in Chile and abroad since the 4 Q 22 , they have primarily pursued to the replace scheduled amortizations . From the currency point of view, the annual increase in Debt Issued was primarily steered by debt denominated local currency, which showed a boost of Ch $ 1 , 138 , 742 million or 15 . 3 % in comparison with June 2022 and a year - to - date increment of Ch $ 342 , 872 million or 4 . 2 % if contrasted with December 2022 . Instead, given the 13 . 2 % annual and 5 . 8 % year - to - date appreciation of the Chilean Peso against the US dollar in June 2023 , Debt Issued in foreign currency evidenced an annual decline of Ch $ 338 , 950 million or 14 . 6 % in relation to June 2022 and a year - to - date decrease of Ch $ 67 , 206 million or 3 . 3 % when compared to December 2022 . Nevertheless, amounts of foreign currency debt expressed in US dollar have remained in the range of U . S . $ 2 , 400 to U . S . $ 2 , 500 million since June 2022 . Debt Issued by Currency (In Millions of Ch$ and %) Local Currency 8,575,484 81.2% Foreign Currency 1,979,034 18.8% As a result, as of June 30 , 2023 Debt Issued denominated in local currency (mostly in UF) represented 81 . 2 % of our total Debt Issued, while debt in foreign - currency represented the remaining 18 . 8 % . These stakes compare to levels of 76 . 2 % and 80 . 1 % of debt denominated in local currency in June 2022 and December 2022 , respectively, whereas debt denominated in foreign currency represented 23 . 8 % and 19 . 9 % on the same dates, respectively . The annual and year - to - date increase in Debt Issued has primarily been focused on growth in senior bonds, which in turn has been fostered by debt placements carried out in Chile and abroad . In this regard, in the 12 - month period ended in June 2023 , we have placed : (i) senior bonds in the local market by approximately Ch $ 1 , 362 , 916 million with average maturity of 13 . 9 years, mostly denominated in UF, and (ii) senior bonds placed overseas amounting to approximately Ch $ 67 , 801 million with maturities ranging from two to four years . These new placements have enabled us both to replace scheduled amortizations while raising funds to support expected balance sheet growth and benefit from short - term investments . Along with these placements, we increased the use of Commercial Papers over the period, from Ch $ 121 , 585 million in June 2022 to Ch $ 158 , 890 million in June 2023 , denoting a 30 . 7 % annual rise . This is in line with our aim to be competitive in the Trade Finance loans market characterized by narrower spreads . As a matter of fact, the increase in Commercial Paper usage is highly aligned with a decline in offshore interbank loans and our permanent focus on optimizing our funding structure . Evolution of Debt Issued (In Millions of Ch$) 10,554,517 10,278,852 9,754,726 1,801 1,027,676 2,377 3,208 9,525,040 1,010,905 9,265,570 964,196 8,787,322 Jun - 22 Dec - 22 Jun - 23 Mortgage Finance Bonds Senior Bonds Subordinated Bonds To a lesser extent, total balances of subordinated bonds (all denominated in UF) grew slightly below inflation on both an annual and a year - to - date basis, reflecting scheduled amortizations . As such, subordinated bonds increased Ch $ 63 , 480 million or 6 . 6 % from Ch $ 964 , 196 million in June 2022 to Ch $ 1 , 027 , 676 million in June 2023 and Ch $ 16 , 771 million or 1 . 7 % on a year - to - date basis when compared to the Ch $ 1 , 010 , 905 million posted as of December 2022 . As mentioned in previous reports, over the rest of the year we expect to keep on assessing funding alternatives based on the actual evolution of DDA, changes in the yield curve and loan growth, all of which will determine the steps we will take in order to finance our balance sheet while keeping liquidity and price risk metrics aligned with our risk appetite framework . | 54
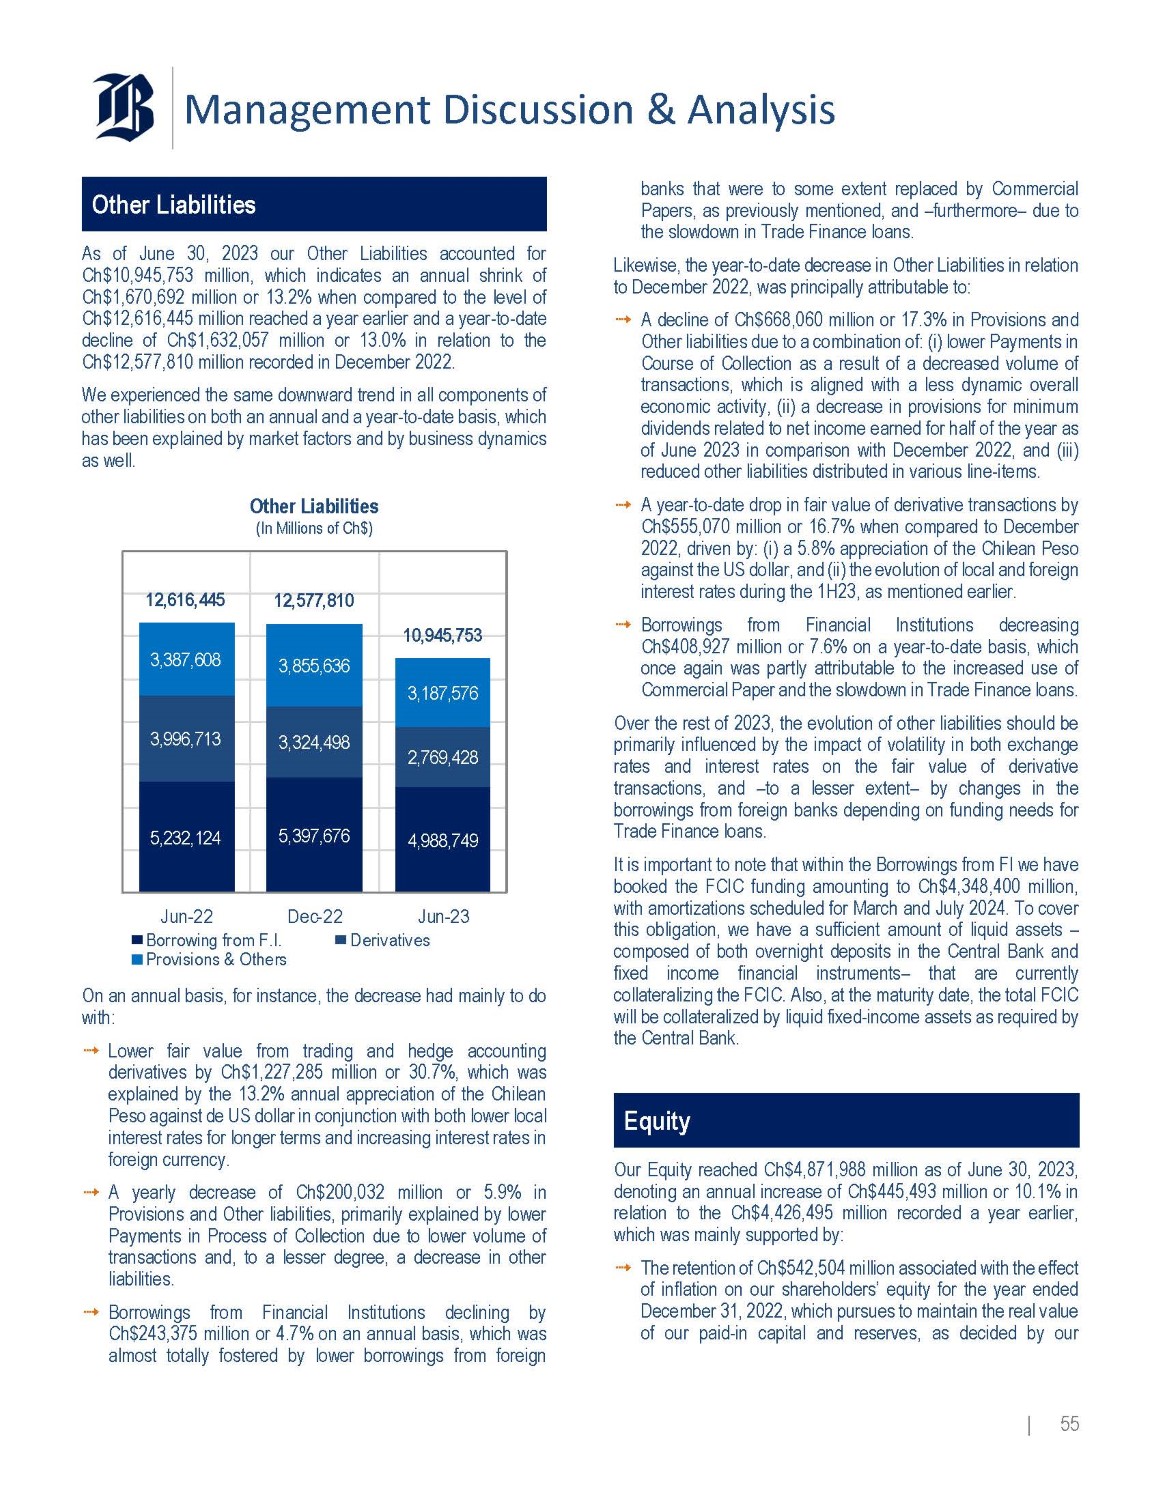
Management Discussion & Analysis Other Liabilities As of June 30 , 2023 our Other Liabilities accounted for Ch $ 10 , 945 , 753 million, which indicates an annual shrink of Ch $ 1 , 670 , 692 million or 13 . 2 % when compared to the level of Ch $ 12 , 616 , 445 million reached a year earlier and a year - to - date decline of Ch $ 1 , 632 , 057 million or 13 . 0 % in relation to the Ch $ 12 , 577 , 810 million recorded in December 2022 . We experienced the same downward trend in all components of other liabilities on both an annual and a year - to - date basis, which has been explained by market factors and by business dynamics as well . Other Liabilities (In Millions of Ch$) 10,945,753 12,577,810 12,616,445 3,855,636 3,387,608 3,187,576 3,996,713 3,324,498 2,769,428 4,988,749 5,397,676 5,232,124 Dec - 22 Jun - 22 Borrowing from F.I. Provisions & Othe rs Jun - 23 Derivatives On an annual basis, for instance, the decrease had mainly to do with: Lower fair value from trading and hedge accounting derivatives by Ch $ 1 , 227 , 285 million or 30 . 7 % , which was explained by the 13 . 2 % annual appreciation of the Chilean Peso against de US dollar in conjunction with both lower local interest rates for longer terms and increasing interest rates in foreign currency . A yearly decrease of Ch $ 200 , 032 million or 5 . 9 % in Provisions and Other liabilities, primarily explained by lower Payments in Process of Collection due to lower volume of transactions and, to a lesser degree, a decrease in other liabilities . Borrowings from Financial Institutions declining by Ch $ 243 , 375 million or 4 . 7 % on an annual basis, which was almost totally fostered by lower borrowings from foreign | 55 banks that were to some extent replaced by Commercial Papers, as previously mentioned, and – furthermore – due to the slowdown in Trade Finance loans . Likewise, the year - to - date decrease in Other Liabilities in relation to December 2022 , was principally attributable to : A decline of Ch $ 668 , 060 million or 17 . 3 % in Provisions and Other liabilities due to a combination of : (i) lower Payments in Course of Collection as a result of a decreased volume of transactions, which is aligned with a less dynamic overall economic activity, (ii) a decrease in provisions for minimum dividends related to net income earned for half of the year as of June 2023 in comparison with December 2022 , and (iii) reduced other liabilities distributed in various line - items . A year - to - date drop in fair value of derivative transactions by Ch $ 555 , 070 million or 16 . 7 % when compared to December 2022 , driven by : (i) a 5 . 8 % appreciation of the Chilean Peso against the US dollar, and (ii) the evolution of local and foreign interest rates during the 1 H 23 , as mentioned earlier . Borrowings from Financial Institutions decreasing Ch $ 408 , 927 million or 7 . 6 % on a year - to - date basis, which once again was partly attributable to the increased use of Commercial Paper and the slowdown in Trade Finance loans . Over the rest of 2023 , the evolution of other liabilities should be primarily influenced by the impact of volatility in both exchange rates and interest rates on the fair value of derivative transactions, and – to a lesser extent – by changes in the borrowings from foreign banks depending on funding needs for Trade Finance loans . It is important to note that within the Borrowings from FI we have booked the FCIC funding amounting to Ch $ 4 , 348 , 400 million, with amortizations scheduled for March and July 2024 . To cover this obligation, we have a sufficient amount of liquid assets – composed of both overnight deposits in the Central Bank and fixed income financial instruments – that are currently collateralizing the FCIC . Also, at the maturity date, the total FCIC will be collateralized by liquid fixed - income assets as required by the Central Bank . Equity Our Equity reached Ch $ 4 , 871 , 988 million as of June 30 , 2023 , denoting an annual increase of Ch $ 445 , 493 million or 10 . 1 % in relation to the Ch $ 4 , 426 , 495 million recorded a year earlier, which was mainly supported by : The retention of Ch $ 542 , 504 million associated with the effect of inflation on our shareholders’ equity for the year ended December 31 , 2022 , which pursues to maintain the real value of our paid - in capital and reserves, as decided by our
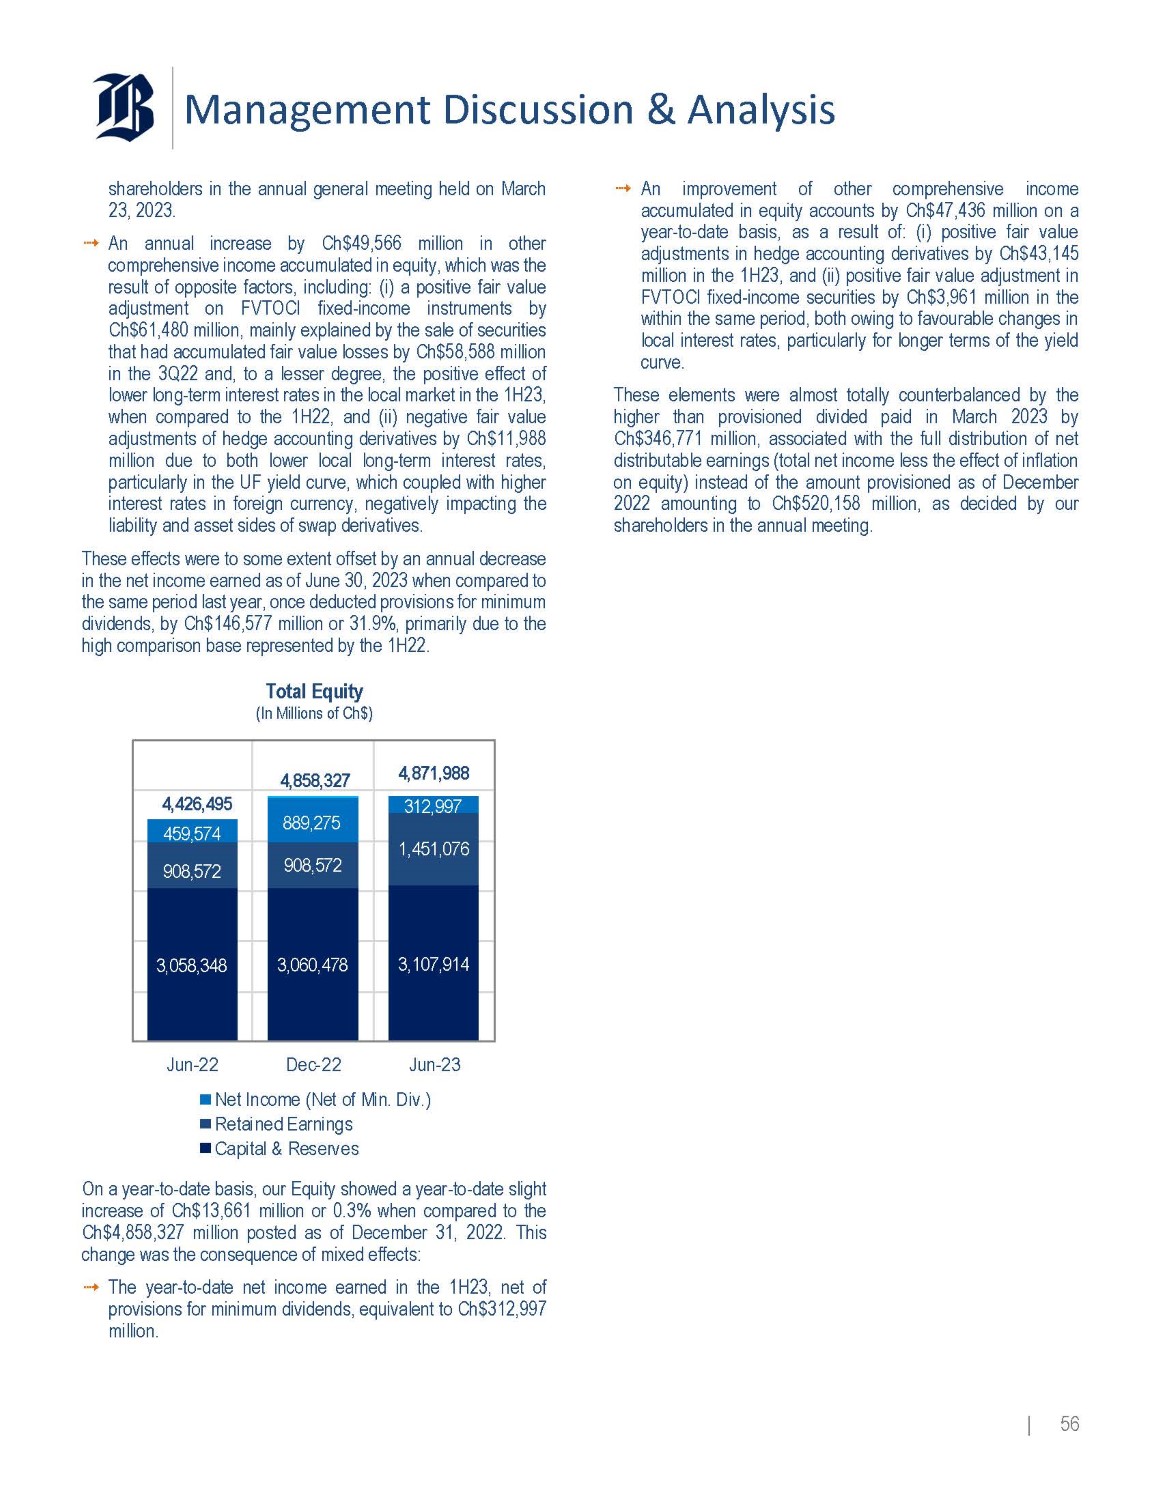
Management Discussion & Analysis shareholders in the annual general meeting held on March 23, 2023. An annual increase by Ch $ 49 , 566 million in other comprehensive income accumulated in equity, which was the result of opposite factors, including : (i) a positive fair value adjustment on FVTOCI fixed - income instruments by Ch $ 61 , 480 million, mainly explained by the sale of securities that had accumulated fair value losses by Ch $ 58 , 588 million in the 3 Q 22 and, to a lesser degree, the positive effect of lower long - term interest rates in the local market in the 1 H 23 , when compared to the 1 H 22 , and (ii) negative fair value adjustments of hedge accounting derivatives by Ch $ 11 , 988 million due to both lower local long - term interest rates, particularly in the UF yield curve, which coupled with higher interest rates in foreign currency, negatively impacting the liability and asset sides of swap derivatives . These effects were to some extent offset by an annual decrease in the net income earned as of June 30 , 2023 when compared to the same period last year, once deducted provisions for minimum dividends, by Ch $ 146 , 577 million or 31 . 9 % , primarily due to the high comparison base represented by the 1 H 22 . Total Equity (In Millions of Ch$) 4,871,988 4,858,327 312,997 889,275 4,426,495 1,451,076 459,574 908,572 908,572 3,107,914 3,060,478 3,058,348 Jun - 22 Dec - 22 Jun - 23 Net Income (Net of Min. Div.) Retained Earnings Capital & Reserves On a year - to - date basis, our Equity showed a year - to - date slight increase of Ch $ 13 , 661 million or 0 . 3 % when compared to the Ch $ 4 , 858 , 327 million posted as of December 31 , 2022 . This change was the consequence of mixed effects : The year - to - date net income earned in the 1 H 23 , net of provisions for minimum dividends, equivalent to Ch $ 312 , 997 million . | 56 An improvement of other comprehensive income accumulated in equity accounts by Ch $ 47 , 436 million on a year - to - date basis, as a result of : (i) positive fair value adjustments in hedge accounting derivatives by Ch $ 43 , 145 million in the 1 H 23 , and (ii) positive fair value adjustment in FVTOCI fixed - income securities by Ch $ 3 , 961 million in the within the same period, both owing to favourable changes in local interest rates, particularly for longer terms of the yield curve . These elements were almost totally counterbalanced by the higher than provisioned divided paid in March 2023 by Ch $ 346 , 771 million, associated with the full distribution of net distributable earnings (total net income less the effect of inflation on equity) instead of the amount provisioned as of December 2022 amounting to Ch $ 520 , 158 million, as decided by our shareholders in the annual meeting .
Risk & Capital Management Risk Management Approach Risk Management Principles Banco de Chile’s risk profile ensures that its business can sustainably grow and is aligned with its strategic objectives, in order to maximize value creation and guarantee its long - term solvency . Global risk management takes into consideration the business segments served by the bank, which is approached from an integrated and differentiated perspective . The bank's corporate governance relies on active participation by the board, in order to adequately manage risk, either directly or through committees composed of directors and senior management that have been described in the Corporate Governance section of this report . The board establishes the risk policies, the risk appetite framework, and the guidelines to develop, validate and monitor its models . It approves the provision models and annually issues an opinion on the adequacy of provisions . Management is responsible for establishing rules and procedures, and for controlling compliance with the board’s instructions . The bank has integrated its capital and liquidity planning process into its strategic planning, in line with the risks inherent to its business, the financial and competitive environment, its business strategy, corporate values, and its risk governance, management and control systems . Its capital planning process is aligned with the regulator’s requirements and incorporates Risk Weighted Asset calculations and stress tests for its credit, market and operational risks, and the integrated measurement of its financial and non - financial risks . The Wholesale Credit Risk Division, the Retail Credit Risk and Global Risk Control Division and the Cybersecurity Division jointly manage risk . They form the corporate risk governance structure, and their highly experienced and specialized teams, together with a robust regulatory framework, secure optimal and effective management of the matters they address . The first two divisions are responsible for credit risk during the loan origination, monitoring and recovery stages for these respective segments . The Wholesale Credit Risk Division has a Market Risk Area that is charged with measuring, limiting, controlling and reporting on market risk, as well as defining valuation and management standards for the bank’s assets and liabilities . | 57
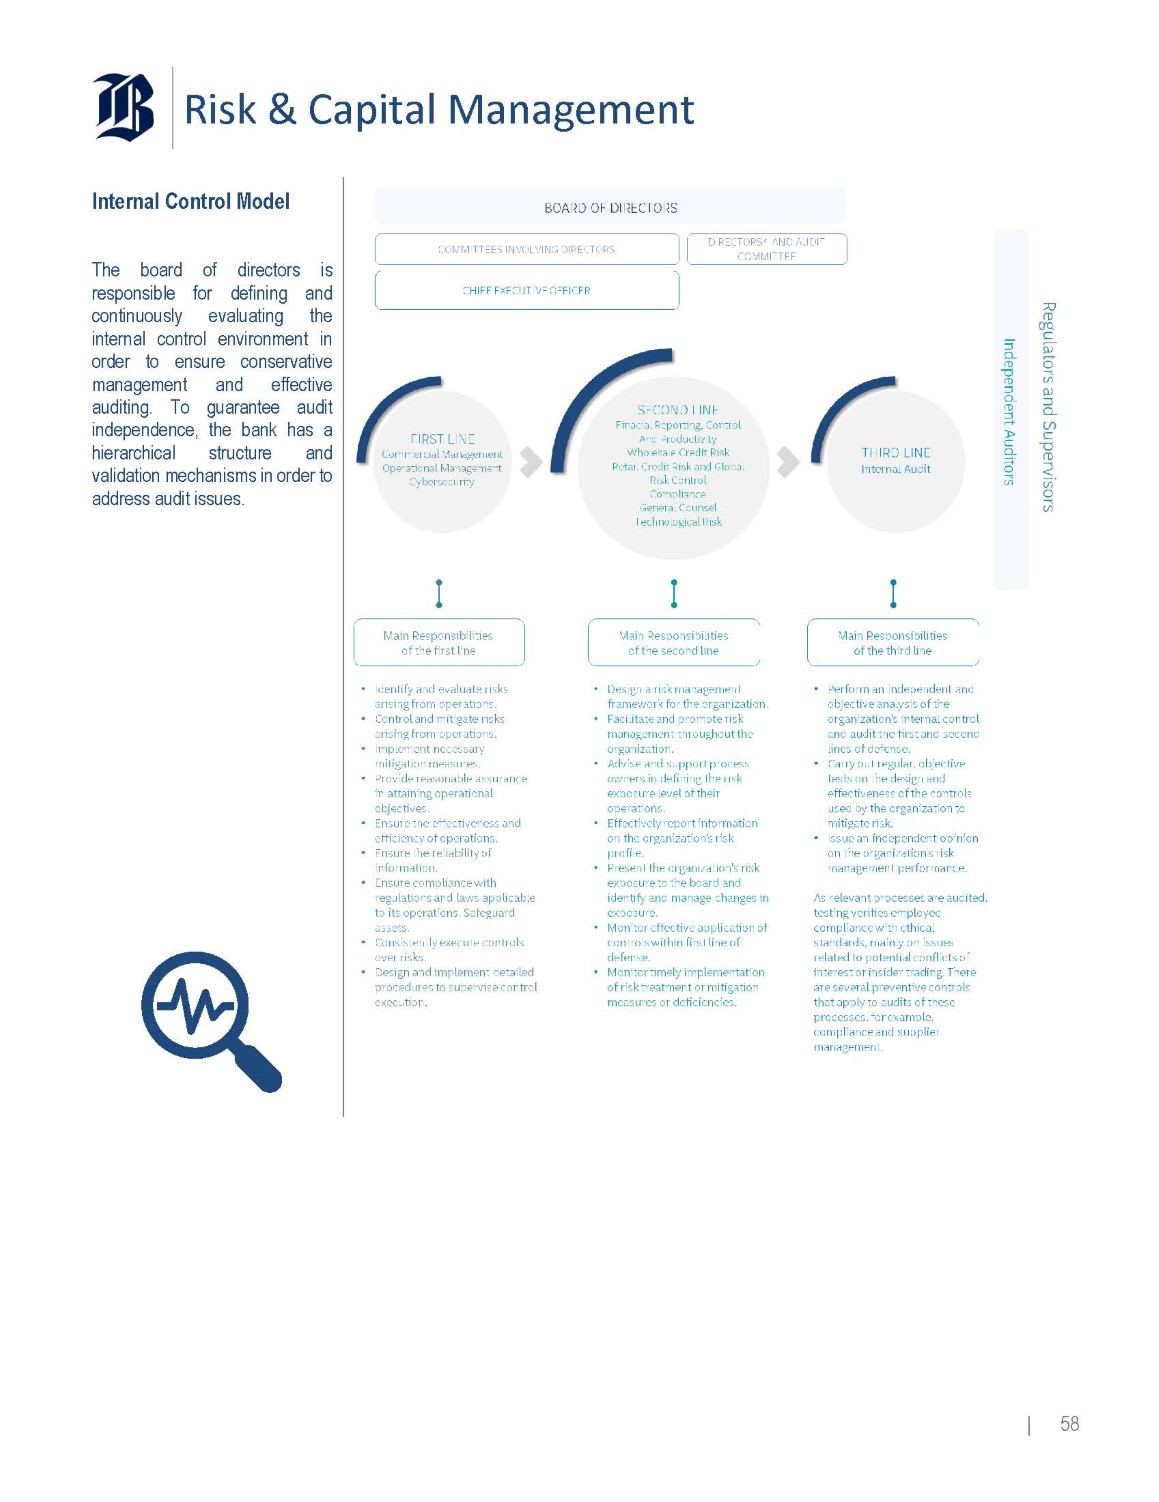
Risk & Capital Management Internal Control Model The board of directors is responsible for defining and continuously evaluating the internal control environment in order to ensure conservative management and effective auditing . To guarantee audit independence, the bank has a hierarchical structure and validation mechanisms in order to address audit issues . | 58
Risk & Capital Management The bank seeks an adequate risk - return and an appropriate risk balance, through careful credit risk management, which covers the loan origination, monitoring and recovery processes . It also continuously manages risk knowledge using an integral approach, in order to contribute to the business and anticipate threats that may damage its solvency or the quality of its loan portfolio, by developing a unique risk awareness culture throughout the corporation . This requires developing a risk management framework for the business segments served by the bank, responding to regulatory requirements and commercial dynamism, contributing to digital transformation, and contributing to the bank’s businesses from a risk management perspective . It adopts a portfolio perspective that efficiently and proactively manages, resolves and controls the business approval process . The bank integrates socio - environmental criteria into its evaluations for granting financing for domestic and regional projects that might generate such an impact, wherever executed . Projects must have all the permits, authorizations, licenses and studies required for their impacts in order to qualify for financing . For large customers, the bank also has specialized customer service units involved in the process of financing large - scale projects such as public works concessions that include building infrastructure and mining, power or real estate developments, all of which may have an environmental impact . Credit policies and processes are based on the following management principles, which use a specialized approach according to the characteristics of the bank’s markets and segments, and acknowledges their peculiarities : Perform a rigorous evaluation during the loan origination process Implement a continuous, robust portfolio monitoring process Develop credit risk modelling guidelines, covering regulatory and management aspects, for efficient decision making at each stage of the lending process. Implement a timely, flexible, efficient collections structure Efficiently manage teams, tools and information availability Our two credit risk divisions use these management principles to contribute to the business and anticipate threats that may affect solvency and portfolio quality, based on a segmentation by business, as follows : Retail Banking Segment Loan origination for these segments is mainly managed using risk evaluation scoring tools, supported by an appropriate credit attribution model, which is required to approve each transaction . These evaluations examine factors such as total borrowings, payment capacity and maximum acceptable exposure for the customer . Wholesale Banking Segment Origination management for this segment involves an individual assessment of the customer and if it belongs to a group of companies then this takes into consideration the bank’s relationship with the rest of the group . This individual assessment considers income - generating capacity, financial capacity with emphasis on solvency, exposure levels, industry variables, an evaluation of the partners and management and aspects particular to the transaction such as the financing structure, terms, products and any guarantees . Credit Risk Credit risk assesses the probability that the counterparty in a loan transaction does not meet its contractual obligation because of payment incapacity or financial insolvency, and that leads to a potential loan loss. | 59
Risk & Capital Management This risk is ruled by the Market Risk Management Policy, reviewed and approved at least annually by the Board, which establishes the main guidelines for measuring, limiting, reporting and controlling financial exposures and price risks generated by them . The measurement is carried out through the use of several internally - developed metrics and models for both the Trading and the Banking Book . In addition, the Bank reports standardized metrics to regulators according to their guidelines . Regarding internal tools designed for the Trading Book, the Bank measures financial exposures by means of sensitivities or greeks (calculated on an aggregate basis but also at a single market factor level or specific tenor points) and the risk of the entire portfolio by using the VaR model, which are daily reported, monitored and controlled against their limits by independent control functions . The Bank has also established internal metrics for price risk management in the Banking Book, defining limits and warning levels for interest rate exposures and interest rate risk, which are measured by using the IRE metric (Interest Rate Exposure) and EaR 12 M Model (Earnings at Risk in 12 months), respectively, both reported, monitored and controlled against their limits and triggers at least on a monthly basis . The internal governance framework establishes that the price risk appetite must be reviewed and approved by the Board at least annually, and it describes the escalation and remediation process in case exposure and risk levels are exceeded or breached . The Market Risk Management Policy also enforces to perform periodic stress testing of the Trading and Banking Book (including separate testing for the Fair Value Through Other Comprehensive Income portfolio), which are essential to measure and control the maximum price risk appetite defined by the Board . Finally, an appropriate set of information is reported to the Asset and Liabilities Committee on a monthly basis and to the Board on a quarterly basis . Market Risk Market risk can be defined as the risk of losses in the Trading and / or the Banking Book, arising from adverse movements in market factors. The Bank has a Liquidity Risk Management Policy, reviewed and approved at least annually by the Board, which establishes the main guidelines for measuring, limiting, reporting and controlling liquidity risk . Funding liquidity is measured, reported and controlled by means of using internal metrics, including the Market Access Report (MAR) . MAR limits are established to ensure that funding can be obtained and / or renewed in professional markets under normal business conditions, in different time horizons and currencies . The Bank also sets a minimum amount of highly liquid assets (or liquidity buffer), and a limit of the cross - currency funding position . Concentration ratios and other complementary metrics are also periodically measured, reported and controlled against warning levels . In addition, the Bank reports standardized metrics to regulators in accordance with their guidelines, such as the Liquidity Coverage Ratio (LCR) and the Net Stable Financing Ratio (NSFR) . It also continuously monitors and tracks market variables and/or material events that could affect our liquidity position . In accordance with its Liquidity Risk Management Policy, the Bank performs regular stress testing in order to quantify its cash needs in the event of adverse scenarios of varying severity, which are contrasted against potentially available action plans detailed within the Liquidity Contingency Plan . These results are daily reported, monitored and controlled based on the maximum liquidity risk appetite defined by the Board . On the other hand, trading liquidity is assured by using limits with certain specific maturities based on the amounts that are normally traded in professional markets for interest rate exposure generated by debt instruments and derivatives . The same process is used to limit the Bank's overall exposure to each currency and to exchange rate volatility with varying maturities . These internal and regulatory metrics are regularly reported to the business units responsible for managing liquidity risk . Similarly, senior management is immediately notified if the limits are exceeded or triggers are breached, including, if necessary, monitoring of corrective action plans . Finally, the general status of liquidity risk is reported to the Asset and Liabilities Committee on a monthly basis and to the Board on a quarterly basis . Liquidity Risk Liquidity risk can arise either due to a reduction in the bank’s funding capacity (funding liquidity risk) or a reduction in the traded value of its assets that can be liquidated or its market factors from derivatives held in its portfolios (transaction or trading liquidity risk). | 60
Risk & Capital Management Operational risk is inherent to all activities, products and systems, as well as strategic, business and support processes throughout the organization . All bank employees are appropriately responsible for the management and control of operational risks inherent to their duties, since these risks may result in direct or indirect financial losses . The bank controls and manages operational risk by developing a regulatory and governance framework adapted to the complexity of its business . The Operational Risk Policy defines a comprehensive management framework that includes identifying, evaluating, controlling, mitigating, monitoring and reporting these risks . This requires executing several processes as follows : Process Assessment Supplier Management Fraud Management Operational Event and Loss Management Operational Risk Assessment for Projects Control Testing Risk Appetite Profile and Framework Self - Assessment Matrix Relations with External Entities and Corporate Training Plan Operational Risk Operational risk is the risk of loss resulting from deficiencies or failures in internal processes, staff or systems, or from external events. This definition includes legal risks and excludes strategic and reputation risks. Being prepared to face any emergency is key to providing exceptional services to our customers . Therefore, we have developed a robust, consistent Business Continuity Plan to safeguard the bank and its subsidiaries . The objective of the plan is to establish general guidelines for ensuring the safety of our employees, protecting the organization's capital from catastrophic events, maintaining and updating documentation, and conducting training and testing . To comply with these guidelines, the bank has developed a strategy to meet this objective that covers the following areas: Document Management Business Continuity Testing Crisis Management Critical Supplier Management Management of Alternative Sites Relationship with Subsidiaries and External Organizations Continuous Improvement Training Business Continuity Different situations that could affect the business continuity of the organization or the country, which requires to be constantly prepared to keep operating the products and services that are critical to its customers. | 61
Risk & Capital Management Society is increasingly digitalized, so customer privacy and cybersecurity risk management is a priority for Banco de Chile . Therefore, the bank has developed a Strategic Cybersecurity Plan, which is aligned with the bank's business strategy . The main objectives of this plan are to protect customer and employee data, safeguard the bank's data, manage technological, cybersecurity and data security risks, and strengthen the risk prevention culture . This plan complies with the appropriate regulations, which include the Personal Data Protection Law 21 , 096 , the Protection of Privacy Law 19 , 628 and the provisions published in the Updated Compilation of Rules (RAN) issued by the Financial Market Commission (CMF) . This plan has been approved by senior management, who regularly receive associated progress reports . Data security and cybersecurity policies at Banco de Chile establish guidelines regarding the responsibility for and protection of data and its associated risk management, based on both regulatory aspects and international standards . These policies are reviewed annually and apply to employees, external personnel, suppliers and service subcontractors who enter its facilities or have access to bank and subsidiary data . The controls that protect this information and IT assets are defined by regulations, processes and the bank’s internal procedures . Technological Risk, Cybersecurity and Data Protection Banco de Chile knows that sound ethical management is essential for its industry leading position . Therefore, the bank has diverse protocols, systems and models to ensure ethical behavior of all its employees . The Code of Conduct is the key guideline and essential component of the bank's corporate ethics . It contains the general principles and instructions that guide the ethical - professional conduct of the employees, directors and board advisors . The purpose of the code is to safeguard the fundamental values to properly conduct the bank's business, in accordance with the bank's corporate philosophy . The Ethics Committee is responsible for overseeing its implementation within the bank . Preventing corruption and the use of the bank and its subsidiaries to engage in unlawful practices has been a concern over the last few decades for Banco de Chile . Awareness - raising measures and controls have been intensified during 2022 , in order to prevent this kind of behavior . The bank has approved a Code of Conduct, a Prevention of Dishonest Practices Policy and a Handling Conflicts of Interest Policy, which describe the main roles and responsibilities to avoid that anything may be interpreted as a violation of ethical conduct or imply the risk of corruption or bribery . The Compliance Division by means of its Regulatory Compliance Area and the Ethics Committee are responsible for ensuring compliance with the conduct described in these policies . Conduct Risk and Anti - Money Laundering Model Risk and Internal Control Its purpose is to manage the risks associated with models and their processes, so it relies on the model validation, model risk management and internal control functions . Model validation is responsible for performing an independent review of risk models, including risk - weighted assets and stress testing, during their construction and implementation stages . It validates compliance with board - approved guidelines and addresses aspects such as governance, data quality, modeling techniques, methodological and parametric implementation analysis and documentation . The results of these reviews are submitted to the respective committees . Model risk management is responsible for monitoring models and ensuring that they fulfill their life cycle status . The Model Risk Management Committee was created in July 2023 and is composed of members of the Bank’ senior management . | 62
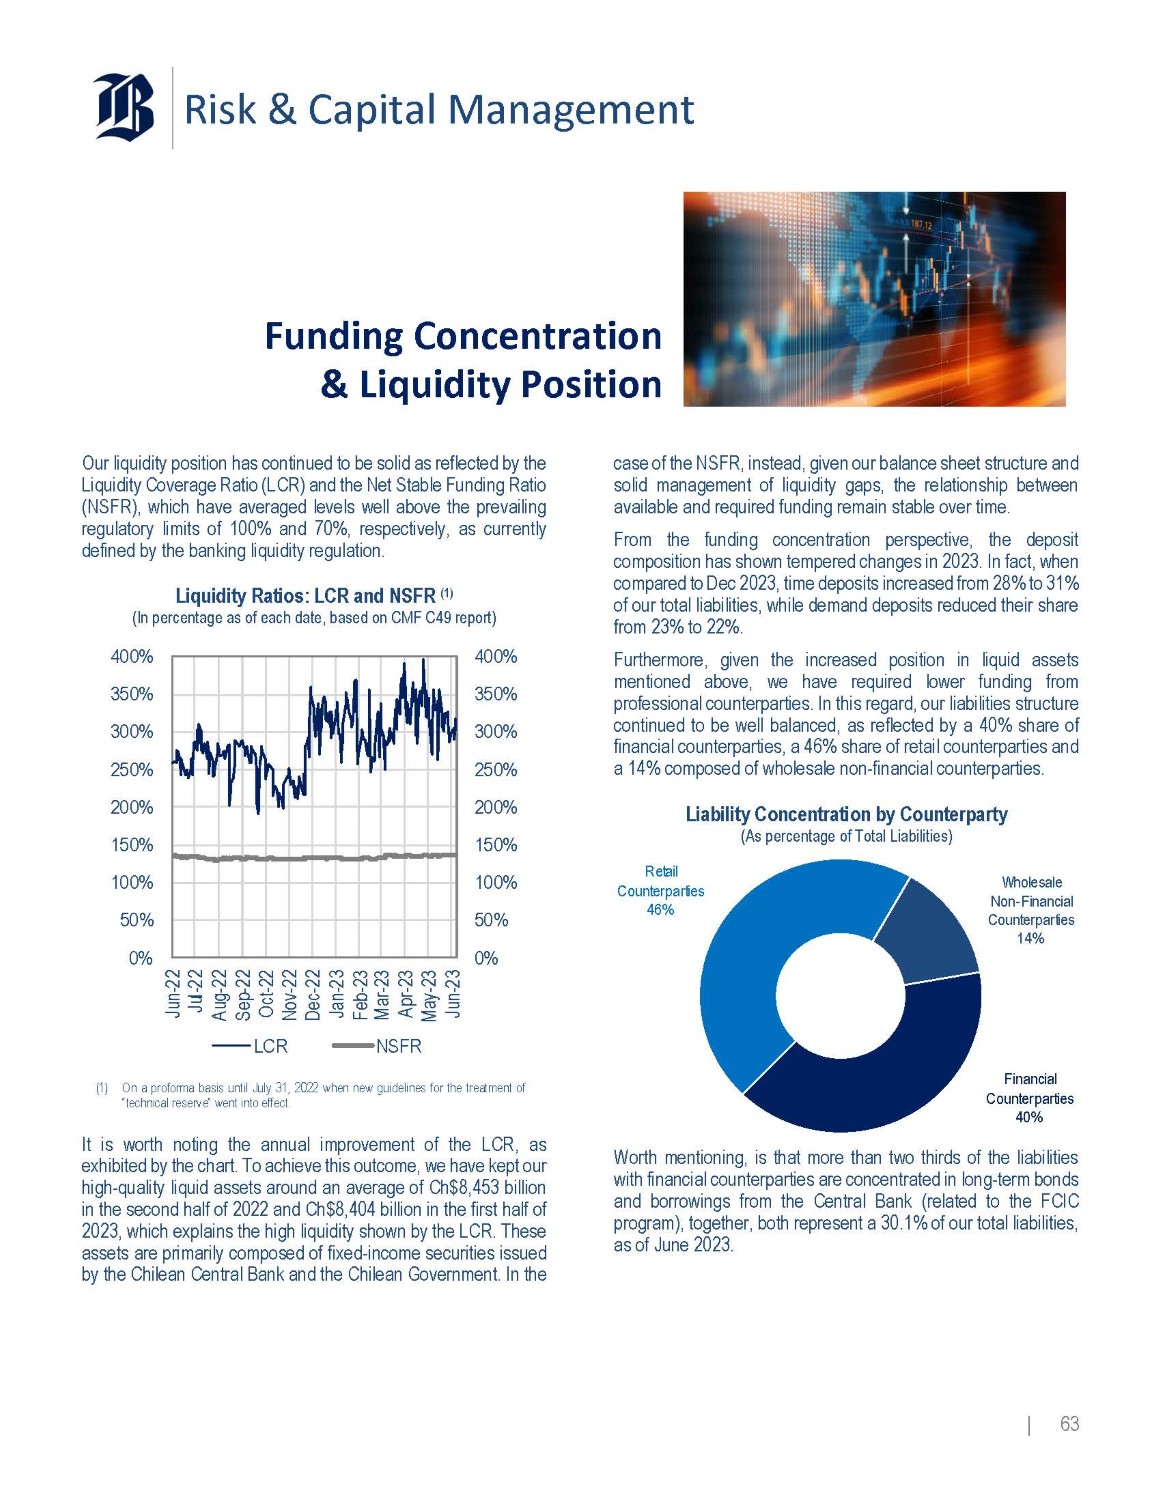
Risk & Capital Management Funding Concentration & Liquidity Position Our liquidity position has continued to be solid as reflected by the Liquidity Coverage Ratio (LCR) and the Net Stable Funding Ratio (NSFR), which have averaged levels well above the prevailing regulatory limits of 100 % and 70 % , respectively, as currently defined by the banking liquidity regulation . Liquidity Ratios: LCR and NSFR (1) (In percentage as of each date, based on CMF C49 report) 400% 350% 300% 250% 200% 150% 100% 50% 0% 400% 350% 300% 250% 200% 150% 100% 50% 0% Jun - 22 Jul - 22 Aug - 22 Sep - 22 Oct - 22 Nov - 22 Dec - 22 Jan - 23 Feb - 23 Mar - 23 Apr - 23 May - 23 Jun - 23 LCR NSFR (1) On a proforma basis until July 31, 2022 when new guidelines for the treatment of “technical reserve” went into effect. It is worth noting the annual improvement of the LCR, as exhibited by the chart . To achieve this outcome, we have kept our high - quality liquid assets around an average of Ch $ 8 , 453 billion in the second half of 2022 and Ch $ 8 , 404 billion in the first half of 2023 , which explains the high liquidity shown by the LCR . These assets are primarily composed of fixed - income securities issued by the Chilean Central Bank and the Chilean Government . In the case of the NSFR, instead, given our balance sheet structure and solid management of liquidity gaps, the relationship between available and required funding remain stable over time . From the funding concentration perspective, the deposit composition has shown tempered changes in 2023 . In fact, when compared to Dec 2023 , time deposits increased from 28 % to 31 % of our total liabilities, while demand deposits reduced their share from 23 % to 22 % . Furthermore, given the increased position in liquid assets mentioned above, we have required lower funding from professional counterparties . In this regard, our liabilities structure continued to be well balanced, as reflected by a 40 % share of financial counterparties, a 46 % share of retail counterparties and a 14 % composed of wholesale non - financial counterparties . Liability Concentration by Counterparty (As percentage of Total Liabilities) Financial Counterparties 40% Retail Counterparties 46% Wholesale Non - Financial Counterparties 14% Worth mentioning, is that more than two thirds of the liabilities with financial counterparties are concentrated in long - term bonds and borrowings from the Central Bank (related to the FCIC program), together, both represent a 30 . 1 % of our total liabilities, as of June 2023 . | 63
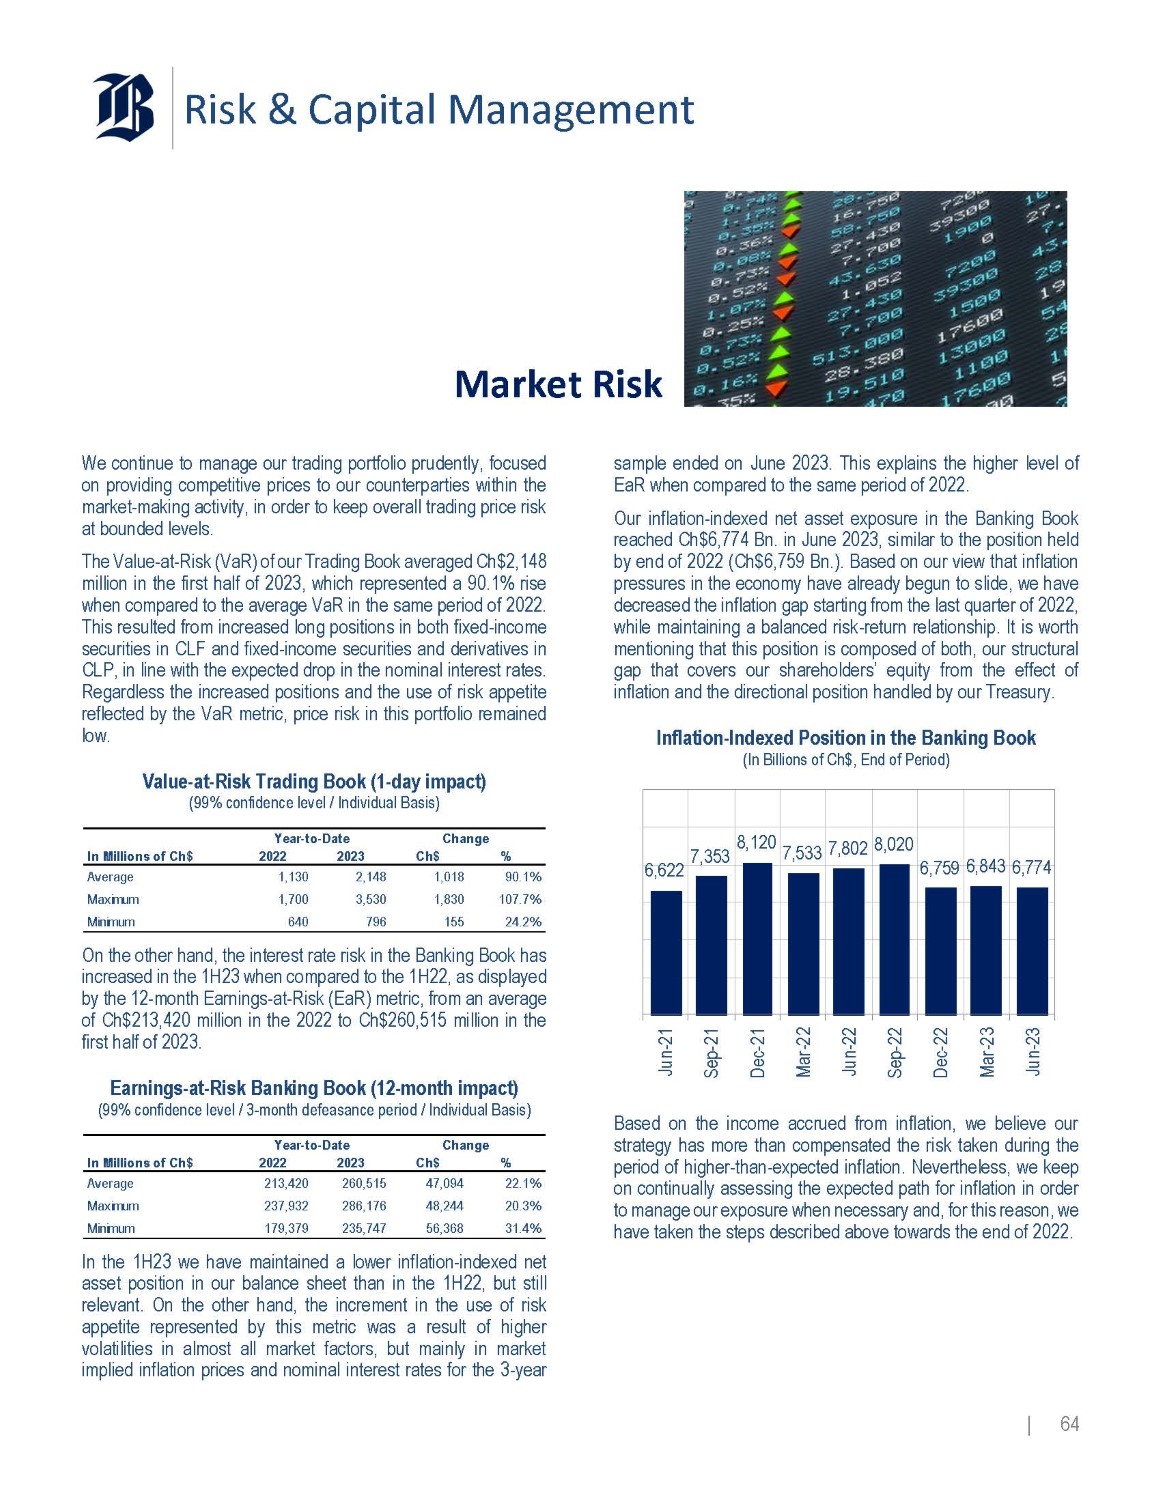
Risk & Capital Management Market Risk We continue to manage our trading portfolio prudently, focused on providing competitive prices to our counterparties within the market - making activity, in order to keep overall trading price risk at bounded levels . The Value - at - Risk (VaR) of our Trading Book averaged Ch $ 2 , 148 million in the first half of 2023 , which represented a 90 . 1 % rise when compared to the average VaR in the same period of 2022 . This resulted from increased long positions in both fixed - income securities in CLF and fixed - income securities and derivatives in CLP, in line with the expected drop in the nominal interest rates . Regardless the increased positions and the use of risk appetite reflected by the VaR metric, price risk in this portfolio remained low . % Ch$ 2023 2022 In Millions of Ch$ 90.1% 1,018 2,148 1,130 Average 107.7% 1,830 3,530 1,700 Maximum 24.2% 155 796 640 Minimum Value - at - Risk Trading Book (1 - day impact) (99% confidence level / Individual Basis) Year - to - Date Change On the other hand, the interest rate risk in the Banking Book has increased in the 1 H 23 when compared to the 1 H 22 , as displayed by the 12 - month Earnings - at - Risk (EaR) metric, from an average of Ch $ 213 , 420 million in the 2022 to Ch $ 260 , 515 million in the first half of 2023 . % Ch$ 2023 2022 In Millions of Ch$ 22.1% 47,094 260,515 213,420 Average 20.3% 48,244 286,176 237,932 Maximum 31.4% 56,368 235,747 179,379 Minimum Earnings - at - Risk Banking Book (12 - month impact) (99% confidence level / 3 - month defeasance period / Individual Basis) Year - to - Date Change In the 1 H 23 we have maintained a lower inflation - indexed net asset position in our balance sheet than in the 1 H 22 , but still relevant . On the other hand, the increment in the use of risk appetite represented by this metric was a result of higher volatilities in almost all market factors, but mainly in market implied inflation prices and nominal interest rates for the 3 - year sample ended on June 2023 . This explains the higher level of EaR when compared to the same period of 2022 . Our inflation - indexed net asset exposure in the Banking Book reached Ch $ 6 , 774 Bn . in June 2023 , similar to the position held by end of 2022 (Ch $ 6 , 759 Bn . ) . Based on our view that inflation pressures in the economy have already begun to slide, we have decreased the inflation gap starting from the last quarter of 2022 , while maintaining a balanced risk - return relationship . It is worth mentioning that this position is composed of both, our structural gap that covers our shareholders’ equity from the effect of inflation and the directional position handled by our Treasury . Inflation - Indexed Position in the Banking Book (In Billions of Ch$, End of Period) 6,622 7,353 8,120 7,533 7,802 8,020 6,759 6,843 6,774 Jun - 21 Sep - 21 Dec - 21 Mar - 22 Jun - 22 Sep - 22 Dec - 22 Mar - 23 Jun - 23 Based on the income accrued from inflation, we believe our strategy has more than compensated the risk taken during the period of higher - than - expected inflation . Nevertheless, we keep on continually assessing the expected path for inflation in order to manage our exposure when necessary and, for this reason, we have taken the steps described above towards the end of 2022 . | 64
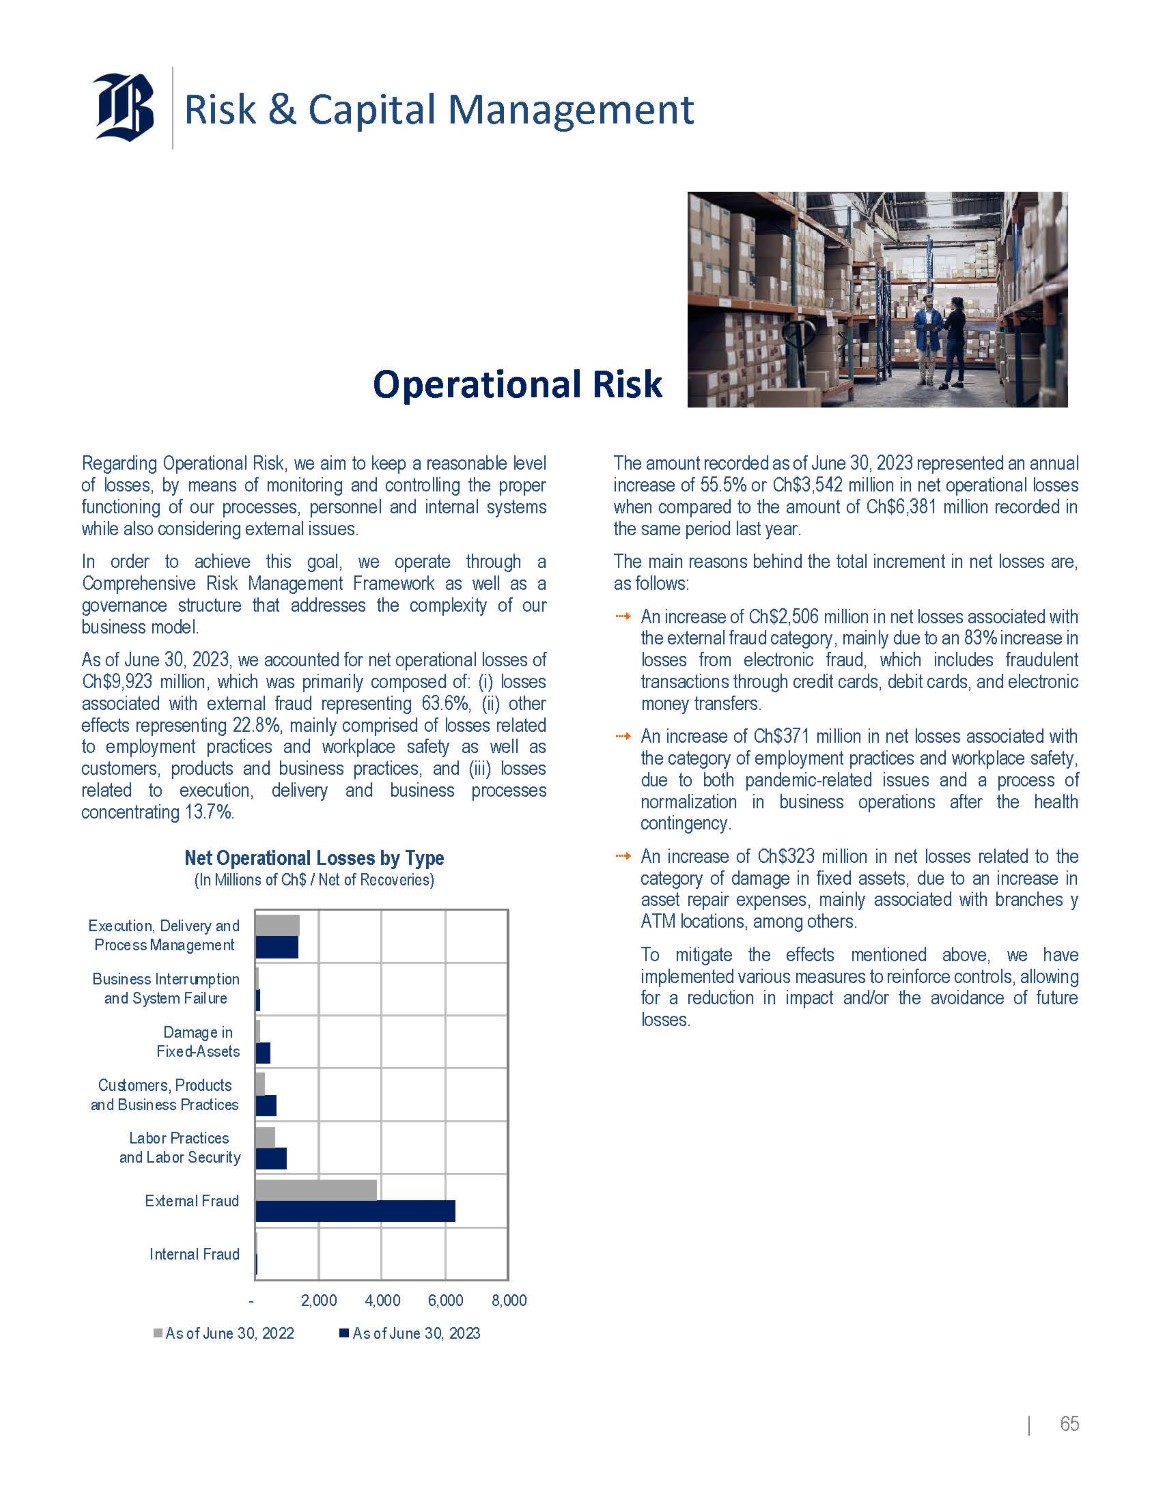
Risk & Capital Management Operational Risk Regarding Operational Risk, we aim to keep a reasonable level of losses, by means of monitoring and controlling the proper functioning of our processes, personnel and internal systems while also considering external issues . In order to achieve this goal, we operate through a Comprehensive Risk Management Framework as well as a governance structure that addresses the complexity of our business model . As of June 30 , 2023 , we accounted for net operational losses of Ch $ 9 , 923 million, which was primarily composed of : (i) losses associated with external fraud representing 63 . 6 % , (ii) other effects representing 22 . 8 % , mainly comprised of losses related to employment practices and workplace safety as well as customers, products and business practices, and (iii) losses related to execution, delivery and business processes concentrating 13 . 7 % . Net Operational Losses by Type (In Millions of Ch$ / Net of Recoveries) Execution, Delivery and Process Management Business Interrumption and System Failure Damage in Fixed - Assets Customers, Products and Business Practices Labor Practices and Labor Security External Fraud Internal Fraud As of June 30, 2022 - 2,000 4,000 6,000 8,000 As of June 30, 2023 The amount recorded as of June 30 , 2023 represented an annual increase of 55 . 5 % or Ch $ 3 , 542 million in net operational losses when compared to the amount of Ch $ 6 , 381 million recorded in the same period last year . The main reasons behind the total increment in net losses are, as follows : An increase of Ch $ 2 , 506 million in net losses associated with the external fraud category, mainly due to an 83 % increase in losses from electronic fraud, which includes fraudulent transactions through credit cards, debit cards, and electronic money transfers . An increase of Ch $ 371 million in net losses associated with the category of employment practices and workplace safety, due to both pandemic - related issues and a process of normalization in business operations after the health contingency . An increase of Ch $ 323 million in net losses related to the category of damage in fixed assets, due to an increase in asset repair expenses, mainly associated with branches y ATM locations, among others . To mitigate the effects mentioned above, we have implemented various measures to reinforce controls, allowing for a reduction in impact and/or the avoidance of future losses . | 65
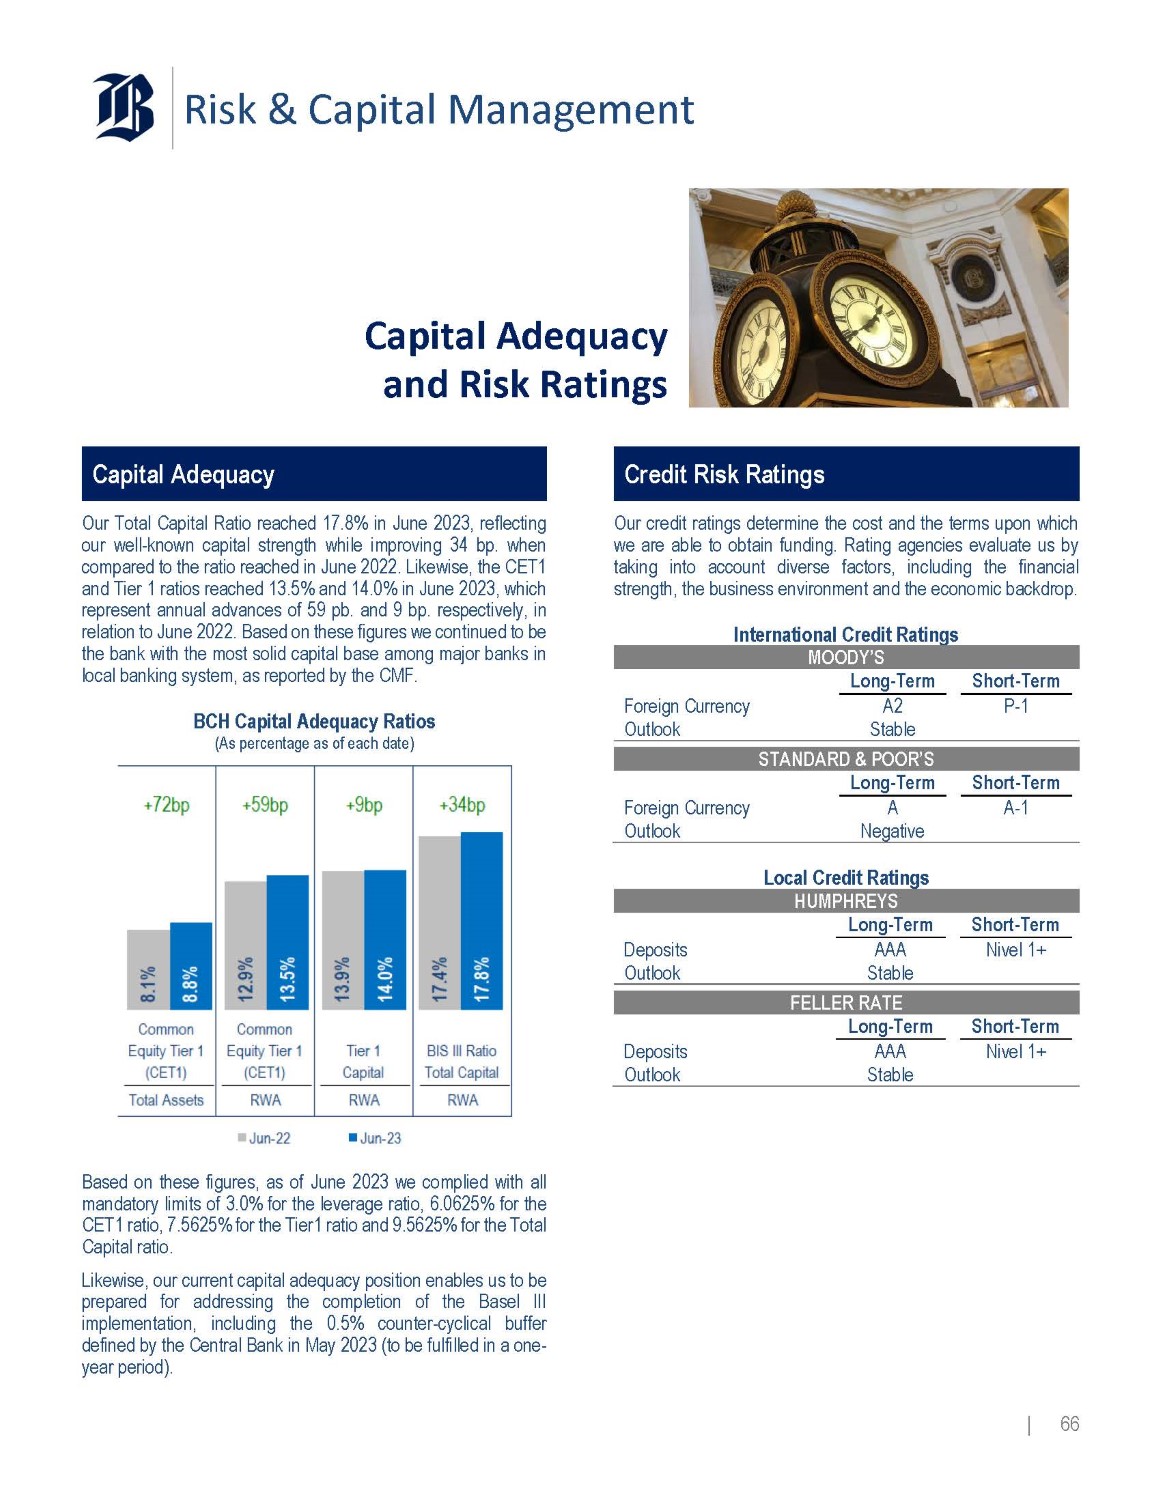
Risk & Capital Management Capital Adequacy and Risk Ratings Capital Adequacy Our Total Capital Ratio reached 17 . 8 % in June 2023 , reflecting our well - known capital strength while improving 34 bp . when compared to the ratio reached in June 2022 . Likewise, the CET 1 and Tier 1 ratios reached 13 . 5 % and 14 . 0 % in June 2023 , which represent annual advances of 59 pb . and 9 bp . respectively, in relation to June 2022 . Based on these figures we continued to be the bank with the most solid capital base among major banks in local banking system, as reported by the CMF . BCH Capital Adequacy Ratios (As percentage as of each date) Based on these figures, as of June 2023 we complied with all mandatory limits of 3 . 0 % for the leverage ratio, 6 . 0625 % for the CET 1 ratio, 7 . 5625 % for the Tier 1 ratio and 9 . 5625 % for the Total Capital ratio . Likewise, our current capital adequacy position enables us to be prepared for addressing the completion of the Basel III implementation, including the 0 . 5 % counter - cyclical buffer defined by the Central Bank in May 2023 (to be fulfilled in a one - year period) . Credit Risk Ratings Our credit ratings determine the cost and the terms upon which we are able to obtain funding . Rating agencies evaluate us by taking into account diverse factors, including the financial strength, the business environment and the economic backdrop . International Credit Ratings ODY’S MO Short - Term Long - Term P - 1 A2 Foreign Currency Stable Outlook STANDARD & POOR’S Short - Term Long - Term A - 1 A Foreign Currency Negative Outlook Local Credit Ratings HREYS HUMP Short - Term Long - Term Nivel 1+ AAA Deposits Stable Outlook RATE FELLER Short - Term Long - Term Nivel 1+ AAA Deposits Stable Outlook | 66
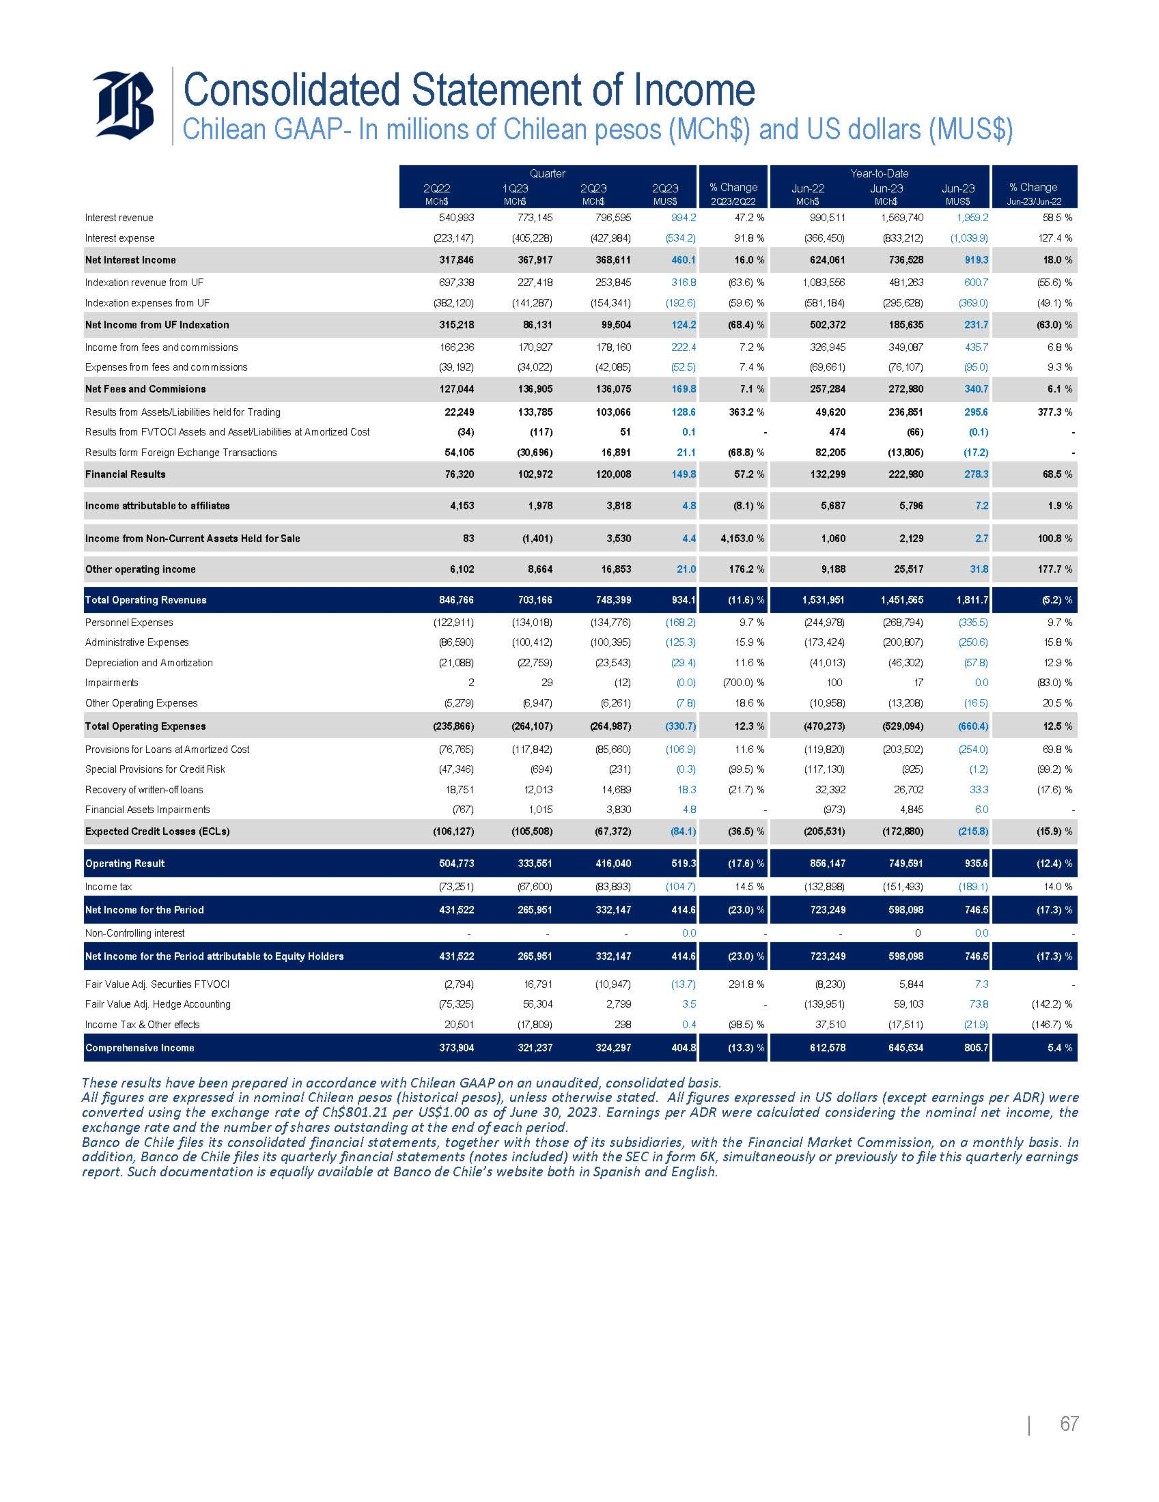
Consolidated Statement of Income Chilean GAAP - In millions of Chilean pesos (MCh$) and US dollars (MUS$) Year - to - Date Quarter % Change Jun - 23/Jun - 22 Jun - 23 MUS$ Jun - 23 MCh$ Jun - 22 MCh$ % Change 2Q23/2Q22 2Q23 MUS$ 2Q23 MCh$ 1Q23 MCh$ 2Q22 MCh$ 58.5 % 1,959.2 1,569,740 990,511 47.2 % 994.2 796,595 773,145 540,993 Interest revenue 127.4 % (1,039.9) (833,212) (366,450) 91.8 % (534.2) (427,984) (405,228) (223,147) Interest expense 18.0 % 919.3 736,528 624,061 16.0 % 460.1 368,611 367,917 317,846 Net Interest Income (55.6) % 600.7 481,263 1,083,556 (63.6) % 316.8 253,845 227,418 697,338 Indexation revenue from UF (49.1) % (369.0) (295,628) (581,184) (59.6) % (192.6) (154,341) (141,287) (382,120) Indexation expenses from UF (63.0) % 231.7 185,635 502,372 (68.4) % 124.2 99,504 86,131 315,218 Net Income from UF Indexation 6.8 % 435.7 349,087 326,945 7.2 % 222.4 178,160 170,927 166,236 Incom e from fees and com missions 9.3 % (95.0) (76,107) (69,661) 7.4 % (52.5) (42,085) (34,022) (39,192) Expenses from fees and com missions 6.1 % 340.7 272,980 257,284 7.1 % 169.8 136,075 136,905 127,044 Net Fees and Commisions 377.3 % 295.6 236,851 49,620 363.2 % 128.6 103,066 133,785 22,249 Results from Assets/Liabilities held for Trading - (0.1) (66) 474 - 0.1 51 (117) (34) Results from FVTOCI Assets and Asset/Liabilities at Amortized Cost - (17.2) (13,805) 82,205 (68.8) % 21.1 16,891 (30,696) 54,105 Results form Foreign Exchange Transactions 68.5 % 278.3 222,980 132,299 57.2 % 149.8 120,008 102,972 76,320 Financial Results 1.9 % 7.2 5,796 5,687 (8.1) % 4.8 3,818 1,978 4,153 Income attributable to affiliates 100.8 % 2.7 2,129 1,060 4,153.0 % 4.4 3,530 (1,401) 83 Income from Non - Current Assets Held for Sale 177.7 % 31.8 25,517 9,188 176.2 % 21.0 16,853 8,664 6,102 Other operating income (5.2) % 1,811.7 1,451,565 1,531,951 (11.6) % 934.1 748,399 703,166 846,766 Total Operating Revenues 9.7 % (335.5) (268,794) (244,978) 9.7 % (168.2) (134,776) (134,018) (122,911) Personnel Expenses 15.8 % (250.6) (200,807) (173,424) 15.9 % (125.3) (100,395) (100,412) (86,590) Administrative Expenses 12.9 % (57.8) (46,302) (41,013) 11.6 % (29.4) (23,543) (22,759) (21,088) Depreciation and Amortization (83.0) % 0.0 17 100 (700.0) % (0.0) (12) 29 2 Impairments 20.5 % (16.5) (13,208) (10,958) 18.6 % (7.8) (6,261) (6,947) (5,279) Other Operating Expenses 12.5 % (660.4) (529,094) (470,273) 12.3 % (330.7) (264,987) (264,107) (235,866) Total Operating Expenses 69.8 % (254.0) (203,502) (119,820) 11.6 % (106.9) (85,660) (117,842) (76,765) Provisions for Loans at Amortized Cost (99.2) % (1.2) (925) (117,130) (99.5) % (0.3) (231) (694) (47,346) Special Provisions for Credit Risk (17.6) % 33.3 26,702 32,392 (21.7) % 18.3 14,689 12,013 18,751 Recovery of written - off loans - 6.0 4,845 (973) - 4.8 3,830 1,015 (767) Financial Assets Impairments (15.9) % (215.8) (172,880) (205,531) (36.5) % (84.1) (67,372) (105,508) (106,127) Expected Credit Losses (ECLs) (12.4) % 935.6 749,591 856,147 (17.6) % 519.3 416,040 333,551 504,773 Operating Result 14.0 % (189.1) (151,493) (132,898) 14.5 % (104.7) (83,893) (67,600) (73,251) Incom e tax (17.3) % 746.5 598,098 723,249 (23.0) % 414.6 332,147 265,951 431,522 Net Income for the Period - 0.0 0 - - 0.0 - - - Non - Controlling interest (17.3) % 746.5 598,098 723,249 (23.0) % 414.6 332,147 265,951 431,522 Net Income for the Period attributable to Equity Holders - 7.3 5,844 (8,230) 291.8 % (13.7) (10,947) 16,791 (2,794) Fair Value Adj. Securities FTVOCI (142.2) % 73.8 59,103 (139,951) - 3.5 2,799 56,304 (75,325) Failr Value Adj. Hedge Accounting (146.7) % (21.9) (17,511) 37,510 (98.5) % 0.4 298 (17,809) 20,501 Incom e Tax & Other effects 5.4 % 805.7 645,534 612,578 (13.3) % 404.8 324,297 321,237 373,904 Comprehensive Income | 67 These results have been prepared in accordance with Chilean GAAP on an unaudited, consolidated basis . All figures are expressed in nominal Chilean pesos (historical pesos), unless otherwise stated . All figures expressed in US dollars (except earnings per ADR) were converted using the exchange rate of Ch $ 801 . 21 per US $ 1 . 00 as of June 30 , 2023 . Earnings per ADR were calculated considering the nominal net income, the exchange rate and the number of shares outstanding at the end of each period . Banco de Chile files its consolidated financial statements, together with those of its subsidiaries, with the Financial Market Commission, on a monthly basis . In addition, Banco de Chile files its quarterly financial statements (notes included) with the SEC in form 6 K, simultaneously or previously to file this quarterly earnings report . Such documentation is equally available at Banco de Chile’s website both in Spanish and English .
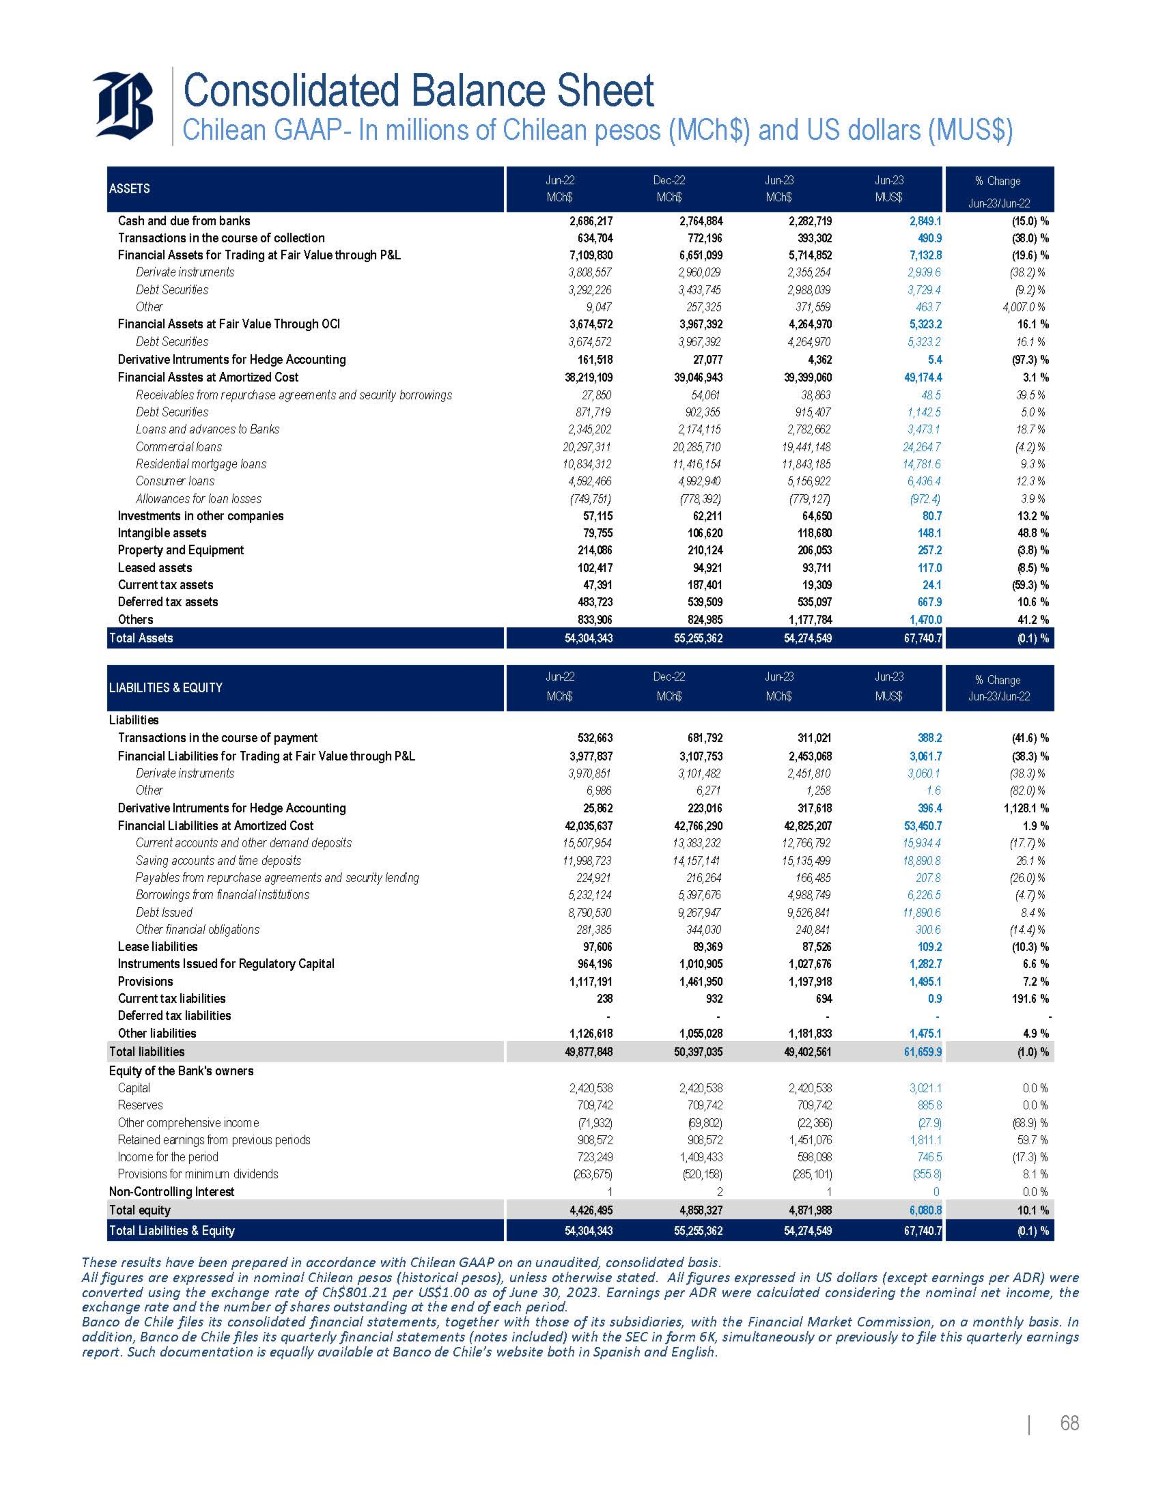
Consolidated Balance Sheet Chilean GAAP - In millions of Chilean pesos (MCh$) and US dollars (MUS$) % Change Jun - 23/Jun - 22 Jun - 23 MUS$ Jun - 23 MCh$ Dec - 22 MCh$ Jun - 22 MCh$ ASSETS (15.0) % 2,849.1 2,282,719 2,764,884 2,686,217 Cash and due from banks (38.0) % 490.9 393,302 772,196 634,704 Transactions in the course of collection (19.6) % 7,132.8 5,714,852 6,651,099 7,109,830 Financial Assets for Trading at Fair Value through P&L (38.2) % 2,939.6 2,355,254 2,960,029 3,808,557 Derivate instruments (9.2) % 3,729.4 2,988,039 3,433,745 3,292,226 Debt Securities 4,007.0 % 463.7 371,559 257,325 9,047 Other 16.1 % 5,323.2 4,264,970 3,967,392 3,674,572 Financial Assets at Fair Value Through OCI 16.1 % 5,323.2 4,264,970 3,967,392 3,674,572 Debt Securities (97.3) % 5.4 4,362 27,077 161,518 Derivative Intruments for Hedge Accounting 3.1 % 49,174.4 39,399,060 39,046,943 38,219,109 Financial Asstes at Amortized Cost 39.5 % 48.5 38,863 54,061 27,850 Receivables from repurchase agreements and security borrowings 5.0 % 1,142.5 915,407 902,355 871,719 Debt Securities 18.7 % 3,473.1 2,782,662 2,174,115 2,345,202 Loans and advances to Banks (4.2) % 24,264.7 19,441,148 20,285,710 20,297,311 Commercial loans 9.3 % 14,781.6 11,843,185 11,416,154 10,834,312 Residential mortgage loans 12.3 % 6,436.4 5,156,922 4,992,940 4,592,466 Consumer loans 3.9 % (972.4) (779,127) (778,392) (749,751) Allowances for loan losses 13.2 % 80.7 64,650 62,211 57,115 Investments in other companies 48.8 % 148.1 118,680 106,620 79,755 Intangible assets (3.8) % 257.2 206,053 210,124 214,086 Property and Equipment (8.5) % 117.0 93,711 94,921 102,417 Leased assets (59.3) % 24.1 19,309 187,401 47,391 Current tax assets 10.6 % 667.9 535,097 539,509 483,723 Deferred tax assets 41.2 % 1,470.0 1,177,784 824,985 833,906 Others (0.1) % 67,740.7 54,274,549 55,255,362 54,304,343 Total Assets | 68 % Change Jun - 23/Jun - 22 Jun - 23 MUS$ Jun - 23 MCh$ Dec - 22 MCh$ Jun - 22 MCh$ LIABILITIES & EQUITY Liabilities Transactions in the course of payment Financial Liabilities for Trading at Fair Value through P&L Derivate instruments Other Derivative Intruments for Hedge Accounting Financial Liabilities at Amortized Cost Current accounts and other demand deposits Saving accounts and time deposits Payables from repurchase agreements and security lending Borrowings from financial institutions Debt Issued Other financial obligations Lease liabilities Instruments Issued for Regulatory Capital Provisions Current tax liabilities Deferred tax liabilities Other liabilities (41.6) % (38.3) % (38.3) % (82.0) % 1,128.1 % 1.9 % (17.7) % 26.1 % (26.0) % (4.7) % 8.4 % (14.4) % (10.3) % 6.6 % 7.2 % 191.6 % - 4.9 % 388.2 3,061.7 3,060.1 1.6 396.4 53,450.7 15,934.4 18,890.8 207.8 6,226.5 11,890.6 300.6 109.2 1,282.7 1,495.1 0.9 - 1,475.1 311,021 2,453,068 2,451,810 1,258 317,618 42,825,207 12,766,792 15,135,499 166,485 4,988,749 9,526,841 240,841 87,526 1,027,676 1,197,918 694 - 1,181,833 681,792 3,107,753 3,101,482 6,271 223,016 42,766,290 13,383,232 14,157,141 216,264 5,397,676 9,267,947 344,030 89,369 1,010,905 1,461,950 932 - 1,055,028 532,663 3,977,837 3,970,851 6,986 25,862 42,035,637 15,507,954 11,998,723 224,921 5,232,124 8,790,530 281,385 97,606 964,196 1,117,191 238 - 1,126,618 (1.0) % 61,659.9 49,402,561 50,397,035 49,877,848 Total liabilities 0.0 % 0.0 % (68.9) % 59.7 % (17.3) % 8.1 % 0.0 % 3,021.1 885.8 (27.9) 1,811.1 746.5 (355.8) 0 2,420,538 709,742 (22,366) 1,451,076 598,098 (285,101) 1 2,420,538 709,742 (69,802) 908,572 1,409,433 (520,158) 2 2,420,538 709,742 (71,932) 908,572 723,249 (263,675) 1 Equity of the Bank's owners Capital Reserves Other comprehensive income Retained earnings from previous periods Income for the period Provisions for minimum dividends Non - Controlling Interest 10.1 % 6,080.8 4,871,988 4,858,327 4,426,495 Total equity (0.1) % 67,740.7 54,274,549 55,255,362 54,304,343 Total Liabilities & Equity These results have been prepared in accordance with Chilean GAAP on an unaudited, consolidated basis . All figures are expressed in nominal Chilean pesos (historical pesos), unless otherwise stated . All figures expressed in US dollars (except earnings per ADR) were converted using the exchange rate of Ch $ 801 . 21 per US $ 1 . 00 as of June 30 , 2023 . Earnings per ADR were calculated considering the nominal net income, the exchange rate and the number of shares outstanding at the end of each period . Banco de Chile files its consolidated financial statements, together with those of its subsidiaries, with the Financial Market Commission, on a monthly basis . In addition, Banco de Chile files its quarterly financial statements (notes included) with the SEC in form 6 K, simultaneously or previously to file this quarterly earnings report . Such documentation is equally available at Banco de Chile’s website both in Spanish and English .
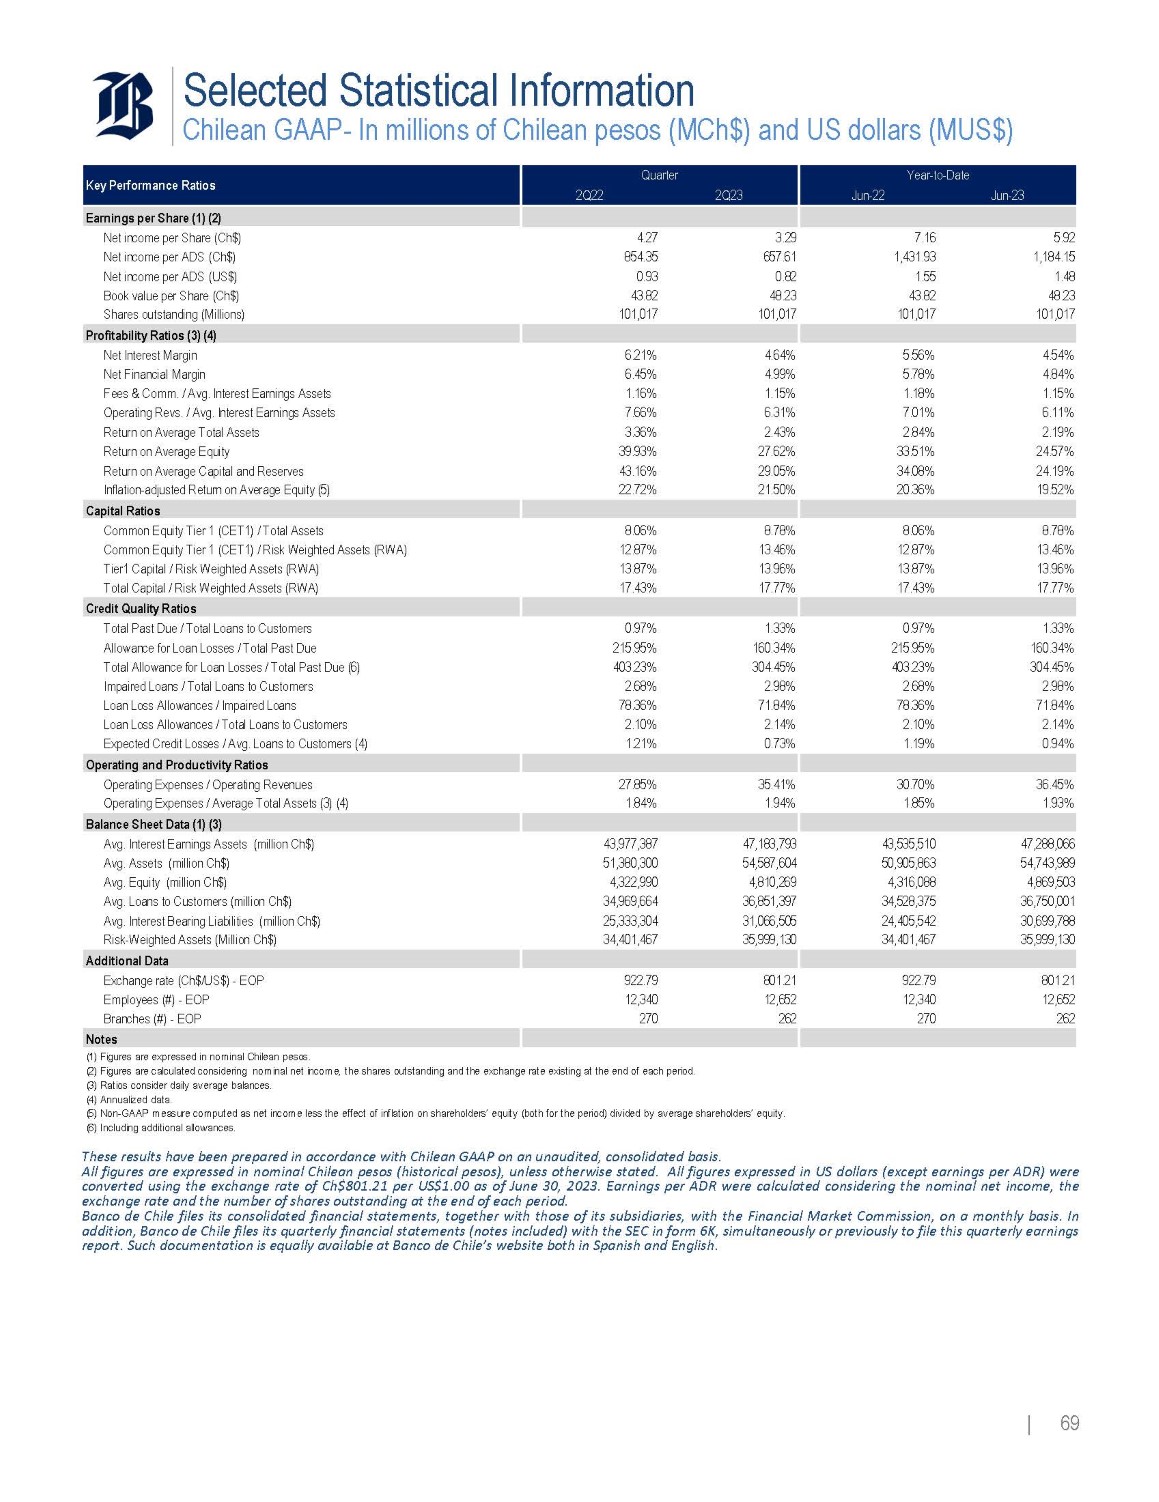
Selected Statistical Information Chilean GAAP - In millions of Chilean pesos (MCh$) and US dollars (MUS$) Jun - 23 Year - to - Date Jun - 22 2Q23 Quarter 2Q22 Key Performance Ratios Earnings per Share (1) (2) 7.16 5.92 3.29 4.27 Net income per Share (Ch$) 1,431.93 1,184.15 657.61 854.35 Net income per ADS (Ch$) 1.55 1.48 0.82 0.93 Net income per ADS (US$) 43.82 48.23 48.23 43.82 Book value per Share (Ch$) 101,017 101,017 101,017 101,017 Shares outstanding (Millions) Profitability Ratios (3) (4) 4.54% 5.56% 4.64% 6.21% Net Interest Margin 4.84% 5.78% 4.99% 6.45% Net Financial Margin 1.15% 1.18% 1.15% 1.16% Fees & Comm. / Avg. Interest Earnings Assets 6.11% 7.01% 6.31% 7.66% Operating Revs. / Avg. Interest Earnings Assets 2.19% 2.84% 2.43% 3.36% Return on Average Total Assets 24.57% 33.51% 27.62% 39.93% Return on Average Equity 24.19% 34.08% 29.05% 43.16% Return on Average Capital and Reserves 19.52% 20.36% 21.50% 22.72% Inflation - adjusted Return on Average Equity (5) Capital Ratios 8.78% 8.06% 8.78% 8.06% Common Equity Tier 1 (CET1) / Total Assets 13.46% 12.87% 13.46% 12.87% Common Equity Tier 1 (CET1) / Risk Weighted Assets (RWA) 13.96% 13.87% 13.96% 13.87% Tier1 Capital / Risk Weighted Assets (RWA) 17.77% 17.43% 17.77% 17.43% Total Capital / Risk Weighted Assets (RWA) Credit Quality Ratios 1.33% 0.97% 1.33% 0.97% Total Past Due / Total Loans to Customers 160.34% 215.95% 160.34% 215.95% Allowance for Loan Losses / Total Past Due 304.45% 403.23% 304.45% 403.23% Total Allowance for Loan Losses / Total Past Due (6) 2.98% 2.68% 2.98% 2.68% Impaired Loans / Total Loans to Customers 71.84% 78.36% 71.84% 78.36% Loan Loss Allowances / Impaired Loans 2.14% 2.10% 2.14% 2.10% Loan Loss Allowances / Total Loans to Customers 0.94% 1.19% 0.73% 1.21% Expected Credit Losses / Avg. Loans to Customers (4) Operating and Productivity Ratios 36.45% 30.70% 35.41% 27.85% Operating Expenses / Operating Revenues 1.93% 1.85% 1.94% 1.84% Operating Expenses / Average Total Assets (3) (4) Balance Sheet Data (1) (3) 43,535,510 47,288,066 47,183,793 43,977,387 Avg. Interest Earnings Assets (million Ch$) 50,905,863 54,743,989 54,587,604 51,380,300 Avg. Assets (million Ch$) 4,316,088 4,869,503 4,810,269 4,322,990 Avg. Equity (million Ch$) 34,528,375 36,750,001 36,851,397 34,969,664 Avg. Loans to Customers (million Ch$) 24,405,542 30,699,788 31,066,505 25,333,304 Avg. Interest Bearing Liabilities (million Ch$) 34,401,467 35,999,130 35,999,130 34,401,467 Risk - Weighted Assets (Million Ch$) Additional Data 922.79 801.21 801.21 922.79 Exchange rate (Ch$/US$) - EOP 12,340 12,652 12,652 12,340 Employees (#) - EOP 270 262 262 270 Branches (#) - EOP Notes (1) Figures are expressed in nominal Chilean pesos. (2) Figures are calculated considering nominal net income, the shares outstanding and the exchange rate existing at the end of each period. (3) Ratios consider daily average balances. (4) Annualized data. (5) Non - GAAP measure computed as net income less the effect of inflation on shareholders’ equity (both for the period) divided by average shareholders’ equity. (6) Including additional allowances. | 69 These results have been prepared in accordance with Chilean GAAP on an unaudited, consolidated basis . All figures are expressed in nominal Chilean pesos (historical pesos), unless otherwise stated . All figures expressed in US dollars (except earnings per ADR) were converted using the exchange rate of Ch $ 801 . 21 per US $ 1 . 00 as of June 30 , 2023 . Earnings per ADR were calculated considering the nominal net income, the exchange rate and the number of shares outstanding at the end of each period . Banco de Chile files its consolidated financial statements, together with those of its subsidiaries, with the Financial Market Commission, on a monthly basis. In addition, Banco de Chile files its quarterly financial statements (notes included) with the SEC in form 6K, simultaneously or previously to file this quarterly earnings report. Such documentation is equally available at Banco de Chile’s website both in Spanish and English.
Banco de Chile (NYSE:BCH)
Historical Stock Chart
Von Apr 2024 bis Mai 2024

Banco de Chile (NYSE:BCH)
Historical Stock Chart
Von Mai 2023 bis Mai 2024
