false 0001703056 0001703056 2023-10-02 2023-10-02
UNITED STATES
SECURITIES AND EXCHANGE COMMISSION
Washington, D.C. 20549
FORM 8-K
CURRENT REPORT
Pursuant to Section 13 or 15(d)
of the Securities Exchange Act of 1934
Date of Report (Date of earliest event reported): October 2, 2023
ADT Inc.
(Exact name of Registrant as specified in its charter)
|
|
|
|
|
| Delaware |
|
001-38352 |
|
47-4116383 |
| (State of Incorporation) |
|
(Commission File Number) |
|
(I.R.S. Employer Identification No.) |
|
|
|
| 1501 Yamato Road Boca Raton, Florida |
|
33431 |
| (Address of principal executive offices) |
|
(Zip Code) |
(561) 988-3600
(Registrant’s telephone number, including area code)
(Former Name or Former Address, if Changed Since Last Report)
Check the appropriate box below if the Form 8-K filing is intended to simultaneously satisfy the filing obligation of the Registrant under any of the following provisions:
| ☐ |
Written communications pursuant to Rule 425 under the Securities Act (17 CFR 230.425) |
| ☐ |
Soliciting material pursuant to Rule 14a-12 under the Exchange Act (17 CFR 240.14a-12) |
| ☐ |
Pre-commencement communications pursuant to Rule 14d-2(b) under the Exchange Act (17 CFR 240.14d-2(b)) |
| ☐ |
Pre-commencement communications pursuant to Rule 13e-4(c) under the Exchange Act (17 CFR 240.13e-4(c)) |
Securities registered pursuant to Section 12(b) of the Act:
|
|
|
|
|
| Title of each class |
|
Trading Symbol(s) |
|
Name of each exchange on which registered |
| Common Stock, par value $0.01 per share |
|
ADT |
|
New York Stock Exchange |
Indicate by check mark whether the Registrant is an emerging growth company as defined in Rule 405 of the Securities Act of 1933 (17 CFR §230.405) or Rule 12b-2 of the Securities Exchange Act of 1934 (17 CFR §240.12b-2).
Emerging growth company ☐
If an emerging growth company, indicate by check mark if the Registrant has elected not to use the extended transition period for complying with any new or revised financial accounting standards provided pursuant to Section 13(a) of the Exchange Act. ☐
| Item 7.01 |
Regulation FD Disclosure. |
Lender Presentation for Refinancing Transaction
ADT Inc. (“ADT,” the “Company,” “we” and “our”) intends to refinance its First Lien Senior Secured Term Loans due 2026 (the “Refinancing Transaction”), through an amendment to the existing First Lien Credit Agreement, dated July 1, 2015 (as subsequently amended and restated), by and among Prime Security Services Holdings, LLC (“Holdings”), Prime Security Services Borrower, LLC (“Prime Borrower”) and The ADT Security Corporation (the “Co-Borrower”), each an indirect wholly owned subsidiary of ADT, certain other subsidiaries of ADT, the lenders party thereto and Barclays Bank PLC, as administrative agent. Holdings and the Co-Borrower expect to have a meeting with their lenders on October 3, 2023 to discuss the Refinancing Transaction. The Refinancing Transaction is subject to market and other conditions, and may not occur as described or at all.
In connection with the Refinancing Transaction, ADT is providing today its lenders with a presentation, which is attached to this current report on Form 8-K as Exhibit 99.1 and incorporated by reference herein (the “Lender Presentation”).
The information in this Item 7.01 and the exhibit hereto are furnished solely pursuant to Item 7.01 of this Form 8-K. Consequently, they are not deemed “filed” for the purposes of Section 18 of the Securities Exchange Act of 1934, as amended, (the “Exchange Act”) or otherwise subject to the liabilities of that section. They may only be incorporated by reference in another filing under the Exchange Act or Securities Act, if such subsequent filing specifically references this Form 8-K.
Forward Looking Statements
This filing, and other reports, filings, and other public written and verbal announcements contain certain information that may constitute “forward-looking statements” and therefore are subject to risks and uncertainties. All statements contained in this current report on Form 8-K that are not clearly historical in nature, including statements regarding the Refinancing Transaction, are forward-looking statements. Any time we use the words “expects,” “intends,” “will,” “anticipates,” “believes,” “confident,” “continue,” “propose,” “seeks,” “could,” “may,” “should,” “estimates,” “forecasts,” “might,” “goals,” “objectives,” “targets,” “planned,” “projects,” and similar expressions, we intend to clearly express that the information deals with possible future events and is forward-looking in nature. However, the absence of these words or similar expressions does not mean that a statement is not forward-looking. Forward-looking information involves risks, uncertainties, and other factors that could cause actual results to differ materially from those expressed or implied in, or reasonably inferred from, such statements, including without limitation, the risks and uncertainties disclosed or referenced in ADT’s Amended Annual Report on Form 10-K, Quarterly Reports on Form 10-Q, Current Reports on Form 8-K, and other filings with the Securities and Exchange Commission, including the sections entitled “Risk Factors” and “Management’s Discussion and Analysis of Financial Condition and Results of Operations” contained therein. Therefore, caution should be taken not to place undue reliance on any such forward-looking statements. Much of the information in this document that looks toward future performance of ADT is based on various factors and important assumptions about future events that may or may not actually occur. We assume no obligation (and specifically disclaim any such obligation) to publicly update or revise any forward-looking statements, whether as a result of new information, future events, or otherwise, except as required by law.
| Item 9.01 |
Financial Statements and Exhibits. |
(d) Exhibits.
|
|
|
| Exhibit |
|
Description |
|
|
| 99.1 |
|
Lender Presentation |
|
|
| 104 |
|
Cover Page Interactive Data File (embedded within the Inline XBRL document). |
SIGNATURES
Pursuant to the requirements of the Securities Exchange Act of 1934, as amended, the registrant has duly caused this report to be signed on its behalf by the undersigned thereunto duly authorized.
|
|
|
|
|
|
|
| Date: October 2, 2023 |
|
ADT Inc. |
|
|
|
|
|
|
|
|
By: |
|
/s/ Kenneth J. Porpora |
|
|
|
|
|
|
Kenneth J. Porpora |
|
|
|
|
|
|
Executive Vice President and Chief Financial Officer |

Exhibit 99.1 Lender Presentation October 3, 2023

Disclaimer This presentation (the “Presentation”) has been
prepared by Prime Security Services Borrower, LLC (the “Borrower”) and The ADT Security Corporation (the “Co-Borrower”), a wholly owned subsidiary of the Company, in connection with the syndication of the Company's planned
1st Lien Senior Secured Credit Facility (the “Facility”), solely for informational purposes. The information contained in this Presentation has been prepared to assist prospective lenders in conducting their own evaluation of the Company
and does not purport to be complete or to contain all of the information that a prospective lender may require. Prospective lenders should conduct their own investigation and analysis of the Company and of the information set forth in this
Presentation. The Company makes no representation or warranty as to the accuracy, reliability, reasonableness or completeness of this information and shall not have any liability for any representations regarding information contained in, or for any
omission from, this Presentation or any other written or oral communications transmitted to the recipient in the course of its evaluation of the Company. By accepting this Presentation, each receiving prospective lender acknowledges and agrees that
all of the information contained herein is confidential and proprietary information of the Company. Each prospective lender agrees that it will not disclose this information to any person or entity other than its directors, officers and employees
who have a need to know such information, and will use the information only in connection with its evaluation of the Company and the Facility and will keep such information permanently confidential. The Company and its affiliates, representatives
and advisors expressly disclaim any and all liability based, in whole or in part, on the information contained in this Presentation (which only speaks as of the date identified on the cover page of this Presentation), errors therein or omissions
therefrom. Neither the Company nor any of its affiliates, representatives or advisors intends to update or otherwise revise the information contained herein to reflect circumstances existing after the date identified on the cover page of this
Presentation to reflect the occurrence of future events even if any or all of the assumptions, judgments and estimates on which the information contained herein is based are shown to be in error. 2

Forward Looking Statements and Non-GAAP Measures ADT Inc.
(“ADT”) has made statements in this presentation that are forward looking and therefore subject to risks and uncertainties. All statements, other than statements of historical fact, included in this document are, or could be,
“forward looking statements” within the meaning of the Private Securities Litigation Reform Act of 1995 and the applicable rules and regulations of the Securities and Exchange Commission and are made in reliance on the safe harbor
protections provided thereunder. These forward looking statements relate to the strategic investment by and long term partnership with State Farm Fire & Casualty Company (“State Farm”); anticipated financial performance;
management’s plans and objectives for future operations; the successful development, commercialization, and timing of new or joint products; expected timing of product commercialization with State Farm or any changes thereto; our acquisition
of ADT Solar and its anticipated impact on our business and financial condition; business prospects; outcomes of regulatory proceedings; market conditions; our strategic partnership and ongoing relationship with Google LLC (“Google”);
the expected timing of product commercialization with Google or any changes thereto; the successful internal development, commercialization, and timing of our next generation platform and innovative offerings; the successful conversion of customers
who continue to utilize outdated technology; the current and future market size for existing, new, or joint products; the anticipated uses of the proceeds of the disposition of our commercial business, including planned debt redemptions and
repayments, and the expected timing and impacts thereof, including on the Company's credit ratings; the Company's ability to reduce debt or improve leverage ratios, or to achieve or maintain its long-term leverage goals; any stated or implied
outcomes with regards to the foregoing; and other matters are forward-looking. Forward looking statements can be identified by various words such as “expects,” “intends,” “anticipates,” “believes,”
“confident,” “continue,” “propose,” “seeks,” “could,” “may,” “should,” “estimates,” “forecasts,” “might,” “goals,”
“objectives,” “targets,” “planned,” and similar expressions. These forward looking statements are based on management’s current beliefs and assumptions and on information currently available to management.
ADT cautions that these statements are subject to risks and uncertainties, many of which are outside of ADT’s control, and could cause future events or results to be materially different from those stated or implied in this document, including
among others, risks and uncertainties related to the Company’s ability to effectively implement our strategic partnership with, commercialize products with, or utilize any of the amounts invested in us by State Farm or provided by State Farm
for research and development or other purposes; the Company’s ability to effectively implement our strategic partnership with or utilize any of the amounts invested in us by Google; the Company’s ability to sell our products and services
or launch new products and services in highly competitive markets, including the home security and automation market and the solar market, and to achieve market acceptance with acceptable margins; risks associated with the Company's ability to
reduce debt or improve leverage ratios, including risks associated with planned debt redemptions and repayments; and risk factors that are described in the Company’s Amended Annual Report on Form 10-K/A, Quarterly Reports on Form 10-Q, Current
Reports on Form 8-K, and other filings with the Securities and Exchange Commission, including the sections entitled “Risk Factors” and “Management’s Discussion and Analysis of Financial Condition and Results of
Operations” contained therein. Any forward looking statement made in this presentation speaks only as of the date on which it is made ADT undertakes no obligation to publicly update or revise any forward looking statement, whether as a result
of new information, future developments, or otherwise. Non-GAAP Measures To provide investors with additional information in connection with our results as determined in accordance with generally accepted accounting principles in the United States
(“GAAP”), we disclose certain non-GAAP measures including, for example, Adjusted EBITDA, Adjusted EBITDA prior to subscriber acquisition, Adjusted EBITDA margin, Free Cash Flow, Adjusted Free Cash Flow, Adjusted Free Cash Flow (including
interest rate swaps), Net Leverage Ratios, and Adjusted Net Income. Reconciliations from GAAP to these non-GAAP financial measures for reported results can be found in the appendix. Non-GAAP measures should not be considered a substitute, or
superior to, our reported GAAP results. Amounts on subsequent pages may not sum due to rounding. Note: Operating metrics such as Gross Revenue Attrition, Ending Subscriber Count, RMR, Gross RMR Additions, Net SAC, IRPU, Interactive Customers, Solar
Installations, and Revenue Payback are approximated as there may be variations to reported results in each period due to certain adjustments we might make in connection with the integration over several periods of acquired companies that calculated
these metrics differently, or otherwise, including periodic reassessments and refinements in the ordinary course of business. These refinements, for example, may include changes due to systems conversion or historical methodology differences in
legacy systems. Metrics referencing record performance reflect measurements made since the formation of ADT Inc. in 2015. 3

Call Participants Jim DeVries Chairman of the Board, President and Chief
Executive Officer, ADT Ken Porpora Executive Vice President and Chief Financial Officer, ADT Deepika Yelamanchi Treasurer and Senior Vice President, ADT Bradford Aston Managing Director, Barclays 4

Transaction Overview 5

Transaction Overview • ADT is a leading provider of security,
automation, and smart home solutions services to residential and business customers in the United States th • On August 8 , 2023, ADT announced the sale of 100% of the commercial business to GTCR for approximately $1.6 billion in an all- cash
deal • Purchase price of approximately $1.6 billion represents an attractive EV/Commercial Adjusted EBITDA multiple of (1) approximately 11.2x including estimated allocation of corporate costs nd • Sale closed on October 2 , 2023; net
cash proceeds of approximately $1.5 billion will be used to pay down $200 million of the Secured Notes due 2024, with the remainder used to repay a portion of the Term Loan B due 2026 • The Company is seeking to refinance the Term Loan B due
2026 with a new $1,400 million 7-year Term Loan B due 2030 along with balance sheet cash (the “Transaction”) • As adjusted for the Transaction, 1st Lien Net Leverage and Total Net Leverage will be ~2.5x and ~2.9x, respectively,
based on LTM (2) 6/30/23 Adjusted EBITDA (Pre-SAC) of $2,654 million Notes: (1) EV/Commercial Adjusted EBITDA is a non-GAAP measure. Refer to the reconciliations that follow for the presentation of the most comparable GAAP measure along with the
GAAP to non-GAAP reconciliation. (2) LTM Adjusted EBITDA (Pre-SAC) adjusted for the commercial divestiture excludes $158M of LTM Commercial Segment Adjusted EBITDA as of 6/30/2023 on a Post-SAC basis and is illustrative and does not reflect
discontinued operations accounting treatment or finalized separation impacts. LTM Adjusted EBITDA figure presented may differ from Credit Agreement EBITDA, which is presented entirely on a Pre- 6 SAC basis. LTM Adjusted EBITDA (Pre-SAC) is a
non-GAAP measure. Refer to the reconciliations that follow for the presentation of Adjusted EBITDA (Pre-SAC) excluding Commercial Adjusted EBITDA.

As Adjusted Capitalization and Ratings Summary Sources and Uses of Funds
Historical and Adjusted Capitalization ($ in millions) Historical Adj. for As Adjusted Adj. for As Adjusted ($ in millions) (2) (3) Paydown Transaction 6/30/2023 6/30/2023 6/30/2023 Sources of Funds $ % New Senior Secured Term Loan B due 2030 $1,400
99% Unrestricted Cash & Cash Equivalents $146 - $146 (9) $138 Cash from Balance Sheet 9 1% Revolving Credit Facility - - - - - Total Sources of Funds $1,409 100% (4) 1st Lien Senior Secured Term Loan B due 2026 2,716 (1,318) 1,398 (1,398) - 1st
Lien Senior Secured Term Loan A due 2028 642 - 642 - 642 Uses of Funds $ % New Senior Secured Term Loan B due 2030 - - - 1,400 1,400 R efinance Existing 1st Lien Senior Secured Term Loan B due 2026 $1,398 99% 1st Lien Senior Secured Notes due 2024
600 (200) 400 - 400 Estimated Fees and Expenses 11 1% 1st Lien Senior Secured Notes due 2026 1,350 - 1,350 - 1,350 Total Uses of Funds $1,409 100% 1st Lien Senior Secured Notes due 2027 1,000 - 1,000 - 1,000 1st Lien Senior Secured Notes due 2029
1,000 - 1,000 - 1,000 1st Lien Senior Secured Notes due 2032-2042 750 - 750 - 750 (5) (5) Capital Leases 104 - 104 - 104 Total 1st Lien Debt $8,162 $6,644 $6,645 (1) Expected Ratings Summary 2nd Lien Senior Secured Notes due 2028 1,300 - 1,300 -
1,300 Total Debt $9,462 $7,944 $7,945 Moody’s S&P Selected Operating Statistics Corporate Ba3 BB- (6) (7) Ad. EBITDA (Pre-SAC) $2,812 (158) $2,654 - $2,654 (8) Ad. EBITDA (Post-SAC) 2,525 (158) 2,367 - 2,367 1st Lien Ba2 BB Selected Credit
Statistics 2nd Lien B2 B Net 1st Lien Debt / Adj. EBITDA (Pre-SAC) 2.9x ~2.4x ~2.5x Net Debt / Adj. EBITDA (Pre-SAC) 3.3x ~2.9x ~2.9x Outlook Stable Stable Net 1st Lien Debt / Adj. EBITDA (Post-SAC) 3.2x 2.7x 2.7x Net Debt / Adj. EBITDA (Post-SAC)
3.7x 3.3x 3.3x Notes: Debt instruments are stated at face value excluding debt issuance discount, deferred financing costs, and fair value adjustments. (1) On August 8th, 2023 Moody’s placed ADT’s B1 corporate ratings, Ba3 1st Lien Issue
Rating, and B3 2nd Lien Issue Rating under review for upgrade. The review for upgrade was prompted by the Company’s announcement that it will pay down approximately $1.5B of debt with proceeds from the sale of its commercial business segment.
Moody's could upgrade the ratings if the transaction closes as expected and ADT reduces $1.5B of existing debt the after-tax proceeds, while also sustaining operational improvement. However, any such upgrade is not guaranteed. (2) As adjusted for
debt reduction using proceeds from the sale of the commercial business. (3) As further adjusted for the Transaction. (4) Excludes $7M amortization payment as of September 29, 2023. (5) Includes ~$35M of capital leases that will be transferred along
with the sale of the commercial business. 7 (6) Represents LTM Commercial Segment Adjusted EBITDA on a Post-SAC basis. (7) LTM Adjusted EBITDA (Pre-SAC) adjusted for the commercial divestiture excludes $158M of LTM Commercial Segment Adjusted EBITDA
on a Post-SAC basis and is illustrative and does not reflect discontinued operations accounting treatment or finalized separation impacts. Figure presented may differ from Credit Agreement EBITDA, which is presented entirely on a Pre-SAC basis. (8)
LTM Adjusted EBITDA adjusted for the commercial divestiture excludes $158M of LTM Commercial Segment Adjusted EBITDA and is illustrative and does not reflect discontinued operations accounting treatment or finalized separation impacts.

Summary of Terms: Senior Secured Term Loan Facility Borrower: Prime
Security Services Borrower, LLC and The ADT Security Corporation (the “Co-Borrowers”) Administrative Agent: Barclays Facility: $1,400 million Senior Secured Term Loan B Facility (the “TLB”) (1) Maturity: 7 years Security:
Perfected first priority security interest in substantially all assets of the Borrower and Guarantors Guarantors: All existing and future wholly-owned domestic subsidiaries of the Borrower, with certain exceptions to be agreed (the
“Guarantors”) Ranking: Pari passu with all existing and future senior indebtedness and senior to all existing and future subordinated indebtedness Amortization: 1.0% per annum Optional Prepayments: Pre-payable at par, subject to 101 soft
call protection for 6 months Mandatory Redemption: Same as existing Term Loan B Negative Same as existing Term Loan B Covenants: Notes: (1) Subject to a springing maturity to the date that is 91 days prior to the scheduled maturity date of (i) the
5.750% First-Priority Senior Secured Notes due 2026, the 3.375% First-Priority Senior Secured Notes due 2027, the 6.250% Second-Priority Senior Secured 8 Notes due 2028 or the 4.125% First-Priority Senior Secured Notes due 2029 or (ii) any
refinancing indebtedness in respect of the foregoing if, on such date, $1,000 million or more of such indebtedness remains outstanding.

Execution Timeline October 2023 S M T W T F S 1 2 3 4 5 6 7 8 9 10 11 12
13 14 15 16 17 18 19 20 21 22 23 24 25 26 27 28 29 30 31 Market Holiday Key Transaction Date Date Event October 3, 2023 Lender Call October 10, 2023 Commitments Due (5:00 PM EST) Thereafter Close and Fund 9

Business Overview and Recent Update 10

Positioned to Serve High-Growth Smart Home and Solar Markets Focused
Business, Well Positioned Market Growth and Key Drivers to Gain Share in High-Growth Markets U.S. Market Sizing CAGR % ADT Share Key Growth Drivers (2022-2027) $120B • Differentiated pro install and monitoring capability Market Leader ~6%
• Share expansion in fast-growing self-setup Residential Pro $31B $97B Monitoring • Adoption of affordable, easy-to-use devices ~14% • Broad use cases & device types addressed via Google $75B partnership & Matter
compatibility Home $55B Automation • High adoption of video doorbells and cameras ~11% Significant Upside Potential Residential Self • SMB spend on technology increasing Monitoring $5B ~7% • Similar drivers & trends as
residential market $3B SMB Security • Significant tailwinds i.e., Inflation Reduction Act $26B ~8% Solar • Cross selling opportunity leveraging ADT brand 2022 2025 2027 Upside Potential from Increasing Share of Wallet in High-Growth
Markets 11 Source: Parks Associates, Tech Insights, Interpret, Omdia, Wood Mackenzie, Grandview Research, Infiniti Research, ADT analysis

Continuing Our Evolution as the #1 Smart Home Solutions Provider
Providing best -in-class, comprehensive smart home Past 2023 Future security and monitoring All-in-One Leak Smart Home Sensors Ecosystem Solar Provider Panels Product expansions allow cross-selling opportunities in the home… Window Sensors
Installation Revenue Per Unit ~$1,450 ~$725 Cameras Smoke Detectors 1Q’20 1H’23 …and broader demand for our products allows Security Systems penetration of materially more US HHs Doorbells 130M # of US HHs 40M Our homeowner wallet
share is accelerating as we continue innovating the #1 smart home experience 2022 2027 Estimate 12

Core Strategy to Drive Customer Preference and Long-term Shareholder
Value Remains Unchanged Strategic Differentiators Enablers Co-marketing ADT Solar to #1 Smart Home security provider existing customer base for 7 consecutive years Brand Reputation and 24/7 Monitoring as the Innovative Trusted top two factors in
their decision making ADT+ and ADT Self Setup Offerings Brand Retail E-commerce Omnichannel SMART Monitoring delivering faster response times and higher fidelity alarms Unrivaled Optimized Supplementing existing channels to meet customers where they
prefer to shop Safety Go-To-Market Average tech 2.1 year Enhanced tenure of Record Revenue subscriber acquisition 8 years Record Payback efficiency 8 Year customer Tailored Premium Operational Avg. Customer Life retention insurance offer Experience
Excellence Differentiators Enable Accelerated Growth 13 Source: Strategy Analytics 2023. All metrics exclude commercial business.

ADT Continues to Provide Customers Safe, Smart, and Sustainable
Solutions Addressing the Expanding Customer Opportunity Delivering Superior Results Across Key CSB Metrics Prior to IPO Today Transforming into a full-fledged smart home provider with (2017) differentiated products and services Customer revenue ~86%
>87% retention Supplementing existing channels to meet customers where they prefer to shop: Retail, E-Commerce, and Omnichannel Average ~7 years ~8 years customer life Recurring Monthly Creating unparalleled customer choice for activating and
servicing our $300M $348M Revenue products through professional installation and DIY LTM Revenue 2.5 years 2.1 years Payback Our signature platform ADT+ delivers continuous value to customers by making their lives easier and safer Customer Lifetime
Value to Net SAC 2.4x 3.2x Multiple Broadening our distribution reach and our customer offerings through Core Customer significant partnerships with Google and State Farm ~$2,000 ~$3,000 Value Interactive Refreshing advertising campaigns to increase
continued awareness ~65% ~90% take rate and differentiation of our new capabilities to ignite customer demand 14 Note: Prior to IPO refers to full year 2017, the final full-year period prior to our IPO in January 2018, for the US only; Today refers
to the trailing-twelve month period ending with 2Q’23.

Partnerships Accelerate Innovation as Catalyst for Future Growth
• Accelerated innovation and product development with the launch of the ADT+ app — National rollout of ADT+ app and ADT Self Setup in February 2023 outpacing expectations — New ADT+ app with deep Google integration has improved
camera and video attach rate by 800bps — ADT+ professional installation on track to rollout later this year • Google products have increased the number of smart home devices in the home, a variable correlated to higher retention —
Larger systems and adoption of video further translate to higher device take rates, higher RMR, and higher IRPU — New customers report higher satisfaction when Google products are included • Offer for State Farm homeowners customers is
expected to expand in up to 13 states this year — Positive trends and high customer satisfaction with early customers — Approximately 2/3 of systems include the purchase of additional ADT products and services resulting in higher IRPU
— Capital-efficient subscriber growth via $300 million opportunity fund — Potential future opportunity of 13.7 million State Farm non-tenant homeowner policyholders 15

The investment thesis for ADT remains strong with an attractive
financial profile Large and expanding addressable market with 1 Medium-term target framework 1 opportunities to meaningfully increase share In-line with market growth Revenue by lines of business Growing business with industry-leading scale 2
positioned to benefit from secular tailwinds EBITDA and Growth exceeding revenue Free Cash Flow Large opportunity with strategic partnerships 3 Internal Rate of Return 20%+ per new CSB subscriber and solar in nascent state Net leverage ratio
<3.0x Compelling unit economics that support 4 increased investment for growth Annual Adjusted Free ~$1B by 2025 Cash Flow (including interest rate swaps) Resilient cash flow profile with stable recurring 5 revenue base Capital Allocation
Priorities Attractive debt profile with disciplined capital • Fund growth and capex to yield attractive returns 6 • Sustainable dividend allocation framework to drive long-term value for • Continue to pay down debt to achieve
optimal leverage ratios our shareholders 16 Note: (1) The Company’s previously issued 2025 goals included the commercial business. We will reevaluate our long-term goals subsequent to the closing of the commercial business
divestiture.
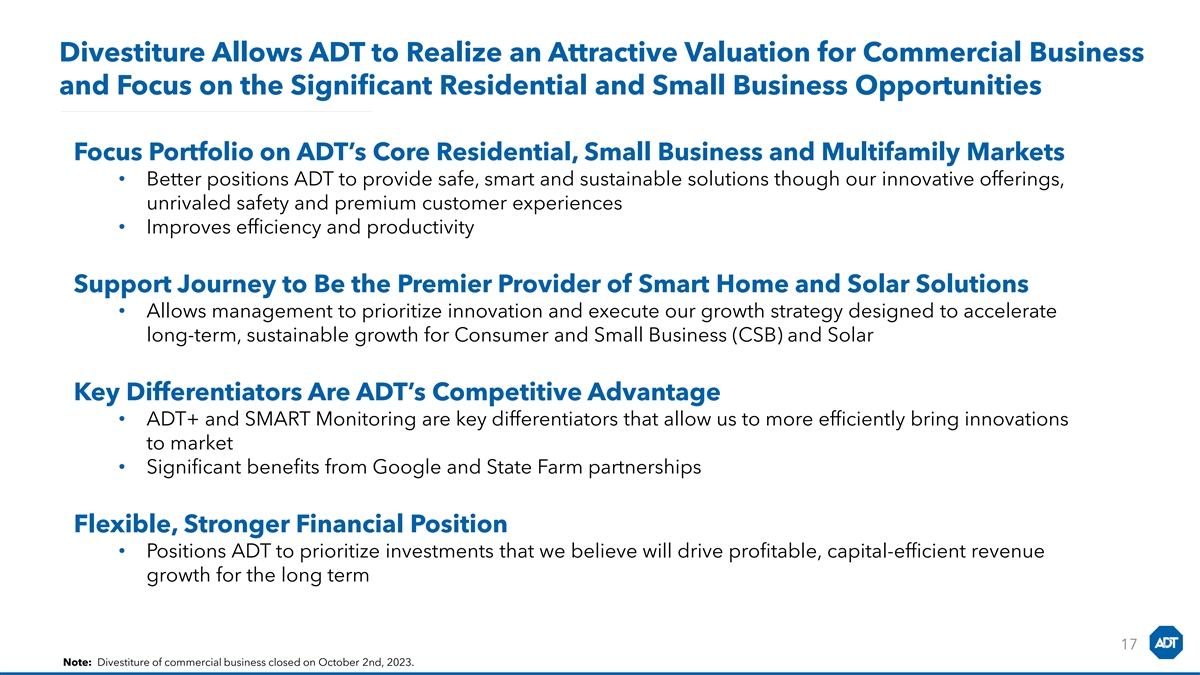
Divestiture Allows ADT to Realize an Attractive Valuation for
Commercial Business and Focus on the Significant Residential and Small Business Opportunities Focus Portfolio on ADT’s Core Residential, Small Business and Multifamily Markets • Better positions ADT to provide safe, smart and sustainable
solutions though our innovative offerings, unrivaled safety and premium customer experiences • Improves efficiency and productivity Support Journey to Be the Premier Provider of Smart Home and Solar Solutions • Allows management to
prioritize innovation and execute our growth strategy designed to accelerate long-term, sustainable growth for Consumer and Small Business (CSB) and Solar Key Differentiators Are ADT’s Competitive Advantage • ADT+ and SMART Monitoring
are key differentiators that allow us to more efficiently bring innovations to market • Significant benefits from Google and State Farm partnerships Flexible, Stronger Financial Position • Positions ADT to prioritize investments that we
believe will drive profitable, capital-efficient revenue growth for the long term 17 Note: Divestiture of commercial business closed on October 2nd, 2023.
Q2 Financial Update 18

Recent Highlights: 2Q 2023 Another record CSB performance with
continued top-line growth and improved margins 1 2 Record revenue payback of 1.9 years, achieving 2025 goal more than 2 years early 3 Continued record high customer revenue retention, driving highest-ever RMR balance Partnership momentum continues
– Google helping drive higher installation revenue versus 4 prior year and State Farm innovative offer active in 3 states 5 Strong cash generation driven by enhanced subscriber acquisition efficiency Resilient business model with strong
margins and enhanced subscriber acquisition efficiency 19

2Q 2023: Highlights +4% $0.16 $651M M&S Revenue Growth Adjusted EPS
Adjusted EBITDA vs. prior year with CSB up 3% Adjusted Net Income of $148M, up 9% vs. prior year; & Commercial up 7% up $98M vs. prior year up 13% excluding Solar 12.5% 1.9 years Gross Revenue Attrition Revenue Payback maintaining record
retention down 0.3x vs. prior year, a new record low $382M 3.3x End of Period RMR Net leverage ratio prior up 4% vs. prior year, to subscriber acquisition another record balance down 0.3x vs. prior year Record profitability in Q2 with continued
strength across key operating measures 20

Key Financial and Operating Metrics For the three months ended June 30,
June 30, Key Highlights Y/Y Change 2023 2022 ($ in millions) M&S Revenue $1,187 $1,146 $41 4% • M&S Revenue / End of Period RMR: Growth in recurring revenue base driven by higher average pricing across CSB subscriber base Total Revenue
$1,593 $1,601 ($8) (0%) • Adjusted EBITDA: CSB revenue growth and margin expansion and Adjusted Net Income (Loss) $148 $50 $98 195% Commercial growth, partially offset by Solar performance Adjusted EPS $0.16 $0.06 $0.11 • Adjusted EPS:
Adj. EBITDA throughput, higher amortization of deferred Adjusted EBITDA $651 $597 $54 9% subscriber acquisition revenue, and lower depreciation & amortization Adjusted Free Cash Flow $221 $174 $47 27%• Adjusted FCF (incl. Swaps): M&S
revenue growth, operating margin (including interest rate swaps) expansion, and lower net subscriber investments offsetting Solar Adjusted Free Cash Flow $201 $185 $16 8% performance and cash interest, including the impact of swaps Net SAC $331 $368
($36) (10%) • Net SAC / LTM Revenue Payback: Higher average upfront proceeds, Gross RMR Additions $14.5 $15.5 ($1.1) (7%) margin improvements on existing customer transactions and higher volume of self-setup additions Gross RMR Additions $14.5
$14.7 ($0.2) (1%) (excluding bulk purchases) • Gross RMR Additions: Growth in self-setup channel partially offsetting End of Period RMR $382 $369 $13 4% lower volume of relocations and prior year impact of bulk purchases LTM Revenue Payback
1.9x 2.2x (0.3x) • Gross Revenue Attrition: Lower volume of relocations partially offset by higher volume of non-pay disconnects Gross Revenue Attrition 12.5% 12.7% (20 bps) 21 Note: Net Subscriber Acquisition Costs (SAC) represents the
estimated cash expenditures for sales and installation, net of inflows received, in our CSB and Commercial segments.

Appendix 22

As Our Penetration of the Smart Home Ecosystem Grows, Our Growth
Flywheel Accelerates Accelerate Penetration and Enable Customers to Better Unlock Greater Share of Wallet Manage the Risks of Everyday Life in Fast-Growing Markets and Protect What Matters Most 1 2 • Actively increasing wallet share and
product • Innovative, next-generation product suite breadth with a differentiated customer drives new customer additions and unlocks experience record-high retention • Ex. Launched ADT Self Setup with ADT+ in • Ex. Partnership with
State Farm launched in 1Q’23 #1 Security and Smart Home three states, further expansion in 2H’23 Provider with All Time Records ✓ Recurring Monthly Revenue ✓ Retention ✓ Revenue Payback Advance Path Toward Improve
Customer Unit ✓ Core Customer Value Capital-Efficient Growth Economics and Innovation and Financial Upside 4 3 • Best-in-class unit economics driven by • In-home revenue opportunities and smart home business and increased
expanding device counts provide more efficient subscriber acquisition revenue per installation • Ex. Residential IRPU of $1,450 • Ex. Averaging ~30% more devices per approximately doubling in last three home in last two years years
23

C O N S U M E R A N D S M A L L B U S I N E S S Segment Financials and
Key Metrics Revenue Segment Statistics $ in Millions 2Q'23 Y/Y Change +7% $1,168 $1,088 Ending Subscriber Count 6.4M 0% $125 $77 $1,043 $1,011 Interactive Customers 65% 400 bps as a % of Total Residential and Small Business 2Q’22 2Q’23
End of Period RMR $348M 3% Monitoring and Related Services Security Installation, Product, and Other including wholesale Adjusted EBITDA Gross RMR Additions $13.1M (8%) $ in Millions excluding bulk purchases (2%) +11% Gross Unit Additions 227K (7%)
excluding bulk purchases 1% $644 $581 LTM Revenue Payback 2.1x (0.2x) 2Q’22 2Q’23 24 Note: Operating metrics presented exclude wholesale customers who outsource their monitoring to ADT unless otherwise noted. Gross Unit Additions
represent Residential and Small Business only and exclude our Health, Cyber, and Mobile businesses. Interactive services include Pulse, Control, and similar ADT platforms and are inclusive of services ranging from remote arm and disarm systems to
full home automation.

S O L A R Segment Financials and Key Metrics Revenue Segment Statistics
$ in Millions 2Q'23 Y/Y Change (64%) Solar Installations 2.0K (64%) $215 Revenue per Installation ~$39K 0% $78 2Q’22 2Q’23 Battery Attachment Rate 16.8% (100 bps) Solar Installation, Product, and Other Adjusted EBITDA $ in Millions ($15)
($37) 2Q’22 2Q’23 25 Note: Revenue and revenue per installation are presented net of financing fees, which were $40M and $9M for 2Q’22 and 2Q’23, respectively.

Non-GAAP Measures ADT sometimes uses information(“non-GAAP
financialmeasures”) that is derived from the consolidated financial statements, but that is not presented in accordance with accounting principles generally accepted in the U.S.(“GAAP”). Under SEC rules, non-GAAP financial measures
may be considered in addition to results prepared in accordance with GAAP, but should not be considered a substitute for, or, superior to GAAP results. The following information includes definitions of our non-GAAP financial measures used in this
presentation, reasons our management believes these measures are useful to investors regarding our financial condition and results of operations, additional purposes, if any, for which our management uses the non-GAAP financial measures, and
limitations to using these non-GAAP financial measures, as well as reconciliations of these non-GAAP financial measures to the most comparable GAAP measures. The limitations of non-GAAP financial measures are best addressed by considering these
measures in conjunction with the appropriate GAAP measures. In addition, computations of these non-GAAP measures may not be comparable to other similarly titled measures reported by other companies. 26

GAAP to Non-GAAP Reconciliations Adjusted EBITDA, Adjusted EBITDA
Margin and Reconciliation to GAAP Net Income or Loss We believe the presentation of Adjusted EBITDA provides useful information to investors about our operating profitability adjusted for certain non-cash items, non-routine items that we do not
expect to continue at the same level in the future, as well as other items that are not core to our operations. Further, we believe Adjusted EBITDA provides a meaningful measure of operating profitability because we use it for evaluating our
business performance, making budgeting decisions, and comparing our performance against that of other peer companies using similar measures. We define Adjusted EBITDA as net income or loss adjusted for (i) interest; (ii) taxes; (iii) depreciation
and amortization, including depreciation of subscriber system assets and other fixed assets and amortization of dealer and other intangible assets; (iv) amortization of deferred costs and deferred revenue associated with subscriber acquisitions; (v)
share-based compensation expense; (vi) merger, restructuring, integration, and other; (vii) losses on extinguishment of debt; (viii) radio conversion costs net of any related incremental revenue earned; (ix) adjustments related to acquisitions, such
as contingent consideration and purchase accounting adjustments, or dispositions; (x) impairment charges; and (xi) other income/gain or expense/loss items such as changes in fair value of certain financial instruments or financing and consent fees.
There are material limitations to using Adjusted EBITDA as it does not reflect certain significant items, which directly affect our net income or loss (the most comparable GAAP measure). The Adjusted EBITDA discussion above is also applicable to
Adjusted EBITDA margin, which is calculated as Adjusted EBITDA as a percentage of total revenue. (in millions) Three Months Ended Six Months Ended Twelve Months Ended March 31, December 31, September 30, March 31, December 31, June 30, 2023 June 30,
2022 June 30, 2023 June 30, 2022 June 30, 2023 June 30, 2022 2023 2022 2022 2023 2022 Net income (loss) $ 92 $ (119) $ 151 $ (161) $ 92 $ (27) $ 143 $ (37) $ (38) $ 133 $ (24) Interest expense, net 84 172 147 30 82 256 88 433 431 265 331 Income tax
expense (benefit) (55) (63) 2 (11) 38 (118) 57 (127) (34) 49 (17) Depreciation and intangible asset amortization 346 383 412 406 399 729 876 1,547 1,601 1,694 1,846 Amortization of deferred subscriber acquisition costs 48 47 45 42 39 95 76 182 173
163 143 Amortization of deferred subscriber acquisition revenue (76) (72) (68) (64) (58) (148) (112) (280) (263) (244) (206) Share-based compensation expense 12 16 17 17 17 27 33 61 67 67 65 Merger, restructuring, integration, and other 18 18 19 6
(4) 36 (3) 61 39 22 9 (1) Goodwill impairment 181 242— 201— 423— 624 443 201— Loss on extinguishment of debt— 2————— 2 2— 37 (2) Change in fair value of other financial
instruments—— (94) 158——— 63 63 63— Radio conversion costs, net (1) (1) (3) (4) 1—— (10) (8) 3 102 (3) Acquisition-related adjustments 1 2 (1) (1) 1 3 38— 1 35 52 (4) Other, net 1— 3 1
(9)— 3 5 (5) (4) (12) Adjusted EBITDA $ 651 $ 625 $ 629 $ 620 $ 597 $ 1,276 $ 1,198 $ 2,525 $ 2,471 $ 2,447 $ 2,327 Selling (incl. Commissions) and Advertising 120 120 113 123 124 239 254 476 481 490 528 Installations costs 194 169 178 161 142
363 281 703 650 620 576 Installation revenue (253) (222) (214) (202) (182) (475) (360) (891) (821) (776) (715) Adjusted EBITDA prior to subscriber acquisition $ 712 $ 692 $ 705 $ 703 $ 682 $ 1,404 $ 1,374 $ 2,812 $ 2,781 $ 2,782 $ 2,716 less:
Commercial Adjusted EBITDA $ 158 Adjusted EBITDA excluding Commercial Adjusted EBITDA $ 2,367 Net income (loss) to total revenue ratio 6% (7)% 9% (10)% 6% (1)% 5% (1)% (1)% 2%—% Adjusted EBITDA Margin (as percentage of total revenue) 41% 39%
38% 39% 37% 40% 38% 39% 38% 38% 40% Total revenue 1,593 1,612 1,645 1,604 1,601 3,205 3,146 6,455 6,463 6,395 5,844 Note: Amounts may not sum due to rounding. 1. Represents goodwill impairment charges related to the Solar reporting unit. 2. In
connection with the State Farm investment, amounts represent the change in fair value of a contingent forward purchase contract related to the tender offer during 2022. 27 3. Primarily represents amortization of the customer backlog intangible asset
during Q1 2022 related to the ADT Solar Acquisition. 4. During Q2 2022, primarily represents the gain on sale of a business of $10M.

GAAP to Non-GAAP Reconciliations Free Cash Flow, Adjusted Free Cash
Flow, Adjusted Free Cash Flow including interest rate swaps, and Reconciliation to GAAP Net Cash Flows from Operating Activities We define Free Cash Flow as cash flows from operating activities less cash outlays related to capital expenditures. We
define capital expenditures to include accounts purchased through our network of authorized dealers or third parties outside of our authorized dealer network, subscriber system asset expenditures, and purchases of property and equipment. These items
are subtracted from cash flows from operating activities because they represent long-term investments that are required for normal business activities. We define Adjusted Free Cash Flow as Free Cash Flow adjusted for net cash flows related to (i)
net proceeds from our consumer receivables facility; (ii) financing and consent fees; (iii) restructuring and integration; (iv) integration-related capital expenditures; (v) radio conversion costs net of any related incremental revenue collected;
and (vi) other payments or receipts that may mask our operating results or business trends. Adjusted Free Cash Flow including interest rate swaps reflects Adjusted Free Cash Flow plus net cash settlements on interest rate swaps presented within net
cash provided by (used in) financing activities. We believe the presentations of these non-GAAP measures are appropriate to provide investors with useful information about our ability to repay debt, make other investments, and pay dividends. We
believe the presentation of Adjusted Free Cash Flow is also a useful measure of our cash flow attributable to our normal business activities, inclusive of the net cash flows associated with the acquisition of subscribers, as well as our ability to
repay other debt, make other investments, and pay dividends. Further, Adjusted Free Cash Flow including interest rate swaps is a useful measure of Adjusted Free Cash Flow inclusive of all cash interest. There are material limitations to using these
non-GAAP measures. These non-GAAP measures adjust for cash items that are ultimately withinmanagement’s discretion to direct, and therefore, may imply that there is less or more cash available than the most comparable GAAP measure. These
non-GAAP measures are not intended to represent residual cash flow for discretionary expenditures since debt repayment requirements and other non-discretionary expenditures are not deducted. Twelve Months (in millions) Three Months Ended Six Months
Ended Ended June 30, 2023 March 31, 2023 December 31, 2022 September 30, 2022 June 30, 2022 June 30, 2023 June 30, 2022 June 30, 2023 Net cash provided by (used in): Operating activities $ 493 $ 307 $ 567 $ 498 $ 515 $ 799 $ 823 $ 1,865 Investing
activities $ (319) $ (336) $ (324) $ (401) $ (402) $ (655) $ (807) $ (1,380) Financing activities $ (217) $ (41) $ 71 $ (93) $ (85) $ (258) $ 7 $ (280) Net cash provided by (used in) operating activities $ 493 $ 307 $ 567 $ 498 $ 515 $ 799 $ 823 $
1,865 Dealer generated customer accounts and bulk account purchases (136) (116) (121) (159) (157) (252) (342) (532) Subscriber system asset expenditures (161) (159) (162) (194) (196) (320) (379) (676) Purchases of property and equipment (30) (59)
(41) (48) (49) (89) (88) (178) Free Cash Flow $ 165 $ (28) $ 243 $ 97 $ 112 $ 138 $ 15 $ 477 Net proceeds from receivables facility 28 19 25 38 67 48 93 110 (1) Restructuring and integration payments 7 7 4 6 3 14 6 24 Integration-related capital
expenditures——— 1— 1 1 1 (2) Radio conversion costs, net (1) (1) (6) (2)— (3) 12 (10) (3) Other, net 1 2 3 4 3 3 16 10 Adjusted Free Cash Flow $ 201 $— $ 269 $ 145 $ 185 $ 200 $ 143 $ 615 (4) Interest rate swaps
presented within financing activities 20 16 8 (2) (11) 36 (25) 42 Adjusted Free Cash Flow including interest rate swaps $ 221 $ 16 $ 277 $ 143 $ 174 $ 237 $ 118 $ 657 (5) Memo: Cash interest included above $ 119 $ 195 $ 48 $ 187 $ 61 $ 314 $ 217 $
549 Note: Amounts may not sum due to rounding. 1. During Q1 2023, primarily represents ADT Solar integration costs and CSB restructuring costs. 2. Represents net costs associated with replacing cellular technology used in many of our security
systems pursuant to a replacement program. 3. During Q1 2022, primarily represents costs related to the ADT Solar acquisition. 28 4. Includes net settlements related to interest rate swaps with an other-than-insignificant financing element at
inception, which is presented within net cash provided by (used in) financing activities. 5. Excludes interest on interest rate swaps presented within financing activities.

GAAP to Non-GAAP Reconciliations Adjusted Net Income (Loss), Adjusted
Diluted Net Income (Loss) per Share (or, Adjusted EPS), and Reconciliations to GAAP Net Income (Loss) and GAAP Diluted Net Income (Loss) per Share We define Adjusted Net Income (Loss) as net income (loss) adjusted for (i) merger, restructuring,
integration, and other; (ii) losses on extinguishment of debt; (iii) radio conversion costs net of any related incremental revenue earned; (iv) share-based compensation expense; (v) unrealized gains and losses on interest rate swap contracts not
designated as hedges; (vi) other income/gain or expense/loss items such as changes in fair value of certain financial instruments, impairment charges, financing and consent fees, or acquisition-related adjustments; and (vii) the impact these
adjusted items have on taxes. Adjusted Diluted Net Income (Loss) per share is Adjusted Net Income (Loss) divided by diluted weighted-average shares outstanding of common stock. In periods of GAAP net loss, diluted weighted-average shares outstanding
of common stock does not include the assumed conversion of Class B Common Stock and other potential shares, such as share-based compensation awards, to shares of Common Stock as the results would be anti-dilutive. We believe Adjusted Net Income
(Loss) and Adjusted Diluted Net Income (Loss) per share are benchmarks used by analysts and investors who follow the industry for comparison of its performance with other companies in the industry, although our measures may not be directly
comparable to similar measures reported by other companies. There are material limitations to using these measures, as they do not reflect certain significant items which directly affect our net income (loss) and related per share amounts (the most
comparable GAAP measures). (in millions, except per share data) Three Months Ended Six Months Ended June 30, 2023 March 31, 2023 December 31, 2022 September 30, 2022 June 30, 2022 June 30, 2023 June 30, 2022 Net income (loss) $ 92 $ (119) $ 151 $
(161) $ 92 $ (27) $ 143 Merger, restructuring, integration, and other 18 18 19 6 (4) 36 (3) (1) Goodwill impairment 181 242— 201— 423— (2) Change in fair value of other financial instruments—— (94)
158——— Share-based compensation expense 12 16 17 17 17 27 33 Unrealized (gain) loss on interest rate swaps (55) 33 11 (108) (59) (22) (205) (3) Acquisition-related adjustments 1 2 (1) (1) 1 3 38 Other, net——— (3)
(8)— 3 (4) Tax impact on adjustments (101) (84) (11) (24) 12 (172) 34 Adjusted Net Income (Loss) $ 148 $ 107 $ 91 $ 84 $ 50 $ 255 $ 43 (5) Weighted-average shares outstanding - diluted : Common Stock 917 854 922 850 911 856 911 Class B Common
Stock 55 55 55 55 55 55 55 Net income (loss) per share - diluted: Common Stock $ 0.10 $ (0.10) $ 0.16 $ (0.13) $ 0.10 $ (0.03) $ 0.15 Class B Common Stock $ 0.10 $ (0.10) $ 0.16 $ (0.13) $ 0.10 $ (0.03) $ 0.15 (6) Adjusted Diluted Net Income (Loss)
per share $ 0.16 $ 0.12 $ 0.10 $ 0.10 $ 0.06 $ 0.30 $ 0.05 Note: Amounts may not sum due to rounding. Refer to the reconciliation from Adjusted EBITDA to net income (loss) herein for an explanation of other, net. Adjusted Net Income for Q3 2022, Q4
2022, and Q1 2023 has been restated to reflect the impact of the th restatement previously disclosed in our Form 8-K filed with the SEC on July 10 , 2023. As previously disclosed, there was no impact to Adjusted Diluted Net Income (Loss) per share
as a result of the restatement. 1. Represents goodwill impairment charges related to the Solar reporting unit. 2. In connection with the State Farm investment, amounts represent the change in fair value of a contingent forward purchase contract
related to the tender offer during 2022. 3. Primarily represents amortization of the customer backlog intangible asset related to the ADT Solar Acquisition during Q1 2022. 4. Represents the statutory rate, inclusive of the federal statutory rate,
which reflects the tax impact of our filing posture in combined, unitary, and separate reporting states. Our state tax profile varies by state. 5. Refer to the Company’s Quarterly Reports on Form 10-Q and Annual Reports on Form 10-K for
further discussion regarding the computation of diluted weighted-average shares outstanding of common stock. 29 6. Calculated as Adjusted Net Income (Loss) divided by diluted weighted-average shares outstanding of Common Stock.

GAAP to Non-GAAP Reconciliations Leverage Ratios and Reconciliation to
GAAP Debt to Net Income (Loss) Leverage Ratio Net Leverage Ratio is calculated as the ratio of net debt to last twelve months(“LTM”) Adjusted EBITDA. Net leverage ratio after divestiture is calculated as the ratio of net debt after
divestiture to LTM Adjusted EBITDA excluding Commercial Adjusted EBITDA. Net debt is calculated as total debt excluding the Receivables Facility, including capital leases, minus cash and cash equivalents. Net debt after divestiture is calculated as
net debt excluding the estimated total debt paydown using the proceeds from the divestiture of the Commercial business.Refer to the discussion on Adjusted EBITDA for descriptions of the differences between Adjusted EBITDA and net income (loss),
which is the most comparable GAAP measure. We believe Net Leverage Ratio is a useful measure of the Company's credit position and progress towards leverage targets. There are material limitations to using Net Leverage Ratio as the Company may not
always be able to use cash to repay debt on a dollar-for-dollar basis. Debt to Net Income (Loss) Leverage Ratio: (in millions) June 30, 2023 March 31, 2023 December 31, 2022 June 30, 2022 Total debt (book value) $ 9,671 $ 9,840 $ 9,829 $ 9,843 LTM
net income (loss) $ (37) $ (38) $ 133 $ (24) Debt to net income (loss) ratio (260.5x) (260.2x) 74.1x (413.4x) First lien debt (book value) $ 8,564 LTM net income (loss) $ (37) First lien debt to net income (loss) ratio (230.7x) Leverage Ratios: (in
millions) June 30, 2023 March 31, 2023 December 31, 2022 June 30, 2022 Revolver $— $— $— $ 80 First lien term loans 3,358 3,323 2,730 2,744 First lien and ADT notes 4,700 4,950 5,550 5,550 Receivables facility 403 374 355 292
Finance leases and other 104 94 97 98 Total first lien debt $ 8,564 $ 8,741 $ 8,732 $ 8,763 Second lien notes 1,300 1,300 1,300 1,300 (1) Total debt $ 9,864 $ 10,041 $ 10,032 $ 10,063 Less: Cash and cash equivalents (146) (186) (257) (44) Less:
Receivables Facility (403) (374) (355) (292) Net debt $ 9,315 $ 9,481 $ 9,420 $ 9,728 Less: total debt paydown after divestiture (1,500) Net debt after divestiture $ 7,815 Add: total debt paydown after divestiture 1,500 Less: Second lien notes
(1,300) Net first lien debt $ 8,015 LTM Adjusted EBITDA $ 2,525 $ 2,471 $ 2,447 $ 2,327 Net leverage ratio 3.7x 3.8x 3.9x 4.2x Net first lien leverage ratio 3.2x LTM Adjusted EBITDA prior to subscriber acquisition $ 2,812 $ 2,781 $ 2,782 $ 2,716 Net
leverage ratio prior to subscriber acquisition 3.3x 3.4x 3.4x 3.6x Net first lien leverage ratio prior to subscriber acquisition 2.9x Annualized RMR $ 4,587 $ 4,538 $ 4,490 $ 4,425 RMR Ratio 2.0x 2.1x 2.1x 2.2x LTM Adjusted EBITDA excluding
Commercial Adjusted EBITDA $ 2,367 Net leverage ratio excluding Commercial Adjusted EBITDA 3.3x 30 Note: Amounts may not sum due to rounding. 1. Debt instruments are stated at face value.

GAAP to Non-GAAP Reconciliations Commercial Adjusted EBITDA including
estimated allocation of certain corporate costs Commercial Adjusted EBITDA is our segment profit measure presented in accordance with ASC 280. We believe the presentation of Commercial Adjusted EBITDA including the estimated allocation of certain
corporate costs provides useful information to investors related to the divestiture of the commercial business. Management uses this measure to evaluate the benefit from the divestiture. Twelve Months Ended (in millions) June 30, 2023 Purchase Price
(EV) $ 1,613 Commercial Adjusted EBITDA $ 158 Estimated allocation of corporate costs (14) Commercial Adjusted EBITDA including estimated corporate costs $ 144 EV/Commercial Adjusted EBITDA 10.2x Impact from the estimated allocation of corporate
costs 1.0x EV/Commercial Adjusted EBITDA including estimated corporate costs 11.2x 31 Note: Amounts may not sum due to rounding.
v3.23.3
| X |
- DefinitionBoolean flag that is true when the XBRL content amends previously-filed or accepted submission.
| Name: |
dei_AmendmentFlag |
| Namespace Prefix: |
dei_ |
| Data Type: |
xbrli:booleanItemType |
| Balance Type: |
na |
| Period Type: |
duration |
|
| X |
- DefinitionFor the EDGAR submission types of Form 8-K: the date of the report, the date of the earliest event reported; for the EDGAR submission types of Form N-1A: the filing date; for all other submission types: the end of the reporting or transition period. The format of the date is YYYY-MM-DD.
| Name: |
dei_DocumentPeriodEndDate |
| Namespace Prefix: |
dei_ |
| Data Type: |
xbrli:dateItemType |
| Balance Type: |
na |
| Period Type: |
duration |
|
| X |
- DefinitionThe type of document being provided (such as 10-K, 10-Q, 485BPOS, etc). The document type is limited to the same value as the supporting SEC submission type, or the word 'Other'.
| Name: |
dei_DocumentType |
| Namespace Prefix: |
dei_ |
| Data Type: |
dei:submissionTypeItemType |
| Balance Type: |
na |
| Period Type: |
duration |
|
| X |
- DefinitionAddress Line 1 such as Attn, Building Name, Street Name
| Name: |
dei_EntityAddressAddressLine1 |
| Namespace Prefix: |
dei_ |
| Data Type: |
xbrli:normalizedStringItemType |
| Balance Type: |
na |
| Period Type: |
duration |
|
| X |
- Definition
+ References
+ Details
| Name: |
dei_EntityAddressCityOrTown |
| Namespace Prefix: |
dei_ |
| Data Type: |
xbrli:normalizedStringItemType |
| Balance Type: |
na |
| Period Type: |
duration |
|
| X |
- DefinitionCode for the postal or zip code
| Name: |
dei_EntityAddressPostalZipCode |
| Namespace Prefix: |
dei_ |
| Data Type: |
xbrli:normalizedStringItemType |
| Balance Type: |
na |
| Period Type: |
duration |
|
| X |
- DefinitionName of the state or province.
| Name: |
dei_EntityAddressStateOrProvince |
| Namespace Prefix: |
dei_ |
| Data Type: |
dei:stateOrProvinceItemType |
| Balance Type: |
na |
| Period Type: |
duration |
|
| X |
- DefinitionA unique 10-digit SEC-issued value to identify entities that have filed disclosures with the SEC. It is commonly abbreviated as CIK. Reference 1: http://www.xbrl.org/2003/role/presentationRef
-Publisher SEC
-Name Exchange Act
-Number 240
-Section 12
-Subsection b-2
| Name: |
dei_EntityCentralIndexKey |
| Namespace Prefix: |
dei_ |
| Data Type: |
dei:centralIndexKeyItemType |
| Balance Type: |
na |
| Period Type: |
duration |
|
| X |
- DefinitionIndicate if registrant meets the emerging growth company criteria. Reference 1: http://www.xbrl.org/2003/role/presentationRef
-Publisher SEC
-Name Exchange Act
-Number 240
-Section 12
-Subsection b-2
| Name: |
dei_EntityEmergingGrowthCompany |
| Namespace Prefix: |
dei_ |
| Data Type: |
xbrli:booleanItemType |
| Balance Type: |
na |
| Period Type: |
duration |
|
| X |
- DefinitionCommission file number. The field allows up to 17 characters. The prefix may contain 1-3 digits, the sequence number may contain 1-8 digits, the optional suffix may contain 1-4 characters, and the fields are separated with a hyphen.
| Name: |
dei_EntityFileNumber |
| Namespace Prefix: |
dei_ |
| Data Type: |
dei:fileNumberItemType |
| Balance Type: |
na |
| Period Type: |
duration |
|
| X |
- DefinitionTwo-character EDGAR code representing the state or country of incorporation.
| Name: |
dei_EntityIncorporationStateCountryCode |
| Namespace Prefix: |
dei_ |
| Data Type: |
dei:edgarStateCountryItemType |
| Balance Type: |
na |
| Period Type: |
duration |
|
| X |
- DefinitionThe exact name of the entity filing the report as specified in its charter, which is required by forms filed with the SEC. Reference 1: http://www.xbrl.org/2003/role/presentationRef
-Publisher SEC
-Name Exchange Act
-Number 240
-Section 12
-Subsection b-2
| Name: |
dei_EntityRegistrantName |
| Namespace Prefix: |
dei_ |
| Data Type: |
xbrli:normalizedStringItemType |
| Balance Type: |
na |
| Period Type: |
duration |
|
| X |
- DefinitionThe Tax Identification Number (TIN), also known as an Employer Identification Number (EIN), is a unique 9-digit value assigned by the IRS. Reference 1: http://www.xbrl.org/2003/role/presentationRef
-Publisher SEC
-Name Exchange Act
-Number 240
-Section 12
-Subsection b-2
| Name: |
dei_EntityTaxIdentificationNumber |
| Namespace Prefix: |
dei_ |
| Data Type: |
dei:employerIdItemType |
| Balance Type: |
na |
| Period Type: |
duration |
|
| X |
- DefinitionLocal phone number for entity.
| Name: |
dei_LocalPhoneNumber |
| Namespace Prefix: |
dei_ |
| Data Type: |
xbrli:normalizedStringItemType |
| Balance Type: |
na |
| Period Type: |
duration |
|
| X |
- DefinitionBoolean flag that is true when the Form 8-K filing is intended to satisfy the filing obligation of the registrant as pre-commencement communications pursuant to Rule 13e-4(c) under the Exchange Act. Reference 1: http://www.xbrl.org/2003/role/presentationRef
-Publisher SEC
-Name Exchange Act
-Number 240
-Section 13e
-Subsection 4c
| Name: |
dei_PreCommencementIssuerTenderOffer |
| Namespace Prefix: |
dei_ |
| Data Type: |
xbrli:booleanItemType |
| Balance Type: |
na |
| Period Type: |
duration |
|
| X |
- DefinitionBoolean flag that is true when the Form 8-K filing is intended to satisfy the filing obligation of the registrant as pre-commencement communications pursuant to Rule 14d-2(b) under the Exchange Act. Reference 1: http://www.xbrl.org/2003/role/presentationRef
-Publisher SEC
-Name Exchange Act
-Number 240
-Section 14d
-Subsection 2b
| Name: |
dei_PreCommencementTenderOffer |
| Namespace Prefix: |
dei_ |
| Data Type: |
xbrli:booleanItemType |
| Balance Type: |
na |
| Period Type: |
duration |
|
| X |
- DefinitionTitle of a 12(b) registered security. Reference 1: http://www.xbrl.org/2003/role/presentationRef
-Publisher SEC
-Name Exchange Act
-Number 240
-Section 12
-Subsection b
| Name: |
dei_Security12bTitle |
| Namespace Prefix: |
dei_ |
| Data Type: |
dei:securityTitleItemType |
| Balance Type: |
na |
| Period Type: |
duration |
|
| X |
- DefinitionName of the Exchange on which a security is registered. Reference 1: http://www.xbrl.org/2003/role/presentationRef
-Publisher SEC
-Name Exchange Act
-Number 240
-Section 12
-Subsection d1-1
| Name: |
dei_SecurityExchangeName |
| Namespace Prefix: |
dei_ |
| Data Type: |
dei:edgarExchangeCodeItemType |
| Balance Type: |
na |
| Period Type: |
duration |
|
| X |
- DefinitionBoolean flag that is true when the Form 8-K filing is intended to satisfy the filing obligation of the registrant as soliciting material pursuant to Rule 14a-12 under the Exchange Act. Reference 1: http://www.xbrl.org/2003/role/presentationRef
-Publisher SEC
-Name Exchange Act
-Section 14a
-Number 240
-Subsection 12
| Name: |
dei_SolicitingMaterial |
| Namespace Prefix: |
dei_ |
| Data Type: |
xbrli:booleanItemType |
| Balance Type: |
na |
| Period Type: |
duration |
|
| X |
- DefinitionTrading symbol of an instrument as listed on an exchange.
| Name: |
dei_TradingSymbol |
| Namespace Prefix: |
dei_ |
| Data Type: |
dei:tradingSymbolItemType |
| Balance Type: |
na |
| Period Type: |
duration |
|
| X |
- DefinitionBoolean flag that is true when the Form 8-K filing is intended to satisfy the filing obligation of the registrant as written communications pursuant to Rule 425 under the Securities Act. Reference 1: http://www.xbrl.org/2003/role/presentationRef
-Publisher SEC
-Name Securities Act
-Number 230
-Section 425
| Name: |
dei_WrittenCommunications |
| Namespace Prefix: |
dei_ |
| Data Type: |
xbrli:booleanItemType |
| Balance Type: |
na |
| Period Type: |
duration |
|
ADT (NYSE:ADT)
Historical Stock Chart
Von Apr 2024 bis Mai 2024

ADT (NYSE:ADT)
Historical Stock Chart
Von Mai 2023 bis Mai 2024
