Intercede Group PLC Half Yearly Report -3-
06 November 2014 - 8:00AM
UK Regulatory
For the period ended 30 September 2014
                                Share    Share     Other  Retained
                              capital  premium  reserves  earnings    Total
                              GBP'000  GBP'000   GBP'000   GBP'000  GBP'000

At 31 March 2014                  487      232     1,508     3,972    6,199
Purchase of own shares              -        -         -     (379)    (379)
Employee share option plan
 charge                             -        -         -        62       62
Employee share incentive
 plan charge                        -        -         -        60       60
Total comprehensive expense         -        -         -     (705)    (705)
                              -------  -------  --------  --------  -------

At 30 September 2014              487      232     1,508     3,010    5,237
                              -------  -------  --------  --------  -------


At 31 March 2013             487  232  1,508  3,530  5,757
Employee share option plan
 charge                        -    -      -     68     68
Total comprehensive income     -    -      -    652    652
                             ---  ---  -----  -----  -----

At 30 September 2013         487  232  1,508  4,250  6,477
                             ---  ---  -----  -----  -----


At 31 March 2013             487  232  1,508  3,530  5,757
Purchase of own shares         -    -      -  (475)  (475)
Employee share option plan
 charge                        -    -      -    136    136
Employee share incentive
 plan charge                   -    -      -      1      1
Total comprehensive income     -    -      -    780    780
                             ---  ---  -----  -----  -----

At 31 March 2014             487  232  1,508  3,972  6,199
                             ---  ---  -----  -----  -----
Consolidated Cash Flow Statement
For the period ended 30 September 2014
                                                 6 months      6 months
                                                    ended         ended  Year ended
                                             30 September  30 September    31 March
                                                     2014          2013        2013
                                                  GBP'000       GBP'000     GBP'000

Cash flows from operating activities
Operating (loss)/profit                           (1,119)           220         318
Depreciation                                           72            55         116
Employee share option plan charge                      62            68         136
Employee share incentive plan charge                   60             -           1
Decrease/(increase) in trade and other
 receivables                                           41         (584)       (795)
(Decrease)/increase in trade and other
 payables                                           (323)           227         721
Increase in deferred revenue                          327           310         221
Interest received                                      31            36          78
                                             ------------  ------------  ----------

Cash (used)/generated from operations               (849)           332         796
Taxation                                              383           396         385
                                             ------------  ------------  ----------

Net cash (used)/generated from operating
 activities                                         (466)           728       1,181
                                             ------------  ------------  ----------


Investing activities
Purchases of property, plant and equipment          (101)          (69)       (229)
                                             ------------  ------------  ----------

Cash used in investing activities                   (101)          (69)       (229)
                                             ------------  ------------  ----------


Financing activities
Purchase of own shares                              (379)             -       (475)
                                             ------------  ------------  ----------

Cash used in financing activities                   (379)             -       (475)
                                             ------------  ------------  ----------


Net (decrease)/increase in cash and
 cash equivalents                                   (946)           659         477
Cash and cash equivalents at the beginning
 of the period                                      7,247         6,770       6,770
                                             ------------  ------------  ----------

Cash and cash equivalents at the end
 of the period                                      6,301         7,429       7,247
                                             ------------  ------------  ----------
Notes to the Accounts
For the period ended 30 September 2012
1 Preparation of the interim financial statements
These interim financial statements have been prepared under IFRS
as adopted by the European Union and on the basis of the accounting
policies set out in the Group's Annual Report for the year ended 31
March 2014.
The Group is not required to apply IAS 34 Interim Financial
Reporting at this time.
These interim financial statements have not been audited and do
not constitute statutory accounts as defined in Section 434 of the
Companies Act 2006. Statutory accounts for the year ended 31 March
2014 have been delivered to the Registrar of Companies. The
Auditors' Report on those accounts was unqualified and did not
contain any statement under Section 498 (2) or (3) of the Companies
Act 2006.
The Interim Report will be mailed to shareholders within the
next few weeks and copies will be available on the website
(www.intercede.com) and at the registered office: Intercede Group
plc, Lutterworth Hall, St Mary's Road, Lutterworth, Leicestershire,
LE17 4PS.
2 Revenue
All of the Group's revenue, operating profits and net assets
originate from operations in the UK. The Directors consider that
the activities of the Group constitute a single business
segment.
The split of revenue by geographical destination of the end
customer can be analysed as follows:
                                     6 months
                 6 months ended         ended  Year ended
                   30 September  30 September    31 March
                           2014          2013        2014
                        GBP'000       GBP'000     GBP'000

UK                          746           353         928
Rest of Europe              815         1,319       2,195
North America             1,628         2,812       5,990
Rest of World               856           130         670
                 --------------  ------------  ----------

                          4,045         4,614       9,783
                 --------------  ------------  ----------


   3   Taxation
Taxation represents the net effect of amounts receivable from
HMRC in respect of research and development claims and US
corporation tax payable. There is no charge for UK corporation tax
due to the availability of losses brought forward from prior
years.
4 (Loss)/earnings per share
The calculations of the (loss)/earnings per ordinary share are
based on the (loss)/profit for the period and the weighted average
number of ordinary shares in issue during each period. The basic
and diluted loss per share are the same as potential dilution
cannot be applied to a loss making period.
                                                                           6 months      6 months
                                                                              ended         ended  Year ended
                                                                       30 September  30 September    31 March
                                                                               2014          2013        2014
                                                                            GBP'000       GBP'000     GBP'000

(Loss)/profit for the period                                                  (705)           652         780
                                                                       ------------  ------------  ----------


                                                                             Number        Number      Number
Weighted average number of shares
 - basic                                                                 48,571,005    48,677,030  48,661,716
                                                           - diluted     50,228,664    50,228,664  50,228,664
                                                                       ------------  ------------  ----------


                                                                              Pence         Pence       Pence
(Loss)/earnings per share -
 basic                                                                       (1.4)p          1.3p        1.6p
                                          - diluted                          (1.4)p          1.3p        1.6p
                                                                       ------------  ------------  ----------
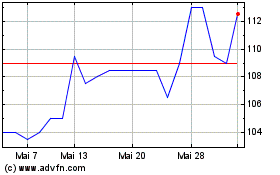
Intercede (LSE:IGP)
Historical Stock Chart
Von Jun 2024 bis Jul 2024

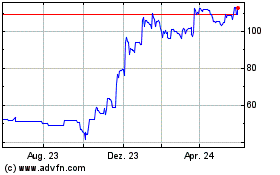
Intercede (LSE:IGP)
Historical Stock Chart
Von Jul 2023 bis Jul 2024
