Optimisim (OP) Records 14% Gains In One Day As Crypto Market Turned Red
24 Februar 2023 - 3:30PM
NEWSBTC
The crypto market is recording some pullbacks today, as many coins
are now red. The global market cap is down by 1.46% in 24 hours,
while the other top three coins, BTC, ETH, and USDT, are all red in
hourly, daily, and weekly values. But amidst these pullbacks,
Optimism (OP) is currently gaining above 8%. As of the time of
writing, OP’s price stands at $3.03. The OP price chart on
Coinmarketcap showed that the coin traded at $2.8 on February 23.
It recorded an intraday high of $3.05 and an intraday low of $2.70
before closing at $2.88. Today, February 24, OP has spiked above $3
after gaining 8%. Even as other coins have lost their 7 days gains
today, OP still holds a 12.48% gain. Moreover, OP trading volume is
also up by 63%, indicating increased activities. Related Reading:
Dogecoin (DOGE) Slips 3% As Major Cryptos Face Significant Losses
Given the price trend that OP has shown today, it’s likely that
some factors are pushing it. So, let’s consider some latest events
on Optimism and how the price may move in the short and long
term. Recent Events On Optimism (OP) Crypto prices react to
developments, market sentiment, macros, and sometimes upgrades. If
the utility of a network increases, more users will join its
community, increasing demand and spiking its prices. In the
case of OP’s recent rally, the price jump could be attributed to
some of the recent developments and the increased utility it
offers. On Thursday, February 23, Coinbase announced the launch of
its Ethereum Layer 2 product Base with Optimism technology.
According to the details, this layer 2 network aims to attract
millions of new crypto users in some years. The project will also
add OP utility, thereby increasing its users. Notably, after the
announcement, the OP price spiked. Another recent activity on the
network is the recent airdrop by Collab.Land. The automated
management tool distributed its COLLAB token on Optimism on
February 23. The management tool integrates into Telegram and
Discord for token-gated communities. According to Coindesk, almost
two million wallets in more than 40,000 NFT-centric communities use
the tool and will likely pay more attention to Optimism now. Other
factors pushing OP’s price include the increased activity on many
of the decentralized applications (DApps) on the blockchain. These
apps include a blogging platform Mirror; a top lending platform
Aave, a yield platform; Pool Together; and derivatives platforms
Perpetual Protocol and Synthetix. The network records increased
recognition and adoption as more people utilized these
applications. OP’s Price Prediction, What Does The Chart
Show? Optimism is trading in the green today on the daily chart,
with a price increase of over 8% within 24 hours. The bulls mounted
sufficient pressure, leading to a golden cross formation on the
daily chart. The coin trades above its 50-day and 200-day Simple
Moving Averages (SMA), confirming the bullish trend. Also, OP has
formed an inverse head and shoulder pattern on the chart, a bullish
signal. Its price has broken above the neckline, an ideal spot for
long (buy) positions. Optimism posted three consecutive
green days with notable higher highs and higher lows, confirming
the uptrend. The Relative Strength Index (RSI) is 63.00 in the buy
zone. Also, the indicator points upwards, suggesting further rise
as it approaches the overbought region of 70. Optimism’s Moving
Average Convergence/Divergence (MACD) is slightly over its signal
line, reflecting a bullish reversal. It will likely rise higher in
the coming days. Optimism’s support levels are $2.36, $2.53, and
$2.71; its resistance levels are $3.06, $3.23, and $3.41. Related
Reading: Bitcoin Price Tries To Reclaim $24,000 As Crypto Market
Trades Sideways OP is currently testing the $3.06 resistance level;
a close above it today will spur more price increases for the
asset. Expect a sustained rally in the coming days before a
possible pullback for consolidation. Note that altcoins are
volatile and might struggle to regain their value after a price
pullback. Also, remember that investments carry certain risks and
should be approached with proper research, technical analysis, and
risk management. Featured image from Pixabay and chart from
TradingView.com
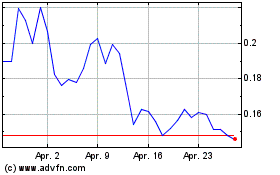
Dogecoin (COIN:DOGEUSD)
Historical Stock Chart
Von Mär 2024 bis Apr 2024

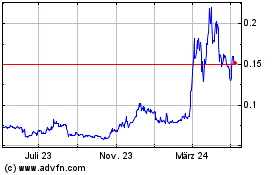
Dogecoin (COIN:DOGEUSD)
Historical Stock Chart
Von Apr 2023 bis Apr 2024
