Currency Exchange International, Corp. (the "Company")
(TSX:CXI)(TSX:CXI.WT.S)(OTCBB:CURN), is pleased to announce its financial
results and present the management's discussion and analysis ("MD&A") for the
three and nine month periods ended June 30, 2013 (all figures are in U.S.
dollars except where otherwise indicated). The complete and detailed financial
statements and MD&A can be found on the Company's SEDAR profile at
www.sedar.com.


Financial Highlights for the Three Month Period Ended June 30, 2013:


--  Revenues increased 21% to $3.8 million in 2013 from $3.2 million for the
    same period in 2013;

--  Operating income increased 62% to $1.1 million from $0.7 million for the
    same quarter in the previous year;

--  Net income increased to $1.5 million for the third quarter of 2013 from
    $0.2 million for the same period in 2012. The increase in net income was
    due primarily to a $0.8 million gain on the fair value change in warrant
    liability and a $0.4 million increase in operating income. The Company's
    warrants are expected to be exercised or expire by September 8,
    2013. Either the exercise or expiration of the warrants will result in
    an additional $0.3 million gain on the fair value change in warrant
    liability; and

--  The Company added 47 new clients representing approximately 2,200
    locations.


The Company's total revenue for the three month period ended June 30, 2013 was
$3.8 million compared to $3.2 million for the three month period ended June 30,
2012. Revenues increased over 33% in Canada compared to the same period of the
previous year while revenues generated in the United States increased by nearly
20%. Certain expenses, including salaries and benefits, stock based compensation
and rent were higher during the period to support the expansion of Currency
Exchange International of Canada Corp. and the Company's branch and client
network.


Financial Highlights for the Nine Month Period Ended June 30, 2013


--  Revenues increased 7% to $9.5 million in 2013 from $8.9 million for the
    same period in 2012;

--  Operating income decreased 15% to $1.8 million from $2.2 million due
    primarily as a result of additional expenses from investments in
    Currency Exchange International of Canada Corp, additional stock based
    compensation. and the opening of additional branch locations compared to
    the same period in the previous year;

--  The Company added 88 new clients representing approximately 2,400
    locations; and

--  The Company added two new retail stores in Seattle, Washington and Ft.
    Lauderdale, Florida.


The Company's revenue for the nine month period ended June 30, 2013 was $9.5
million compared to $8.9 million for the nine months ended June 30, 2012, an
increase of 7%. Revenues increased over 133% in Canada compared to the same
period of the previous year while revenues generated in the United States
remained relatively constant. Certain expenses, including salaries and benefits,
rent, and stock based compensation were higher during the period to support the
expansion of Currency Exchange International of Canada Corp. and the Company's
branch and client network.


Selected Financial Data


For the three                            Operating        Net          Total
months ended                  Revenue       income      income        Assets
(unaudited)                         $            $           $             $
----------------------------------------------------------------------------
June 30, 2013               3,799,683    1,094,456   1,466,835    19,997,719
----------------------------------------------------------------------------
March 31, 2013              2,919,292      435,357    (575,087)   18,709,964
----------------------------------------------------------------------------
December 31, 2012           2,808,053      308,233      80,338    19,929,308
----------------------------------------------------------------------------
September 30, 2012          3,369,548    1,423,083   1,475,426    18,225,628
----------------------------------------------------------------------------
June 30, 2012               3,152,246      676,915     208,542    17,275,581
----------------------------------------------------------------------------
March 31, 2012              3,076,693      631,705     497,415    16,829,379
----------------------------------------------------------------------------
December 31, 2011           2,715,986      831,209     536,269    10,391,386
----------------------------------------------------------------------------
September 30, 2011          2,988,585    1,106,515     483,399     9,914,292
----------------------------------------------------------------------------


For the three                                      Return           Return
months ended                 Total equity       on assets        on equity
(unaudited)                             $               %                %
---------------------------------------------------------------------------
June 30, 2013                  17,607,201             7.3%             8.3%
---------------------------------------------------------------------------
March 31, 2013                 16,255,314            -3.1%            -3.5%
---------------------------------------------------------------------------
December 31, 2012              16,734,553             0.4%             0.5%
---------------------------------------------------------------------------
September 30, 2012             16,226,974             8.1%             9.1%
---------------------------------------------------------------------------
June 30, 2012                  14,711,060             1.2%             1.4%
---------------------------------------------------------------------------
March 31, 2012                 14,478,596             3.0%             3.4%
---------------------------------------------------------------------------
December 31, 2011               6,695,607             5.2%             8.0%
---------------------------------------------------------------------------
September 30, 2011              6,159,338             4.9%             7.9%
---------------------------------------------------------------------------


Seasonality is reflected in the timing of when foreign currencies are in greater
or lower demand. In a normal operating year there is seasonality to the
Company's operations with higher revenues generated from March until September
and lower revenues from October to February. This coincides with peak tourism
seasons in North America when there are generally more travelers entering and
leaving the United States and Canada.


Conference Call

The Company plans to host a conference call on August 6, 2013 at 4:15 PM (EST).
To participate in or listen to the call, please dial the appropriate number:


 Toll Free:                   +1 (855) 336-7594
 Conference ID number:                 27514805


About Currency Exchange International, Corp.

The Company is in the business of providing a range of foreign currency exchange
and related products and services in North America, including the Hawaiian
Islands. Primary products and services include the exchange of foreign
currencies, wire transfer payments, purchase and sale of foreign bank drafts and
international traveler cheques, and foreign cheque clearing. Related products
and services include the licensing of proprietary FX software applications
delivered on its web-based interface, www.ceifx.com ("CEIFX") and licensing
retail foreign currency operations to select companies in agreed locations.


The company's services are provided in Canada by its wholly owned subsidiary
based in Toronto, Canada through the use of its proprietary software
www.ceifx.ca.


CAUTIONARY STATEMENT REGARDING FORWARD-LOOKING INFORMATION

This press release includes forward-looking information within the meaning of
applicable securities laws. This forward-looking information includes, or may be
based upon, estimates, forecasts and statements as to management's expectations
with respect to, among other things, demand and market outlook for wholesale and
retail foreign currency exchange products and services, proposed entry into the
Canadian financial services industry, future growth, the timing and scale of
future business plans, results of operations, performance, and business
prospects and opportunities. Forward-looking statements are identified by the
use of terms and phrases such as "anticipate", "believe", "could", "estimate",
"expect", "intend", "may", "plan", "predict", "preliminary", "project", "will",
"would", and similar terms and phrases, including references to assumptions.


Forward-looking information is based on the opinions and estimates of management
at the date such information is provided, and on information available to
management at such time. Forward-looking information involves significant risks,
uncertainties and assumptions that could cause the Company's actual results,
performance or achievements to differ materially from the results discussed or
implied in such forward-looking information. Actual results may differ
materially from results indicated in forward-looking information due to a number
of factors including, without limitation, the competitive nature of the foreign
exchange industry, currency exchange risks, the need for the Company to manage
its planned growth, the effects of product development and the need for
continued technological change, protection of the Company's proprietary rights,
the effect of government regulation and compliance on the Company and the
industry in which it operates, network security risks, the ability of the
Company to maintain properly working systems, theft and risk of physical harm to
personnel, reliance on key management personnel, global economic deterioration
negatively impacting tourism, volatile securities markets impacting security
pricing in a manner unrelated to operating performance and impeding access to
capital or increasing the cost of capital, and the regulatory approval process
for a new Canadian Schedule I bank, as well as the factors identified throughout
this press release and in the section entitled "Risk Factors" of the Company's
Management's Discussion and Analysis for the year ended September 30, 2012. The
forward-looking information contained in this press release represents
management's expectations as of the date hereof (or as of the date such
information is otherwise stated to be presented), and is subject to change after
such date. The Company disclaims any intention or obligation to update or revise
any forward-looking information whether as a result of new information, future
events or otherwise, except as required under applicable securities laws.


The Toronto Stock Exchange does not accept responsibility for the adequacy or
accuracy of this press release. No stock exchange, securities commission or
other regulatory authority has approved or disapproved the information contained
in this press release.


FOR FURTHER INFORMATION PLEASE CONTACT:
Currency Exchange International, Corp.
Randolph W. Pinna
President, Chief Executive Officer & Director
407.240.0224
Randolph@ceifx.com
www.ceifx.com
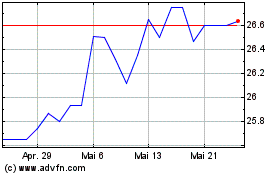
Currency Exchange (TSX:CXI)
Historical Stock Chart
Von Mai 2024 bis Jun 2024

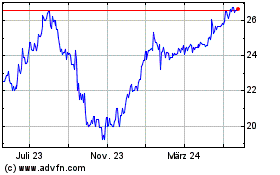
Currency Exchange (TSX:CXI)
Historical Stock Chart
Von Jun 2023 bis Jun 2024
