0001846069False00018460692024-02-272024-02-27
UNITED STATES
SECURITIES AND EXCHANGE COMMISSION
WASHINGTON, D.C. 20549
FORM 8-K
CURRENT REPORT
Pursuant to Section 13 or 15(d) of
the Securities Exchange Act of 1934
Date of Report (Date of Earliest Event Reported): February 27, 2024
Nextdoor Holdings, Inc.
(Exact Name of Registrant as Specified in its Charter)
| | | | | | | | |
| Delaware | 001-40246 | 86-1776836 |
(State or Other Jurisdiction
of Incorporation) | (Commission File Number) | (IRS Employer
Identification No.) |
420 Taylor Street
San Francisco, California
(Address of principal executive offices)
(415) 344-0333
(Registrant’s telephone number, including area code)
N/A
(Former name or former address, if changed since last report)
Check the appropriate box below if the Form 8-K filing is intended to simultaneously satisfy the filing obligation of the registrant under any of the following provisions (see General Instruction A.2. below):
| | | | | |
| ☐ | Written communications pursuant to Rule 425 under the Securities Act (17 CFR 230.425) |
| ☐ | Soliciting material pursuant to Rule 14a-12 under the Exchange Act (17 CFR 240.14a-12) |
| ☐ | Pre-commencement communications pursuant to Rule 14d-2(b) under the Exchange Act (17 CFR 240.14d-2(b)) |
| ☐ | Pre-commencement communications pursuant to Rule 13e-4(c) under the Exchange Act (17 CFR 240.13e-4(c)) |
Securities registered pursuant to Section 12(b) of the Act:
| | | | | | | | |
Title of each class | Trading Symbol | Name of each exchange on which registered |
Class A common stock, par value $0.0001 per share | KIND | New York Stock Exchange |
Indicate by check mark whether the registrant is an emerging growth company as defined in Rule 405 of the Securities Act of 1933 (§230.405 of this chapter) or Rule 12b-2 of the Securities Exchange Act of 1934 ((§240.12b-2 of this chapter).
Emerging growth company ☐
If an emerging growth company, indicate by check mark if the registrant has elected not to use the extended transition period for complying with any new or revised financial accounting standards provided pursuant to Section 13(a) of the Exchange Act. ☐
Item 2.02 Results of Operations and Financial Condition.
On February 27, 2024, Nextdoor Holdings, Inc. (the “Company”) issued a letter to shareholders and press release (together, the “Letter and Press Release”) announcing its financial results for the fourth quarter and full year ended December 31, 2023. The Company also announced that it would be holding a conference call on February 27, 2024 to discuss its financial results. Copies of the Letter and Press Release are furnished as Exhibit 99.1 and Exhibit 99.2, respectively, to this Current Report on Form 8-K.
This information included in this Item 2.02 of this Current Report on Form 8-K and the exhibits hereto are being furnished and shall not be deemed “filed” for purposes of Section 18 of the Securities Exchange Act of 1934, as amended (the “Exchange Act”), or otherwise subject to the liabilities of that section, nor shall it been deemed incorporated by reference in any filing under the Securities Act of 1933, as amended, or the Exchange Act, except as shall be expressly set forth by specific reference in such a filing.
Item 5.02 Departure of Directors or Certain Officers; Election of Directors; Appointment of Certain Officers; Compensatory Arrangements of Certain Officers
(b)
As previously announced by the Company on February 23, 2024, Sarah Friar will resign from her position as the Chief Executive Officer, and President and Chairperson of the Board of Directors (the “Board”) of the Company. The transition will be effective May 8, 2024 (the “Transition Date”). On February 24, 2024, the Board approved a decrease in the authorized number of directors from nine to eight, effective as of the Transition Date. Ms. Friar’s planned departure is not a result of any disagreement regarding the Company’s operations, policies or practices.
In connection with her transition, the Company is expected to enter into a Transition Agreement with Ms. Friar (the “Transition Agreement”), which provides for the following benefits: (i) a lump sum payment equal to six months’ base salary, less applicable state and federal payroll deductions, and (ii) upon her election to continue her existing health benefits under the Consolidated Omnibus Budget Reconciliation Act of 1985, as amended, the Company paying the insurance premium payments for Ms. Friar to continue to receive coverage for twelve months following the Transition Date. The Transition Agreement includes a general release of claims in favor of the Company. The foregoing description of the Transition Agreement is qualified in its entirety by reference to the text of the Transition Agreement, which will be filed as an exhibit to the Company’s Quarterly Report on Form 10-Q for the three months ending March 31, 2024.
(c)
On February 24, 2024, the Board appointed Nirav Tolia as the Company’s Chief Executive Officer, President, and Chairperson of the Board, effective as of the Transition Date. Mr. Tolia will initially serve as the Executive Chair, effective as of March 18, 2024 (the “Initial Appointment Date”).
Mr. Tolia, age 52, has served on the Board since November 2021, and has served as the Executive Chair of Hedosophia, an investor in the Company, since September 2021. Mr. Tolia is a co-founder of Nextdoor, Inc. (“Nextdoor”) and previously served as its Chief Executive Officer from September 2010 to December 2018. Before co-founding Nextdoor, Mr. Tolia was an Entrepreneur in Residence at Benchmark Capital, Chief Operating Officer of Shopping.com, an online shopping website, and Chief Executive Officer and co-founder of Epinions.com Corporation, a consumer review website company. Since December 2019, Mr. Tolia has been primarily engaged as an advisor and investor to early-stage internet companies. Mr. Tolia was named co-founding director of the William S. Spears Institute for Entrepreneurial Leadership in SMU’s Cox School of Business in September 2023. He holds a B.A. in English from Stanford University.
There is no arrangement or understanding between Mr. Tolia and any other persons, pursuant to which Mr. Tolia was selected as an officer, no family relationships among any of the Company’s directors or executive officers and Mr. Tolia, and Mr. Tolia does not have any direct or indirect material interest in any transaction required to be disclosed pursuant to Item 404(a) of Regulation S-K.
In connection with his appointment as Chief Executive Officer, Mr. Tolia and the Company entered into an Offer Letter dated February 26, 2024 (the “Offer Letter”). Pursuant to the Offer Letter, commencing on the Initial Appointment Date Mr. Tolia will receive an initial annual base salary of $500,000, a target annual bonus opportunity of 100% of his base salary, and will be eligible to participate in Company-sponsored benefits to the extent he is eligible pursuant to the terms of the Company’s benefit plans. In addition, Mr. Tolia will be granted a restricted stock unit award covering $10.0 million of the Company’s Class A common stock (the “RSUs”), which will vest quarterly over a four year period. Mr. Tolia will also be granted a performance stock unit award covering $10.0 million of the Company’s Class A common stock (the “PSUs,” and together with the RSUs, the “Equity Awards”). The number of shares subject to the Equity Awards will be determined by dividing $20.0 million by the average of the closing sale price of the Company’s Class A common stock in the calendar month immediately preceding the first of the month in which the Initial Appointment Date occurs and the calendar month in which the Initial Appointment Date occurs. The PSUs will vest based on stock price targets achieved over a four year period, with 25% vesting if the Company achieves 30% stock price growth between the first anniversary of the Initial Appointment Date and the fifth anniversary of the Initial Appointment Date, an additional 25% vesting if the Company achieves 50% stock price growth between the second anniversary of the Initial Appointment Date and the fifth anniversary of the Initial Appointment Date, an additional 25% vesting if the Company achieves 75% stock price growth between the third anniversary of the Initial Appointment Date and the fifth anniversary of the Initial Appointment Date, and an additional 25% vesting if the Company achieves 100% stock price growth between the fourth anniversary of the Initial Appointment Date and the fifth anniversary of the Initial Appointment Date. PSUs that have not vested at the end of the applicable performance period will be forfeited. Achievement of the price targets is based on a 30-trading day average closing selling price of the Company’s Class A common stock. In the event of a change in control transaction, vesting of the PSUs will be based on the price per share payable in the transaction (with any contingent consideration valued by the Board); in the event of a CIC Qualifying Termination (as defined in the Company’s standard form of Change in Control and Severance Agreement) all time-based vesting requirements applicable to the PSUs will accelerate in full. The vesting of the Equity Awards is subject to Mr. Tolia’s continuous employment with the Company as Chief Executive Officer or Executive Chair and other customary provisions to be set forth in an award agreement pursuant to the Company’s 2021 Equity Incentive Plan (the “Plan”). The Equity Awards will be granted pursuant to and in accordance with the terms and conditions of the Plan, which was previously filed with the U.S. Securities and Exchange Commission (the “SEC”).
Mr. Tolia has also entered into the Company’s standard form of Indemnity Agreement and Change in Control and Severance Agreement. The forms of the Indemnity Agreement and Change in Control and Severance Agreement were previously filed by the Company as Exhibits 10.6 and 10.11, respectively, to the Company’s Current Report on Form 8-K filed with the SEC on November 12, 2021, and are incorporated by reference herein.
The foregoing description of the Offer Letter is qualified in its entirety by reference to the full text of the Offer Letter, which will be filed as an exhibit to the Company’s Quarterly Report on Form 10-Q for the three months ending March 31, 2024.
(e)
The information set forth above under 5.02(c) is hereby incorporated by reference into this Item 5.02(e).
Forward-Looking Statements
This Current Report on Form 8-K contains forward-looking statements including, but not limited to, statements related to the Company’s expectations regarding entering into the Transition Agreement with Ms. Friar and the expected Transition Date. These forward-looking statements are based on management’s beliefs and assumptions and on information available to management as of the date they are made. However, investors should not place undue reliance on any such forward-looking statements because they speak only as of the date they are made. The Company does not undertake any obligation to update or revise any forward-looking statements, whether as a result of new information, future events or otherwise, except as required by law. In addition, forward-looking statements are subject to certain risks and uncertainties that could cause actual results, events and developments to differ materially from the Company’s historical experience and its present expectations or projections. These risks and uncertainties include, but are not necessarily limited to, those described in the Company’s filings with the SEC.
Item 9.01 Financial Statements and Exhibits
(d) Exhibits
| | | | | |
| Exhibit Number | Description |
| 99.1 | |
| 99.2 | |
| 104 | Cover Page Interactive Data File (embedded within the Inline XBRL document). |
SIGNATURE
Pursuant to the requirements of the Securities Exchange Act of 1934, the registrant has duly caused this report to be signed on its behalf by the undersigned hereunto duly authorized.
| | | | | | | | |
| NEXTDOOR HOLDINGS, INC. |
| | |
| | |
Date: February 27, 2024 | By: | /s/ Matt Anderson |
| | Matt Anderson |
| | Chief Financial Officer |
Business Highlights

| | | | | | | | |
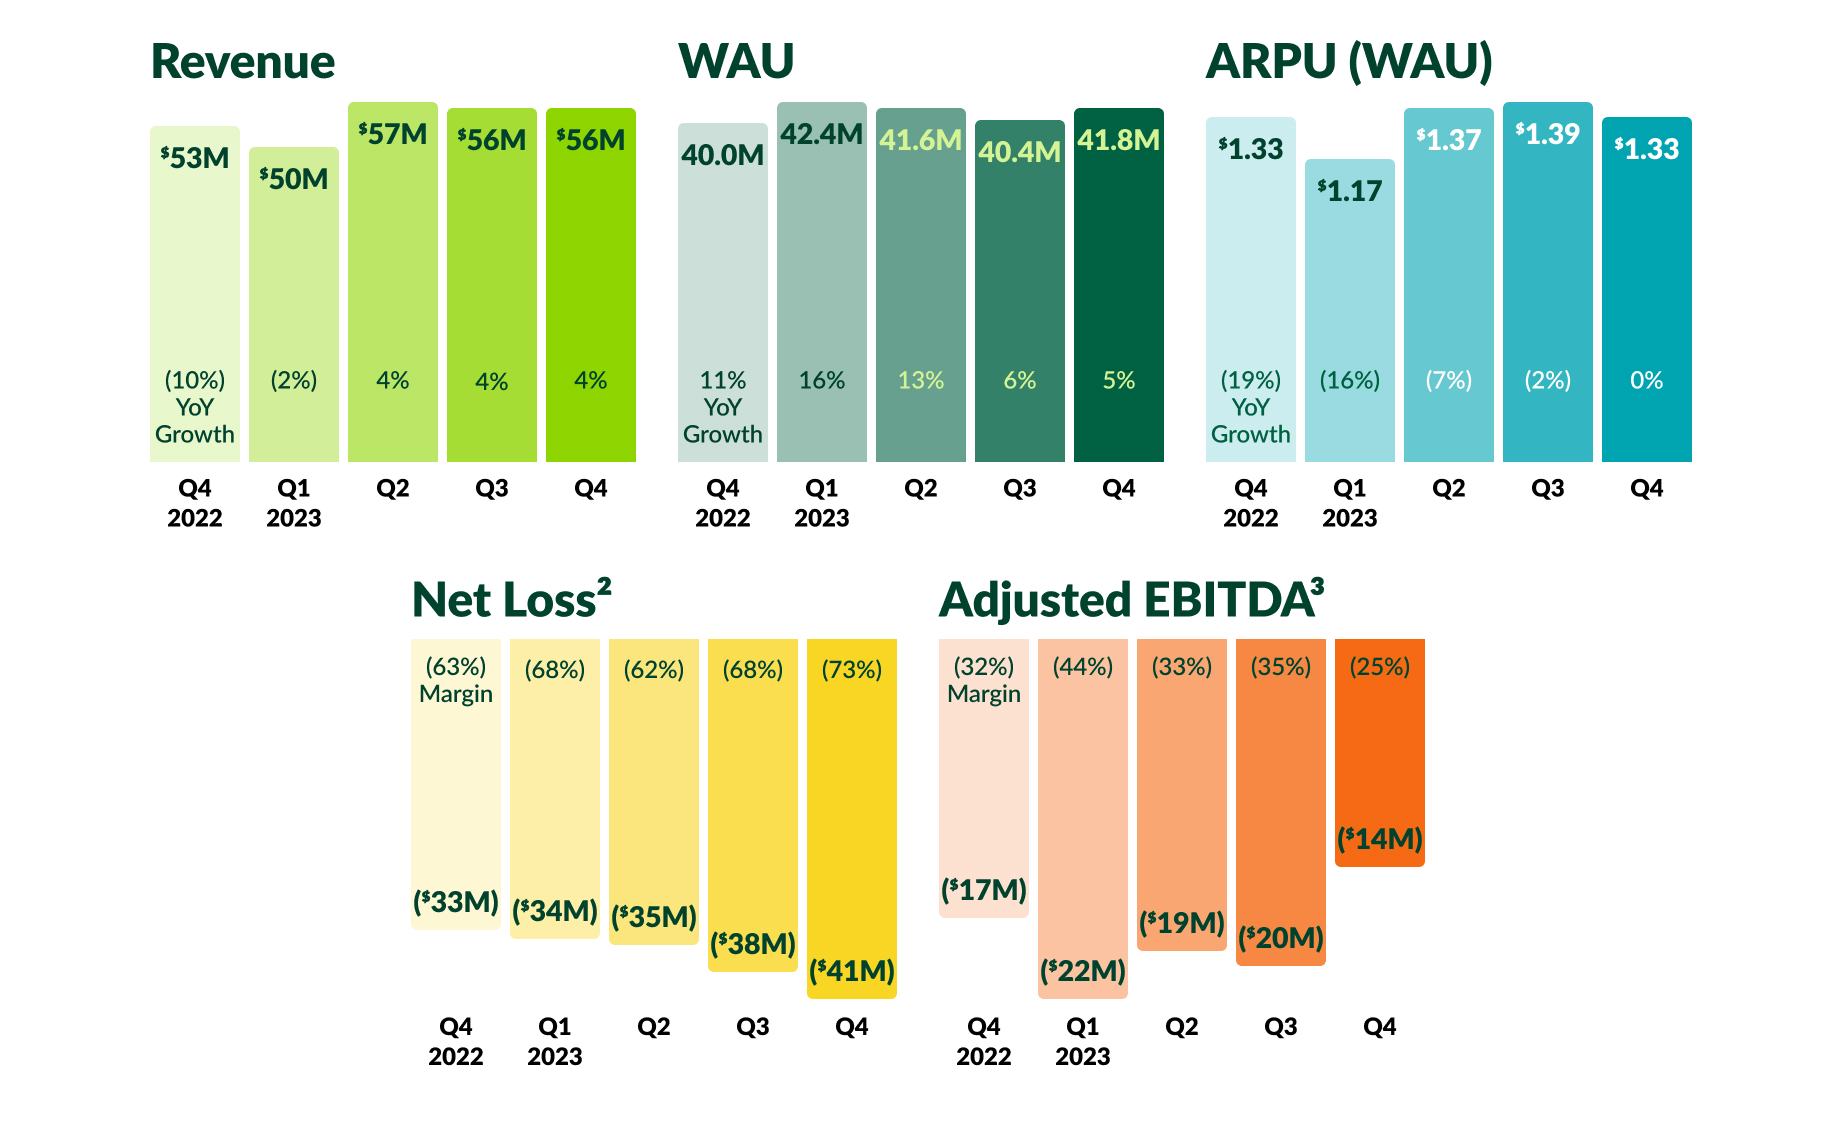
Q4 revenue increased 4% year-over-year to $56M. We saw growth in self-serve revenue, which now exceeds 40% of our revenue, and strong performance in the UK. These areas of progress were partially offset by lower spend from some large US advertisers. We saw a return to year-over-year growth in home services-related spending in Q4, and note momentum in emerging verticals including healthcare and government/non-profit. | Q4 Weekly Active Users (WAU) grew 5% year-over-year and 3% quarter-over-quarter to 41.8 million, and we saw a second straight quarter of record organic Verified Neighbor additions driven by digital invites and neighbor to-neighbor invites, as well as machine learning investments that improved our Feed ranking and notifications. Session depth again hit all-time highs in Q4, continuing our recent progress delivering relevant local content. | Q4 ARPU1 of $1.33 was stable year-over-year. Increases in average spending among small and mid-sized advertisers and improvements in session depth were offset by mixed performance across different enterprise advertisers and verticals. Ad impressions continue to grow at a healthy rate, though were partially offset by a year-over-year decline in US Feed eCPM. |
______________________________
1 ARPU is defined as average revenue per WAU. eCPM is a measure of revenue received for every thousand ad impressions served.
2 Net Loss margin is calculated as Net Loss divided by Revenue.
3 Adjusted EBITDA margin is calculated as Adjusted EBITDA divided by Revenue. A reconciliation of non-GAAP metrics used in this letter to their most comparable GAAP measures is provided at the end of the letter.
To Our Shareholders
Q4 finished with renewed strength. WAU grew to 41.8M, up 5% year-over-year and up 3% sequentially. Q4 Revenue grew 4% year-over-year, and the initial benefits of our recent cost reduction plan contributed to 7 percentage points of year-over-year adjusted EBITDA margin improvement in the quarter.
Q4 performance was largely attributable to the following factors: (1) WAU growth made possible in part by robust organic Verified Neighbor4 growth, which hit a record for the second consecutive quarter, (2) stronger-than-expected impression growth enabled by record session depth5, which grew +36% year-over-year, (3) higher average spend by small and mid-sized advertisers, (4) a return to growth in our home services vertical (+16% year-over-year), and, (5) lower marketing and personnel costs.
We delivered full year revenue growth and margin improvement, but we can do more. Full-year 2023 revenue grew 3% and adjusted EBITDA margins improved by 2 percentage points year-over-year — initial progress that we intend to build upon in 2024. Despite mid-year weakness tied mostly to mixed advertising demand across verticals, we streamlined our organization to better focus on growth and managed our cash position, which totaled $531M at year-end6.
We retained 90% of our top 50 customers from 2022 in 2023. While some larger customers adjusted objectives and reduced spending in 2023, our faster-growing mid-market and SMB customers, many of whom now benefit from our Nextdoor Ads Manager (NAM) and Nextdoor Ad Server (NAS), spent more. This demonstrates that advertisers of all sizes are using Nextdoor and finding increasing value on our platform.
Exposure to specific advertising industry verticals affects our performance. Our top three advertising verticals in FY’23 were home services, retail/quick serve restaurants (QSR), and technology/telecommunications. We recognize the importance of increasing our vertical and advertiser diversification and the smoothing effect it would have on our revenue trajectory, and have already made progress — the revenue contribution from fast-growing emerging verticals including healthcare and government/non-profit more than doubled over the last two years.
AI/ML are essential tools. In 2023, Nextdoor brought generative AI to the neighborhood for the first time. We leverage artificial intelligence (AI) and machine learning (ML) across our platform, deploying these tools to grow our unique local knowledge graph. Those unique data are critical elements in our nascent Nextdoor ads platform and include content, reviews, and behavioral data that businesses can use to reach the most relevant and receptive audiences. AI and ML also allow us to improve notifications, optimize ad delivery, increase engagement with posts, and encourage kind conversations. In short, these capabilities are positively impacting our business today, even at this early stage of deployment.
Our growth algorithm is simple: persistent user and engagement growth, strong new advertiser growth accelerated by improving self-serve capabilities, durable advertiser retention as more demand is delivered on our proprietary ad server, and a reduced cost base to better enable growth and positive free cash flow. We’re excited about our current momentum and future path, and with self-serve contributing more than 40% of total revenue in Q4, we can see progress underway. We have also expanded our share repurchase program as a clear demonstration of long-term confidence and the value we see at our current share price.
______________________________
4 Verified Neighbors are individuals who have joined Nextdoor and completed the verification process for their account.
5 Session depth reflects the number of ad impression opportunities during each user session.
6 Cash position includes cash and cash equivalents and marketable securities.
Outlook & Foundations For Future Growth
FY 2024 and Q1 2024 guidance
The following factors inform our financial guidance and initial expectations for the business this year:
•Users. We expect Q1 WAU to increase quarter-over quarter, driven by continued strong organic Verified Neighbor growth.
•Revenue. We expect further increases in session depth will yield strong growth in ad impression opportunities, positively impacting our full-year revenue growth rate.
•OpEx and Margins. Our expected 2024 year-over-year Adjusted EBITDA margin improvement will be driven largely by savings related to the cost reduction plan implemented in Q4 2023.
•Capital Allocation. Our board has authorized a $150M increase to our share repurchase program, and we intend to repurchase shares at what we believe is currently an attractive valuation level. Through a combination of that increased authorization and our recently implemented net share settlement for our employee RSUs, we expect to limit dilution in 2024 and beyond.
With those factors in mind, our full-year and Q1 2024 financial outlook is as follows:
FY 2024 Outlook
•We expect our FY 2024 revenue growth rate will exceed our FY 2023 revenue growth rate.
•We expect FY 2024 adjusted EBITDA margin will improve by approximately 10 percentage points year-over-year.
Q1 2024 Outlook
•We expect Q1 2024 revenue in a range between $50 million–$51 million.
•We expect Q1 2024 adjusted EBITDA loss will be approximately ($20) million.
Nextdoor entered 2024 with a more streamlined cost structure, a healthy balance sheet, momentum driving top of funnel acquisition and session depth, and clear ad platform milestones. We remain focused on bringing new neighbors to the platform, growing engagement, and building powerful, accessible solutions for advertisers while also ensuring we deliver value for neighbors, advertisers and shareholders.
Neighbor Growth and Engagement
We believe that neighbor growth, as measured by Verified Neighbors and WAU, is very closely tied to our ability to successfully keep the Nextdoor platform inviting and interesting. Through constant improvement and iteration, we strive to ensure that neighbors are able to easily discover and discuss things that matter to them, find ways to exchange goods and services they want or need, and discover a sense of connection and belonging in communities that are part of the Nextdoor platform. Happy neighbors tell their friends about Nextdoor — and that virality drives our user growth and monetization flywheels over time.
User Growth
Our top of funnel acquisition continues to accelerate, and we ended Q4 with more than 88M Verified Neighbors. Substantially all of the nearly 4M net additions in Q4 were organic (i.e. unpaid), and we posted our second consecutive quarter of record organic Verified Neighbor additions, which grew nearly 50% quarter-over-quarter. That performance was ahead of our internal goal and required minimal spending.
Our strong Verified Neighbor growth helped drive WAU to 41.8M at year-end: up 5% year-over-year and up 3% sequentially. Central to our strong WAU performance in Q4 were (1) our digital invites are growing at scale and converting well, (2) neighbor-to-neighbor invites continuing to scale, and (3) more relevant notifications and an improved feed experience that had positive impacts. On WAU, we have continued to see strong follow-through in Q1.
Depth of Engagement
We’ve seen consistent improvement in session depth in recent quarters. Neighbors are scrolling further through their feeds and viewing more content during their sessions, and we continue to optimize those feeds to deliver more relevant, better ranked content. Our 36% increase in session depth during Q4, which was an acceleration from 34% growth in Q3, suggests neighbors are finding that desired content and engaging much more deeply with it than ever before.
Vitality
Ensuring our platform is welcoming is important for long-term neighbor retention and is a key differentiator for our business. Our recently released 2023 Transparency Report summarizes our considerable efforts to support neighborhood vitality. Our analysis shows that while less than half a percent of neighbors generate ~60% of removed content (mostly removed for being disrespectful), those same neighbors also post a significant amount of unreported content that is often positive and useful. For this reason, we remain very focused on developing technology that encourages neighborly interactions and enhances neighborhood vitality, especially during conversations with divergent viewpoints.
Leveraging generative AI has allowed us to better analyze tone and context, and given us the ability to propose more engaging content and kinder content that prevents misunderstandings. We introduced AI into our product in several important ways in 2023:
First, we gave neighbors the ability to use generative AI to help write posts that are more likely to drive positive community engagement. Second, we integrated AI into our long-standing Kindness Reminder feature, taking the traditional Kindness Reminder a step further by suggesting more constructive revisions for comments that may violate our Community Guidelines.
Our efforts are working. In 2023, 36% of neighbors who were shown the AI Kindness Reminder or the traditional Kindness Reminder prior to publishing content that could potentially violate our Community Guidelines chose to edit or withhold their content. Of those who encountered generative AI-revised text, 26% adopted the suggestion. Exposure to the Kindness Reminder and AI Kindness reminder reduced the creation of content that violated our Community Guidelines by 15%. If content that violates our Community Guidelines is posted, we ensure that it is reviewed and moderated quickly and fairly: in 2023, Nextdoor’s nearly 200,000 volunteer community moderators (a key competitive differentiator) posted industry-leading speeds of removing content in a median time of 5.3 hours from time of report to removal.
As highlighted in our 2023 Transparency Report, by utilizing generative AI to foster positive conversations, ensuring fair content moderation, and continuing to develop technology that discourages hurtful and harmful content, we continue to work towards a welcoming environment for neighbors, who post and engage deeply with high quality content and share it with friends and neighbors — many of whom are not yet on the platform.
Engagement-focused Developer Initiatives
In 2023, we rolled out new APIs designed to boost growth and engagement on Nextdoor which, in turn, reinforces the high quality and trusted nature of our platform — and increases its appeal to advertisers.
| | | | | |
In 2023. we also rolled out new APIs designed to boost growth and engagement on Nextdoor which, in turn, reinforces the high quality and trusted nature of our platform — and increases its appeal to advertisers. •Our Share Plugin and Publish APIs drive improved sharing — allowing organizations, public agencies, and businesses to seamlessly share or publish content to Nextdoor. Using our tools, Publish API partners help public agencies automatically schedule, share, and geo-target posts to neighbors. | |
| | | | | |
•Our Display Content APIs allow businesses to connect authentically with customers by sharing content from Nextdoor to their audiences, including recent and top neighborhood posts, local conversations, and events and marketplace listings. Partners including The Weather Channel’s weather.com site and Microsoft Start use the Display Content API to surface timely and trending Nextdoor posts with nearby users’ locations, while partners like Social News Desk seamlessly search for posts that reference keywords important to that community.
Whether via larger-scale rollouts or smaller product enhancements, we continue to invest in product efforts that drive user growth and deepen engagement, with a focus on solutions that improve Nextdoor’s creative, conversion, relevancy, and reporting capabilities. | |
Advertiser Initiatives
With increasing reach and engagement, we enter 2024 in a strong position. Nextdoor has more neighbors who are using the platform longer, are engaged with more relevant content than ever before, and have a high intent to purchase — amplifying the value of our audience to advertisers. Our unique local knowledge graph, combined with demand delivered on our Nextdoor Ad Server, allows us to increasingly use first-party data and insights to help advertisers reach very specific, targeted audiences.
Advertising Platform Development
In 2023, we achieved our stated goal of having 100% of ads from SMB advertisers served via the Nextdoor Ad Server by year-end, and are on track to continue that migration for mid-market and enterprise advertisers in 2024. Completing the development of our advertising platform is a top priority for Nextdoor and an important step in our providing more value to all customers, from local roofers to regional grocery chains to multinational pharmaceutical companies.
Why is this important for Nextdoor? Our Nextdoor ads platform allows us to integrate our first-party data, including neighbor attributes, activity on the platform, and historical interaction with ads, to show neighbors the ads that are most relevant and personalized to them. For advertisers, our main objective is to build a “must-buy” solution for advertisers of all sizes, and the intended outcomes are to: (1) deliver advertiser value, (2) reduce advertiser effort, and (3) enable businesses of all sizes to thrive on Nextdoor.
Advertiser Growth
On Nextdoor Ads Manager, our self-serve solution, we are seeing early evidence that advertisers are embracing our new offering. While the rollout is still in its early days, we are confident that Nextdoor Ads Manager is driving improved product-market fit for Nextdoor advertisers. We are already seeing good uptake from ad agency partners and are excited about unlocking new sources of growth as advertisers of all sizes migrate onto the platform. We also continue to build advertiser awareness of our capabilities.
Advertiser Trends
We saw some encouraging areas of momentum in Q4, but the overall advertising spend environment remains mixed across different-sized advertisers and verticals.
Looking at results by vertical offers a clear view into the mixed advertiser trends we saw in Q4. Acknowledging that we often see significant quarter-to-quarter variability, a return to growth in one of our core verticals, home services (+16% year-over-year), is an encouraging development. We saw positive Q4 momentum in technology/telecommunications, while financial services remained pressured. Smaller verticals that moved the needle less but continue to grow include healthcare and government/non-profit.
We continue to make inroads with advertisers of all sizes. Of particular note in Q4, the number of active mid-market self-serve customers grew sequentially for the third straight quarter, mid-sized advertisers posted jumps in per account spending and higher revenue retention, and we saw meaningful uptake from ad agency partners, who represented nearly 60% of all self-serve spend in Q4.
Large advertiser performance in Q4 again lagged. As these larger customers shift to Nextdoor Ads Manager and Nextdoor Ad Server, our ability to more effectively deliver on performance-focused campaigns will improve.
Advertiser-focused Developer Initiatives
In Q4, we launched the Nextdoor Developer Site, our portal that enables developers to access our newly launched APIs in order to advertise, share, and display content with local audiences. Two of our platform APIs are focused on advertisers and allow them to directly integrate with Nextdoor and improve the reach and efficiency of their advertising campaigns: (1) our Ads API lets advertisers create and update ad campaigns at scale to increase efficiency and monitor campaign performance, and (2) our Conversion API (CAPI) provides advertisers with full visibility into online and offline conversions and allows them to measure the true ROI of their campaigns. Coupling the CAPI with our self-serve Nextdoor Ads Manager enables programmatic ad buying and automated campaign management. This is an important rollout for Nextdoor and a “must have” for advertisers, who recognize the value of our verified users and local knowledge graph, and have already begun to enable and launch campaigns that utilize our new developer API tools.
Q4 2023 Financial Discussion
| | | | | |
Revenue Q4 revenue was $56M, an increase of 4% year-over-year. Results reflect a year-over-year increase in self-serve revenue and international advertisers, offset by reduced spend from certain large US advertisers. We note year-over-year growth in home services, and strong performance in emerging verticals including healthcare and government/non-profit. Global ARPU was approximately flat year-over-year at $1.33. | |
| |
Operating expenses In Q4, GAAP operating expenses were $103M, which included approximately $11M in restructuring costs. The increase was a result of higher research and development costs, modestly higher sales & marketing and general & administrative expenses, as well as a slight increase in cost of revenue.
Cost of revenue was $11M, up 7% year-over-year. The increase was primarily driven by third-party cloud hosting costs. | |
| |
Research and development expenses were $40M, or 72% of revenue, up 26% year-over-year. The growth was driven primarily by increased personnel-related costs, inclusive of $6M in restructuring costs, related to our engineering, data science, and product management teams. Sales and marketing expenses were $32M, or 57% of revenue, up 4% year-over-year. Growth in personnel-related costs for the year, inclusive of $3M in restructuring costs, were partially offset by decreased paid marketing spend for both neighbor and business acquisition. General and administrative expenses were $21M, or 37% of revenue, an increase of 20% year-over-year, driven primarily by an increase in personnel-related costs, inclusive of $2M in restructuring costs, partially offset by a decrease in other expenses. Total non-GAAP operating expenses were $70M, or 125% of revenue, down 1% year-over-year7. |
______________________________ 7 A reconciliation of non-GAAP metrics used in this letter to their most comparable GAAP measures is provided at the end of this letter.
| | | | | |
Earnings Net loss was $41M in Q4 representing a (73)% margin, compared to $33M and a (63)% margin in the year-ago period. An increase in operating loss was partially offset by an increase in interest income. | |
Q4 adjusted EBITDA loss was $14M representing a (25)% margin, compared to $17M and a (32)% margin in the year-ago period. Our Non-GAAP operating expense decline of 1% year-over-year excludes restructuring costs and helped drive margin improvement compared to the year ago period. This non-GAAP expense decline was driven primarily by the cost reduction plan that was announced in the fourth quarter of 2023. | |
Balance sheet and cash flows In Q4, we ended the period with $531M in cash and cash equivalents and marketable securities. Cash used in operations for the year ended December 31, 2023 was $59M compared to $61M in the year-ago period. |
FY 2023 Financial Discussion
2023 revenue was $218M, an increase of 3% year-over-year. 2023 Global ARPU declined 6% year-over-year to $5.25, reflecting continued impressions growth offset by lower pricing year-over-year.
2023 GAAP operating expenses were $391M, an increase of 9% year-over-year, and included $11 million of restructuring costs incurred during Q4. We continue to focus on investing efficiently in research and development and sales & marketing to support of our long-term product and go-to-market initiatives.
Net loss was $148M in 2023, representing a (68)% margin, compared to $138M and a (65)% margin in the prior year.
2023 adjusted EBITDA loss was $74M, representing a (34)% margin, compared to $75M and a (35)% margin in the prior year. Our adjusted EBITDA margin improved as the year progressed, and we posted 2 percentage points of margin improvement for the full year.
Q4 Conference Call and Webcast
We will host a Q&A webcast at 2:00 pm PT/5:00 pm ET today, February 27, 2024, to discuss these results and outlook. An audio webcast archive will be available following the live webcast for approximately one year on Nextdoor’s Investor Relations website at www.investors.nextdoor.com. Thank you for your support in building stronger neighborhoods across the globe and for being active neighbors in your neighborhood. We look forward to your questions and comments this afternoon.
We use our Investor Relations website (investors.nextdoor.com), our X handle (x.com/Nextdoor), our LinkedIn Home Page (linkedin.com/company/nextdoor-com), and Sarah Friar’s LinkedIn posts (linkedin.com/in/sarah-friar-922b044) as a means of disseminating or providing notification of, among other things, news or announcements regarding our business or financial performance, investor events, press releases, and earnings releases and as a means of disclosing material nonpublic information and for complying with our disclosure obligations under Regulation FD. The content of our websites and information that we may post on or provide to online and social media channels, including those mentioned above, and information that can be accessed through our websites or these online and social media channels are not incorporated by reference into this shareholder letter or in any report or document we file with the SEC, and any references to our websites or these online and social media channels are intended to be inactive textual references only.
Safe Harbor Statement
This shareholder letter includes forward-looking statements, which are statements other than statements of historical facts and statements in the future tense. These statements include, but are not limited to, statements regarding our future performance and our market opportunity, including expected financial results for the first quarter of 2024 and full year 2024, trends and expectations regarding our business and operating results, our expectations on Verified Neighbor growth, the expected benefits to our cost reduction plan and share repurchases, our business strategy and plans, and our objectives and future operations, including our expansion into new markets.
Forward-looking statements are based upon various estimates and assumptions, as well as information known to us as of the date of this shareholder letter, and are subject to risks and uncertainties. Accordingly, actual results could differ materially due to a variety of factors, including: our ability to scale our business and monetization efforts; our ability to expand business operations abroad; our limited operating history; risks associated with managing our growth; our ability to achieve and maintain profitability in the future; the effects of the highly competitive market in which we operate; the impact of macroeconomic conditions on our business; our ability to attract new and retain existing customers and users, or renew and expand our relationships with them; our ability to anticipate and satisfy customer preferences; market acceptance of our platform; our ability to successfully develop and timely introduce new products and services; our ability to achieve our objectives of strategic and operational initiatives; cybersecurity risks to our various systems and software; the impact of privacy and data security laws; and other general market, political, economic, and business conditions.
Additional risks and uncertainties that could affect our financial results and business are more fully described in our Annual Report on Form 10-K for the period ended December 31, 2023, which is expected to be filed on or about February 27, 2024, and our other SEC filings, which are available on the Investor Relations page of our website at investors.nextdoor.com and on the SEC’s website at www.sec.gov.
All forward-looking statements contained herein are based on information available to us as of the date hereof and you should not rely upon forward-looking statements as predictions of future events. The events and circumstances reflected in the forward-looking statements may not be achieved or occur. Although we believe that the expectations reflected in the forward-looking statements are reasonable, we cannot guarantee future results, performance, or achievements. We undertake no obligation to update any of these forward-looking statements for any reason after the date of this shareholder letter or to conform these statements to actual results or revised expectations, except as required by law. Undue reliance should not be placed on the forward-looking statements in this shareholder letter.
A Note on Guidance
We have not reconciled our adjusted EBITDA and adjusted EBITDA margin outlook to GAAP net loss or GAAP net loss margin because certain items that impact GAAP net loss and GAAP net loss margin are uncertain or out of our control and cannot be reasonably predicted. In particular, stock-based compensation expense is impacted by the future fair market value of our common stock and other factors, all of which are difficult to predict, subject to frequent change, or not within our control. The actual amount of these expenses during 2024 will have a significant impact on our future GAAP financial results. Accordingly, a reconciliation of adjusted EBITDA outlook to net loss and adjusted EBITDA margin to GAAP net loss margin is not available without unreasonable efforts.
Consolidated Balance Sheets
in thousands, except per share data (unaudited)
| | | | | | | | | | | |
| As of December 31, |
| 2023 | | 2022 |
| | | |
| Assets | | | |
| Current assets: | | | |
| Cash and cash equivalents | $ | 60,233 | | | $ | 55,236 | |
| Marketable securities | 470,868 | | | 528,067 | |
| Accounts receivable, net of allowance of $385 and $422 as of December 31, 2023 and 2022, respectively | 26,233 | | | 29,770 | |
| Prepaid expenses and other current assets | 9,606 | | | 12,185 | |
| Total current assets | 566,940 | | | 625,258 | |
| Restricted cash, non-current | 11,171 | | | — | |
| Property and equipment, net | 8,082 | | | 11,818 | |
| Operating lease right-of-use assets | 56,968 | | | 52,555 | |
| Intangible assets, net | 1,301 | | | 3,067 | |
| Goodwill | 1,211 | | | 1,211 | |
| Other assets | 8,891 | | | 5,653 | |
| Total assets | $ | 654,564 | | | $ | 699,562 | |
| | | |
| Liabilities and Stockholders' Equity | | | |
| Current liabilities: | | | |
| Accounts payable | $ | 1,895 | | | $ | 4,535 | |
| Operating lease liabilities, current | 6,208 | | | 7,766 | |
| Accrued expenses and other current liabilities | 27,308 | | | 22,362 | |
| Total current liabilities | 35,411 | | | 34,663 | |
| Operating lease liabilities, non-current | 60,378 | | | 53,831 | |
| Other liabilities, non-current | 218 | | | — | |
| Total liabilities | 96,007 | | | 88,494 | |
| | | |
| Stockholders' equity: | | | |
| Preferred stock, $0.0001 par value; 50,000 shares authorized; no shares issued or outstanding as of December 31, 2023 and 2022 | — | | | — | |
| Class A Common stock, $0.0001 par value; 2,500,000 shares authorized; 186,415 and 153,693 shares issued and outstanding as of December 31, 2023 and 2022, respectively | 19 | | | 15 | |
| Class B Common stock, $0.0001 par value; 500,000 shares authorized; 201,960 and 218,029 shares issued and outstanding as of December 31, 2023 and 2022, respectively | 20 | | | 22 | |
| Additional paid-in capital | 1,323,595 | | | 1,231,482 | |
| Accumulated other comprehensive income (loss) | 943 | | | (2,196) | |
| Accumulated deficit | (766,020) | | | (618,255) | |
| Total stockholders' equity | 558,557 | | | 611,068 | |
| | | |
| Total liabilities and stockholders' equity | $ | 654,564 | | | $ | 699,562 | |
Consolidated Statements of Operations
in thousands, except per share data (unaudited)
| | | | | | | | | | | | | | | | | | | | | | | |
| Three Months Ended December 31, | | Year Ended December 31, |
| 2023 | | 2022 | | 2023 | | 2022 |
| | | | | | | |
| Revenue | $ | 55,557 | | | $ | 53,270 | | | $ | 218,309 | | | $ | 212,765 | |
| Costs and expenses: | | | | | | | |
| Cost of revenue | 10,539 | | | 9,857 | | | 41,613 | | | 38,981 | |
| Research and development | 40,250 | | | 32,016 | | | 149,998 | | | 127,073 | |
| Sales and marketing | 31,766 | | | 30,494 | | | 122,925 | | | 123,182 | |
| General and administrative | 20,656 | | | 17,234 | | | 76,057 | | | 67,733 | |
| Total costs and expenses | 103,211 | | | 89,601 | | | 390,593 | | | 356,969 | |
| Loss from operations | (47,654) | | | (36,331) | | | (172,284) | | | (144,204) | |
| Interest income | 7,145 | | | 3,957 | | | 25,780 | | | 9,304 | |
| Other income (expense), net | 21 | | | 259 | | | (505) | | | (1,343) | |
| Loss before income taxes | (40,488) | | | (32,115) | | | (147,009) | | | (136,243) | |
| Provision for income taxes | 42 | | | 1,293 | | | 756 | | | 1,673 | |
| Net loss | $ | (40,530) | | | $ | (33,408) | | | $ | (147,765) | | | $ | (137,916) | |
| | | | | | | |
| Net loss per share attributable to Class A and Class B common stockholders, basic and diluted | $ | (0.10) | | | $ | (0.09) | | | $ | (0.39) | | | $ | (0.36) | |
| Weighted average shares used in computing net loss per share attributable to Class A and Class B common stockholders, basic and diluted | 386,438 | | | 370,305 | | | 379,254 | | | 378,731 | |
Consolidated Statements of Cash Flows
in thousands (unaudited)
| | | | | | | | | | | |
| Year Ended December 31 |
| 2023 | | 2022 |
| | | |
| Cash flows from operating activities: | | | |
| Net loss | $ | (147,765) | | | $ | (137,916) | |
| Adjustments to reconcile net loss to net cash used in operating activities: | | | |
| Depreciation and amortization | 5,769 | | | 5,656 | |
| Stock-based compensation | 83,025 | | | 64,420 | |
| Bad debt expense | 46 | | | 71 | |
| Accretion of investments | (8,607) | | | 151 | |
| Other | (347) | | | (2,322) | |
| Changes in operating assets and liabilities: | | | |
| Accounts receivable, net | 3,491 | | | (168) | |
| Prepaid expenses and other assets | 3,399 | | | 3,751 | |
| Operating lease right-of-use assets | 4,694 | | | 6,867 | |
| Accounts payable | (2,640) | | | (1,578) | |
| Operating lease liabilities | (5,676) | | | (7,132) | |
| Accrued expenses and other liabilities | 5,338 | | | 7,697 | |
| Net cash used in operating activities | (59,273) | | | (60,503) | |
| Cash flows from investing activities: | | | |
| Purchases of property and equipment | (267) | | | (3,161) | |
| Purchases of marketable securities | (590,610) | | | (711,887) | |
| Sales of marketable securities | 155,418 | | | 10,789 | |
| Maturities of marketable securities | 504,449 | | | 366,811 | |
| Loan to Opportunity Finance Network | (2,500) | | | (5,000) | |
| Net cash provided by (used in) investing activities | 66,490 | | | (342,448) | |
| Cash flows from financing activities: | | | |
| Proceeds from exercise of stock options, net of repurchases | 7,181 | | | 12,463 | |
| Proceeds from issuance of common stock under employee stock purchase plan | 2,008 | | | 1,430 | |
| Payment of transaction costs related to the Reverse Recapitalization | — | | | (314) | |
| Tax withholdings on release of restricted stock units | (273) | | | (695) | |
| Repurchase of common stock | — | | | (77,232) | |
| Net cash provided by (used in) financing activities | 8,916 | | | (64,348) | |
| Effect of exchange rate changes on cash, cash equivalents, and restricted cash | 35 | | | 723 | |
| Net increase (decrease) in cash, cash equivalents, and restricted cash | 16,168 | | | (466,576) | |
| Cash, cash equivalents, and restricted cash at beginning of period | 55,236 | | | 521,812 | |
| Cash, cash equivalents, and restricted cash at end of period | 71,404 | | | 55,236 | |
| | | |
| | | |
| | | |
| | | |
Non-GAAP Financial Measures
To supplement our consolidated financial statements, which are prepared in accordance with GAAP, we present non-GAAP cost of revenue, non-GAAP research and development, non-GAAP sales and marketing, non-GAAP general and administrative, adjusted EBITDA and adjusted EBITDA Margin in this shareholder letter. Our use of non-GAAP financial measures has limitations as an analytical tool, and these measures should not be considered in isolation or as a substitute for analysis of financial results as reported under GAAP.
We use these non-GAAP financial measures in conjunction with financial measures prepared in accordance with GAAP for planning purposes, including in the preparation of our annual operating budget, as a measure of our core operating results and the effectiveness of our business strategy, and in evaluating our financial performance. These measures provide consistency and comparability with past financial performance, facilitate period-to-period comparisons of core operating results, and also facilitate comparisons with other peer companies, many of which use similar non-GAAP financial measures to supplement their GAAP results. In addition, adjusted EBITDA is widely used by investors and securities analysts to measure a company's operating performance. We exclude the following items from one or more of our non-GAAP financial measures: stock-based compensation expense (non-cash expense calculated by companies using a variety of valuation methodologies and subjective assumptions), depreciation and amortization (non-cash expense), interest income, provision for income taxes, and, if applicable, restructuring charges and acquisition-related costs.
Investors are cautioned that there are material limitations associated with the use of non-GAAP financial measures as an analytical tool. In particular, (1) stock-based compensation expense has recently been, and will continue to be for the foreseeable future, a significant recurring expense for our business and an important part of our compensation strategy, (2) although depreciation and amortization expense are non-cash charges, the assets subject to depreciation and amortization may have to be replaced in the future, and our non-GAAP measures do not reflect cash capital expenditure requirements for such replacements or for new capital expenditure requirements, and (3) adjusted EBITDA does not reflect: (a) changes in, or cash requirements for, our working capital needs; (b) interest expense, or the cash requirements necessary to service interest or principal payments on our debt, which reduces cash available to us; or (c) tax payments that may represent a reduction in cash available to us. The non-GAAP measures we use may be different from non-GAAP financial measures used by other companies, limiting their usefulness for comparison purposes. We compensate for these limitations by providing specific information regarding the GAAP items excluded from these non-GAAP financial measures. A reconciliation of these non-GAAP measures has been provided below:
Non-GAAP Financial Measures
in thousands (unaudited)
| | | | | | | | | | | | | | | | | | | | | | | |
| Three Months Ended December 31 | | Year Ended December 31 |
| 2023 | | 2022 | | 2023 | | 2022 |
| | | | | | | |
| Net loss | $ | (40,530) | | | $ | (33,408) | | | $ | (147,765) | | | $ | (137,916) | |
| % Margin | (73 | %) | | (63 | %) | | (68 | %) | | (65 | %) |
| Depreciation and amortization | $ | 1,413 | | | $ | 1,487 | | | $ | 5,769 | | | $ | 5,656 | |
| Stock-based compensation | 22,290 | | | 17,463 | | | 83,025 | | | 64,420 | |
| Interest income | (7,145) | | | (3,957) | | | (25,780) | | | (9,304) | |
| Provision for income taxes | 42 | | | 1,293 | | | 756 | | | 1,673 | |
| Restructuring charges | 9,888 | | | — | | | 9,888 | | | — | |
| Adjusted EBITDA | $ | (14,042) | | | $ | (17,122) | | | $ | (74,107) | | | $ | (75,471) | |
| % Margin | (25 | %) | | (32 | %) | | (34 | %) | | (35 | %) |
| Cost of Revenue Reconciliation: | | | | | | | |
| Cost of Revenue, GAAP | $ | 10,539 | | | $ | 9,857 | | | $ | 41,613 | | | $ | 38,981 | |
| Stock-based compensation | (889) | | | (721) | | | (3,201) | | | (2,627) | |
| Cost of Revenue, Non-GAAP | $ | 9,650 | | | $ | 9,136 | | | $ | 38,412 | | | $ | 36,354 | |
| % of revenue, GAAP | 19 | % | | 19 | % | | 19 | % | | 18 | % |
| % of revenue, Non-GAAP | 17 | % | | 17 | % | | 18 | % | | 17 | % |
| Research and Development Reconciliation: | | | | | | | |
| Research and Development, GAAP | $ | 40,250 | | | $ | 32,016 | | | $ | 149,998 | | | $ | 127,073 | |
| Stock-based compensation | (11,815) | | | (9,653) | | | (43,619) | | | (35,567) | |
| Depreciation and amortization | (475) | | | (508) | | | (1,961) | | | (1,951) | |
| Restructuring charges | (5,141) | | | — | | | (5,141) | | | — | |
| Research and Development, Non-GAAP | $ | 22,819 | | | $ | 21,855 | | | $ | 99,277 | | | $ | 89,555 | |
| % of revenue, GAAP | 72 | % | | 60 | % | | 69 | % | | 60 | % |
| % of revenue, Non-GAAP | 41 | % | | 41 | % | | 45 | % | | 42 | % |
| Sales and Marketing Reconciliation: | | | | | | | |
| Sales and Marketing, GAAP | $ | 31,766 | | | $ | 30,494 | | | $ | 122,925 | | | $ | 123,182 | |
| Stock-based compensation | (3,408) | | | (2,543) | | | (12,548) | | | (10,160) | |
| Depreciation and amortization | (767) | | | (782) | | | (3,110) | | | (3,001) | |
| Restructuring charges | (2,984) | | | — | | | (2,984) | | | — | |
| Sales and Marketing, Non-GAAP | $ | 24,607 | | | $ | 27,169 | | | $ | 104,283 | | | $ | 110,021 | |
| % of revenue, GAAP | 57 | % | | 57 | % | | 56 | % | | 58 | % |
| % of revenue, Non-GAAP | 44 | % | | 51 | % | | 48 | % | | 52 | % |
| General and Administrative Reconciliation: | | | | | | | |
| General and Administrative, GAAP | $ | 20,656 | | | $ | 17,234 | | | $ | 76,057 | | | $ | 67,733 | |
| Stock-based compensation | (6,178) | | | (4,546) | | | (23,657) | | | (16,066) | |
| Depreciation and amortization | (171) | | | (197) | | | (698) | | | (704) | |
| Restructuring charges | (1,763) | | | — | | | (1,763) | | | — | |
| General and Administrative, Non-GAAP | $ | 12,544 | | | $ | 12,491 | | | $ | 49,939 | | | $ | 50,963 | |
| % of revenue, GAAP | 37 | % | | 32 | % | | 35 | % | | 32 | % |
| % of revenue, Non-GAAP | 23 | % | | 23 | % | | 23 | % | | 24 | % |
| Total Operating Expenses Reconciliation: | | | | | | | |
| Operating Expenses, GAAP | $ | 103,211 | | | $ | 89,601 | | | $ | 390,593 | | | $ | 356,969 | |
| Stock-based compensation | (22,290) | | | (17,463) | | | (83,025) | | | (64,420) | |
| Depreciation and amortization | (1,413) | | | (1,487) | | | (5,769) | | | (5,656) | |
| Restructuring charges | (9,888) | | | — | | | (9,888) | | | — | |
| Total Operating Expenses, Non-GAAP | $ | 69,620 | | | $ | 70,651 | | | $ | 291,911 | | | $ | 286,893 | |
| % of revenue, GAAP | 186 | % | | 168 | % | | 179 | % | | 168 | % |
| % of revenue, Non-GAAP | 125 | % | | 133 | % | | 134 | % | | 135 | % |
Nextdoor Reports Fourth Quarter and Full Year 2023 Results
•Added record number of organic Verified Neighbors for the second consecutive quarter; Exceeded 88M Verified Neighbors at year-end 2023
•Q4 WAU of 41.8M increased +5% year-over-year and +3% quarter-over-quarter, with further growth expected in Q1
•Board approved a $150M increase to existing share repurchase program
SAN FRANCISCO, CA, February 27, 2024 — Nextdoor Holdings, Inc. (NYSE: KIND) today announced results for the fourth quarter and full year ended December 31, 2023.
"Nextdoor ended the year with renewed strength and positive momentum. Fourth quarter Weekly Active Users (WAU) grew 5% year-over-year and 3% sequentially, organic Verified Neighbor growth set a record for the second consecutive quarter, and we saw initial benefits from our recent cost reductions," said Nextdoor CEO Sarah Friar.
"We delivered full year 2023 revenue growth and Adjusted EBITDA margin improvement, and enter 2024 with a streamlined cost structure, $531 million of cash and investments on our balance sheet, user growth momentum, and progress against our ad platform milestones. Our recently announced $150 million increase to our existing share repurchase program is further demonstration of our long-term confidence."
Nextdoor's highlighted metrics for the fourth quarter ended December 31, 2023 include:
•Total Weekly Active Users (WAU) of 41.8 million increased 5% year-over-year.
•Revenue of $55.6 million increased 4% year-over-year.
•Net loss was $40.5 million, compared to $33.4 million in the year-ago period.
•Adjusted EBITDA loss was $14.0 million, compared to $17.1 million in the year-ago period, and reflecting 7 percentage points of year-over-year adjusted EBITDA margin improvement.
Nextdoor's highlighted metrics for the year ended December 31, 2023 include:
•Total Weekly Active Users (WAU) increased 9% year-over-year.
•Revenue of $218.3 million increased 3% year-over-year.
•Net loss was $147.8 million, compared to $137.9 million in the year-ago period.
•Adjusted EBITDA loss was $74.1 million, compared to $75.5 million in the year-ago period.
•Cash, cash equivalents, and marketable securities were $531.1 million as of December 31, 2023.
On February 23, 2024, Nextdoor announced that its Board of Directors approved an increase to its share repurchase program with authorization to purchase an additional $150 million of its Class A common stock through March 31, 2026.
Nextdoor may repurchase shares of Class A common stock from time to time through open market purchases, in privately negotiated transactions or by other means, including through the
use of trading plans intended to qualify under Rule 10b5-1 under the Securities Exchange Act of 1934, as amended, in accordance with applicable securities laws and other restrictions. The timing and total amount of stock repurchases will depend upon business, economic and market conditions, corporate and regulatory requirements, prevailing stock prices, and other considerations. Nextdoor's share repurchase program may be extended, modified, suspended or discontinued at any time and does not obligate the company to acquire any amount of Class A common stock.
As announced on February 23, 2024, Sarah Friar will resign from her position as the Chief Executive Officer, and President and Chairperson of the Board of Directors of Nextdoor. Ms. Friar will remain at Nextdoor into Q2 2024 to help ensure a smooth transition. Nirav Tolia, co-founder of Nextdoor, will return to the company as Chief Executive Officer, President and Chairperson of the Board. Mr. Tolia will initially serve as the Executive Chair, effective as of March 18, 2024.
For more detailed information on our operating and financial results for the fourth quarter and full year ended December 31, 2023, as well as our outlook, please reference our Shareholder Letter posted to our Investor Relations website located at investors.nextdoor.com.
| | | | | | | | | | | | | | | | | | | | | | | |
| Three Months Ended December 31, | | Year Ended December 31, |
| (in thousands) | 2023 | | 2022 | | 2023 | | 2022 |
| Revenue | $ | 55,557 | | | $ | 53,270 | | | $ | 218,309 | | | $ | 212,765 | |
| Loss from operations | $ | (47,654) | | | $ | (36,331) | | | $ | (172,284) | | | $ | (144,204) | |
| Net loss | $ | (40,530) | | | $ | (33,408) | | | $ | (147,765) | | | $ | (137,916) | |
Adjusted EBITDA(1) | $ | (14,042) | | | $ | (17,122) | | | $ | (74,107) | | | $ | (75,471) | |
(1) The following is a reconciliation of net loss, the most comparable GAAP measure, to adjusted EBITDA for the periods presented above:
| | | | | | | | | | | | | | | | | | | | | | | |
| Three Months Ended December 31, | | Year Ended December 31, |
| (in thousands) | 2023 | | 2022 | | 2023 | | 2022 |
| Net loss | $ | (40,530) | | | $ | (33,408) | | | $ | (147,765) | | | $ | (137,916) | |
| Depreciation and amortization | 1,413 | | | 1,487 | | | 5,769 | | | 5,656 | |
| Stock-based compensation | 22,290 | | | 17,463 | | | 83,025 | | | 64,420 | |
| Interest income | (7,145) | | | (3,957) | | | (25,780) | | | (9,304) | |
| Provision for income taxes | 42 | | | 1,293 | | | 756 | | | 1,673 | |
| Restructuring charges | 9,888 | | | — | | | 9,888 | | | — | |
| Adjusted EBITDA | $ | (14,042) | | | $ | (17,122) | | | $ | (74,107) | | | $ | (75,471) | |
Nextdoor will host a conference call at 2:00 p.m. PT/5:00 p.m. ET today to discuss these results and outlook. A live webcast of our fourth quarter and full year 2023 earnings release call will be available in the Events & Presentations section of Nextdoor’s Investor Relations website located
at investors.nextdoor.com. After the live event, the audio recording for the webcast can be accessed on the same website for approximately one year.
Nextdoor uses its Investor Relations website (investors.nextdoor.com), its X handle (x.com/Nextdoor), its LinkedIn Home Page (linkedin.com/company/nextdoor-com), and Sarah Friar’s LinkedIn posts (linkedin.com/in/sarah-friar-922b044) as a means of disseminating or providing notification of, among other things, news or announcements regarding its business or financial performance, investor events, press releases, and earnings releases, and as a means of disclosing material nonpublic information and for complying with its disclosure obligations under Regulation FD.
Non-GAAP Financial Measures
To supplement our condensed consolidated financial statements, which are prepared in accordance with GAAP, we present certain non-GAAP financial measures, such as Adjusted EBITDA, in this press release. Our use of non-GAAP financial measures has limitations as an analytical tool, and these measures should not be considered in isolation or as a substitute for analysis of financial results as reported under GAAP.
We use non-GAAP financial measures in conjunction with financial measures prepared in accordance with GAAP for planning purposes, including in the preparation of our annual operating budget, as a measure of our core operating results and the effectiveness of our business strategy, and in evaluating our financial performance. Non-GAAP financial measures provide consistency and comparability with past financial performance, facilitate period-to-period comparisons of core operating results, and also facilitate comparisons with other peer companies, many of which use similar non-GAAP financial measures to supplement their GAAP results. In addition, Adjusted EBITDA is widely used by investors and securities analysts to measure a company's operating performance. We exclude the following items from one or more of our non-GAAP financial measures: stock-based compensation expense (non-cash expense calculated by companies using a variety of valuation methodologies and subjective assumptions), depreciation and amortization (non-cash expense), interest income, provision for income taxes, and, if applicable, acquisition-related costs.
Investors are cautioned that there are material limitations associated with the use of non-GAAP financial measures as an analytical tool. In particular, (1) stock-based compensation expense has recently been, and will continue to be for the foreseeable future, a significant recurring expense for our business and an important part of our compensation strategy, (2) although depreciation and amortization expense are non-cash charges, the assets subject to depreciation and amortization may have to be replaced in the future, and our non-GAAP measures do not reflect cash capital expenditure requirements for such replacements or for new capital expenditure requirements, and (3) adjusted EBITDA does not reflect: (a) changes in, or cash requirements for, our working capital needs; (b) interest expense, or the cash requirements necessary to service interest or principal payments on our debt, which reduces cash available to us; or (c) tax payments that may represent a reduction in cash available to us. The non-GAAP measures we use may be different from non-GAAP financial measures used by other companies, limiting their usefulness for comparison purposes. We compensate for these limitations by providing specific information regarding the GAAP items excluded from these non-GAAP financial measures.
About Nextdoor
Nextdoor (NYSE: KIND) is the neighborhood network. Neighbors, businesses of all sizes, and public agencies in more than 330,000 neighborhoods across 11 countries turn to Nextdoor to connect to the neighborhoods that matter to them so that they can thrive. As a purpose-driven company, Nextdoor leverages innovative technology to cultivate a kinder world where everyone has a neighborhood they can rely on — both online and in the real world. Download the app or join the neighborhood at nextdoor.com. For more information and assets, visit nextdoor.com/newsroom.
Contacts
Nextdoor Investor Relations:
John T. Williams
ir@nextdoor.com
or visit investors.nextdoor.com
Nextdoor Media Relations:
Antonia Gray
press@nextdoor.com
v3.24.0.1
| X |
- DefinitionBoolean flag that is true when the XBRL content amends previously-filed or accepted submission.
| Name: |
dei_AmendmentFlag |
| Namespace Prefix: |
dei_ |
| Data Type: |
xbrli:booleanItemType |
| Balance Type: |
na |
| Period Type: |
duration |
|
| X |
- DefinitionFor the EDGAR submission types of Form 8-K: the date of the report, the date of the earliest event reported; for the EDGAR submission types of Form N-1A: the filing date; for all other submission types: the end of the reporting or transition period. The format of the date is YYYY-MM-DD.
| Name: |
dei_DocumentPeriodEndDate |
| Namespace Prefix: |
dei_ |
| Data Type: |
xbrli:dateItemType |
| Balance Type: |
na |
| Period Type: |
duration |
|
| X |
- DefinitionThe type of document being provided (such as 10-K, 10-Q, 485BPOS, etc). The document type is limited to the same value as the supporting SEC submission type, or the word 'Other'.
| Name: |
dei_DocumentType |
| Namespace Prefix: |
dei_ |
| Data Type: |
dei:submissionTypeItemType |
| Balance Type: |
na |
| Period Type: |
duration |
|
| X |
- DefinitionAddress Line 1 such as Attn, Building Name, Street Name
| Name: |
dei_EntityAddressAddressLine1 |
| Namespace Prefix: |
dei_ |
| Data Type: |
xbrli:normalizedStringItemType |
| Balance Type: |
na |
| Period Type: |
duration |
|
| X |
- Definition
+ References
+ Details
| Name: |
dei_EntityAddressCityOrTown |
| Namespace Prefix: |
dei_ |
| Data Type: |
xbrli:normalizedStringItemType |
| Balance Type: |
na |
| Period Type: |
duration |
|
| X |
- DefinitionCode for the postal or zip code
| Name: |
dei_EntityAddressPostalZipCode |
| Namespace Prefix: |
dei_ |
| Data Type: |
xbrli:normalizedStringItemType |
| Balance Type: |
na |
| Period Type: |
duration |
|
| X |
- DefinitionName of the state or province.
| Name: |
dei_EntityAddressStateOrProvince |
| Namespace Prefix: |
dei_ |
| Data Type: |
dei:stateOrProvinceItemType |
| Balance Type: |
na |
| Period Type: |
duration |
|
| X |
- DefinitionA unique 10-digit SEC-issued value to identify entities that have filed disclosures with the SEC. It is commonly abbreviated as CIK. Reference 1: http://www.xbrl.org/2003/role/presentationRef
-Publisher SEC
-Name Exchange Act
-Number 240
-Section 12
-Subsection b-2
| Name: |
dei_EntityCentralIndexKey |
| Namespace Prefix: |
dei_ |
| Data Type: |
dei:centralIndexKeyItemType |
| Balance Type: |
na |
| Period Type: |
duration |
|
| X |
- DefinitionIndicate if registrant meets the emerging growth company criteria. Reference 1: http://www.xbrl.org/2003/role/presentationRef
-Publisher SEC
-Name Exchange Act
-Number 240
-Section 12
-Subsection b-2
| Name: |
dei_EntityEmergingGrowthCompany |
| Namespace Prefix: |
dei_ |
| Data Type: |
xbrli:booleanItemType |
| Balance Type: |
na |
| Period Type: |
duration |
|
| X |
- DefinitionCommission file number. The field allows up to 17 characters. The prefix may contain 1-3 digits, the sequence number may contain 1-8 digits, the optional suffix may contain 1-4 characters, and the fields are separated with a hyphen.
| Name: |
dei_EntityFileNumber |
| Namespace Prefix: |
dei_ |
| Data Type: |
dei:fileNumberItemType |
| Balance Type: |
na |
| Period Type: |
duration |
|
| X |
- DefinitionTwo-character EDGAR code representing the state or country of incorporation.
| Name: |
dei_EntityIncorporationStateCountryCode |
| Namespace Prefix: |
dei_ |
| Data Type: |
dei:edgarStateCountryItemType |
| Balance Type: |
na |
| Period Type: |
duration |
|
| X |
- DefinitionThe exact name of the entity filing the report as specified in its charter, which is required by forms filed with the SEC. Reference 1: http://www.xbrl.org/2003/role/presentationRef
-Publisher SEC
-Name Exchange Act
-Number 240
-Section 12
-Subsection b-2
| Name: |
dei_EntityRegistrantName |
| Namespace Prefix: |
dei_ |
| Data Type: |
xbrli:normalizedStringItemType |
| Balance Type: |
na |
| Period Type: |
duration |
|
| X |
- DefinitionThe Tax Identification Number (TIN), also known as an Employer Identification Number (EIN), is a unique 9-digit value assigned by the IRS. Reference 1: http://www.xbrl.org/2003/role/presentationRef
-Publisher SEC
-Name Exchange Act
-Number 240
-Section 12
-Subsection b-2
| Name: |
dei_EntityTaxIdentificationNumber |
| Namespace Prefix: |
dei_ |
| Data Type: |
dei:employerIdItemType |
| Balance Type: |
na |
| Period Type: |
duration |
|
| X |
- DefinitionLocal phone number for entity.
| Name: |
dei_LocalPhoneNumber |
| Namespace Prefix: |
dei_ |
| Data Type: |
xbrli:normalizedStringItemType |
| Balance Type: |
na |
| Period Type: |
duration |
|
| X |
- DefinitionBoolean flag that is true when the Form 8-K filing is intended to satisfy the filing obligation of the registrant as pre-commencement communications pursuant to Rule 13e-4(c) under the Exchange Act. Reference 1: http://www.xbrl.org/2003/role/presentationRef
-Publisher SEC
-Name Exchange Act
-Number 240
-Section 13e
-Subsection 4c
| Name: |
dei_PreCommencementIssuerTenderOffer |
| Namespace Prefix: |
dei_ |
| Data Type: |
xbrli:booleanItemType |
| Balance Type: |
na |
| Period Type: |
duration |
|
| X |
- DefinitionBoolean flag that is true when the Form 8-K filing is intended to satisfy the filing obligation of the registrant as pre-commencement communications pursuant to Rule 14d-2(b) under the Exchange Act. Reference 1: http://www.xbrl.org/2003/role/presentationRef
-Publisher SEC
-Name Exchange Act
-Number 240
-Section 14d
-Subsection 2b
| Name: |
dei_PreCommencementTenderOffer |
| Namespace Prefix: |
dei_ |
| Data Type: |
xbrli:booleanItemType |
| Balance Type: |
na |
| Period Type: |
duration |
|
| X |
- DefinitionTitle of a 12(b) registered security. Reference 1: http://www.xbrl.org/2003/role/presentationRef
-Publisher SEC
-Name Exchange Act
-Number 240
-Section 12
-Subsection b
| Name: |
dei_Security12bTitle |
| Namespace Prefix: |
dei_ |
| Data Type: |
dei:securityTitleItemType |
| Balance Type: |
na |
| Period Type: |
duration |
|
| X |
- DefinitionName of the Exchange on which a security is registered. Reference 1: http://www.xbrl.org/2003/role/presentationRef
-Publisher SEC
-Name Exchange Act
-Number 240
-Section 12
-Subsection d1-1
| Name: |
dei_SecurityExchangeName |
| Namespace Prefix: |
dei_ |
| Data Type: |
dei:edgarExchangeCodeItemType |
| Balance Type: |
na |
| Period Type: |
duration |
|
| X |
- DefinitionBoolean flag that is true when the Form 8-K filing is intended to satisfy the filing obligation of the registrant as soliciting material pursuant to Rule 14a-12 under the Exchange Act. Reference 1: http://www.xbrl.org/2003/role/presentationRef
-Publisher SEC
-Name Exchange Act
-Section 14a
-Number 240
-Subsection 12
| Name: |
dei_SolicitingMaterial |
| Namespace Prefix: |
dei_ |
| Data Type: |
xbrli:booleanItemType |
| Balance Type: |
na |
| Period Type: |
duration |
|
| X |
- DefinitionTrading symbol of an instrument as listed on an exchange.
| Name: |
dei_TradingSymbol |
| Namespace Prefix: |
dei_ |
| Data Type: |
dei:tradingSymbolItemType |
| Balance Type: |
na |
| Period Type: |
duration |
|
| X |
- DefinitionBoolean flag that is true when the Form 8-K filing is intended to satisfy the filing obligation of the registrant as written communications pursuant to Rule 425 under the Securities Act. Reference 1: http://www.xbrl.org/2003/role/presentationRef
-Publisher SEC
-Name Securities Act
-Number 230
-Section 425
| Name: |
dei_WrittenCommunications |
| Namespace Prefix: |
dei_ |
| Data Type: |
xbrli:booleanItemType |
| Balance Type: |
na |
| Period Type: |
duration |
|
Nextdoor (NYSE:KIND)
Historical Stock Chart
Von Mär 2024 bis Apr 2024

Nextdoor (NYSE:KIND)
Historical Stock Chart
Von Apr 2023 bis Apr 2024
