United-Guardian Reports 1st Quarter Increase in Sales
13 Mai 2020 - 3:00PM

United-Guardian, Inc. (NASDAQ:UG) reported today that net sales for
the first quarter of 2020 increased by 4% over the same quarter
last year, increasing from $3,180,318 in 2019 to $3,322,914 this
year. Net income decreased from $1,222,694 ($0.27 per share) in
2019 to $790,307 ($0.17 per share) this year, which was primarily
due to the decrease in value of the company’s marketable
securities.
Ken Globus, President of United-Guardian,
stated, “Despite the severe impact on the economy of the
coronavirus, our first quarter sales remained strong, and continued
to be so in April. As an “essential business” we have remained in
operation during this coronavirus pandemic, albeit on a reduced and
staggered schedule, and we have been able to maintain production
and continue to fill orders. The decline in net income was due to
the decreased market value of our investments, which resulted from
the substantial stock market decline that occurred during the first
quarter of 2020. As a result of a change in accounting rules in
2018, companies are now required to include in net income any
fluctuations in the market value of their marketable securities,
even though no actual gains or losses are experienced. Had it not
been for that accounting change, our earnings would have been
significantly higher, since our income from operations actually
increased from $1,246,352 to $1,310,576. While it is likely that in
the coming months we could see a decline in sales of our cosmetic
ingredients as the global impact of the coronavirus continues, we
are hopeful that sales of our pharmaceutical and medical products
will remain strong.”
United-Guardian is a manufacturer of cosmetic
ingredients, personal and health care products, pharmaceuticals,
and specialty industrial products.
Contact: Ken Globus(631) 273-0900
NOTE: This press release contains
both historical and "forward-looking statements” within the meaning
of the Private Securities Litigation Reform Act of 1995.
These statements about the company’s expectations or beliefs
concerning future events, such as financial performance, business
prospects, and similar matters, are being made in reliance upon the
“safe harbor” provisions of that Act. Such statements are subject
to a variety of factors that could cause our actual results or
performance to differ materially from the anticipated results or
performance expressed or implied by such forward-looking
statements. For further information about the risks and
uncertainties that may affect the company’s business please refer
to the company's reports and filings with the Securities and
Exchange Commission.
RESULTS FOR THE QUARTERS ENDED MARCH 31,
2020 and MARCH 31, 2019*
STATEMENTS OF INCOME
(UNAUDITED)
| |
|
THREE MONTHS
ENDED MARCH 31, |
|
| |
|
|
2020 |
|
|
2019 |
|
| |
|
|
|
|
|
|
|
| |
Net
Sales |
$ |
3,322,914 |
|
$ |
3,180,318 |
|
| |
|
|
|
|
|
|
|
| |
Costs and
expenses: |
|
|
|
|
|
|
| |
Cost of sales |
|
1,389,331 |
|
|
1,288,345 |
|
| |
Operating expenses |
|
515,275 |
|
|
546,962 |
|
| |
Research and development |
|
107,732 |
|
|
98,659 |
|
| |
Total costs and expenses |
|
2,012,338 |
|
|
1,933,966 |
|
| |
Income from operations |
|
1,310,576 |
|
|
1,246,352 |
|
| |
|
|
|
|
|
|
|
| |
Other (expense) income: |
|
|
|
|
|
|
| |
Investment income |
|
44,067 |
|
|
44,167 |
|
| |
Net (loss) gain on marketable securities |
|
(356,595 |
) |
|
257,194 |
|
| |
Total other (expense) income |
|
(312,528 |
) |
|
301,361 |
|
| |
Income before provision for income taxes |
|
998,048 |
|
|
1,547,713 |
|
| |
|
|
|
|
|
|
|
| |
Provision
for income taxes |
|
207,741 |
|
|
325,019 |
|
| |
|
|
|
|
|
|
|
| |
Net income |
$ |
790,307 |
|
$ |
1,222,694 |
|
| |
|
|
|
|
|
|
|
| |
Earnings
per common share (basic and
diluted) |
$ |
0.17 |
|
$ |
0.27 |
|
| |
|
|
|
|
|
|
|
| |
Weighted average
shares – basic and diluted |
|
4,594,319 |
|
|
4,594,319 |
|
* Additional financial information can be found
at the company’s web site at www.u-g.com.
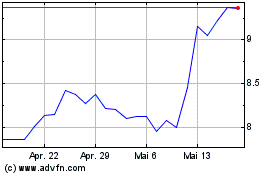
United Guardian (NASDAQ:UG)
Historical Stock Chart
Von Jun 2024 bis Jul 2024

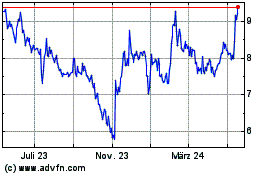
United Guardian (NASDAQ:UG)
Historical Stock Chart
Von Jul 2023 bis Jul 2024
