| 18
NON-GAAP RECONCILIATIONS
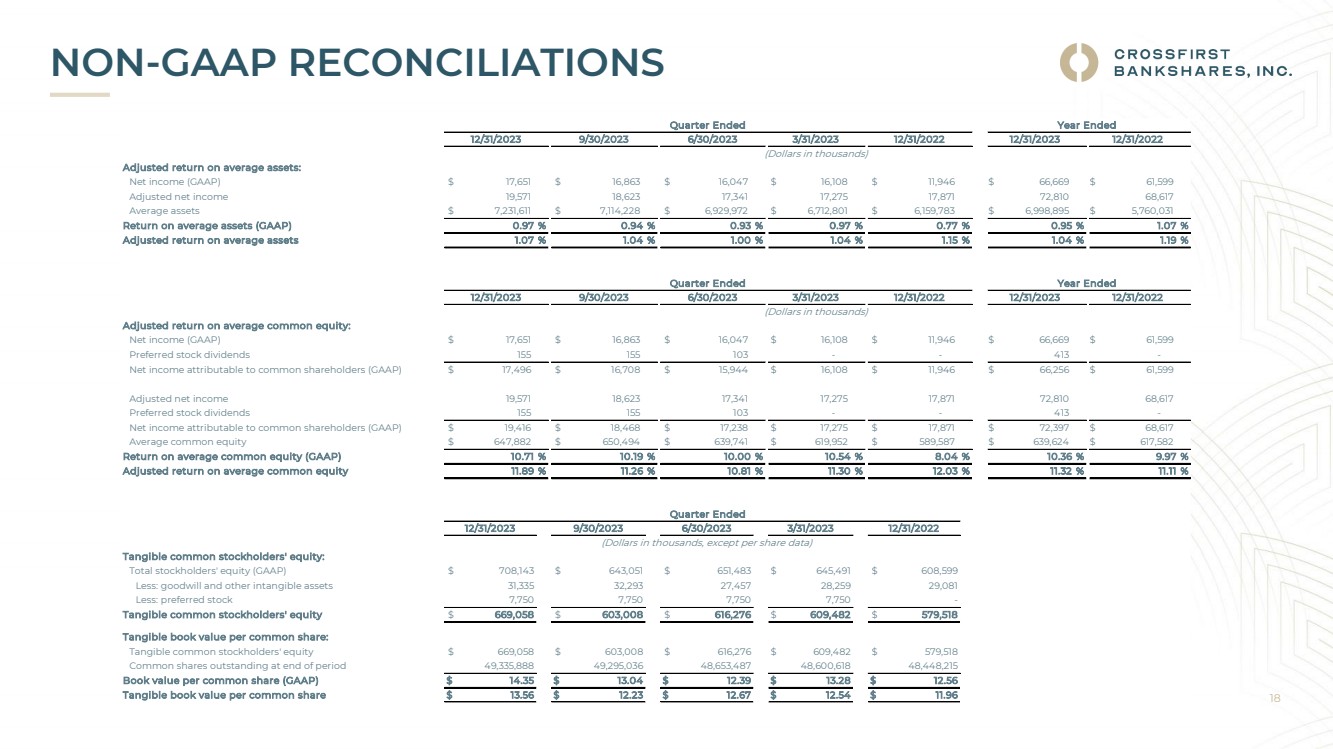
12/31/2023 9/30/2023 6/30/2023 3/31/2023 12/31/2022 12/31/2023 12/31/2022
Adjusted return on average assets:
Net income (GAAP) $ 17,651 $ 16,863 $ 16,047 $ 16,108 $ 11,946 $ 66,669 $ 61,599
Adjusted net income 19,571 18,623 17,341 17,275 17,871 72,810 68,617
Average assets $ 7,231,611 $ 7,114,228 $ 6,929,972 $ 6,712,801 $ 6,159,783 $ 6,998,895 $ 5,760,031
Return on average assets (GAAP) 0.97 % 0.94 % 0.93 % 0.97 % 0.77 % 0.95 % 1.07 %
Adjusted return on average assets 1.07 % 1.04 % 1.00 % 1.04 % 1.15 % 1.04 % 1.19 %
12/31/2023 9/30/2023 6/30/2023 3/31/2023 12/31/2022 12/31/2023 12/31/2022
Adjusted return on average common equity:
Net income (GAAP) $ 17,651 $ 16,863 $ 16,047 $ 16,108 $ 11,946 $ 66,669 $ 61,599
Preferred stock dividends 155 155 103 - - 413 -
Net income attributable to common shareholders (GAAP) $ 17,496 $ 16,708 $ 15,944 $ 16,108 $ 11,946 $ 66,256 $ 61,599
Adjusted net income 19,571 18,623 17,341 17,275 17,871 72,810 68,617
Preferred stock dividends 155 155 103 - - 413 -
Net income attributable to common shareholders (GAAP) $ 19,416 $ 18,468 $ 17,238 $ 17,275 $ 17,871 $ 72,397 $ 68,617
Average common equity $ 647,882 $ 650,494 $ 639,741 $ 619,952 $ 589,587 $ 639,624 $ 617,582
Return on average common equity (GAAP) 10.71 % 10.19 % 10.00 % 10.54 % 8.04 % 10.36 % 9.97 %
Adjusted return on average common equity 11.89 % 11.26 % 10.81 % 11.30 % 12.03 % 11.32 % 11.11 %
Tangible common stockholders' equity:
Total stockholders' equity (GAAP) $ 708,143 $ 643,051 $ 651,483 $ 645,491 $ 608,599
Less: goodwill and other intangible assets 31,335 32,293 27,457 28,259 29,081
Less: preferred stock 7,750 7,750 7,750 7,750 -
Tangible common stockholders' equity $ 669,058 $ 603,008 $ 616,276 $ 609,482 $ 579,518
Tangible book value per common share:
Tangible common stockholders' equity $ 669,058 $ 603,008 $ 616,276 $ 609,482 $ 579,518
Common shares outstanding at end of period 49,335,888 49,295,036 48,653,487 48,600,618 48,448,215
Book value per common share (GAAP) $ 14.35 $ 13.04 $ 12.39 $ 13.28 $ 12.56
Tangible book value per common share $ 13.56 $ 12.23 $ 12.67 $ 12.54 $ 11.96
12/31/2023 9/30/2023 6/30/2023 3/31/2023 12/31/2022
(Dollars in thousands)
Year Ended
(Dollars in thousands)
Quarter Ended
Quarter Ended Year Ended
Quarter Ended
(Dollars in thousands, except per share data) |