VINCI Autoroutes and VINCI Airports traffic in November 2023
14 Dezember 2023 - 5:45PM

VINCI Autoroutes and VINCI Airports traffic in November 2023
Nanterre, 14 December 2023
VINCI Autoroutes and VINCI Airports
traffic in November 2023
I- Change in VINCI
Autoroutes’ intercity networks traffic
| |
November |
YTD at the end of November(11 months) |
|
|
% change 2023/2022 |
% change 2023/2022 |
|
VINCI Autoroutes |
-2.0% |
+1.4% |
|
Light vehicles |
-2.4% |
+1.8% |
|
Heavy vehicles |
+0.1% |
-0.9% |
Traffic across the VINCI Autoroutes network fell
back slightly in November, primarily due to unfavourable calendar
effects (the 11 November falling on a Saturday) and weather
conditions (Storm Ciarán and Storm Domingos at the start of the
month) for light vehicles. However, heavy vehicle traffic remained
stable.
Traffic across all vehicle categories increased
over the first 11 months of the year.
II- Change in VINCI
Airports passenger traffic1
| |
November |
YTD at the end of November (11 months) |
|
|
% change 2023/2022 |
% change 2023/2019 |
% change 2023/2022 |
% change 2023/2019 |
|
VINCI Airports |
+16.1% |
-1.6% |
+27.5% |
-4.7% |
|
Portugal (ANA) |
+8.6% |
+12% |
+20% |
+12% |
|
United Kingdom |
+20% |
-12% |
+25% |
-12% |
|
France |
+7.5% |
-15% |
+14% |
-16% |
|
Serbia |
+40% |
+45% |
+42% |
+27% |
|
Mexico (OMA) |
+2.8% |
+12% |
+17% |
+16% |
|
United States of America |
+4.1% |
-6.5% |
+1.2% |
-4.6% |
|
Dominican Republic (Aerodom) |
+4.2% |
+19% |
+11% |
+17% |
|
Costa Rica |
+18% |
+63% |
+13% |
+33% |
|
Chile (Nuevo Pudahuel) |
+21% |
+11% |
+25% |
-6.0% |
|
Brazil |
-2.9% |
-13% |
+4.6% |
-7.3% |
|
Japan (Kansai Airports) |
+42% |
-12% |
+96% |
-21% |
|
Cambodia2 (Cambodia
Airports) |
+35% |
-43% |
x2.1 |
-48% |
|
Cape Verde |
+13% |
-0.2% |
+20% |
-7.4% |
1 Data at 100%, irrespective of percentage held,
including airport passenger numbers over the full period2 Traffic
data (including historical data) excluding Siem Reap International
Airport, which ceased operations on 15 October 2023
In November, passenger traffic of airports
managed by VINCI Airports was slightly below 2019 levels. However,
the situation differed considerably from one region to another,
with passenger numbers:
- up in Portugal, Serbia and most Latin
American countries;
- down in France, the United Kingdom and
Asia.
III- Change in VINCI
Airports commercial movements (ATM)3
| |
November |
YTD at the end of November (11 months) |
|
|
% change 2023/2022 |
% change 2023/2019 |
% change 2023/2022 |
% change 2023/2019 |
|
VINCI Airports |
+12.2% |
-7.2% |
+13.8% |
-9.3% |
|
Portugal (ANA) |
+6.2% |
+6.3% |
+13% |
+6.4% |
|
United Kingdom |
+20% |
-7.1% |
+18% |
-9.9% |
|
France |
+27% |
-22% |
+8.6% |
-24% |
|
Serbia |
+33% |
+35% |
+27% |
+17% |
|
Mexico (OMA) |
-3.8% |
-11% |
+6.0% |
-9.3% |
|
United States of America |
+10% |
-13% |
-2.1% |
-19% |
|
Dominican Republic (Aerodom) |
+1.1% |
+11% |
+12% |
+10% |
|
Costa Rica |
+19% |
+46% |
+6.3% |
+28% |
|
Chile (Nuevo Pudahuel) |
+20% |
-9.1% |
+20% |
-13% |
|
Brazil |
+1.7% |
-8.9% |
-2.6% |
-5.4% |
|
Japan (Kansai Airports) |
+20% |
-7.2% |
+28% |
-13% |
|
Cambodia4 (Cambodia
Airports) |
+24% |
-49% |
+63% |
-48% |
|
Cape Verde |
+9.0% |
-16% |
+12% |
-22% |
3 Data at 100%, irrespective of percentage held,
including commercial movements over the full period 4 Commercial
movement data (including historical data) excluding Siem Reap
International Airport, which ceased operations on 15 October
2023
About VINCIVINCI is a global player in
concessions, energy and construction, employing 272,000 people
in more than 120 countries. We design, finance, build and
operate infrastructure and facilities that help improve daily life
and mobility for all. Because we believe in all-round performance,
we are committed to operating in an environmentally and socially
responsible manner. And because our projects are in the public
interest, we consider that reaching out to all our stakeholders and
engaging in dialogue with them is essential in the conduct of our
business activities. VINCI’s ambition is to create long-term value
for its customers, shareholders, employees, partners and society in
general. www.vinci.com
This press release is an official information document of the
VINCI Group.
PRESS CONTACTVINCI Press DepartmentTel: +33 (0)1
57 98 62 88media.relations@vinci.com
- CP VINCI_trafic novembre 2023_20231214_VA
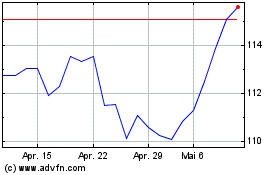
Vinci (EU:DG)
Historical Stock Chart
Von Mär 2024 bis Apr 2024

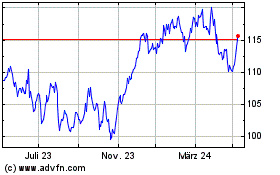
Vinci (EU:DG)
Historical Stock Chart
Von Apr 2023 bis Apr 2024
