Global Bioenergies: net loss reduced to €2.8m in first-half 2024
10 September 2024 - 5:45PM

PRESS RELEASE
Global Bioenergies: net loss reduced to
€2.8min first-half 2024
Net loss reduced to -2.8 M€ compared to
-€4.1 million in H1 2023and -€5.8 million for H1
2022
Gross cash position of €7.7 million as of
30 June 2024vs €11.7 million as of 31 December
2023
Evry, 10 September 2024 – 05:45
p.m.: Global Bioenergies' Board of Directors today
approved the financial statements for the first half of 2024, which
have been audited by the Statutory Auditor.
Samuel Dubruque, Chief Financial
Officer, comments: « Our result is improved compared to
previous years: the half-year loss is limited to €2.8 million, due
in particular to the recording of an operating subsidy for the
Isoprod program financed by ADEME. We started the year with a gross
cash position of €11.7 million, and had a cash position of €7.7
million at 30 June 2024. The first half of the year saw us
consolidate our plant project: improvements in process performance
at pilot scale, receipt of letters of intent exceeding the plant's
production capacity, completion of the basic engineering and
pre-selection of the site in France. One year ago we obtained the
support of the French government with a €16.4 million grant from
Bpifrance. Since then, we have been striving to find additional
debt and equity investors in a particularly adverse climate due to
the political and economic uncertainties that are complicating the
project’s completion. In this context, we are nevertheless pleased
to announce that we have passed the first selection stage of a
European financing package worth a total of €17.5 million for the
financing of this plant, the final result of which is expected in
H1 2025”.
Marc Delcourt, Co-founder and
CEO, adds: “The progress made in our cosmetics plant
project translate directly into the strategic field of SAF
(Sustainable Aviation Fuels). Improved performance and the
identification of a new resource, acetic acid, open the door to the
production of e-SAF via our process, and reaffirm Global
Bioenergies' potential to become a key player in this field of
aviation, which is currently in search of solutions.”
Group Profit & Loss
Account
|
€ thousands |
from 01/01/24to 30/06/246
months |
from 01/01/23to 30/06/236
months |
from 01/01/22to 30/06/226
months |
|
|
|
|
|
| Operating
income |
4.612 |
7,326 |
1,059 |
| Operating
expenses |
7,504 |
11,264 |
6,632 |
|
Operating profit (loss) |
-2,892 |
-3,938 |
-5,573 |
| |
|
|
|
|
EBITDA1 |
-976 |
-3,026 |
-5,024 |
|
Financial profit (loss) |
144 |
23 |
-61 |
| Exceptional
profit (loss) |
-42 |
-169 |
-124 |
| Income tax |
NA |
NA |
NA |
|
|
|
|
|
|
Net profit (loss) |
-2,789 |
-4,084 |
-5,759 |
|
€ thousand |
from 01/01/24to
30/06/20246 months |
from 01/01/23to
30/06/20236 months |
from 01/01/22to
30/06/20226 months |
|
|
|
|
|
|
Operating income |
4,612 |
7,326 |
1,059 |
| |
|
|
|
| Revenue |
339 |
3,102 |
144 |
| Operating
subsidies |
4,091 |
1,184 |
894 |
| Change in the
inventory of finished products |
-263 |
1,917 |
-34 |
|
Other income |
445 |
1,123 |
55 |
Operating income includes recognition of subsidy
income from two projects supported by ADEME: the end of the Isoprod
project validating isobutene derivatives in cosmetics, and subsidy
income from the ongoing Prénidem project.
|
€ thousand |
from 01/01/24to
30/06/20246 months |
from 01/01/23to
30/06/20236 months |
from 01/01/22to
30/06/20226 months |
|
|
|
|
|
|
Operating expenses |
7,504 |
11,264 |
6,632 |
| |
|
|
|
| Staff
costs |
2 231 |
2 194 |
2 309 |
| Average number
of employees (No.) |
45.2 |
47.6 |
47.3 |
|
Industrialisation expenses |
1,191 |
2,687 |
2,597 |
| Change in IBN
and derivatives inventories |
-97 |
2,461 |
-584 |
| Laboratory
costs |
170 |
192 |
185 |
| Rent, servicing
& maintenance |
536 |
518 |
423 |
| Intellectual
property |
178 |
186 |
137 |
| Depreciation,
amortisation and provisions |
2,361 |
2,028 |
559 |
|
Other structural costs |
934 |
997 |
1,006 |
The industrialisation expenses were mainly used
to demonstrate the success of the process scale-up within at our
ARD-operated facilities in Pomacle-Bazancourt.
Group Balance Sheet
|
Assets (€ thousand) |
30/06/24 |
31/12/23 |
31/12/22 |
|
Liabilities (€ thousand) |
30/06/24 |
31/12/23 |
31/12/22 |
|
|
|
|
|
|
|
|
|
|
| Intangible
assets |
204 |
327 |
539 |
|
Capital |
908 |
906 |
749 |
| Tangible
assets |
647 |
2,471 |
3,612 |
|
Share
premium |
|
10,538 |
16,029 |
| Assets under
construction |
394 |
77 |
401 |
|
Balance carried
forward |
-940 |
-2,769 |
-2,708 |
| Financial
assets |
347 |
341 |
1,546 |
|
Profit
(loss) |
-2,789 |
-8,656 |
-11,986 |
| |
|
|
|
|
Equipment subsidies |
2 675 |
2 758 |
463 |
|
|
|
|
|
|
|
|
|
|
|
NON CURRENT ASSETS |
1,591 |
3,217 |
6,097 |
|
EQUITY |
-146 |
2,778 |
2,547 |
|
|
|
|
|
|
|
|
|
|
| IBN and
derivatives inventories |
209 |
219 |
2,342 |
|
PROVISIONS |
210 |
53 |
110 |
| Consumables
inventories |
372 |
350 |
250 |
|
|
|
|
|
|
Receivables |
3,338 |
2,247 |
3,647 |
|
Conditional
advances and loans |
10,443 |
12,451 |
11,486 |
| Cash |
7,515 |
11,673 |
8,768 |
|
Trade
payables |
2,507 |
2,411 |
5,580 |
| Marketable
securities |
171 |
171 |
173 |
|
Tax and social
securities liabilities |
625 |
559 |
502 |
| Prepaid
expenses |
451 |
378 |
300 |
|
Other debts and
deferred income |
8 |
3 |
1,352 |
|
|
|
|
|
|
|
|
|
|
|
CURRENT ASSETS |
12,055 |
15,038 |
15,480 |
|
PAYABLES |
13,583 |
15,423 |
18,921 |
|
|
|
|
|
|
|
|
|
|
|
TOTAL ASSETS |
13,647 |
18,254 |
21,577 |
|
TOTAL LIABILITIES |
13,647 |
18,254 |
21,577 |
Gross cash flow amounts to €7.7 million as of 30
June 2024, compared to €11.7 million as of 31 December 2023.
Highlights of the first half of 2024,
recent events and outlook
-
Technical and commercial progress in the cosmetics plant
project
The first half of the year was marked by
progress made on the technical and commercial aspects of the
project to build a plant with a capacity of 2,500 tonnes/year to
address the cosmetics markets. On the technical side, scale-up
tests demonstrated that performance would hold up well in larger
fermenters, thus confirming the assumptions made in the plant's
business plan. The preliminary design, which was successfully
completed, confirmed the nominal CAPEX of €65 million (i.e. a
maximum CAPEX of around €80 million taking contingencies into
account). On the commercial side, potential customers showed their
interest with letters of intent from several geographies, far
exceeding the plant's production capacity.
-
Development of the technological process for e-SAF
production
Global Bioenergies has successfully extended its
bio-SAF production process to the production of e-SAF in the
laboratory by replacing plant resources with a synthetic resource,
acetic acid. This e-SAF approach stands out for its selectivity of
over 95%, meaning that more than 95% of the molecules resulting
from the process can be marketed as jet fuel. This selectivity
exceeds that of other existing e-SAF technologies.
As a reminder, e-SAFs, produced solely from CO2
and renewable electricity, maximize the decarbonisation potential
of SAF. Bio-SAF and e-SAF are regulated by the European Union's
ReFuelEU Aviation regulation, which imposes dedicated mandates for
these two fuels. By 2030, all aircraft taking off from the European
Union must carry at least 4.8% bio-SAF and 1.2% e-SAF in their fuel
tanks.
About GLOBAL BIOENERGIES
As a committed player in the fight against
global warming, Global Bioenergies has developed a unique process
to produce SAF and e-SAF from renewable resources, thereby meeting
the challenges of decarbonising air transport. Its technology is
one of the very few solutions already certified by ASTM. Its
products also meet the high standards of the cosmetics industry,
and L'Oréal is its largest shareholder with a 13.5% stake. Global
Bioenergies is listed on Euronext Growth in Paris (FR0011052257 -
ALGBE).
Contacts
|
GLOBAL BIOENERGIES+33 (0)1 64 98 20
50invest@global-bioenergies.com Follow our
news Receive information about Global Bioenergies
directly by subscribing to our news feed on
https://www.global-bioenergies.com/inscription-newsletter/ Follow
us on LinkedInGlobal Bioenergies |
|
NewCap – Investor
relationsLouis-Victor DelouvrierAurélie
Manavarereglobalbioenergies@newcap.eu+33 (0)1 44 71 94
94 NewCap – Media relations Nicolas
Merigeauglobalbioenergies@newcap.eu+33 (0)1 44 71 94 98 |
1 EBITDA is calculated as operating income plus
depreciation, amortisation and provisions and minus reversals of
depreciation, amortisation and provisions. It highlights the result
generated by the activity without taking into account the entries
related to the valuation of the asset.
- Global Bioenergies_net loss reduced to €2.8m in first half
2024_EN
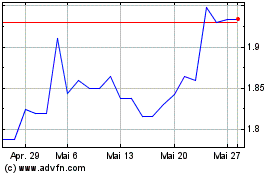
Global Bioenergies (EU:ALGBE)
Historical Stock Chart
Von Dez 2024 bis Jan 2025

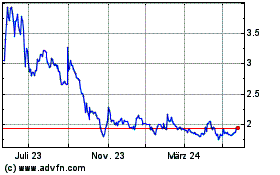
Global Bioenergies (EU:ALGBE)
Historical Stock Chart
Von Jan 2024 bis Jan 2025
